Article

Numerical Study on an Airflow Field of a Reticle Stocker with a Moving Crane in a Mini-Environment

1
Department of Mechanical Engineering, Kun Shan University, Tainan 71070, Taiwan
2
Department of Mechanical Engineering, Ming Chi University of Technology, New Taipei 24301, Taiwan
3
Department of Energy and Refrigerating Air-Conditioning Engineering, National Taipei University of Technology, Taipei 10608, Taiwan
*
Authors to whom correspondence should be addressed.
Atmosphere 2017, 8(1), 23; https://doi.org/10.3390/atmos8010023
Submission received: 17 November 2016 / Revised: 13 January 2017 / Accepted: 18 January 2017 / Published: 21 January 2017

Abstract

:
This study numerically investigates the effects of a moving crane and airflow on contaminant removal efficiency of various reticle box coverage sequences in a stocker. The analyzed characteristics of flow patterns are used to protect the reticles from contaminants, without altering their internal component configuration in conjunction with the aim of cost-savings. A finite volume method was applied in a numerical analysis using computational fluid dynamics software, ANSYS Fluent. To simulate actual operating conditions, the effects of inlet velocity of clean air and crane movement speed on contaminant removal efficiency (CRE) are considered, and a particle release technique is analyzed to determine contaminant concentrations in the stocker. The results show that a higher airflow rate leads to a better contaminant removal efficiency in the stocker. For the various arrangements of reticle boxes in the stocker, the symmetric coverage sequence provides the most satisfactory contaminant removal rate. An optimal inlet airflow velocity of 0.12 m/s is obtained based on the CRE distribution. In addition, the airflow distributions indicate that a vortex is induced by the air flow through a solid boundary; thus, a higher inlet airflow velocity results in a small vortex that also benefits the CRE. The results also demonstrate that a high crane movement speed causes a large reverse flow region at the bottom that also induces a long wake behind the crane, into which particles are easily drawn.

1. Introduction

In recent years, the high-tech manufacturing industry has been overwhelmed by the rapid advances in technology. Low contamination processing and high yield rates have become crucial issues in semiconductor, bio-tech, and pharmaceutical companies. Therefore, clean rooms play a major role due to severe environment regulations. In particular, products of extremely small dimensions are required and need to be manufactured with high accuracy in a clean room with a high degree of standards. Clean rooms are large enclosures where the air purity is maintained to a required (or designed) level by using high air exchange rates. Obtaining a high degree of cleanliness in such large volumes using air circulation and ventilation devices results in high operating expenses [1,2]. Therefore, manufacturers are much more interested in mini-environments, which are small spaces designed to deliver a localized clean air flow around sensitive products [3]. To reduce the possibility of contaminants, a mini-environment enclosure has been developed to effectively control residual particles. This enclosure isolates the stocker in a small area with highly purified air. This area may be equivalent to a class 1 clean room or higher, in comparison to the surrounding class 1000 or class 10,000 regions.
A reticle stocker is generally installed in a clean room or in a so-called mini- environment with a higher degree of cleanliness. A reticle stocker consists of a frame structure, filtration and ventilation systems, reticle boxes, and a moving crane that transfers the reticles to designated positions during operations. A moving crane, a reticle or photo-mask transportation system, or a so-called automatic guided vehicle (AGV) can move through the stocker to perform needed operations on a sequence of reticle boxes. To maintain the cleanliness of the reticle stocker, the flow of air must be uniform to prevent expanding or disturbing the environmental flow fields. Most of the contamination sources inside the stocker can be expelled by clean air but a few particles may be floating and trapped in the reverse flow regions. Particularly when the flow fields are agitated by a moving crane with various transfer speeds and air changes per hour (ACH) from the infiltration systems, contaminant control becomes a significant problem for manufacturing processes. It is thus necessary to investigate the characteristics of flow fields inside the stocker based on various moving crane speeds and inlet velocities of clean air. Although chemical vapors can be filtered by adding a fan filter unit (FFU), the filter efficacy is limited, and airborne molecular contaminants (AMCs) are the major target to be controlled. AMCs [4] have been described and categorized as acids, bases, condensable organisms, and dopants. Murakami et al. [5,6] conducted a numerical and experimental study of flow and contaminant diffusion fields affected by flow obstacles in a conventional-flow-type clean room. Their results showed that obstacles increased the complexity of the flow field and produced diffusing contaminants in a clean room. The concentration of contaminants increases and accumulates in the turbulent regions, and the design of distribution obstacles has no effect on the velocity field, but it is of great influence on the diffusing contaminant distributions.
Kanayama et al. [7,8] employed an upwind finite element method to compute the flow variation in a clean room caused by a moving AGV. The results showed that the downwash airflow could prevent the formation of a recirculation zone behind the AGV as it moved with accelerated, decelerated, and constant velocities. However, the AGV actually remained stationary in their studies. The motion of the AGV was simulated to alter the air flow velocities, which deviates from the real-world application. Using the Lagrangian-Eulerian approach coupled with a moving mesh, Yang et al. [9] investigated the characteristics of the induced flow behind a moving AGV. They found that particles appeared around the AGV and wafer carrier for two different AGV moving velocities and wafer carrier locations. Another study by Yang et al. [10] demonstrated that particle contaminants are of a significant concern owing to the movement of operators in a clean room. Lin et al. [11] investigated the flow patterns on maintaining the air quality for a thin-film-transistor liquid-crystal-display (TFT-LCD) panel delivery facility in a clean room. They reported that increasing the air velocity of the FFU can enhance the contaminant removal performance and suggested the moving velocity of the delivery facility should be at 0.16 m/s.
Hu et al. [12] conducted an experiment in a clean room to study the characteristics of its flow field. By applying an ultra-sonic air flow meter to measure three axial velocities, the index quantities are described by the velocity vector, turbulent intensity, and turbulent energy. Their results showed the non-uniformity in velocity and oblique angle to be 13% and 7.9°, respectively. The obstacles in a clean room can cause an increase in these two quantities. Thus, the upward and downward airflow near obstacles induce vortices in the clean room, which results in the expansion of the diffuse contaminants. Noh et al. [13] applied a computational fluid dynamic (CFD) method to the airflow and dynamic cross-contamination in a clean room for a photolithography process. It showed that the uniformity in the airflow is affected by the perforated raised-floor of a clean room as well as the regulating damper. Moreover, Chen et al. [14] presented numerical and experimental results to illustrate the dispersion of gas pollutants in an FFU clean room. A spectrometer was used to measure the concentrated distribution of contaminants, and the results indicated that the concentrated contaminant is determined by its released time and external airflow. A longer release time caused a higher concentration of contaminants, but more external air caused a lower concentration of contaminants. The detailed characteristics of a flow field and particle transport induced by the interaction between downwash air flow and a moving object in mini-environments was studied by Tsao et al. [15] with the help of experiments. Hu et al. [16] proposed a fan dry coil unit (FDCU) system and compared its contaminant removal performance with a conventional wall-return ventilation system in a cleanroom. Their experimental results demonstrated that the FDCU-return system removed about 60% more particles from the cleanroom, compared to the conventional system.
Depending on the cleanliness of a clean room, the conventional manpower used in operating and transporting tasks is gradually being replaced by the use of the automatic machines. Meanwhile, as the airflow direction in a clean room shifts from conventional non-single to single or complex flow types, a standard mechanical interface with a completely isolated type should be developed. The residual contaminants inside the clean room become a cause for concern. However, research that analyzes and investigates the transient simulation of airflow around moving obstacles is relatively rare. In this study, a numerical simulation is used to analyze the unsteady flow fields of a stocker with a moving crane (at different speeds) in a clean room. The contaminant removal rate is also examined by varying inlet velocities of clean air and adjusting the reticles coverage in sequences in the stocker. The characteristics of reticle stocker flow fields and the particle distributions are investigated under different conditions.

2. Methodology

2.1. Mathematical Models

Fluent, a commercial CFD software, was used in this study. It is based on the finite volume method and an implicit scheme to adapt the Gauss-Seidel linear function and an algebraic multi-grid technique to solve non-structural mesh problems. Several assumptions are made in this study, including incompressible flow, constant flow properties, and a transient flow field in the stocker. In addition, the semi-implicit pressure linked equation (SIMPLE) algorithm [17] and the re-normalization group (RNG) k-ε model were applied to solve the turbulent flow. Compared to other turbulence models, the RNG k-ε model was shown to deliver the best performance in terms of accuracy, computing efficiency, and robustness for modeling indoor environments [18]. Jones and Launder [19] proposed the standard k-ε model, which is the most well-known, but it is only adequate for a fully turbulent flow, because the formula was obtained from semi-experience models and neglected molecular viscosity effects. However, the model has been applied on many different turbulent flow fields, and the numerical results indicate that they have several advantages such as acceptable accuracy, simplicity, and economy. In general, the SIMPLE method was chosen to solve a steady, incompressible, parabolic Navier-Stokes equation in numerical computations as proposed by Patankar and Spalding [20].
To simulate the transient turbulence flow, the governing equations include the continuity equation, momentum equation, and turbulent kinetic energy and dissipation rate equations. After applying the assumptions (i.e., X–Y–Z coordinate system, uncompressible flow, homogeneous properties of fluid, neglecting thermal buoyancy and gravity effects, and the use of the k-ε model), a generalized equation can be derived to represent a transport equation:
t ( ρ ϕ ) + ( ρ V ϕ Γ ϕ ϕ ) = S ϕ
where ρ is the fluid density, V is the velocity, ϕ stands for the variables for different transport equations, and Γ ϕ and S ϕ are the diffusion coefficient and source term, respectively. All the properties vary with time and direction in the turbulent flow. They will be bounded in an average value region with a rapidly irregular fluctuation. Thus, the theoretical analysis of turbulent flow can assume that a short amount of time is equal to the summation of a time-averaged portion and a perturbation portion.
An image of the stocker used in this study is shown in Figure 1a, and it has dimensions of 2.18 m (length) × 1.975 m (width) × 3.308 m (height). The stocker contains several reticle boxes. The size of a reticle box is 0.180 m × 0.170 m × 0.045 m, and that of the automatic transport device for the boxes is 0.250 m × 0.250 m × 0.20 m. The automatic transport device passes through the stocker along the Z axis at 0.9875 m. The CFD model is built with the same geometry of the stocker, and it is shown in Figure 1b. The supply air is provided by an air-blower to draw out the clean room air and then send it to the left- and right-hand side of the reticle stocker through the inlets. The air passes through a high-efficiency particle air (HEPA) filter and flows uniformly through every reticle box to the outlet, which is under the perforated raised-floor. In this study, three different inlet airflow velocities, 0.08 m/s, 0.12 m/s, and 0.16 m/s, were used on both sides of an air-blower to simulate the flow field of a stocker. Each velocity corresponds to the ACH of 26, 40, and 53, respectively. In addition, a moving crane, which would cause the particle contaminant in the stocker, at three different speeds (0.3, 0.4, and 0.6 m/s) as moving toward the Y axis was investigated. The perforated raised-floor has a thickness of 0.1 m, a grille design, and an open area ratio of 36%.
As mentioned earlier, air is provided from the clean room, passed through the HEPA filter, and then sent into the stocker. The inlet boundary condition can be assumed to have a uniform velocity of the air. The outlet position is below the perforated raised-floor at 0.49 m above the floor. In an actual clean room, the pressure is controlled to maintain a state of slightly positive pressure with respect to the atmospheric pressure. The air flow along the solid wall is assumed to be at a no-slip condition; meanwhile, the velocity vector is equal to zero, and the flux perpendicular to the solid walls is k / n = ε / n = C / n = 0 . In the present study, the temperature effects are neglected, and adiabatic conditions are considered for the solid walls. The perforated raised-floor employs porous materials to simulate the pressure drop when the flow is passing through it. The open area ratio of the floor to be considered for the pressure difference can be obtained from a porous material model and by adjusting the values of the parameters C2 and a. The pressure difference is as shown below.
Δ P = C 2 1 2 ρ v i 2 Δ m
where a is the open area ratio, v represents the velocity of a fluid that passes perpendicular through the media surface, vi is the relative velocity of fluid that passes perpendicular through the porous material surface, Δ m is the thickness of the porous materials, and C2 indicates a pressure drop coefficient.

2.2. Independence Analysis

A finer mesh usually provides greater accuracy in numerical computation results but also consumes more of a CPU’s resource and calculating time. The testing grid independence is necessary in order to find an appropriate grid size when performing the numerical analysis. The main objective was to simulate the air flow through a reticle stocker in this research, and hence, we employed the velocity as an index for the independent tests. A total of twenty points at positions designated in the unsteady flow field were monitored. The positions were selected for X = 0.85 m, and Z = 1.6 m, with a Y-coordinate divided equally from 0.5 m to 3.3 m. Figure 2a,b represents the monitoring positions for different projecting planes. Four different mesh numbers (i.e., 641,412; 987,618; 1,163,992; and 1,348,660 cells) were verified.
A grid independence test result showing dimensionless velocities is shown in Figure 3, where the test conditions were Vin = 0.16 m/s, and the total length is Y0 = 3.31 m. The result indicates an optimal grid size of 1,163,992, which was applied to the numerical simulation in this study. After verifying the independence of the grid, a contaminated leakage was also needed to investigate the transient contamination concentration level inside the clean room. C6H6 was used as the contaminant for the numerical analyses. A leakage time of 1 was is preset, and the leakage concentration also equaled one after it was made dimensionless. Thus, the iteration time step was also verified so that converged solutions could be obtained for the transient numerical computational procedure. A monitoring position in the reticle stocker was assigned, as shown in Figure 2a,b. Several different time steps 0.05, 0.1, 0.5, and 1.0 s were chosen for the error analysis. Figure 4a indicates the variations in the concentrations based on the mass fractions of C6H6, and Figure 4b presents the velocities with respect to the time variations; both results show a small discrepancy. In particular, the differences of the simulated results using the time step of 0.1 s and 0.05 s were negligibly small (relative difference < 0.1%). Therefore, the time step used was 0.1 s. Because the characteristics of the transient flow field were categorized as a finite moving boundary problem, the finite volume cooperating with dynamic meshes was further applied for numerical solutions.

2.3. Contaminant Removable Efficiency (CRE)

An arbitrary point on a reticle box is monitored to observe the variation in contaminants, but it is difficult to describe how extensively contaminants will be affected by airflow in a stocker. To evaluate whether or not contaminants in a region are efficiently removed, a contaminant removable efficiency (CRE) is defined as follows
CRE = ( C R C su ) / ( C C su )
where C is an arbitrary point of concentration, Csu represents the concentration in front of the air blower, and CR is the concentration of the return air. When the CRE is greater than 1, it indicates that the region has no contaminants. On the other hand, the region is contaminated if the CRE is less than 1. Because a transient CRE is difficult to measure, the distribution of released contaminants was examined at a steady state condition. Figure 1b indicates the release position of the contaminant and the location of monitored cross sections at Y = 1.34 m, Y = 2 m, and Z = 2.3 m.
In this numerical simulation, contaminants were assumed to come from one of the reticle boxes and the bottom of the moving crane. The effect of contaminant particles was numerically analyzed owing to different inlet airflow velocities; the moving crane was projected to move with a constant speed. Additionally, the characteristics of the convective flow field and the CRE were examined assuming different speeds of crane movement. One reason for the use of a stocker in a clean room is to transfer product, and this is usually done by an automatically moving a crane. Workers themselves are a source of contamination; human bodies and movements provoke dust or cause accidental problems. Consequently, automatic devices are used instead of workers to both increase the yield and avoid contaminants. Obstacles combined with motion in the clean room would hamper the smooth flow of air; as a result, particles are drawn into a vortex, thereby contaminating processes or products.

3. Results and Discussion

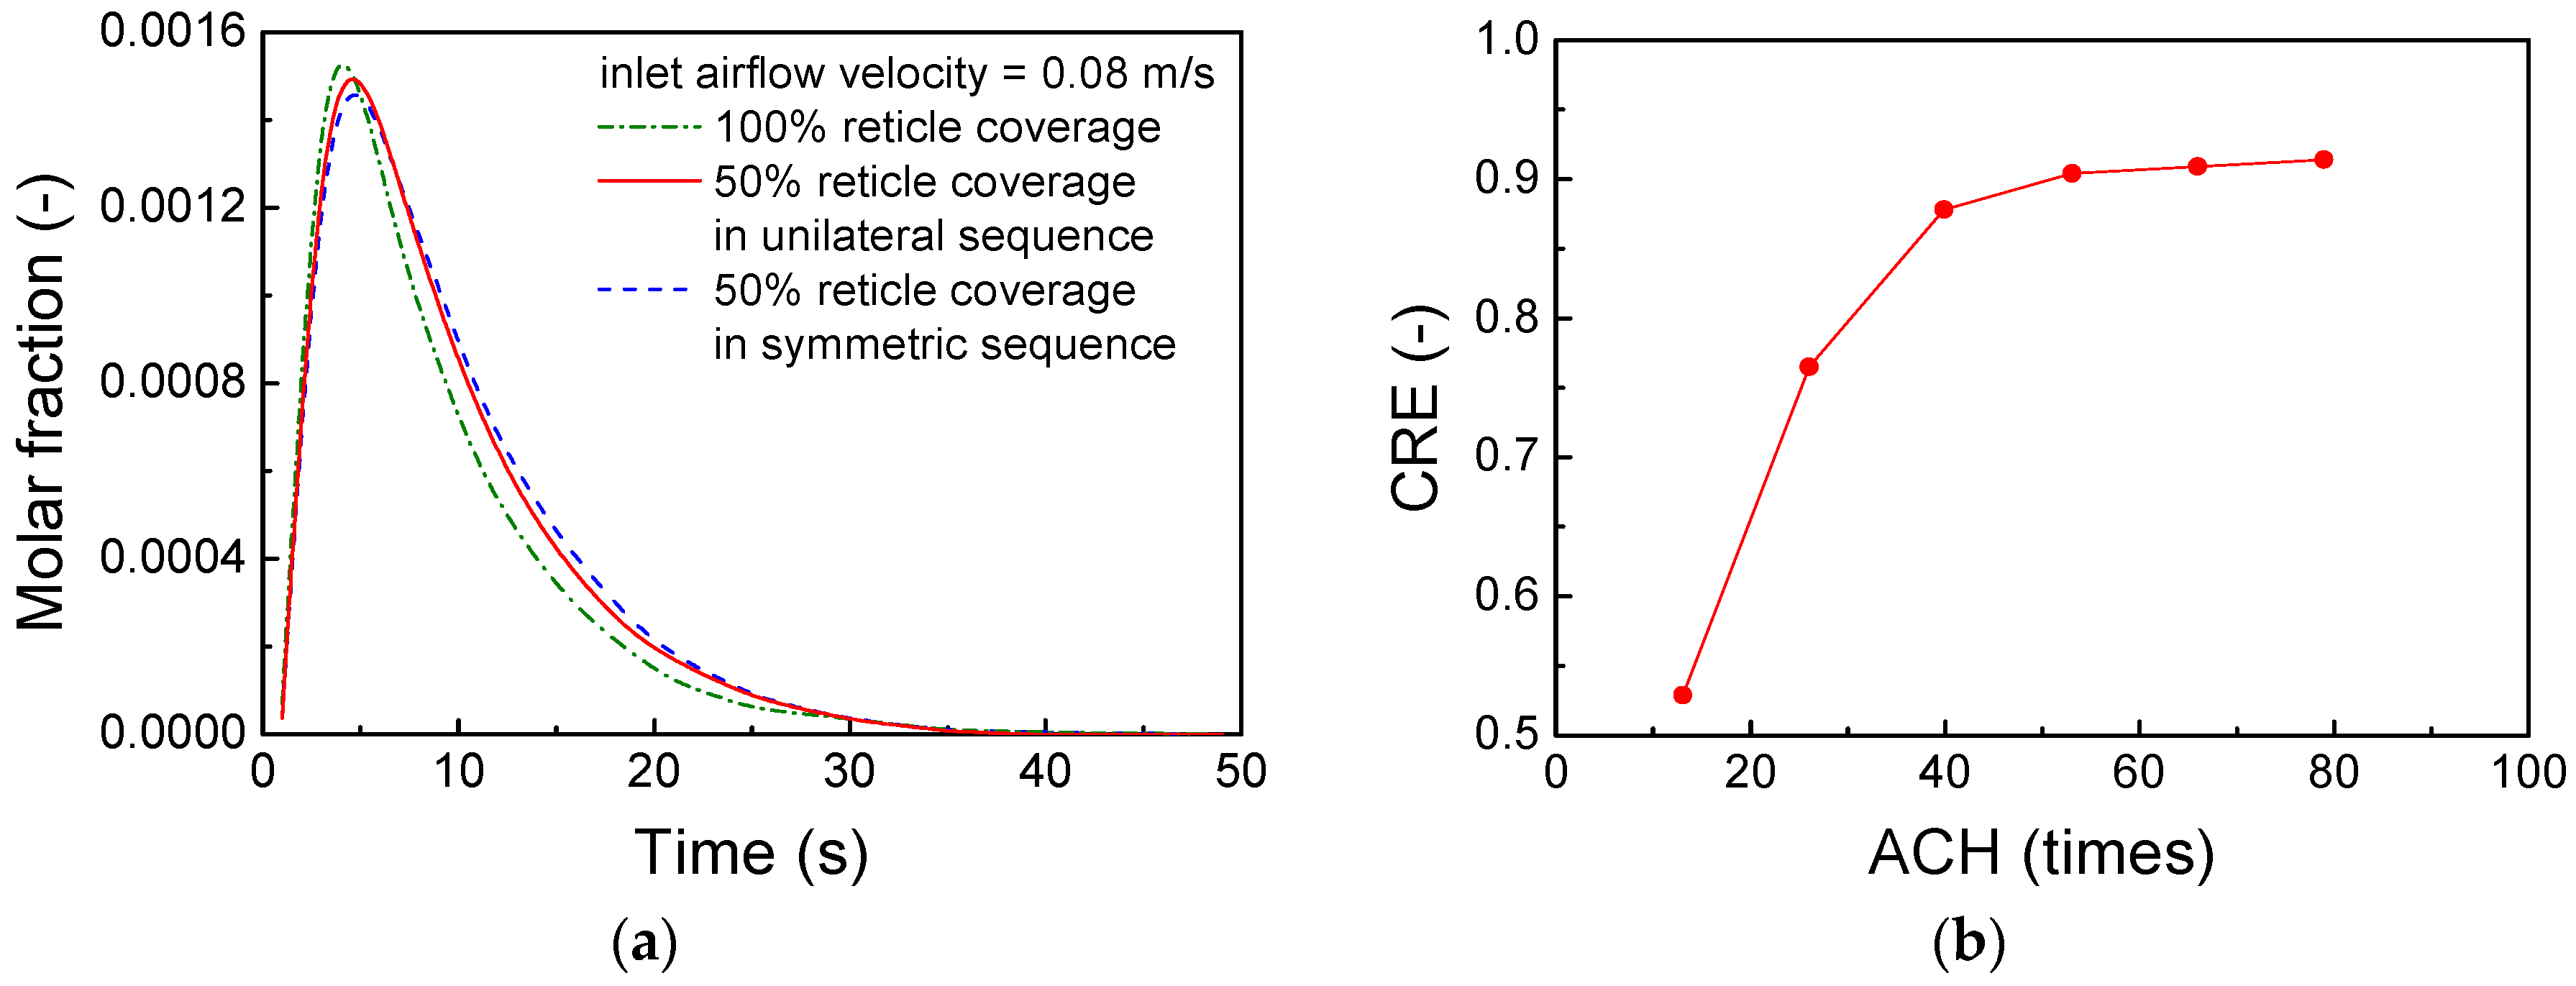
In the present study, three types of reticle arrangement positions were studied when the inlet airflow velocity was set to 0.08 m/s: (a) 100% reticle coverage; (b) 50% reticle coverage in symmetric sequence where half were placed from the left- and right-hand side of the stocker; and (c) 50% reticle coverage in unilateral sequence. The evolution of the contaminant concentration is shown in Figure 5a. The results indicate that the molar concentrations of the contaminant increased rapidly after releasing the contaminant (at t = 1 s) and reached its maximum value (about 0.0015) at about t = 5 s. However, after reaching the maximum molar concentration, the contaminant concentrations decreased dramatically until approaching the constant value of about zero degree for the three studied cases. This indicates that the CREs for different cases are similar after 25 s. In addition, the stocker was not fully filled with reticles for the practical application; thus, a symmetric arrangement has a better CRE (i.e., with the small value of the maximum molar fraction) than the unilateral case when the boxes are transferred during the processes. However, it is evident that the difference in the contaminant concentration for both cases of symmetric and unilateral sequences was quite small. In the rest of the studied cases, the geometric arrangement was employed. Figure 5b presents the CRE as a function of the ACH. The results show that the CRE significantly improved (i.e., a contaminant region was reduced) by increasing the ACH, especially under the small ACH conditions. For example, the CRE increased rapidly from 0.53 to 0.88 as the ACH increased from 13 to 40. However, when the ACH was greater than 40 (corresponding to an inlet airflow velocity of 0.12 m/s), the CRE changed insignificantly, indicating that the reticle boxes were not a major cause of contamination. Specifically, the CRE increased by only 3% (from 0.88 to 0.91) while the ACH increased from 40 to 80; however, the operating cost of the HEPA would increase significantly. This result indicates that a minimum contaminant region can be achieved at a given ACH of 40.
Figure 6 shows the evolution of airflow distributions in the X–Y cross section while the crane moved along the 
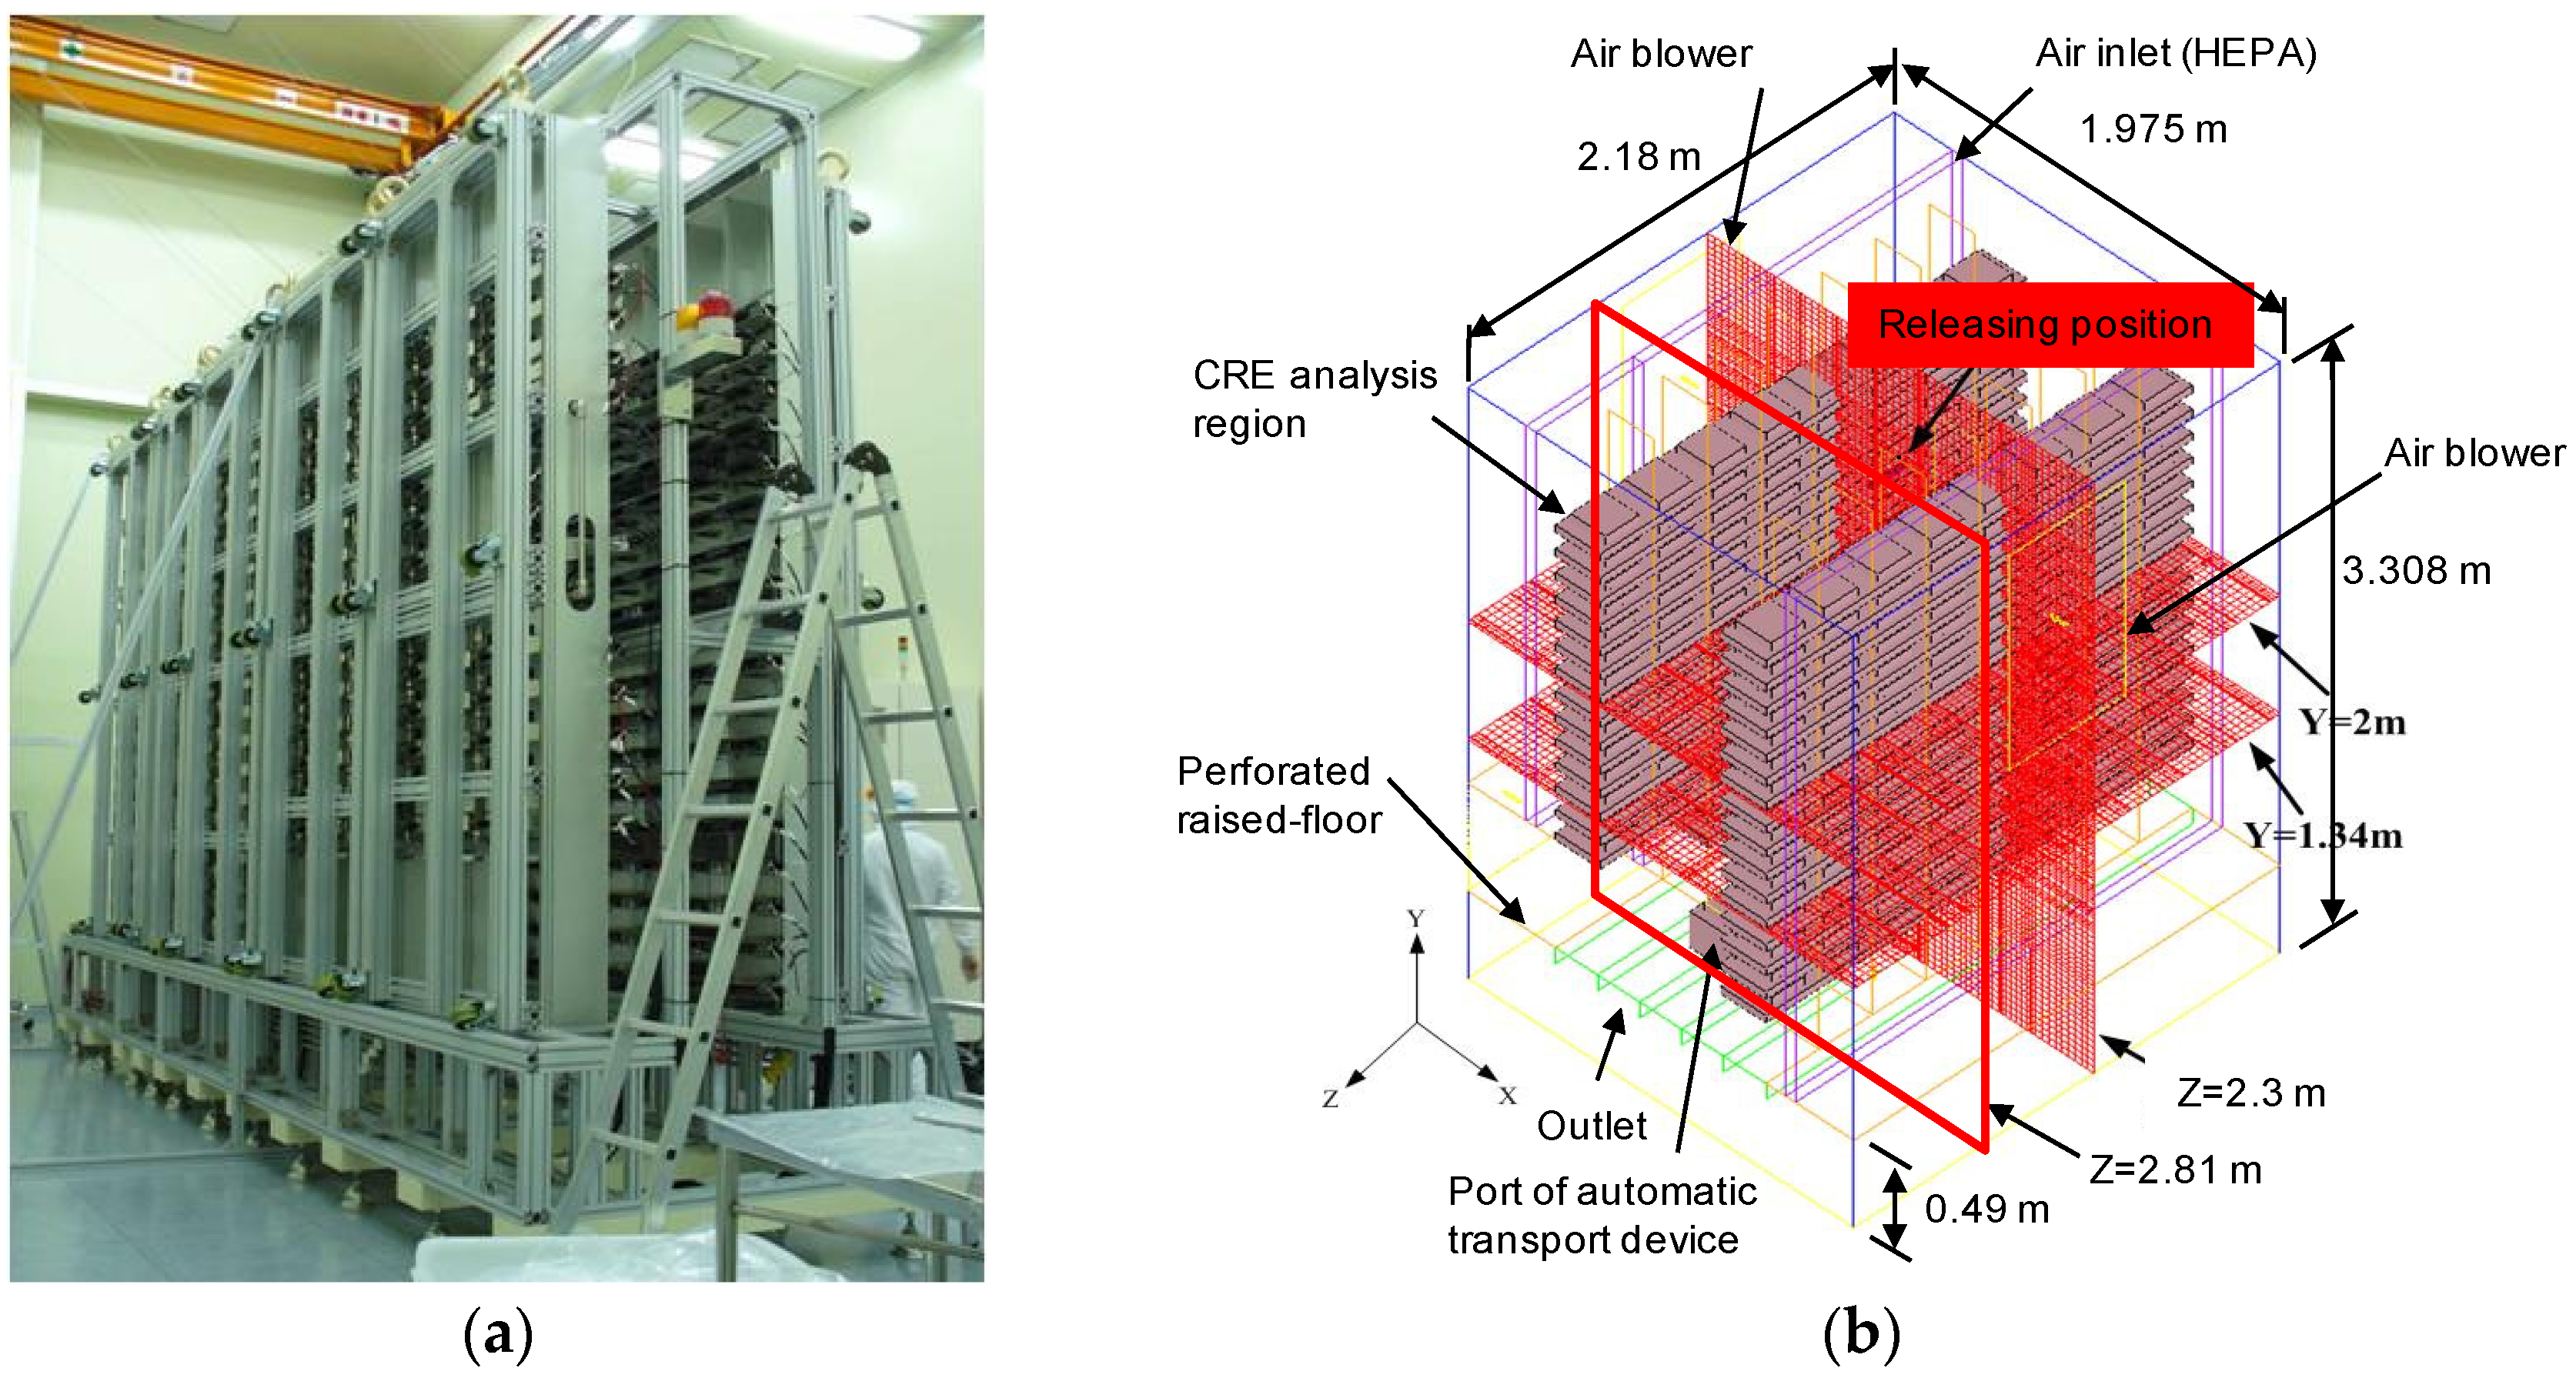
Y axis at different locations. In this case, the crane’s velocity was set to be 0.4 m/s; the inlet airflow velocities of (a) 0.08 m/s, (b) 0.12 m/s, and (c) 0.16 m/s were applied for the transient numerical simulation. An observation plane was at Z = 2.81 m, as indicated in Figure 1b. Figure 6 indicates that when airflow above the crane was driven and moved upward, the compressed air was immediately expelled by the convective air at the bottom of the stocker. Thus, contaminants were not allowed to remain in those regions. Because of the low pressure at the bottom of the stocker, vortices were generated, circulating air in the nearby regions. As the inlet airflow velocity increased, inertia would be expected to increase and viscosity would be forced to decrease. The space on both sides of the vortex was compressed to a narrow pathway; therefore, the probability of drawing contaminants into the stocker became very small.
To investigate the distribution of the released particle in the stocker, it is assumed that particles were induced by the crane moving along the Y axis. At different inlet airflow velocities, the crane was assumed to move vertically at 0.4 m/s along the Y axis; at a predetermined time, 10,000 particles with a diameter of 0.01 μm were released from the bottom at the position Y = 0.68 m. The particle release position is shown in Figure 2b. 
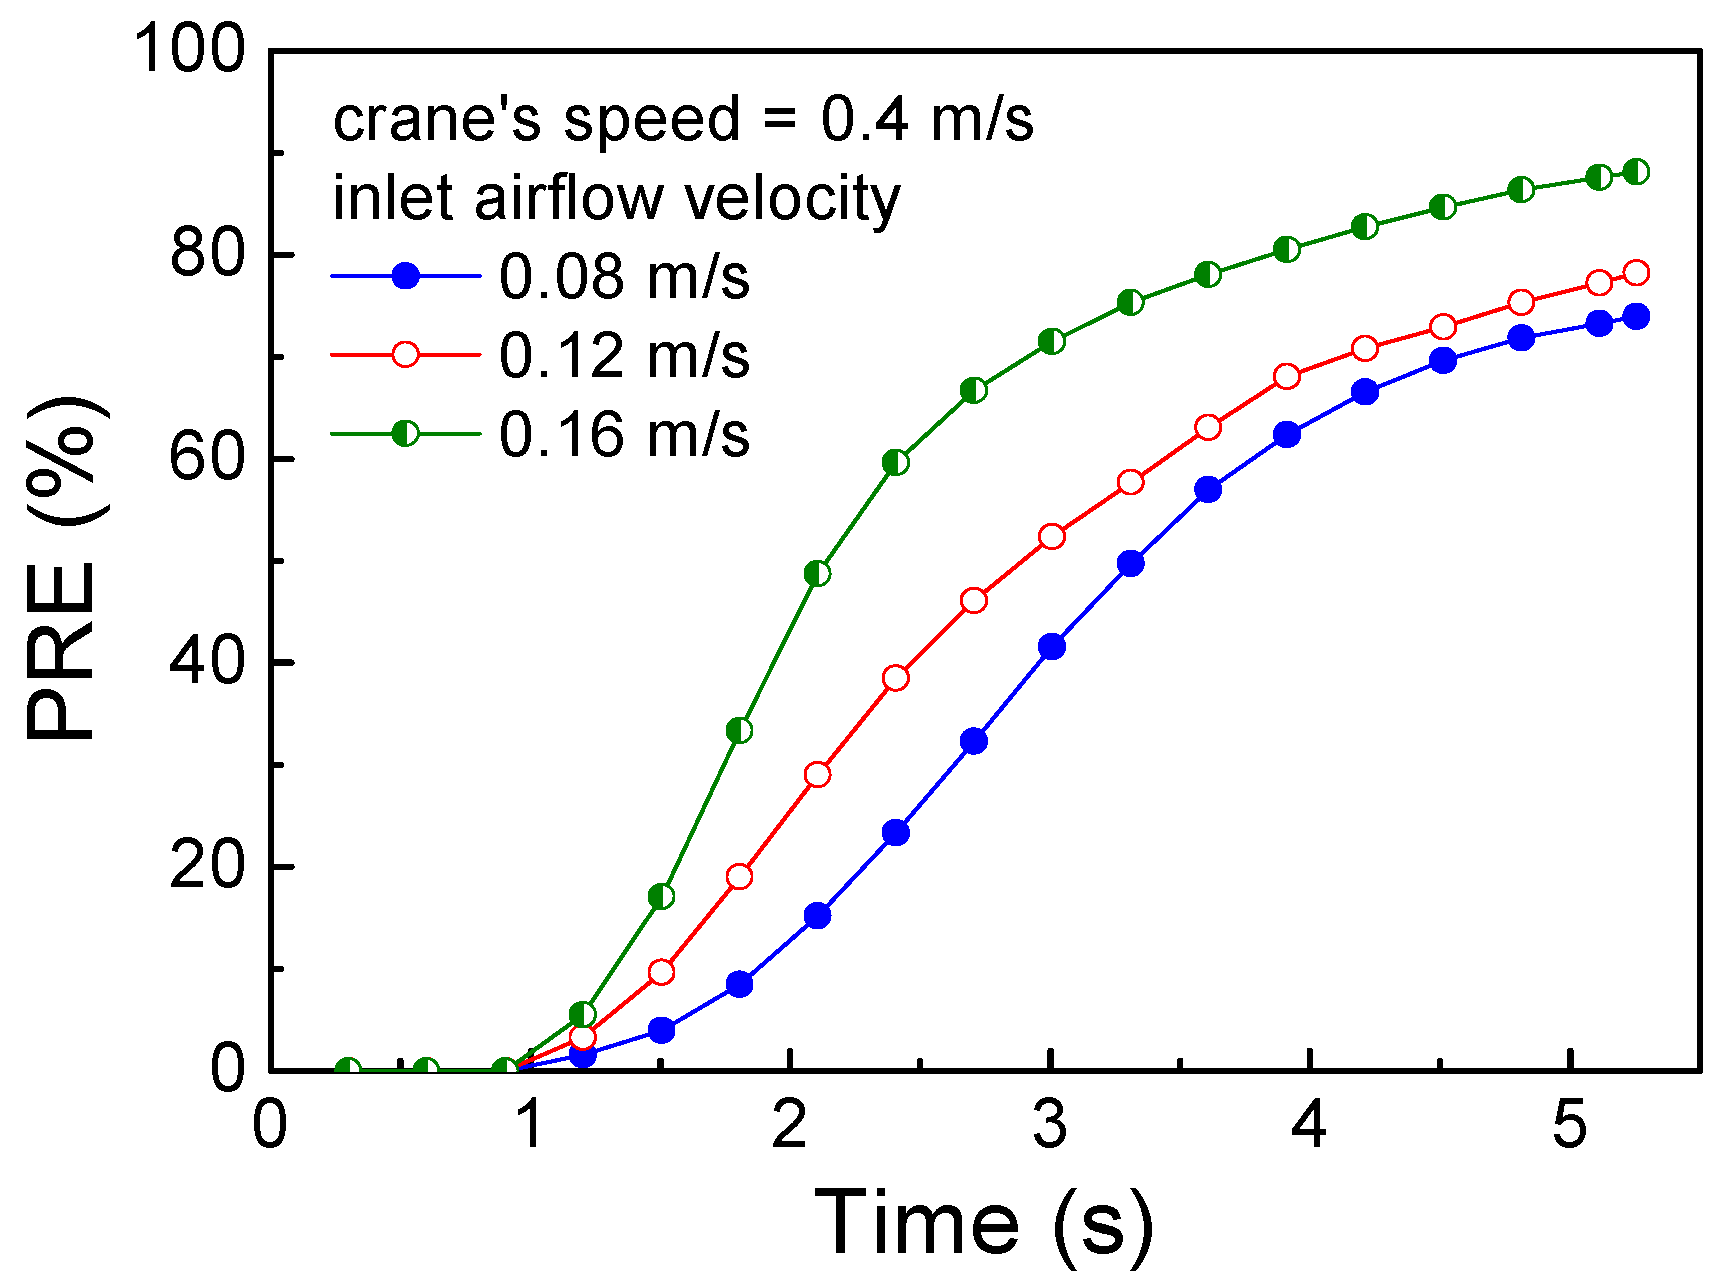
Figure 7 shows the manner in which the particle removal efficiency (PRE) varied with time when the crane speed was at 0.4 m/s and when the inlet airflow velocity varied from 0.08 to 0.16 m/s. Here, the PRE is defined as follows
PRE = ( 1 n p / n 0 ) × 100 %
where n0 is the initial number of the particles in the stocker, and np stands for the number of the particles that are still in the stocker. Figure 7 shows that the PREs increased rapidly from t = 1 s to 3 s, and then increased gradually until approaching the constant level for the three studied conditions. In addition, the results clearly demonstrate that an increase in the inlet airflow velocity significantly accelerated the removal of contaminant particles. Specifically, the PRE approximated to 90% after 5 s when the inlet airflow velocity was 0.16 m/s. However, the PREs were only 74% and 78%, respectively, for the airflow with the velocity of 0.08 and 0.12 m/s. Regarding the effect of transient variations in particles and flow fields, the results demonstrate that a higher inlet airflow velocity led to a higher CRE (or PRE).
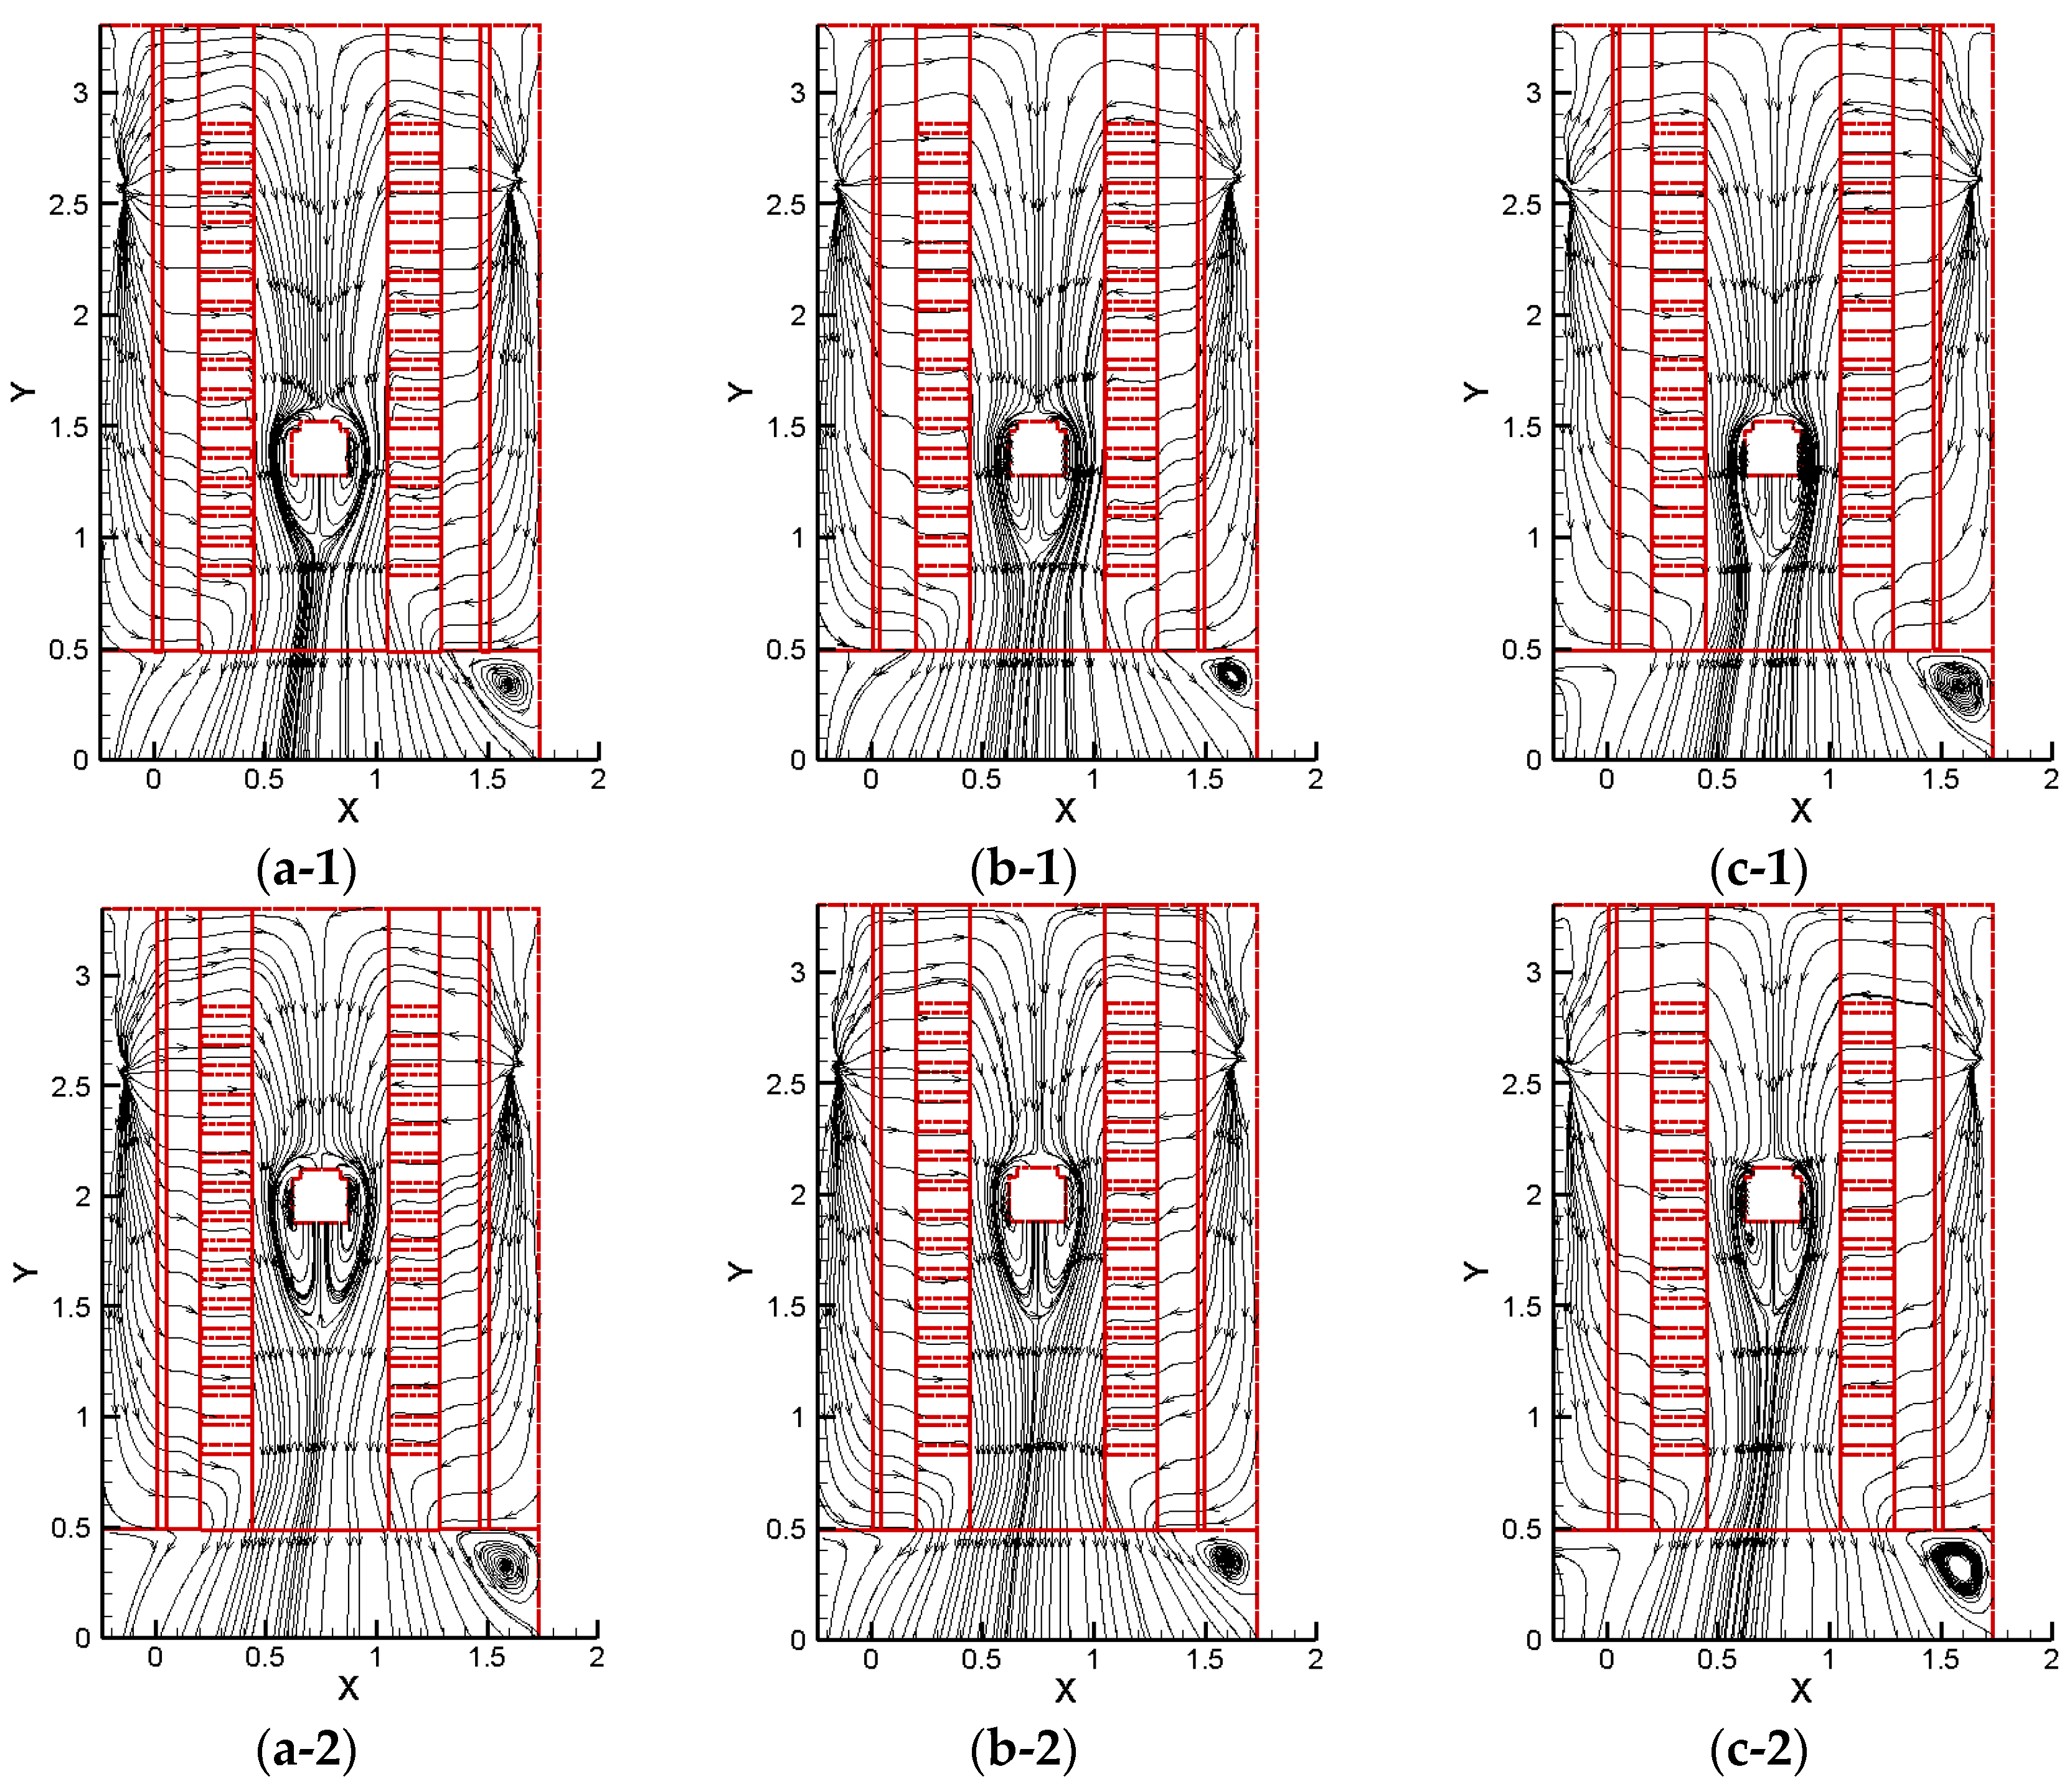
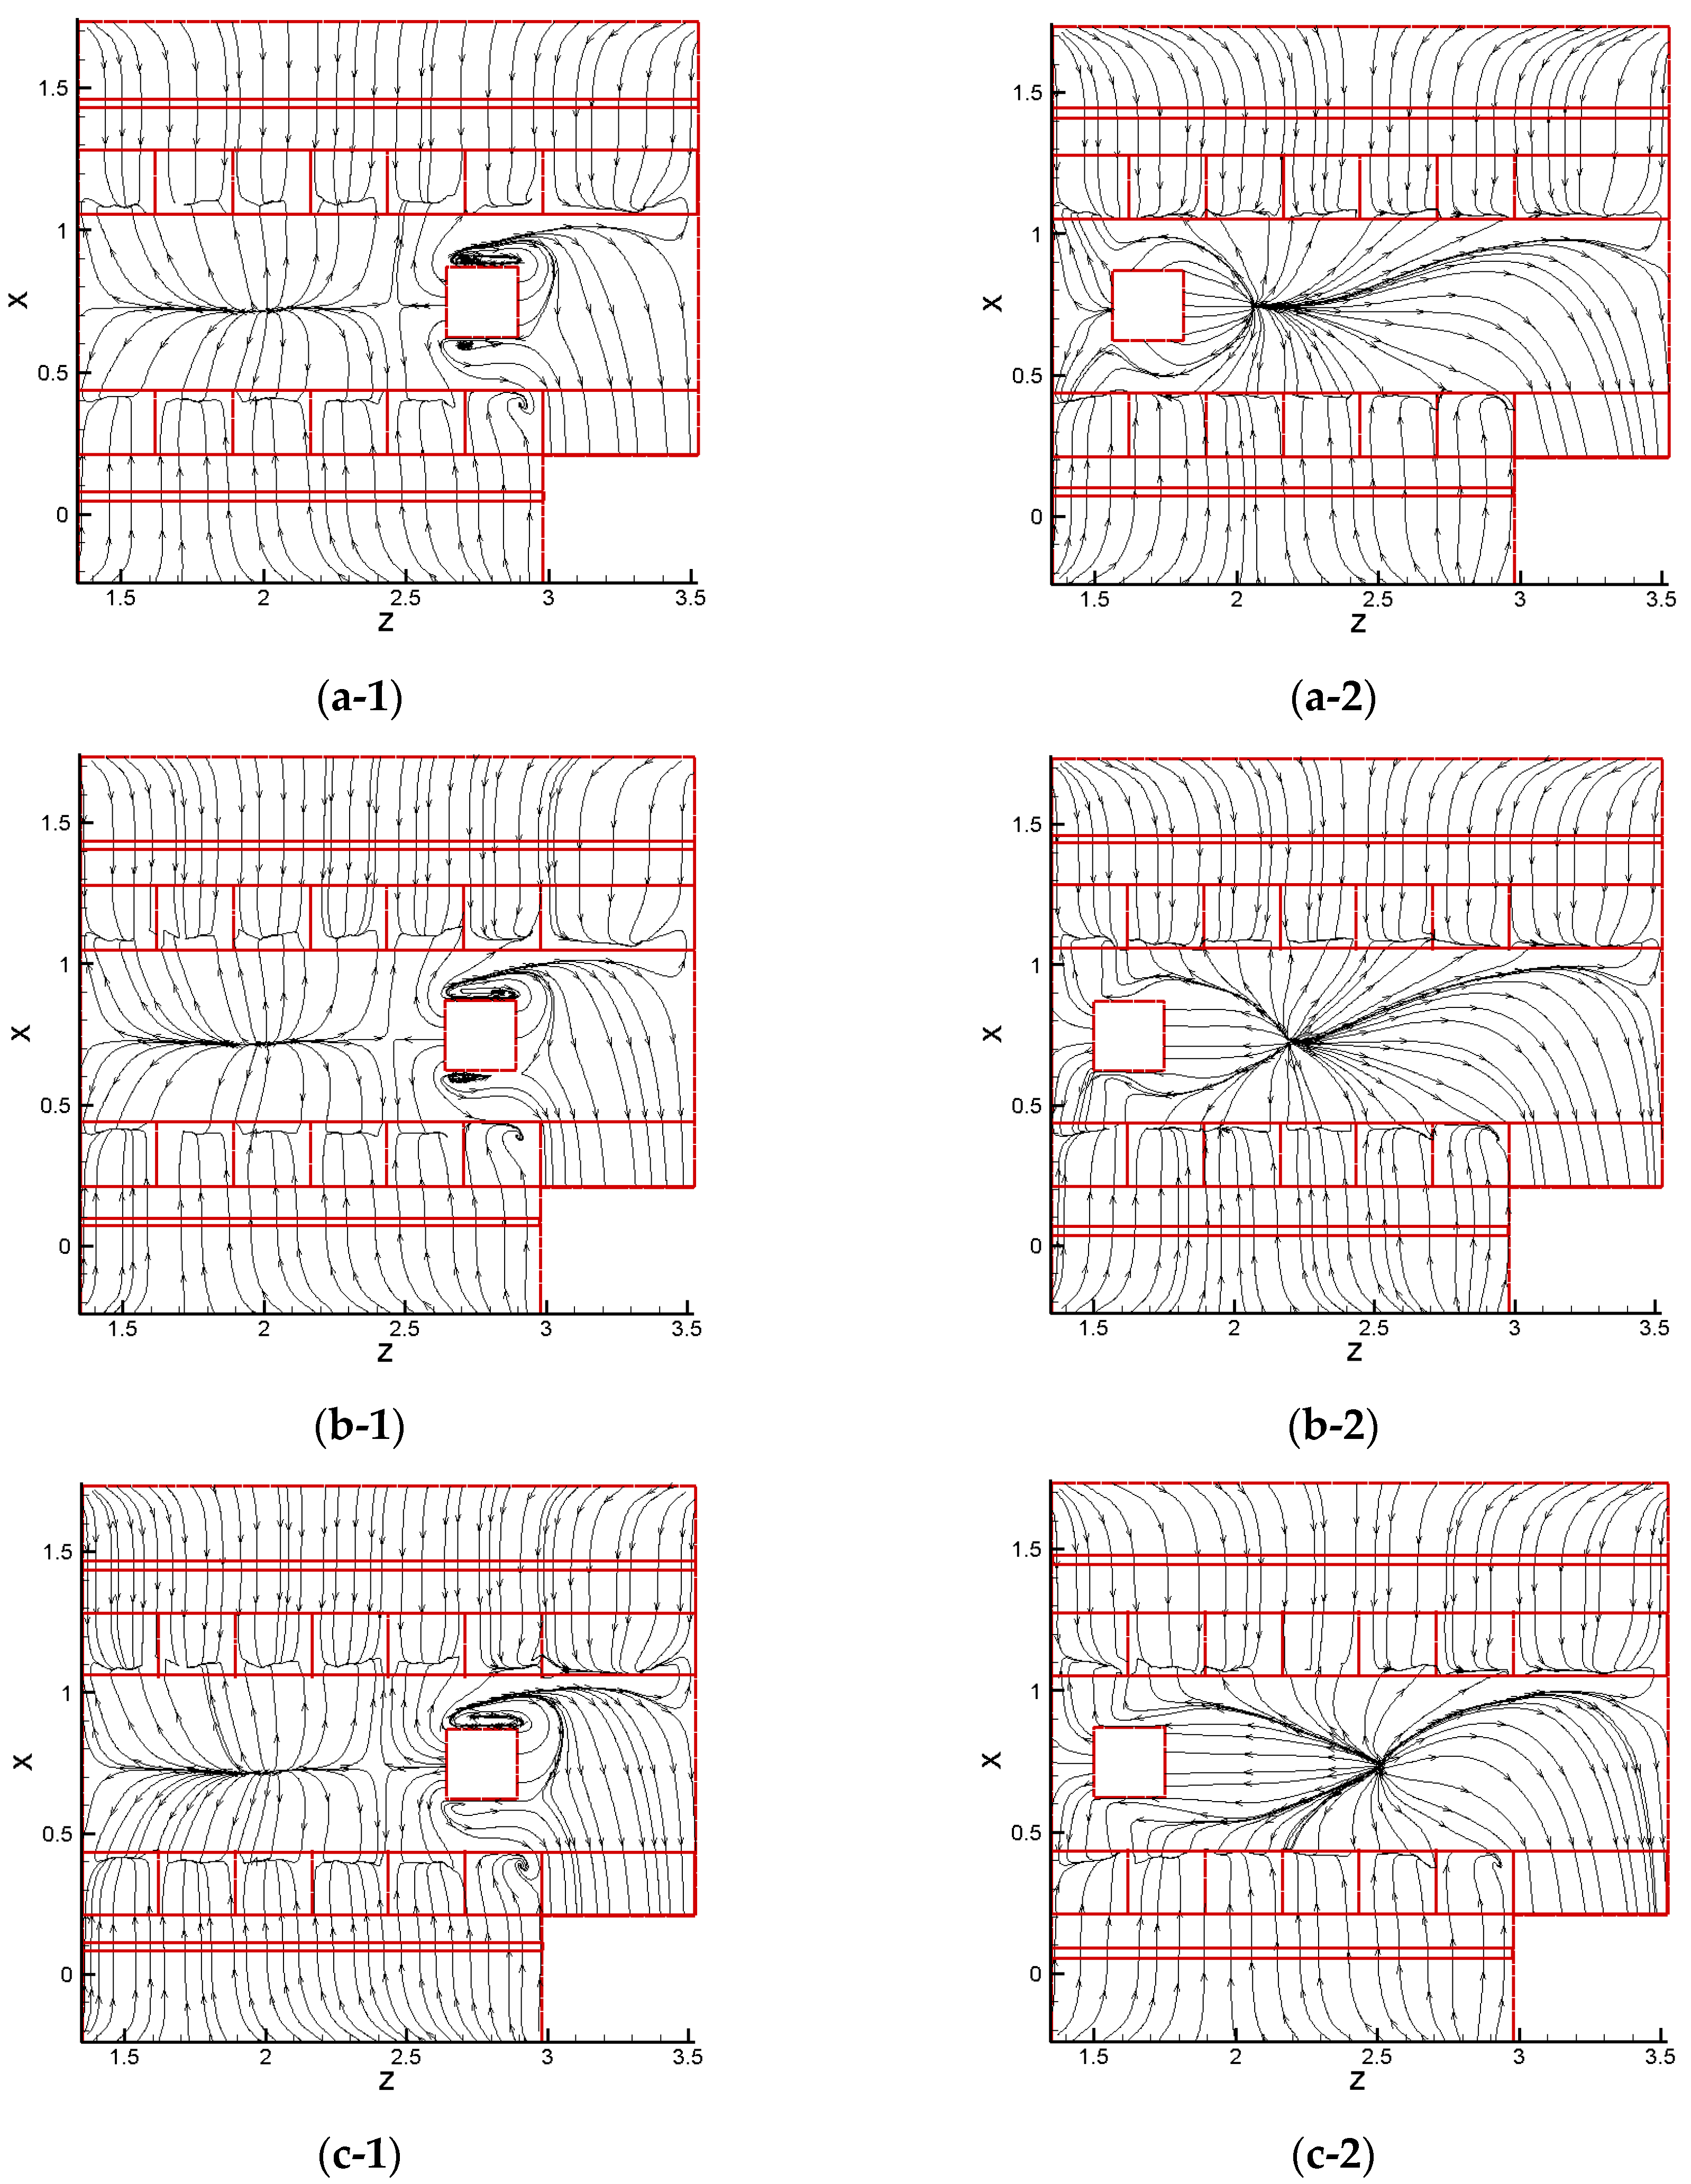
Figure 8 presents the evolution of airflow distributions in the X-Z cross section when the crane moved along the Z axis with a velocity of (a) 0.3 m/s; (b) 0.4 m/s; and (c) 0.6 m/s. The inlet airflow velocity was set to be 0.12 m/s for this studied case. The reticles were assumed to be arranged in symmetric sequences for this simulation. To observe the three-dimensional behavior of this simulation, the cross section at Y = 0.77 m was selected for examination. The crane’s position related to the X-Z cross section was also at Y = 0.77 m, which is a typical location of the crane and is very close to the perforated raised-floor (i.e., Y = 0.49 m). The crane moved along the Z axis (from Z = 2.81 to 0.06 m) with varying speeds. As can be seen in Figure 8, although the crane just starts to move, the front side of the fluid (ambient air) is compressed by the solid boundaries of the crane. The fluid is pushed forward to flow around the crane; therefore, the air flows around the back of the moving crane, resulting in vortices. Similarly, as stated in previous discussions, Figure 8(a-2–c-2) demonstrates that the flow rate was sufficient to fill the back space and surroundings of the moving crane; thus, vortices at the two sides of the crane disappeared. When the crane moved for 1.2 m along the Z axis while traveling at different velocities, the airflow behind it was drawn into the space to form a wake. It is also interesting to find that those streamlines in both the front and back region of the crane appeared to radiate, which is because the air supplied from the ceiling flowed downward in the beginning, and then outward while approaching the raised-floor. In such a scenario, there is a possibility that contaminants may be drawn into the flow field for which the airflow diagrams are shown in Figure 8(a-2–c-2). The results show that a higher crane speed creates a longer wake. As the speed increased from 0.3 to 0.6 m/s, the wake flow significantly extended from 2.1 to 2.6 m. Consequently, a fast-moving crane can easily draw contaminants into its wake.
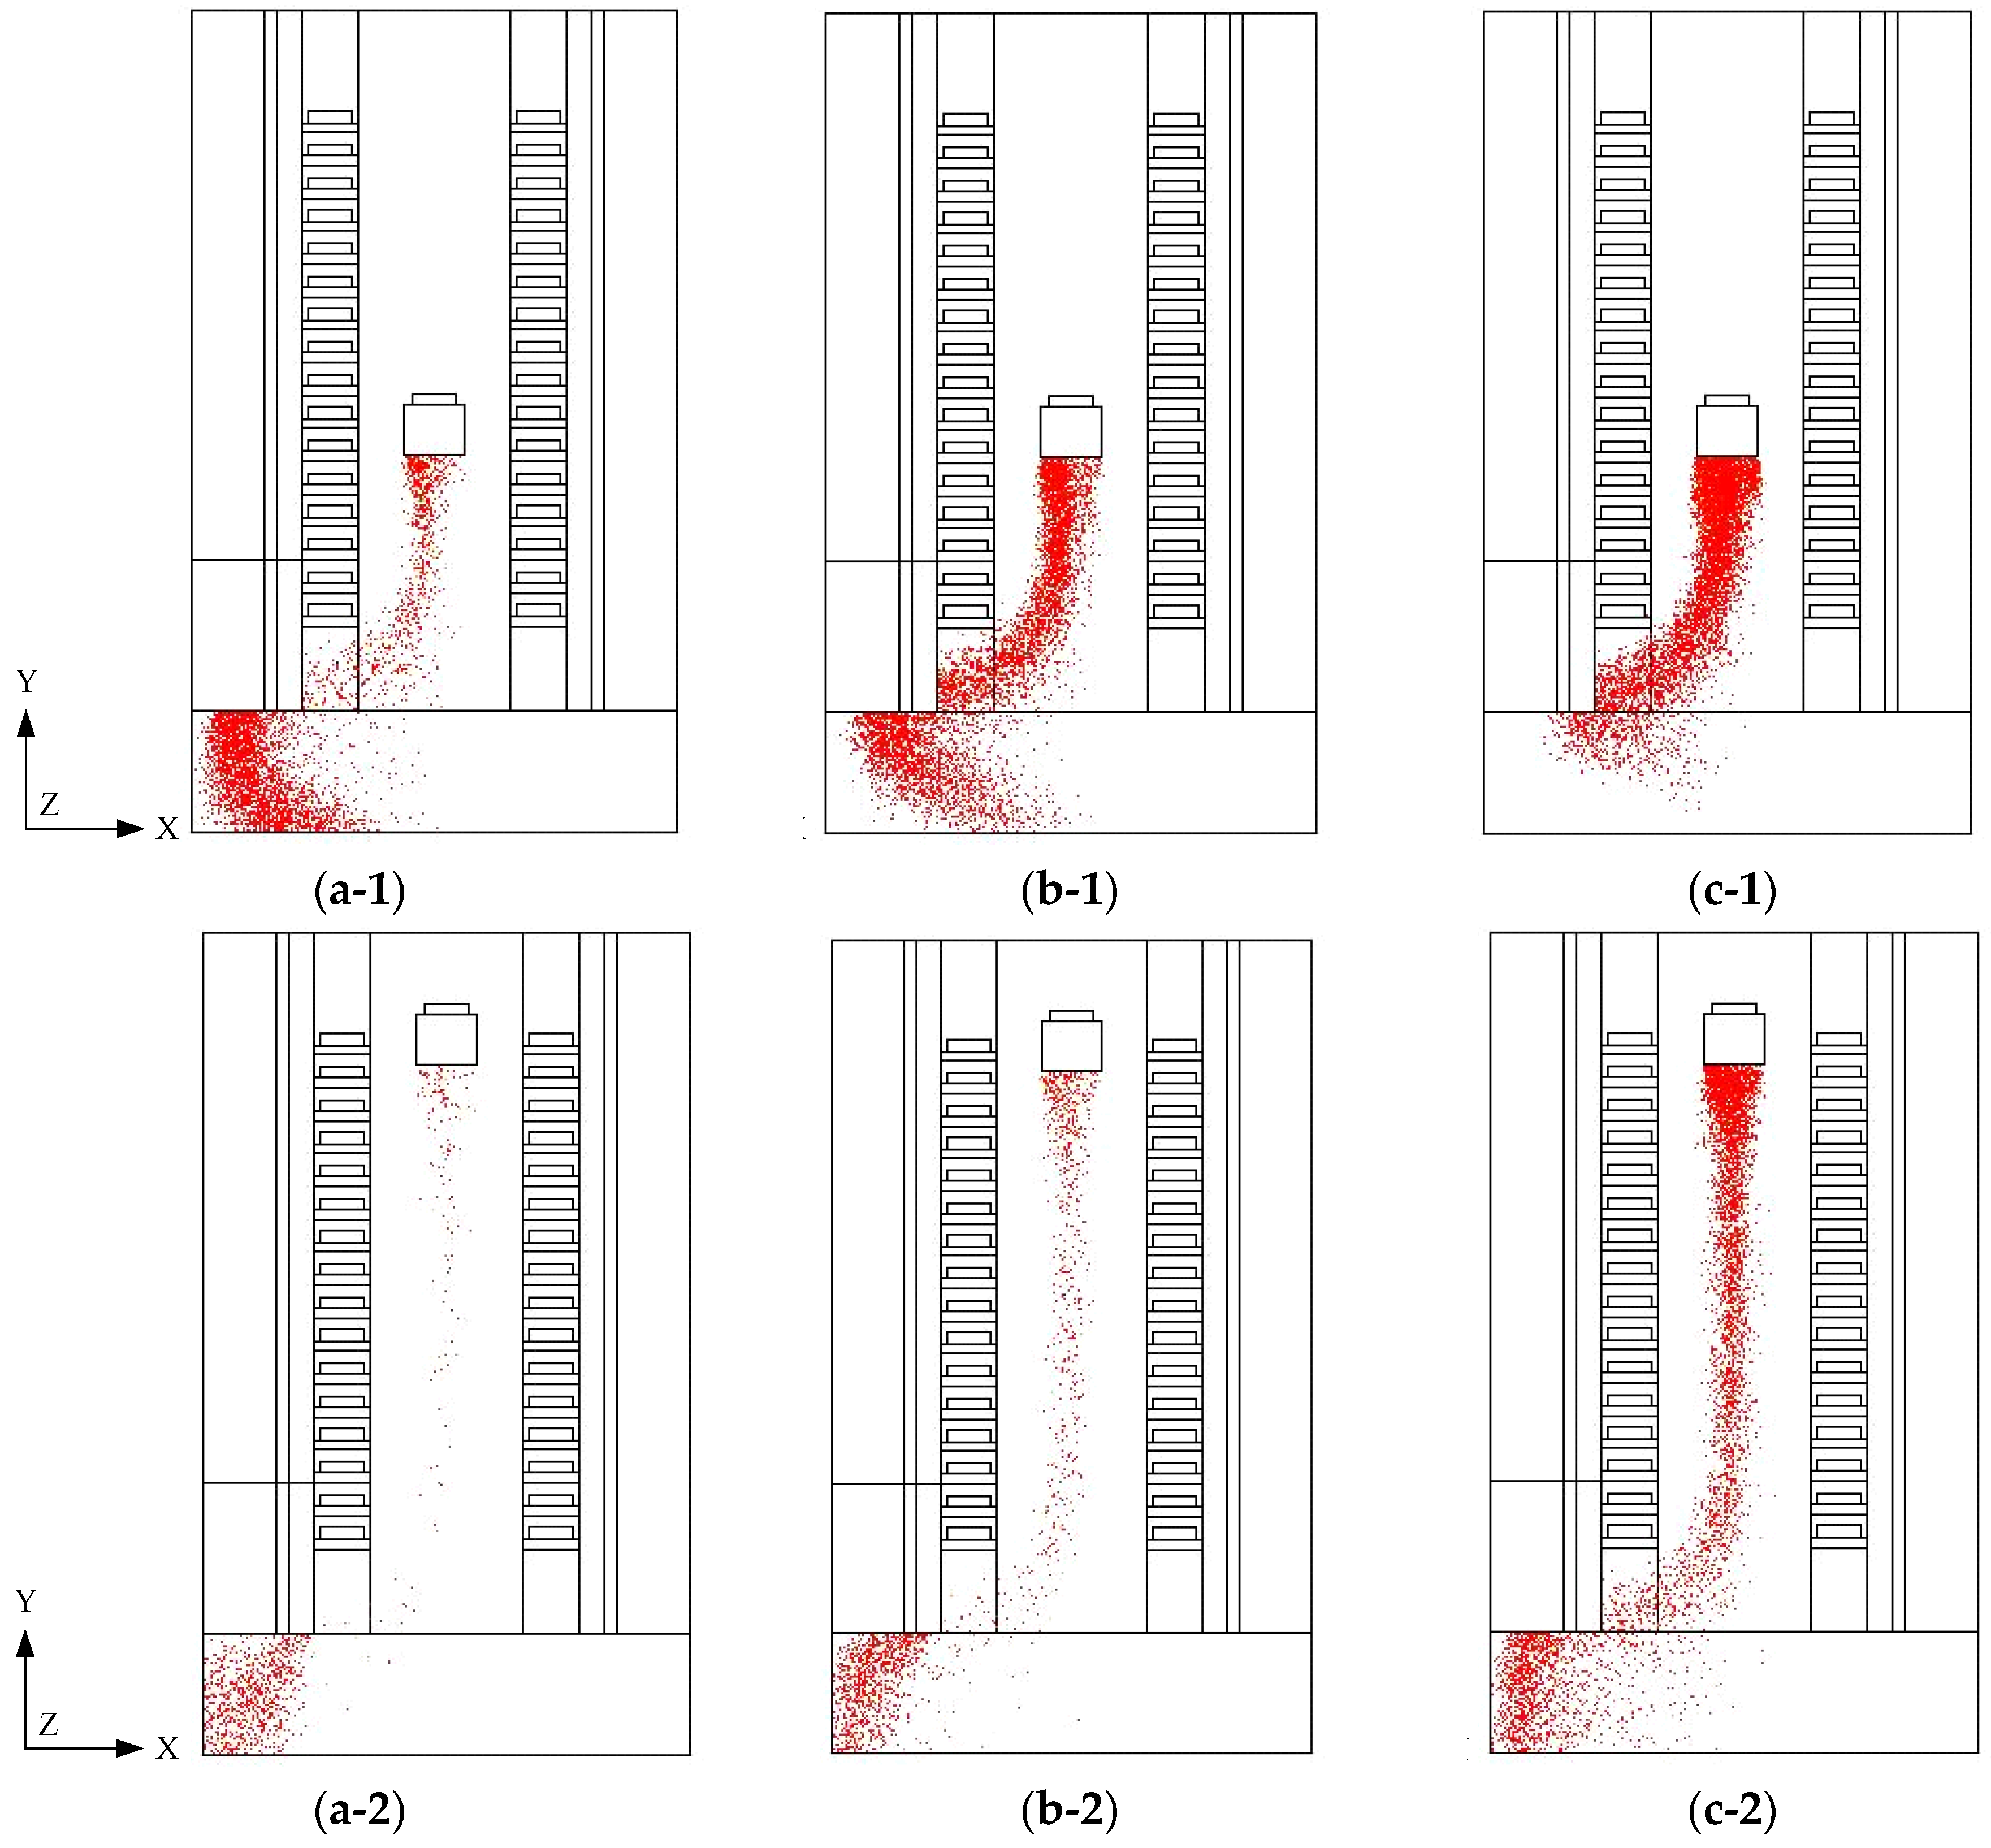
Figure 9 presents the transient flow field and the movement of contaminant particles in the X–Y cross section while a crane moves along the Y axis with a velocity of (a) 0.3 m/s; (b) 0.4 m/s; and (c) 0.6 m/s at different locations. In this studied case, we chose a crane that moved vertically from bottom side to top side (Y = 0.84 to 2.1 m). This is mainly based on the results appearing in the literature [11], which reported that the inferior air is generated by the increasing vortex (where particles are easily trapped [10]) in the stocker for an upward-moving crane; by contrast, the flow field becomes smoothly without obvious vortex generation for a downward-moving crane, indicating a better air quality. Therefore, a crane that moves vertically from bottom side to top side should be the most critical condition for the movement of contaminant particles. As demonstrated earlier, a crane moving with a higher velocity yields a lower CRE as the vortex region is enlarged, and particles are suspended in the vortex.
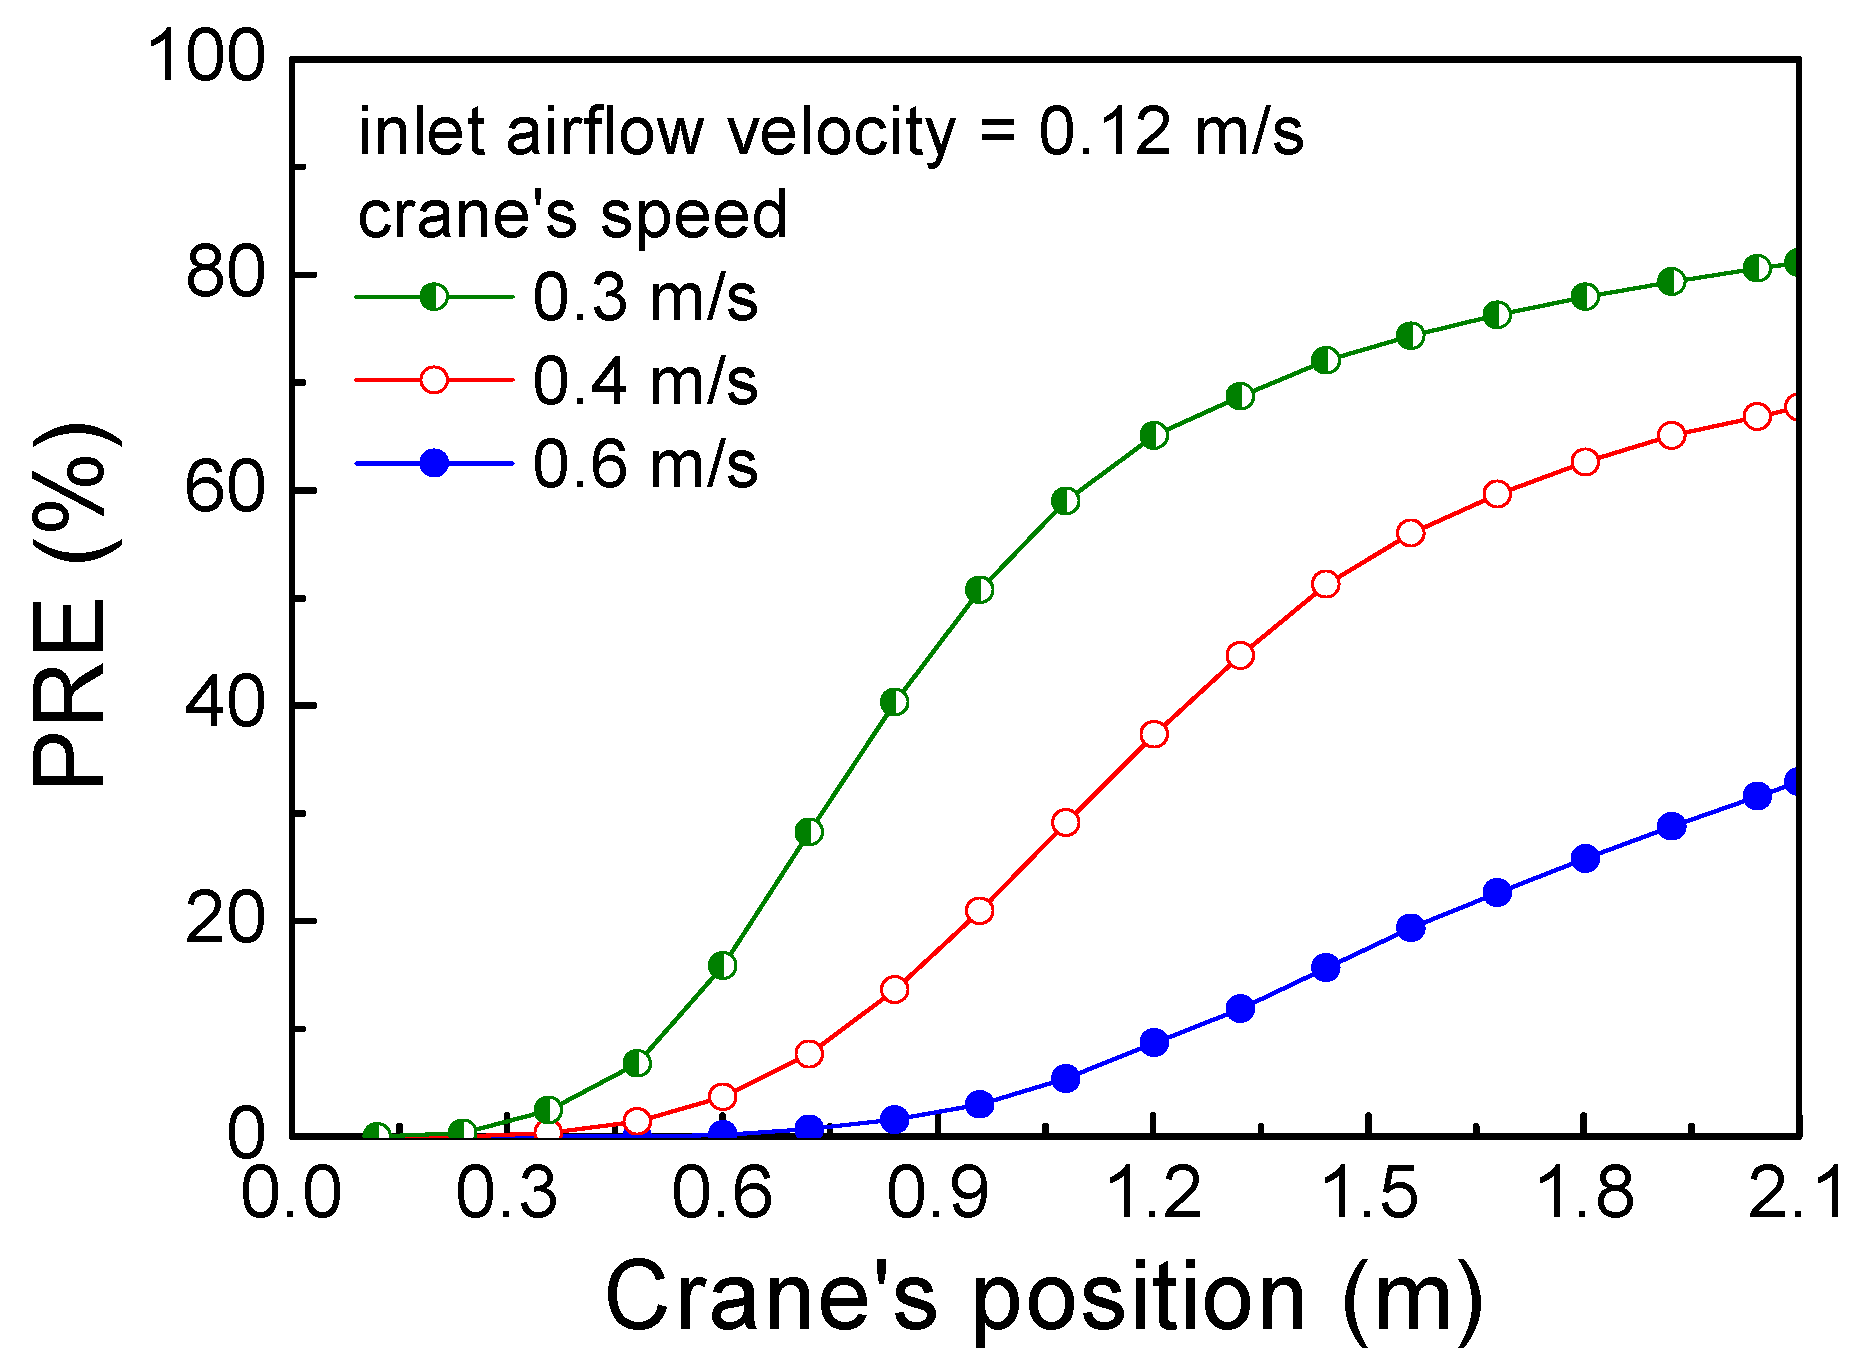
Figure 10 further shows the relationship between the movement of the crane and the PRE. The results demonstrate that a smaller speed of the crane yields a higher PRE under a given inlet airflow velocity of 0.12 m/s. For example, when the crane had a movement speed of 0.3 m/s, the PRE reached about 80% at Y = 2.1 m (i.e., only about 20% of the total number of particles remained in the stocker). In contrast, when the crane’s speed was set to 0.6 m/s the PRE was only about 33% at Y = 2.1 m (i.e., 67% of the total number of particles remained as residual particles in the stocker). This demonstrates that a higher crane speed causes more residual particles to remain within the stocker. In other words, crane speed has a major effect on removal of particles from a flow field. However, it should be noted that a small moving speed results in a lower working efficiency while manufacturing products.

4. Conclusions

In this study, a commercial CFD software, ANSYS Fluent, was used for a numerical simulation. Variation in flow fields was discussed based on different sequences of reticle coverage with varying inlet airflow velocity and crane speeds. Generally, a stocker is not filled with reticles; thus, it is suggested that a symmetric order is the best arrangement of reticle coverage sequences for acquiring a better CRE. Because vortices are induced by the airflow passing through a solid boundary, a higher inlet airflow velocity produces a small vortex and benefits the CRE; the inlet airflow velocity and the inertial forces increase, but the viscosity forces are reduced. Therefore, both sides of the vortices around solid boundaries become a narrow path that prevents contaminants to be drawn into the mini-environment. The results demonstrate that an increase in the inlet airflow velocity significantly accelerates the removal of contaminant particles. The PRE approximated to 90% after 5 s when the inlet airflow velocity was 0.16 m/s. However, the PREs were only 74% and 78%, respectively, for the airflow with the velocity of 0.08 and 0.12 m/s. In addition, the present results show that high-speed crane movement results in a large reverse flow region at the bottom that induces a long wake behind the crane; the particles are easily drawn into this wake. Specifically, when the crane moved with a speed of 0.3 m/s, only about 20% of the total number of particles remained as residual particles within the stocker; in contrast, at a crane speed of 0.6 m/s, 67% of the total number of particles remained as residual particles in the stocker.

Acknowledgments

This research project was supported by the Ministry of Science and Technology of Taiwan and the Gudeng Company in Taiwan.

Author Contributions

Shih-Cheng Hu and Ben-Ran Fu analyzed the results and prepared the manuscript. Shao-Shu Chu and Shih-Jie Jhou built a numerical model and conducted a simulation.

Conflicts of Interest

The authors declare no conflict of interest.

References

  1. Havet, M.; Hennequin, F. Experimental characterization of the ambience in a food-processing clean room. J. Food Eng. 1999, 39, 329–335. [Google Scholar] [CrossRef]
  2. Anghel, V.; Chetwynd, D.G. Creating a low-cost, ultra-clean environment. Precis. Eng. 2002, 26, 122–127. [Google Scholar] [CrossRef]
  3. Hu, S.C.; Chuah, Y.K.; Yen, M.C. Design and evaluation of a minienvironment for semiconductor manufacture processes. Build. Environ. 2002, 37, 201–208. [Google Scholar] [CrossRef]
  4. Kinkead, D.; Joffe, M.; Higley, J.; Kishkovich, O. Forecast of airborne molecular contamination limits for the 0.25 micron high performance logic process technology. Technol. Transf. 1995, 95, 52–54. [Google Scholar]
  5. Murakami, S.; Kato, S.; Suyama, Y. Numerical and experimental study on turbulent diffusion fields in conventional flow type clean rooms. ASHRAE Trans. 1988, 95, 469–493. [Google Scholar]
  6. Murakami, S.; Kato, S.; Suyama, Y. Numerical study of flow and contaminant diffusion fields as affected by flow obstacles on conventional-flow-type clean room. ASHRAE Trans. 1990, 96, 343–355. [Google Scholar]
  7. Kanayama, H.; Toshigami, K.; Tashiro, Y.; Tabata, M.; Fujima, S. Finite element analysis of air flow around an automatic guided vehicle. J. Wind Eng. Ind. Aerodyn. 1993, 46, 801–810. [Google Scholar] [CrossRef]
  8. Kanayama, H.; Toshigami, K.; Tashiro, Y. Air flow computation around an automated guided vehicle. Int. J. Comput. Fluid Dyn. 1996, 7, 155–162. [Google Scholar] [CrossRef]
  9. Yang, S.J. An arbitrary Lagrangian-Eulerian finite element method for interactions of airflow and a moving AGV in a clean room. Finite Elem. Anal. Des. 2003, 39, 521–533. [Google Scholar] [CrossRef]
  10. Yang, S.J.; Chen, S.F.; Fu, W.S. Numerical study for variations of airflow induced by a moving automatic guided vehicle in a clean room. J. Chin. Inst. Eng. 2002, 25, 67–75. [Google Scholar] [CrossRef]
  11. Lin, S.C.; Chang, C.J.; Shih, H.C.; Huang, Y.M.; Chen, C.C.; Luo, Y.S. Influence of elevator moving pattern on the contaminant exclusion for an LCD panel delivery facility. In Proceedings of the ASME 2012 11th Biennial Conference on Engineering Systems Design and Analysis, Nantes, France, 2–4 July 2012.
  12. Hu, S.C.; Chuah, Y.K. Deterministic simulation and assessment of air-recirculation performance of unidirectional-flow cleanrooms that incorporate age of air concept. Build. Environ. 2003, 38, 563–570. [Google Scholar] [CrossRef]
  13. Noh, K.C.; Oh, M.D.; Lee, S.C. A numerical study on airflow and dynamic cross-contamination in the super cleanroom for photolithography process. Build. Environ. 2005, 40, 1431–1440. [Google Scholar] [CrossRef]
  14. Chen, S.C.; Tsai, C.J.; Li, S.N.; Shih, H.Y. Dispersion of gas pollutant in a fan-filter-unit (FFU) cleanroom. Build. Environ. 2007, 42, 1902–1912. [Google Scholar] [CrossRef]
  15. Tsao, J.M.; Chien, Y.U.; Hu, S.C.; Wu, J.W.; Khoo, C.Y. Experimental Study on the flow and particle transport induced by the interaction between downwash air flow and moving object in mini environments. ASHRAE Trans. 2010, 116, 329–330. [Google Scholar]
  16. Hu, S.C.; Shiue, Y.Y.; Shiue, A.; Tsai, M.H. Removal characteristics of particulate matter with different return air system designs in a nonunidirectional cleanroom for integrated circuit (IC) testing processes. HVACR Res. 2014, 20, 162–166. [Google Scholar] [CrossRef]
  17. Ferziger, J.H.; Peric, M. Computational Methods for Fluid Dynamics; Springer-Verlag: New York, NY, USA, 2002. [Google Scholar]
  18. Zhang, Z.; Zhang, W.; Zhai, Z.J.; Chen, Q.Y. Evaluation of various turbulence models in predicting airflow and turbulence in enclosed environments by CFD: Part 2—Comparison with experimental data from literature. HVACR Res. 2007, 13, 871–886. [Google Scholar] [CrossRef]
  19. Jones, W.P.; Launder, B.E. The prediction of laminarization with a two-equation model of turbulence. Int. J. Heat Mass Transf. 1972, 15, 301–314. [Google Scholar] [CrossRef]
  20. Patankar, S.V.; Spalding, D.B. A calculation procedure for heat, mass and momentum transfer in three-dimensional parabolic flows. Int. J. Heat Mass Transf. 1972, 15, 1787–1806. [Google Scholar] [CrossRef]
Figure 1. The geometrical configuration of the stocker used in this study: (a) a reticle stocker used in a factory and (b) the cross-section selected for analysis and particle release positions within a reticle box.
Atmosphere 08 00023 g001
Figure 2. Positions selected for monitoring convergence and particle release positions for a moving crane path: (a) monitoring positions and a crane moving along the Z axis and (b) monitoring positions and a crane moving along the Y axis.
Atmosphere 08 00023 g002
Figure 3. Grid independence test (with time step of 0.1 s).
Atmosphere 08 00023 g003
Figure 4. Independence test for time steps: (a) concentration and (b) velocity evolutions.
Atmosphere 08 00023 g004
Figure 5. (a) Effect of the arrangement of reticle boxes on the contaminant concentration evolution at the monitoring position in the stocker; (b) air change per hour (ACH) related to the contaminant removal efficiency (CRE).
Atmosphere 08 00023 g005
Figure 6. Evolution of the X-Y cross section airflow distributions (at Z = 2.81 m) while a crane moves (with a velocity of 0.4 m/s) along the Y axis with an inlet airflow velocity of (a) 0.08 m/s; (b) 0.12 m/s, and (c) 0.16 m/s at different locations. Here, 1 and 2 of sub-figures stand for the different location of the Y axis.
Atmosphere 08 00023 g006
Figure 7. Variations in the particle removal efficiency (PRE) related to the time.
Atmosphere 08 00023 g007
Figure 8. Evolution of the X-Z cross section airflow distributions (at Y = 0.77 m) while a crane moves along the Z axis with a velocity of (a) 0.3 m/s; (b) 0.4 m/s; and (c) 0.6 m/s at different locations. Here, 1 and 2 of sub-figures stand for the different location of the Z axis.
Atmosphere 08 00023 g008
Figure 9. Evolution of the X-Y cross section particle distributions (at Z = 2.81 m) while a crane moves along the Y axis with a velocity of (a) 0.3 m/s; (b) 0.4 m/s; and (c) 0.6 m/s at different locations. Here, 1 and 2 of sub-figures stand for the different location of the Y axis.
Atmosphere 08 00023 g009
Figure 10. Variations in the particle removal efficiency (PRE) related to the crane’s positions.
Atmosphere 08 00023 g010

