Article

Effects of Aerosols on Radiative Forcing and Climate Over East Asia With Different SO2 Emissions

1
SKLLQG, Institute of Earth Environment, Chinese Academy of Sciences, Xi’an 710061, China
2
Department of Environmental Science and Technology, School of Human Settlements and Civil Engineering, Xi’an Jiaotong University, Xi’an 710049, China
3
Shaanxi Radio & TV University, Xi’an 710002, China
*
Author to whom correspondence should be addressed.
Atmosphere 2016, 7(8), 99; https://doi.org/10.3390/atmos7080099
Submission received: 14 June 2016 / Revised: 20 July 2016 / Accepted: 20 July 2016 / Published: 28 July 2016
(This article belongs to the Special Issue Advances in Clouds and Precipitation)

Abstract

:
It is known that aerosol and precursor gas emissions over East Asia may be underestimated by 50% due to the absence of data on regional rural and township industries. As the most important element of anthropogenic emissions, sulphur dioxide (SO 2 ) can form sulfate aerosols through several chemical processes, thus affecting the regional and global climate. In this study, we use the Community Atmospheric Model 5.1 (CAM5.1) to investigate the effects of anthropogenic aerosols on radiative forcing and the climate over East Asia, taking into consideration various SO 2 emission levels, including double the amount of SO 2 emissions over East Asia. Numerical experiments are performed using high-resolution CAM5.1 with pre-industrial (PI) and present day (PD) aerosol emission levels, and with PD aerosol emission levels with double SO 2 emissions over East Asia (PD2SO2). The simulated aerosol optical depth and surface sulfate concentrations over East Asia are significantly increased in PD2SO2, which is in better agreement with the observational results. The simulation results show extensive aerosol direct and indirect radiative forcing for PD−PI (the difference between PI and PD), which significantly weakens the large-scale intensity of the East Asian summer monsoon (EASM) and reduces the summer precipitation. Compared to PD, the aerosol direct radiative forcing is significantly increased in PD2SO2, whereas the aerosol indirect radiative forcing is markedly decreased due to the inhibition of cloud formation, especially over North China. The increase in aerosol direct radiative forcing and decrease in aerosol indirect radiative forcing result in insignificant changes in the total amount of aerosol radiative forcing. These results also show that the large-scale intensity of the EASM and the associated summer precipitation are insensitive to the doubling of current SO 2 emissions.

1. Introduction

Industrial emissions of aerosols and aerosol precursor gases over East Asia have greatly increased in association with rapid economic growth and industrialization over the past several decades [1]. Many observational and numerical studies have shown that abundant anthropogenic aerosols can modulate the climate system over East Asia, especially the East Asian summer monsoon (EASM), through both the aerosol direct and indirect effects [2,3,4].
The direct and indirect effects of atmospheric aerosols significantly influence the regional and global climate, including radiation and the microphysical properties of clouds, as well as precipitation processes [5,6]. For instance, an increase in atmospheric aerosols directly affects the local and global radiation balance by scattering and absorbing solar and infrared radiation in the atmosphere (the “aerosol direct effect”). Atmospheric aerosols, serving as cloud condensation nuclei or ice nuclei, increase the droplet concentration and decrease the droplet effective radius, which indirectly increases the cloud albedo [7], reduces the precipitation efficiency and prolongs the cloud lifetime [8,9], and then exerts negative radiative forcing (the "aerosol indirect effect").
The increasing aerosol loading over South Asia and East Asia in recent decades has prompted increased research interest in the climatic effects of atmospheric aerosols (including aerosol direct and indirect radiative forcing) on Asian summer monsoon systems and regional precipitation [2]. It is evident that changes in the atmospheric circulation of the South Asian summer monsoon induced by anthropogenic aerosols affect the summer precipitation over South Asia [10,11]. In addition, many previous studies using multi-scale climate models have shown that large amounts of anthropogenic aerosols can affect the atmospheric circulation of the EASM and the associated summer precipitation over East Asia. A global climate model showed that increased black carbon aerosols may cause increased rainfall in the middle and lower reaches of the Yangtze River and droughts in North China [12]. Liu et al. [13] used the CAM3.5 model to explore the effects of anthropogenic aerosols on the EASM system and found a weakening EASM circulation and a prominent decline in rainfall over eastern China induced by the forcing of anthropogenic aerosols. Other simulation studies have confirmed the notion of a weakened EASM circulation and reduced precipitation over eastern China in response to an increased amount of anthropogenic aerosols over East Asia, using the CAM5 model [14], the Coupled Model Intercomparison Project Phase 5 (CMIP5) models with prescribed sea surface temperature [15], and an online coupled regional climate-chemistry model [16]. Other studies have emphasized that the effects of aerosols on the EASM and the associated summer precipitation differ between strong and weak EASM years [17], and between strong and weak EASM stages [18].
However, Cao et al. [19] pointed out that aerosol and precursor gas emissions may be underestimated by 50% due to the absence of data on regional rural and township industries. In addition, compared with satellite observations, the global climate model mainly captures the seasonal and spatial variations in the aerosol optical depth (AOD) over East Asia, but underestimates the AOD by more than 50% in this region [20] due to the underestimation of anthropogenic aerosol emissions. As an important element of anthropogenic emissions, sulphur dioxide (SO 2 ) can form sulfate aerosols through some chemical processes, and can thus affect the regional and global climate. Here, we double the amount of SO 2 emissions over East Asia, which may be much closer to the actual levels of East Asian anthropogenic emissions, and further study their effect on the climate over East Asia. We use the Community Atmospheric Model 5.1 (CAM5.1) with pre-industrial (PI) and present day (PD) aerosol emissions, and with PD aerosol emissions including double SO 2 emissions over East Asia (PD2SO2).
The rest of the paper is organized as follows. A brief description of the CAM5.1 model and the observed data are presented in Section 2. Section 3 presents the simulation results for the effects of aerosols on radiative forcing and the climate with different SO 2 emission levels over East Asia. The discussion and conclusions are summarized in Section 4 and Section 5, respectively.

2. Model and Data

2.1. The CAM5.1 Model

The CAM5.1 model is the atmospheric component of the Community Earth System Model (CESM 1.0.3), and is documented in more detail in Neale et al. [21]. For the size distribution of aerosols, three lognormal modes with Aitken, accumulation, and coarse modes (3-mode modal aerosol scheme, MAM3) have been coupled into the CAM5.1 model to simulate internal mixtures of dust, sea-salt, sulfate, primary organic matter and black carbon [20]. The MAM3 aerosol scheme was shown to capture the spatial and seasonal variations in the AOD over East Asia compared with the satellite observations, although the modeled AOD values were significantly lower than the observational results at urban sites [20]. The CAM5.1 model contains a detailed treatment of a new two-moment bulk stratiform cloud microphysics scheme and the aerosol indirect effect with comprehensive descriptions of the droplet activation and ice nucleation of cloud droplets [22]. A complete set of physics packages was selected to allow for effective investigation of different aerosol effects including the direct, semi-direct, and indirect effects of aerosols [23,24]. We use the finite volume dynamical core for transport calculations with a higher horizontal resolution of 0.9 in the latitudinal direction and 1.25 in longitudinal direction, and with 30 levels from the surface to 2 hPa. The increased horizontal resolution model improves the simulation of aerosol indirect radiative forcing compared with observations [25]. We carry out three experiments covering 20 years with a 1-year spin up, with the only difference being the treatment of aerosols and precursor gas emissions. We perform numerical experiments with PI and PD aerosol emissions, and with PD aerosol emissions including double the amount of SO 2 emissions over East Asia (PD2SO2).

2.2. Observed Data

The AOD is an index reflecting aerosol optical properties, derived from the Moderate Resolution Imaging Spectroradiometer on board the Terra satellite (Terra MODIS). To evaluate the corresponding simulation results in this study, we use the Terra MODIS level-3 monthly AOD in the 0.55 mm channel [26] for the March 2000 to December 2014. The Terra MODIS monthly AOD data have a spatial resolution of 1 latitude by 1 longitude. The monthly mean of the surface mass concentration, including mineral, sulfate, organic carbon, elemental carbon, nitrate, and ammonium aerosols, is derived from the observational data of the China Meteorological Administration (CMA) Atmosphere Watch Network (CAWNET) described by Zhang et al. [1]. From 2006 to 2007, the 24-h aerosol filter samples were collected every three days at the CAWNET stations, which are operated by the CMA. Here, we only use the observed data on the sulfate surface concentration from 11 stations in our study area (20 N−45 N, 100 E−130 E), as described in the following section.

3. Results

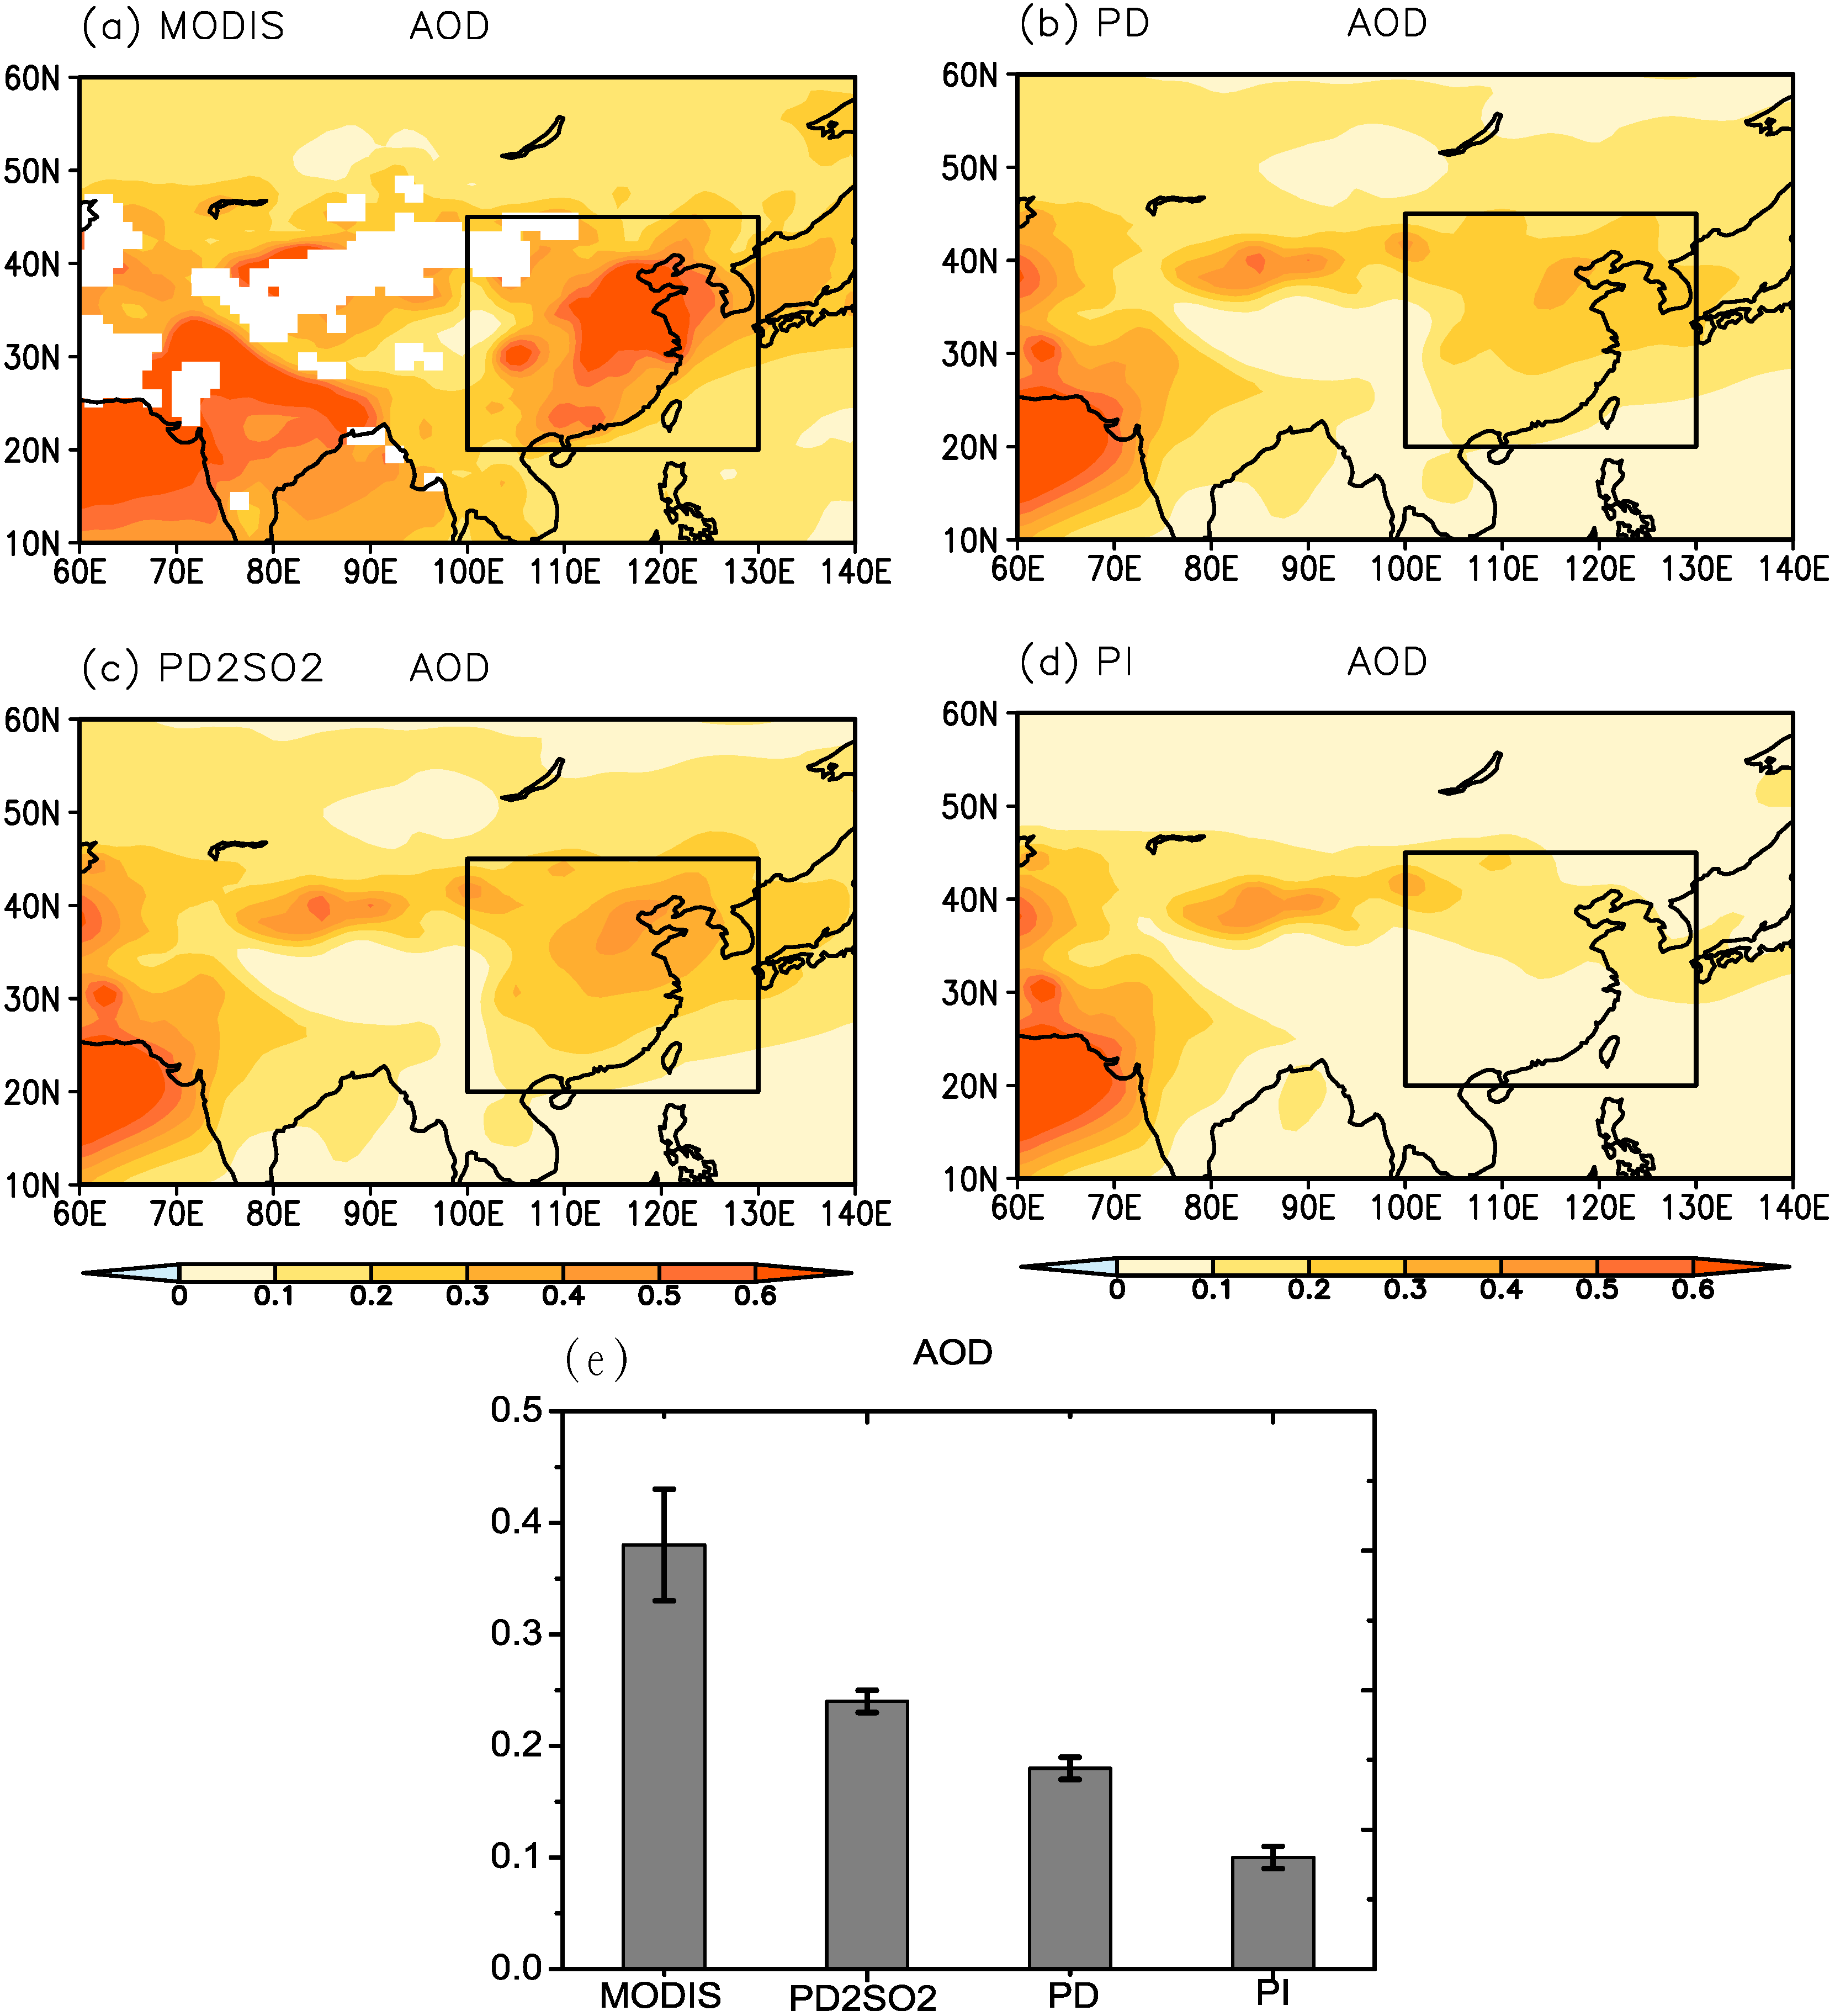
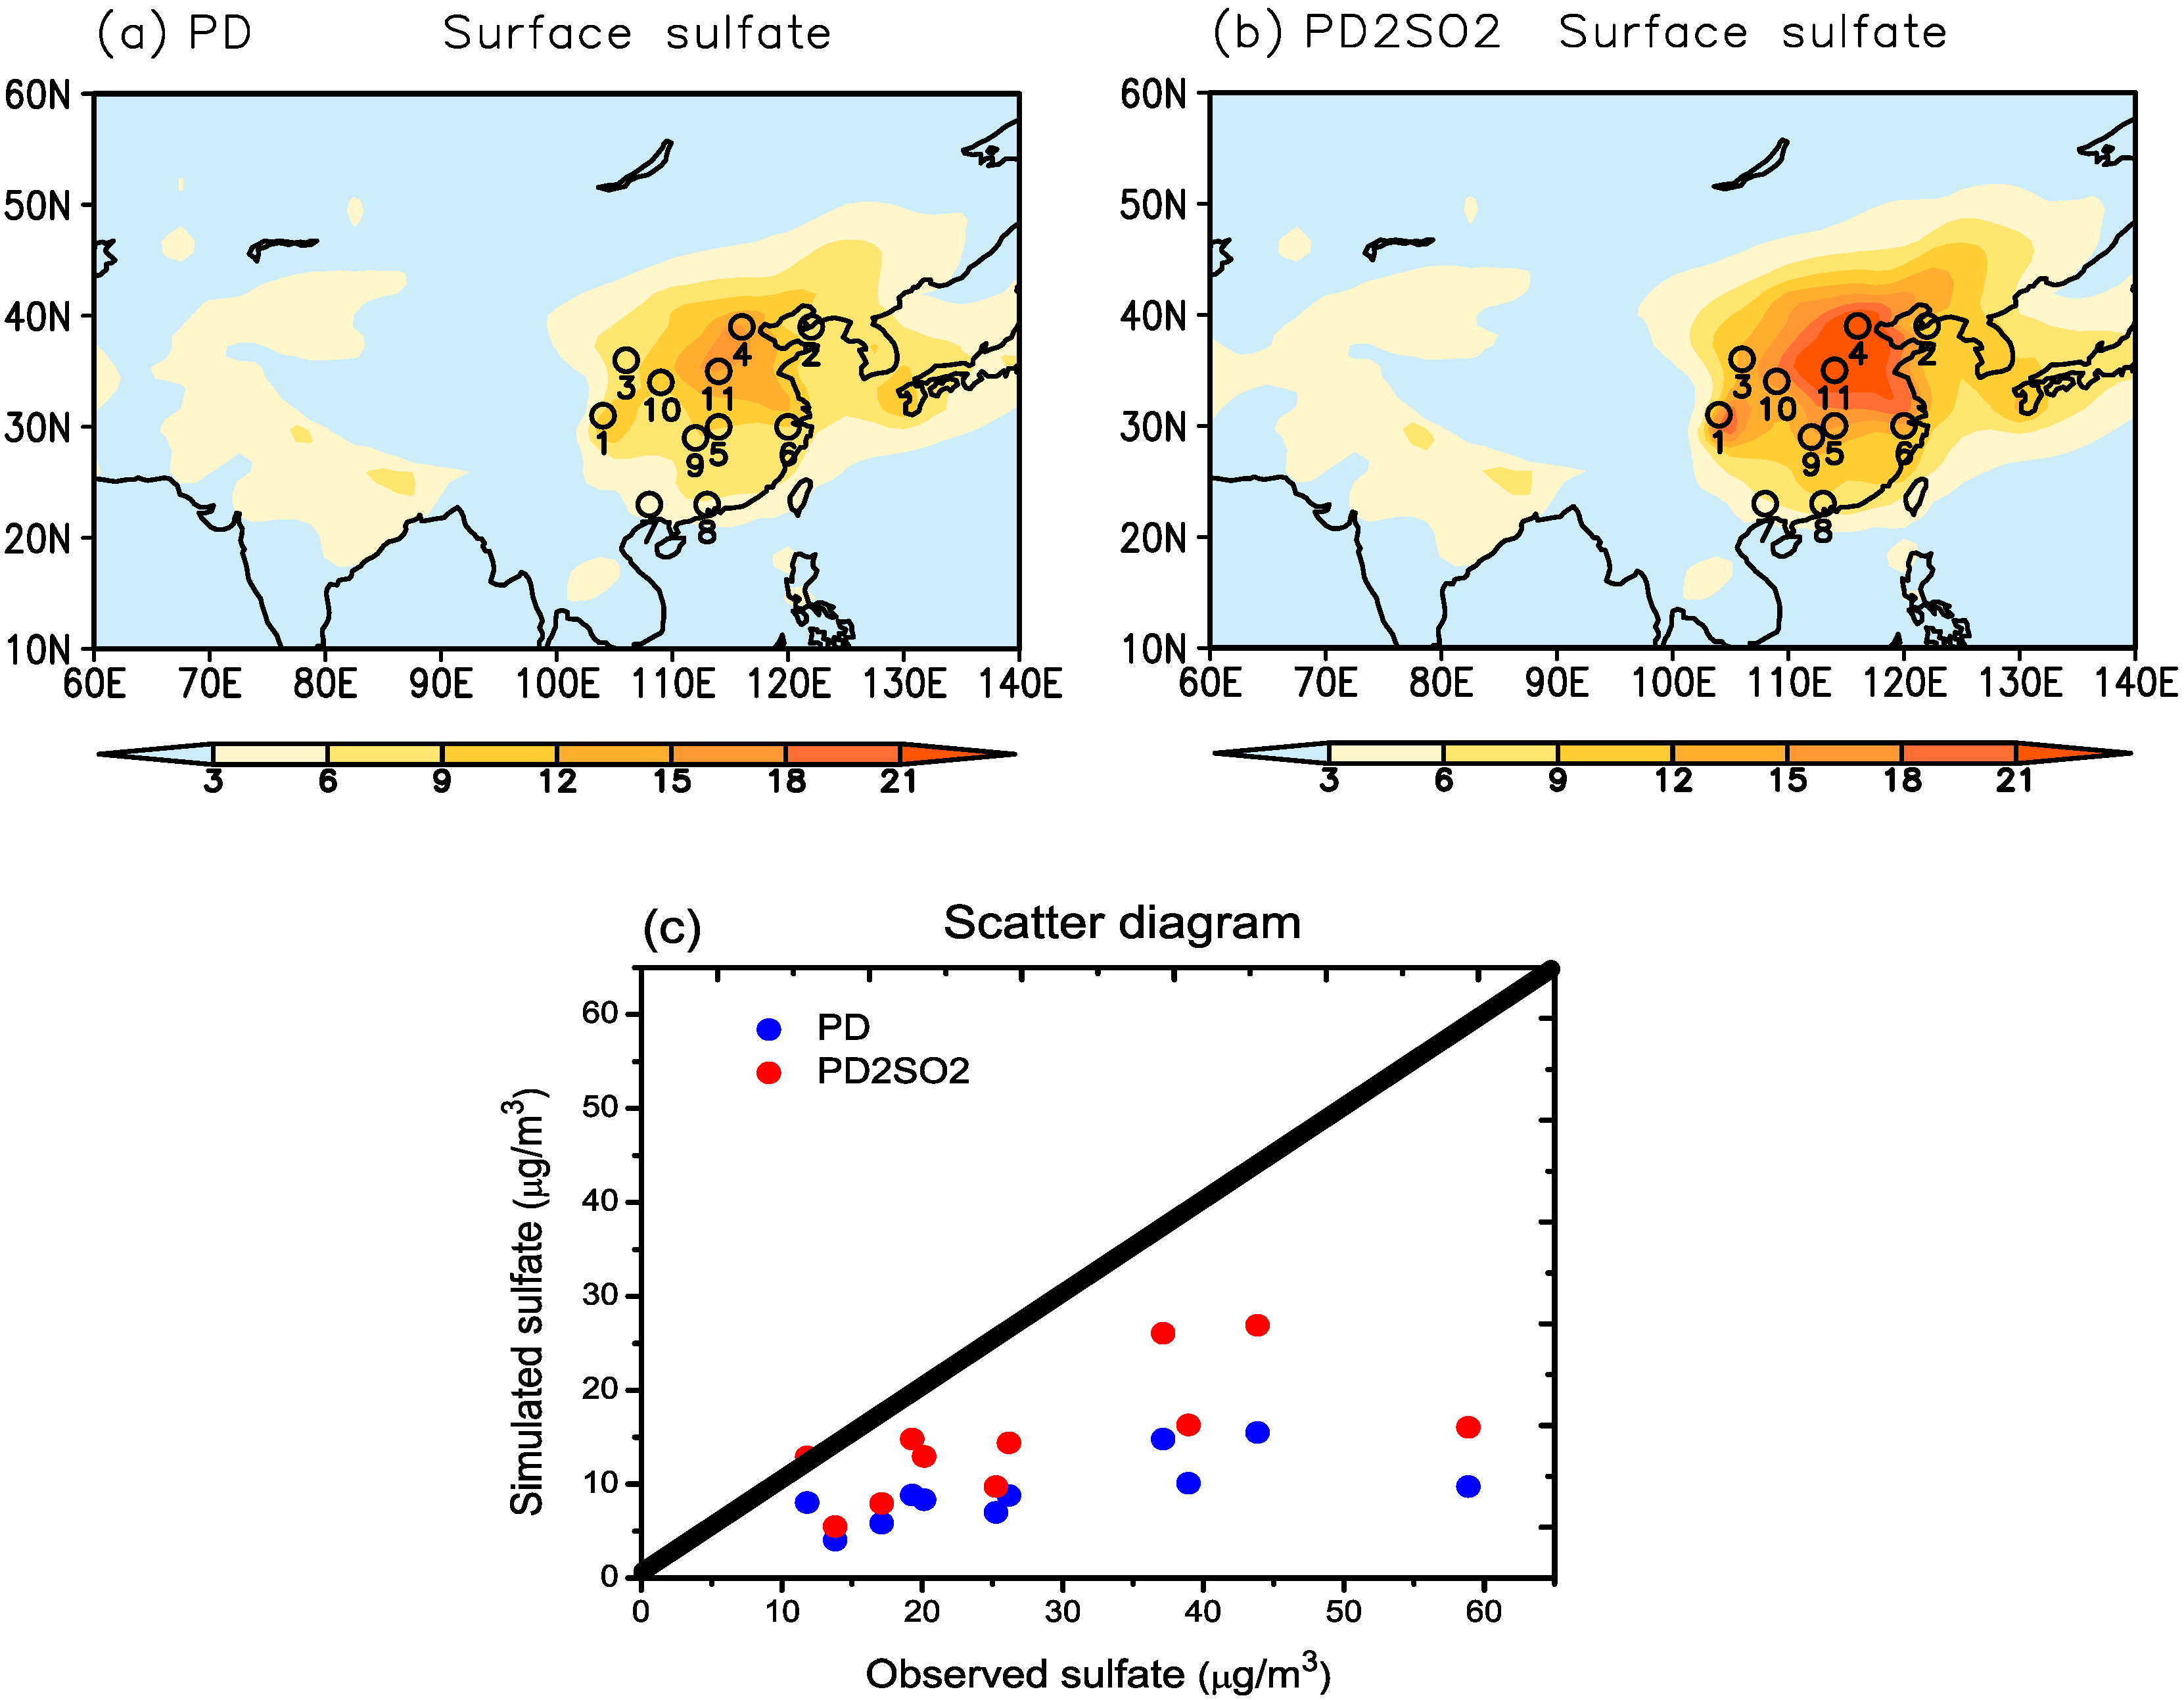
3.1. Comparison between Observation and Model

Figure 1 shows the spatial distribution of the AOD (550 nm) and compares the mean AOD values in summer over East Asia derived from MODIS and the CAM5.1 model (PD, PD2SO2 and PI). According to the MODIS-derived values in Figure 1a, East Asia has high AOD values, reaching 0.5 or higher in North China, due to the high anthropogenic emissions over East Asia. The PI simulation shows a large AOD in the Arabian Sea and Northwest China, which is directly related to dust aerosol loadings in these local regions, as shown in Figure 1d. The PD simulation shows a larger AOD over East Asia due to anthropogenic emissions (Figure 1b) compared to PI. However, it should be noted that the AOD values from PD are significantly lower than those derived from MODIS (Figure 1e). Liu et al. [20] argued that the AOD underestimation was probably due to the underestimation of anthropogenic aerosol emissions over Asia, including East Asia. Doubling the level of SO2 emissions over East Asia (PD2SO2) causes a significant increase in the AOD estimation (Figure 1c), which is much closer to the observed results from MODIS (Figure 1e).
Figure 2 shows the spatial distribution of the surface sulfate concentration in summer derived from the model, including the PD and PD2SO2 experiments, and compares the mean values from 11 CAWNET stations and the model. For the PD experiment, we can see that the surface sulfate concentration is high over East Asia due to the large anthropogenic sulfate loadings (Figure 2a), and is similar to the spatial distribution of the AOD in Figure 1b. However, the simulated surface sulfate concentration is again lower than that derived from the 11 CAWNET stations in Figure 2c. When the level of SO 2 emissions over East Asia is doubled (PD2SO2), the surface sulfate concentration significantly increases over East Asia (Figure 2b), which is in better agreement with the observed results from the 11 CAWNET stations (Figure 2c).
In general, we can see that the simulated AOD and surface sulfate concentration over East Asia can be significantly increased by doubling the level of SO 2 emissions (PD2SO2), and the results are more consistent with the observational results derived from MODIS and the 11 CAWNET stations in Figure 1 and Figure 2.

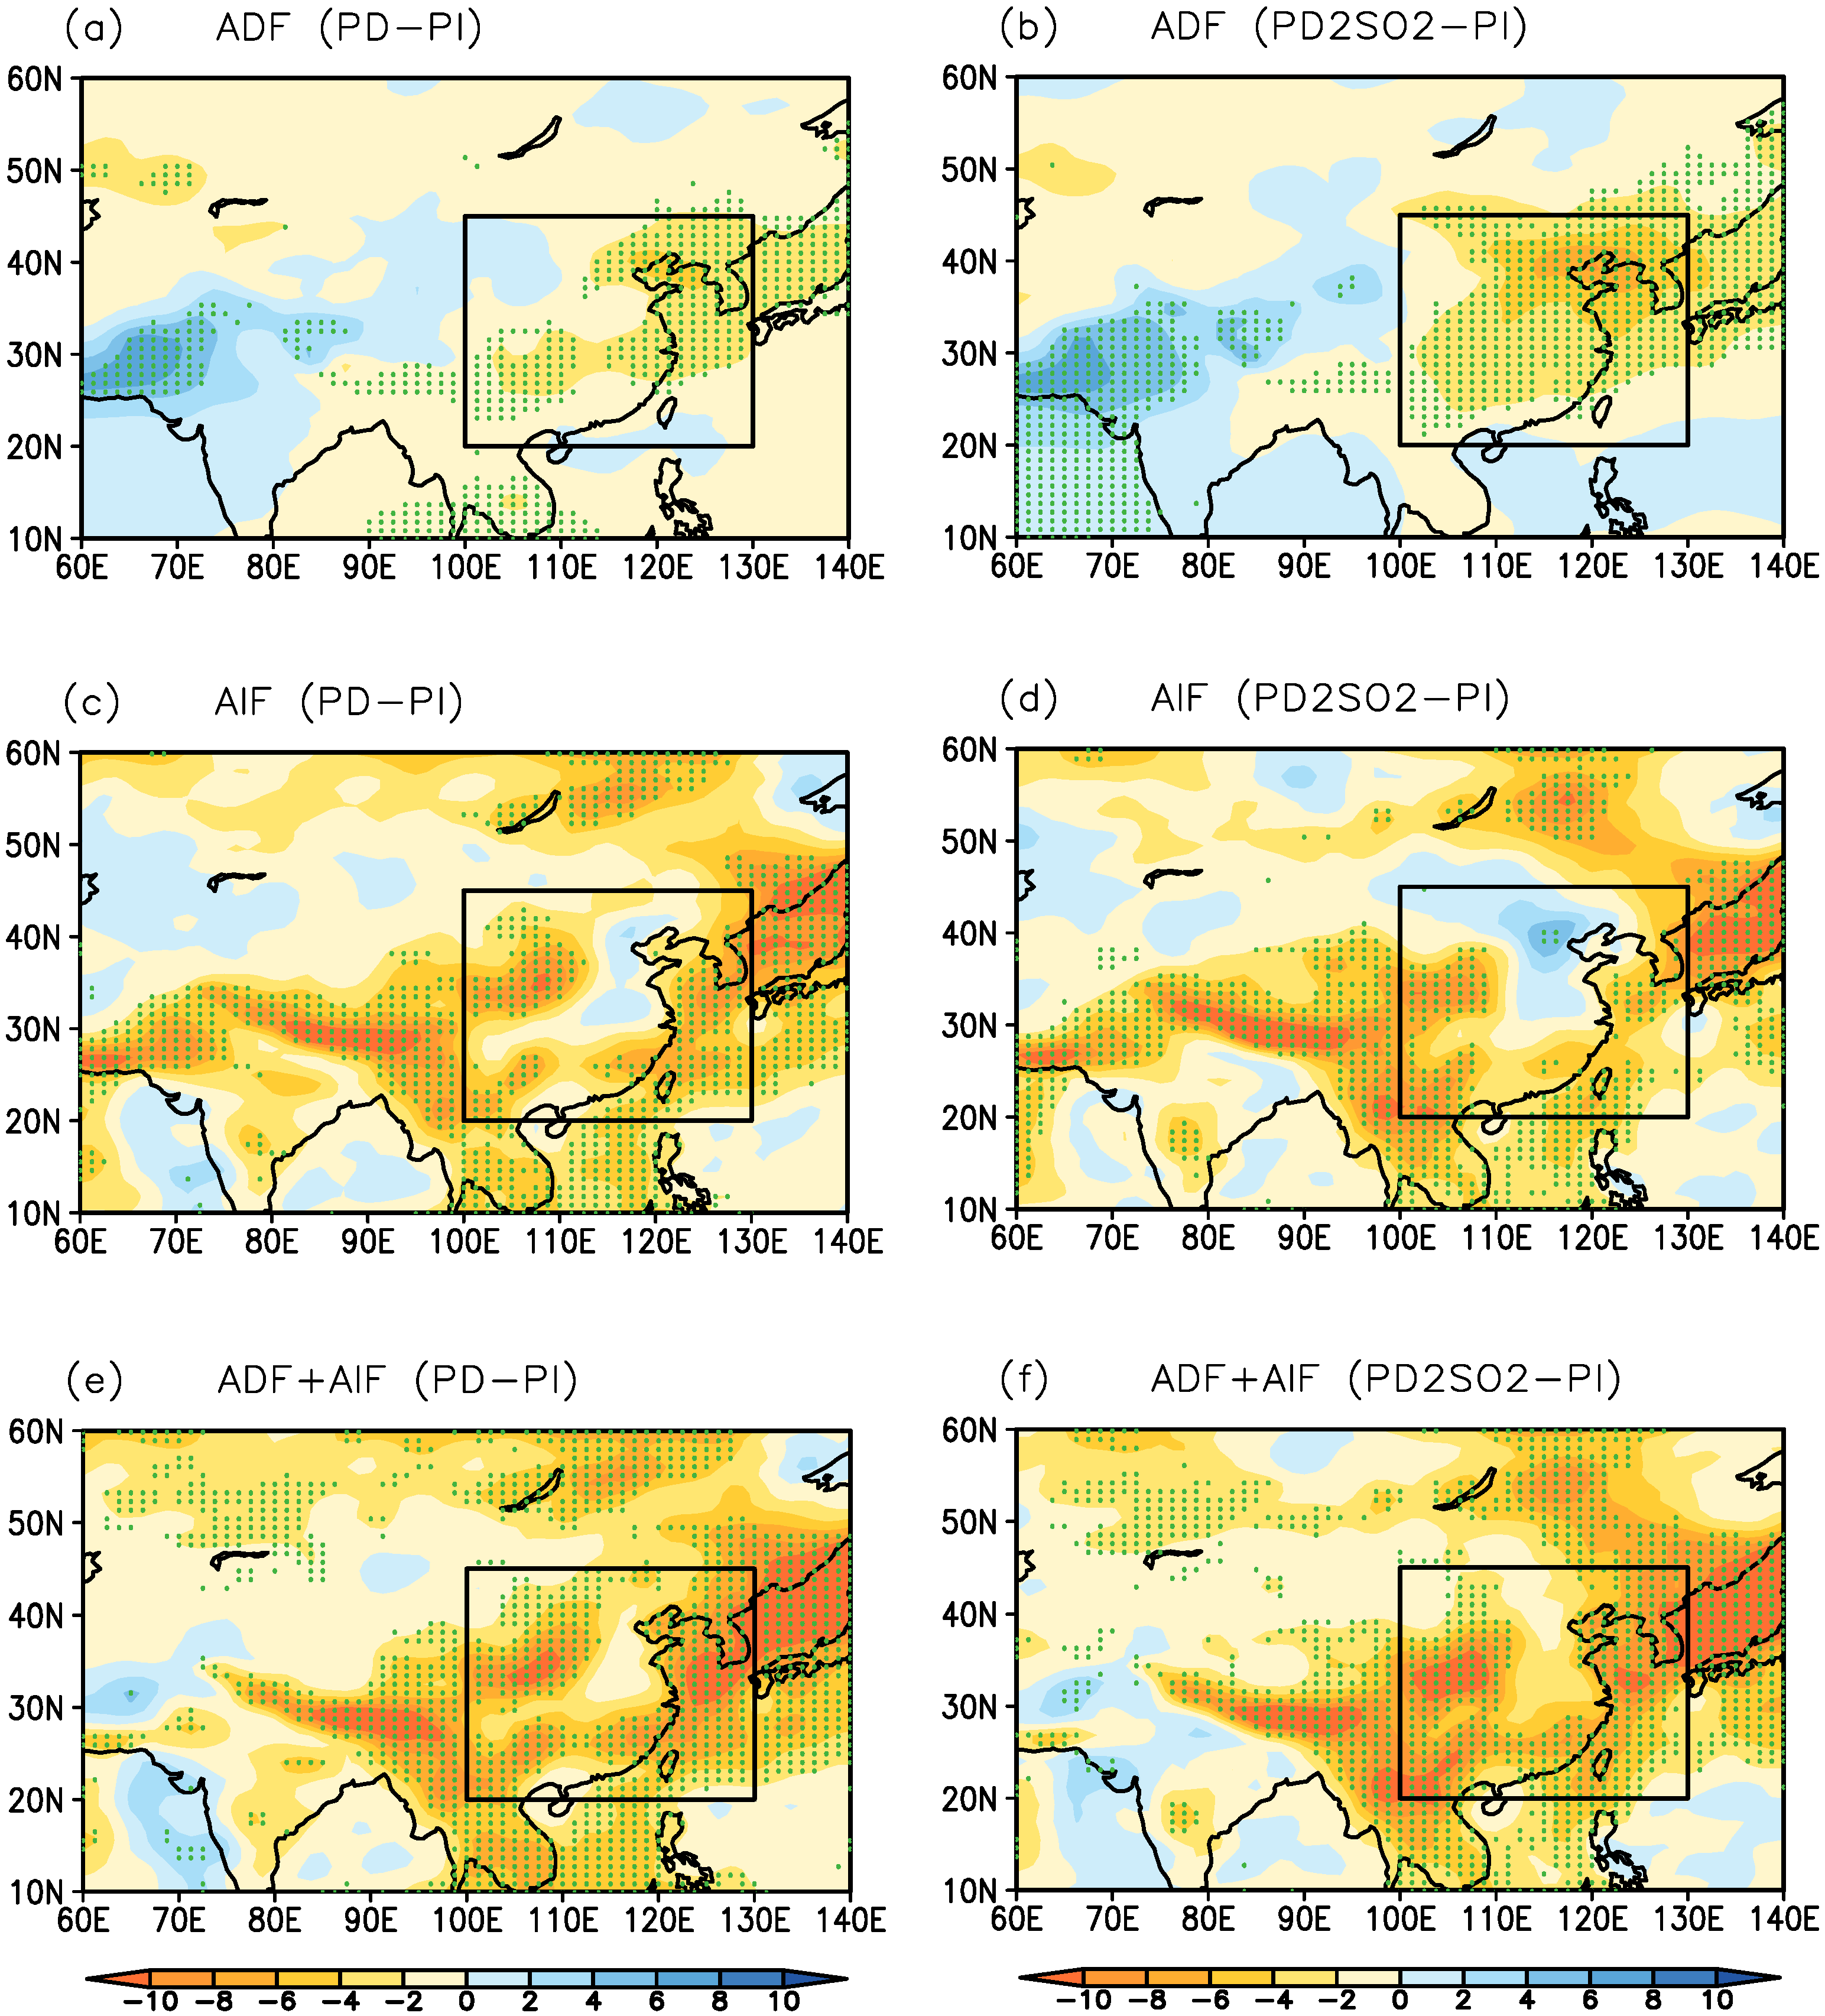
3.2. Aerosol Effects on Cloud Properties and Radiative Forcing

In this subsection, we compare the difference in the aerosol-induced changes in cloud properties and radiative forcing over East Asia between PD−PI and PD2SO2−PI in Table 1. The increase in anthropogenic aerosols (PD−PI) significantly increases the liquid water path and the cloud droplet concentration by 20.90 g·m 2 and 2.49 × 10 6 cm 2 , respectively. In contrast, the cloud droplet effective radius in PD is markedly decreased by −1.39 μ m, compared to PI (10.01 μ m). The changes in these cloud properties are consistent with the notion that anthropogenic aerosol activation forms more cloud droplets, and reduces the conversion efficiency of cloud droplets to raindrops, which results in smaller cloud droplets and an increase in the liquid water path [13,18,27]. The amount of cloud, including low, mid-level, high, and total cloud cover, induced by aerosols shows an insignificant change from the mean values over East Asia for PD−PI in Table 1. However, Figure S1 shows the spatial differences in the amount of cloud induced by aerosols. The amount of cloud is slightly decreased over North China, which has the largest AOD and aerosol concentration. When SO 2 emissions over East Asia are doubled (PD2SO2), the increase in the liquid water path and the cloud droplet concentration are also enhanced compared with PD. The cloud droplet effective radius in PD2SO2 further decreases by −1.51 μ m, compared to −1.39 μ m in PD. Furthermore, increasing aerosols (PD2SO2) significantly reduces the amount of cloud including low, mid-level, high, and total cloud cover, especially over North China (Figure S1). There are two main mechanisms by which increasing SO 2 over East Asia suppresses the formation of clouds. First, the larger AOD over East Asia can cool the surface, stabilize the boundary layer, suppress the convective motion and decease the upward vertical velocity (Table 1) [13], which can effectively suppress the formation of clouds. Second, the larger AOD over East Asia can decrease the surface temperature, increase the sea level pressure over East Asia, and cause weaker changes to the EASM circulation [18], which can decrease the water vapor flux from the ocean (Table 1). The decrease in water vapor flux can significantly suppress the formation of clouds over East Asia. Noted that the increase in the liquid water path and cloud droplet concentration is mainly due to the aerosol indirect effect, whereas the decrease in cloud cover (especially over North China) results from the dynamic response of aerosol, which suppresses the cloud formation.
The decrease in the effective radius of cloud droplets and increase in the liquid water path can effectively enhance the cloud optical depth and exert negative cloud radiative forcing. Anthropogenic aerosols can alter the energy and radiation balance at the surface and the top of the atmosphere (TOA) by aerosol direct radiative forcing (ADF) and aerosol indirect radiative forcing (AIF). The ADF herein is simply described as the difference in the clear-sky radiative flux from simulations with and without anthropogenic aerosols, where the clear-sky radiative flux is calculated as a diagnostic with clouds neglected. The AIF is defined as the difference in the cloud radiative forcing from simulations with and without anthropogenic aerosols. Here, the AIF is the total sum of the aerosol first and second indirect radiative forcing, and the semi-direct radiative forcing [23]. It is also noted that the estimation of the ADF and AIF is biased because it does not take account of the surface albedo forcing, where two additional diagnostic calculations (the whole-sky and clear-sky radiative flux with aerosol scattering and absorption neglected at TOA) in global climate models can solve this problem [24].
Figure 3 shows the spatial distribution of the ADF and AIF, and the aerosol total radiative forcing (ADF + AIF) at TOA. Because of the large AOD over East Asia induced by anthropogenic aerosol emissions (PD), there is a large ADF over East Asia (Figure 3a). The AIF in Figure 3c mostly shows negative radiative forcing over East Asia, but positive radiative forcing over North China. The aerosol total radiative forcing is the total sum of ADF and AIF, which is shown as negative radiative forcing over East Asia in Figure 3e. With the doubling of SO 2 emissions over East Asia (PD2SO2), the ADF is markedly increased in Figure 3b because of the significant increase in the AOD over East Asia (Figure 1c). The difference in the results can also been seen in Figure 4, where the ADF is −1.54 W·m 2 for PD−PI and the corresponding value is −2.80 W·m 2 for PD2SO2−PI over East Asia. The AIF decreases with the doubling of SO 2 emissions over East Asia due to the inhibition of the cloud formation, especially over North China (Figure 3d), which can also been seen in Figure 4 (−3.92 W·m 2 for PD−PI and −3.07 W·m 2 for PD2SO2−PI over East Asia). The aerosol total radiative forcing (PD2SO2−PI) only increases slightly in Figure 3f as a result of the decreased AIF, which is −5.46 W·m 2 for PD−PI and −5.87 W·m 2 for PD2SO2−PI over East Asia in Figure 4.
In general, the simulated results show that there is a large ADF and a large AIF for PD−PI, which results in greater aerosol total radiative forcing. With the doubling of SO 2 emissions over East Asia (PD2SO2), the simulated ADF significantly increases in comparison with PD, whereas the AIF markedly decreases due to the inhibition of cloud formation. These changes in the ADF and AIF result in a slight change in the aerosol total radiative forcing due to the decreased AIF in PD2SO2. Our results suggest that the ADF, AIF, and aerosol total radiative forcing increase significantly with increasing aerosol emissions under clean backgrounds over East Asia. However, with increasing aerosol emissions under polluted backgrounds over this region, the ADF continuously increases, whereas the AIF decreases due to the inhibition of cloud formation, indicating that the aerosol total radiative forcing cannot be changed significantly.

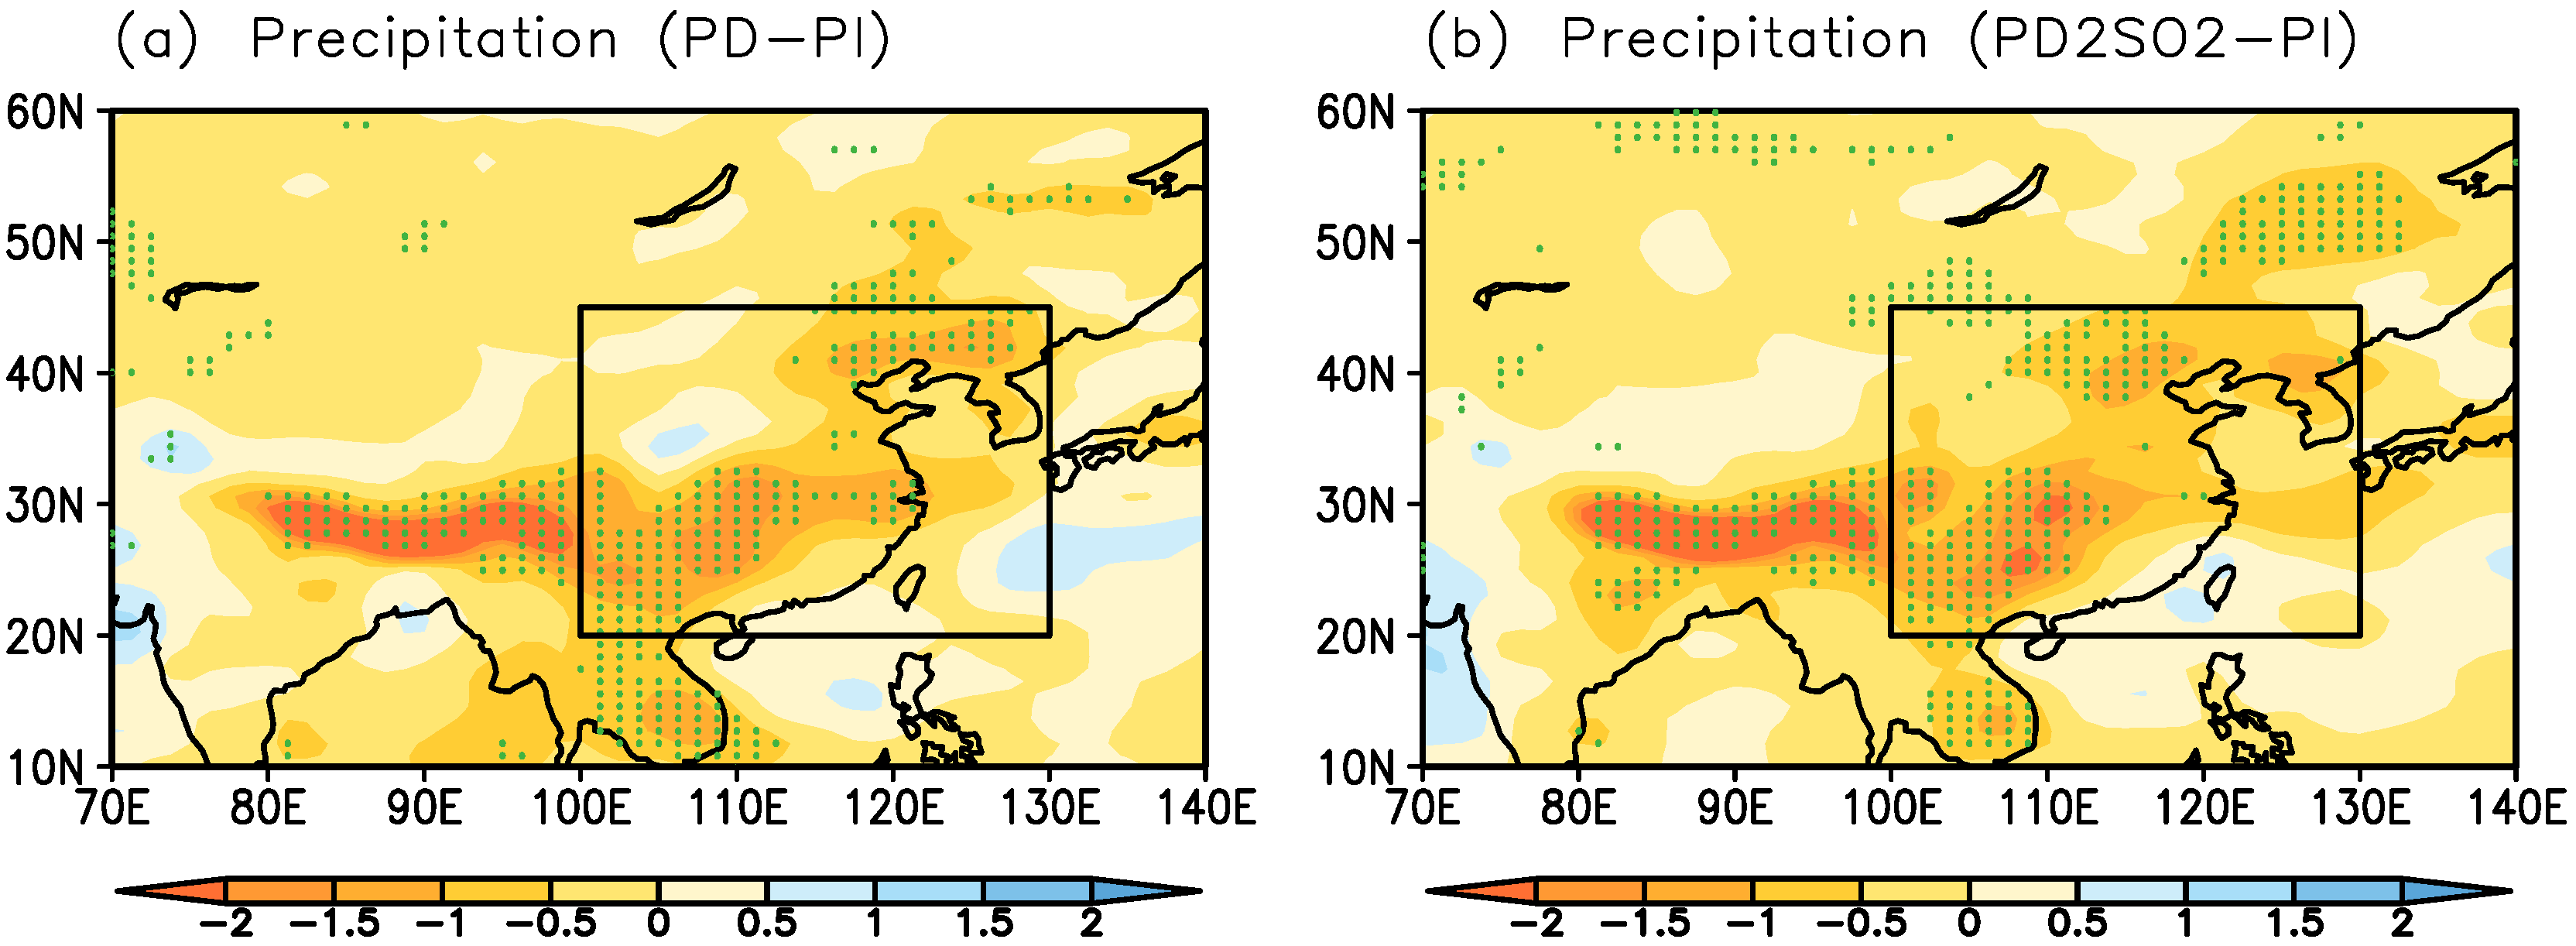
3.3. Aerosol Effects on East Asian Climate

It is known that the southerly monsoonal winds in the lower troposphere dominate the East Asian monsoon region in summer, which can bring a large amount of water vapor to this region from the Pacific and Indian Oceans. Hence, the averaged meridional wind at 850 hPa in East Asia in summer is adopted to measure the large-scale intensity of the EASM [18]. Figure 5a shows the difference in the summer 850 hPa wind field between the PD and PI experiments (PD−PI). The southerly winds over East Asia in the PD simulation are weaker than those in the PI simulation, suggesting that the atmospheric circulation of the EASM can be significantly weakened due to anthropogenic aerosols. The large-scale intensity of the EASM decreases by −0.41 m·s 1 (by −9.3%) with the increase in anthropogenic aerosols in Table 2. It is evident that anthropogenic aerosols result in a decrease in the surface temperature (−0.35 C ) and an increase in the sea level pressure (0.43 hPa) over East Asia. This further leads to a reduction in the land-sea thermal and pressure gradients, thus weakening the atmospheric circulations of the EASM and suppressing the water vapor transport from the ocean into East Asia. These aerosol-induced changes are consistent with the previous results from Liu et al. [13] Jiang et al. [14], Wang et al. [15], Wang et al. [16] and Xie et al. [18].
Figure 5b shows the weakening of the EASM with the doubling of SO2 emissions over East Asia, where the large-scale intensity of the EASM is decreased by −0.43 m s 1 (−9.7%) in Table 2. However, two points of comparisons are evident between PD−PI and PD2SO2−PI in Figure 5 and Table 2. First, the decrease in the large-scale EASM intensity only changes from −0.41 m·s 1 (−9.3%) to −0.43 m·s 1 (−9.7%) with doubling of SO 2 emissions over East Asia. Second, the area of the aerosol-weakened EASM that passes the two-tailed t-test at the 5% significance level is not much larger for PD2SO2−PI than that for PD−PI. Hence, the weakening of the EASM is not significantly enhanced when SO 2 emissions over East Asia are doubled (PD2SO2), compared with PD. Due to the slight change in the aerosol total radiative forcing, the decrease in surface temperature and increase in sea level pressure over East Asia are not significantly increased when the SO 2 emissions are doubled (Table 2).
Figure 6 shows the difference in summer precipitation (including convective and large-scale precipitation) caused by anthropogenic aerosols between PD−PI and PD2SO2−PI. With increased anthropogenic aerosols (PD), the summer precipitation is significantly suppressed over East Asia in Figure 6a, with a reduction of −0.54 mm day 1 (or −9.3%) in Table 2. With the doubling of SO 2 emissions over East Asia, the reduction in summer precipitation is not significantly enhanced due to insignificant changes in the weakening of the EASM. Hence, our results show that the large-scale intensity of the EASM and the associated summer precipitation are insensitive to the doubling of SO 2 emissions over East Asia in comparison with PD.

4. Discussion

The following three findings are worthy of discussion. First, the simulated values of the AOD with the doubling of SO 2 emissions over East Asia are also lower than the observational results from MODIS. The reason for the underestimation may be that we only double the SO 2 emissions, but not those of other anthropogenic aerosols (including primary organic matter and black carbon). Doubling primary organic matter and black carbon emissions would further enhance the simulated AOD, and the results may be much closer to those from MODIS. Second, the AIF has greater uncertainty than the ADF due to the complexity of aerosol-cloud-radiation interactions [5,6]. Hence, the accurate parametrization of aerosol-cloud-radiation interactions would help to decrease the uncertainty of the AIF and enhance our understanding of the effects of anthropogenic aerosol on the climate over East Asia. Third, it is important to note that we focus on the fast response to anthropogenic aerosols and do not consider the slow response to sea surface temperature changes. However, Gangult et al. [28] showed the importance of the slow response induced by anthropogenic aerosols on the atmospheric circulations of the Asian monsoon and the associated summer precipitation. It would be interesting to study the slow response induced by aerosols on the East Asian climate in the future.

5. Conclusions

In this study, we investigated the effects of anthropogenic aerosols on radiative forcing and the climate over East Asia by considering different SO 2 emission levels using the CAM5.1 model. We used a higher horizontal resolution with 0.9 × 1.25 and the 30 vertical levels, because a higher horizontal resolution model allows a better simulation of AIF compared with observations [25]. The numerical experiments in CAM5.1 were conducted with PI and PD aerosol emissions, and with PD aerosol emissions including double SO 2 emissions over East Asia (PD2SO2).
The results show that compared to PD, the simulated AOD and the simulated surface sulfate concentration over East Asia increase significantly when using the double SO 2 emissions over East Asia (PD2SO2), which is in better agreement with the observational results derived from MODIS and the 11 CAWNET stations. The simulated results show that there is a large ADF and a large AIF for PD−PI, which significantly weakens the large-scale intensity of the EASM and reduces the summer precipitation. The ADF increases significantly when SO 2 emissions over East Asia (PD2SO2) are doubled in comparison with PD, whereas the AIF significantly decreases due to the inhibition of cloud formation, especially over North China. The increase in the ADF and decrease in the AIF result in insignificant changes in the aerosol total radiative forcing. The doubling of SO2 emissions over East Asia suppresses cloud formation through two main mechanisms. First, the larger AOD over East Asia cools the surface, stabilizes the boundary layer, and suppresses the convective motion to suppress cloud formation. Second, the larger AOD over East Asia results in a decrease in the surface temperature, an increase in the sea level pressure over East Asia, and weaker changes in the EASM circulation, which decreases the water vapor flux from the ocean. The decrease in water vapor flux from the ocean suppresses the cloud formation over East Asia. These results also show that compared to PD, the large-scale intensity of the EASM and the associated summer precipitation are insensitive to the doubling of SO 2 emissions over East Asia due to the slight change in the aerosol total radiative forcing.
Our results suggest that the ADF, AIF, and aerosol total radiative forcing can increase significantly with increasing aerosol emissions under clean backgrounds over East Asia, which results in the weakening of the EASM and the reduction of summer precipitation. However, with increasing aerosol emissions under polluted backgrounds over this region, the ADF continuously increases, whereas the AIF decreases due to the inhibition of cloud formation, which indicates that the aerosol total radiative forcing cannot be changed significantly. Hence, there are only slight changes in the large-scale intensity of the EASM and the associated summer precipitation.

Supplementary Materials

The following are available online at www.mdpi.com/2073-4433/7/8/99/s1, Figure S1: Difference in the cloud amount (%) including low cloud cover (CLDLOW), mid-level cloud cover (CLDMED), high cloud cover (CLDHGH) and total cloud cover (CLDTOT) for PD−PI and for PD2SO2−PI.

Acknowledgments

This work was jointly supported by National Key Research and Development Program of China (2016YFA0601904) and the National Natural Science Foundation of China (41290255, 41572150).

Author Contributions

Xiaoning Xie and Xiaodong Liu conceived and designed the experiments; Xiaoning Xie performed the experiments, analyzed the data and wrote the manuscript; Xiaodong Liu, Hongli Wang and Zhaosheng Wang commented on the manuscript.

Conflicts of Interest

The authors declare no conflict of interest.

References

  1. Zhang, X.Y.; Wang, Y.Q.; Niu, T.; Zhang, X.C.; Gong, S.L.; Zhang, Y.M.; Sun, J.Y. Atmospheric aerosol compositions in China: Spatial/temporal variability, chemical signature, regional haze distribution and comparisons with global aerosols. Atmos. Chem. Phys. 2012, 12, 779–799. [Google Scholar] [CrossRef]
  2. Lau, K.-M.; Tsay, S.C.; Hsu, C.; Chin, M.; Ramanathan, V.; Wu, G.X.; Li, Z.; Sikka, R.; Holben, B.; Lu, B.; et al. The joint Aerosol-Monsoon experiment: A new challenge for Monsoon climate research. Bull. Am. Meteorol. Soc. 2008, 89, 369–383. [Google Scholar] [CrossRef]
  3. Li, Z.; Li, C.; Chen, H.; Tsay, S.-C.; Holben, B.; Huang, J.; Li, B.; Maring, H.; Qian, Y.; Shi, G.; et al. East Asian studies of tropospheric aerosols and their impact on regional climate (EASTAIRC): An overview. J. Geophys. Res. 2011, 116, D00K34. [Google Scholar]
  4. Wu, G.X.; Li, Z.Q.; Fu, C.B.; Zhang, X.Y.; Zhang, R.Y.; Zhang, R.H.; Zhou, T.J.; Li, J.P.; Li, J.D.; Zhou, D.G.; et al. Advances in studying interactions between aerosols and monsoon in China. Sci. China Earth Sci. 2016, 59, 1–16. [Google Scholar] [CrossRef]
  5. Solomon, S.; Qin, D.; Manning, M.; Chen, Z.; Marquis, M.; Averyt, K.B.; Tignor, M.; Miller, H.L. IPCC, 2007: Climate change 2007: The Physical Science Basis. Contribution of Working Group I to the Fourth Assessment Report of the Intergovernmental Panel on Climate Change; Cambridge University Press: Cambridge, UK; New York, NY, USA, 2007. [Google Scholar]
  6. Stocker, T.F.; Qin, D.; Plattner, G.-K.; Tignor, M.; Allen, S.K.; Boschung, J.; Nauels, A.; Xia, Y.; Bex, V. (Eds.) IPCC, 2013: Climate change 2013: The Physical Science Basis. Contribution of Working Group I to the fifth assessment report of the Intergovernmental Panel on Climate Change; Cambridge University Press: Cambridge, UK; New York, NY, USA, 2013.
  7. Twomey, S.A. The influence of pollution on the shortwave albedo of clouds. J. Atmos. Sci. 1977, l34, 1149–1152. [Google Scholar] [CrossRef]
  8. Albrecht, B.A. Aerosols, cloud microphysics and fractional cloudiness. Science 1989, 245, 1227–1230. [Google Scholar] [CrossRef] [PubMed]
  9. Ramanathan, V.; Crutzen, P.J.; Kiehl, J.T.; Rosenfeld, D. Aerosols, climate, and the hydrological cycle. Science 2001, 294, 2119–2124. [Google Scholar] [CrossRef] [PubMed]
  10. Meehl, G.A.; Arblaster, J.M.; Collins, W.D. Effects of black carbon aerosols on the Indian monsoon. J. Clim. 2008, 21, 2869–2882. [Google Scholar] [CrossRef]
  11. Bollasina, M.A.; Ming, Y.; Ramaswamy, V. Anthropogenic aerosols and the weakening of the South Asian summer monsoon. Science 2011, 334, 502–505. [Google Scholar] [CrossRef] [PubMed]
  12. Menon, S.; Hansen, J.; Nazarenko, L.; Luo, Y.F. Climate effects of black carbon aerosols in China and India. Science 2002, 297, 2250–2253. [Google Scholar] [CrossRef] [PubMed]
  13. Liu, X.D.; Xie, X.N.; Yin, Z.-Y.; Liu, C.H.; Gettelman, A. A modeling study of the effects of aerosols on clouds and precipitation over East Asia. Theor. Appl. Climatol. 2011, 106, 343–354. [Google Scholar] [CrossRef]
  14. Jiang, Y.; Liu, X.; Yang, X.-Q.; Wang, M. A numerical study of the effect of different aerosol types on East Asian summer clouds and precipitation. Atmos. Environ. 2013, 70, 51–63. [Google Scholar] [CrossRef]
  15. Wang, H.L.; Xie, X.N.; Liu, X.D. On the robustness of the weakening effect of anthropogenic aerosols on the East Asian summer monsoon with multimodel results. Adv. Meteorol. 2015, 2015, 397395. [Google Scholar] [CrossRef]
  16. Wang, T.J.; Zhuang, B.L.; Li, S.; Liu, J.; Xie, M.; Yin, C.Q.; Zhang, Y.; Yuan, C.; Zhu, J.L.; Ji, L.Q.; et al. The interactions between anthropogenic aerosols and the East Asian summer monsoon using RegCCMS. J. Geophys. Res. Atmos. 2015, 120, 5602–5621. [Google Scholar] [CrossRef]
  17. Li, S.; Wang, T.; Solmon, F.; Zhuang, B.; Wu, H.; Xie, M.; Han, Y.; Wang, X. Impact of aerosols on regional climate in southern and northern China during strong/weak East Asian summer monsoon years. J. Geophys. Res. Atmos. 2016, 121, 4069–4081. [Google Scholar] [CrossRef]
  18. Xie, X.N.; Wang, H.L.; Liu, X.D.; Li, J.D.; Wang, Z.S.; Liu, Y.G. Distinct effects of anthropogenic aerosols on the East Asian summer monsoon between multi-decadal strong and weak monsoon stages. J. Geophys. Res. Atmos. 2016, 121, 7026–7040. [Google Scholar] [CrossRef]
  19. Cao, G.L.; Zhang, X.Y.; Gong, S.L.; An, X.; Wang, Y. Emission inventories of primary particles and pollutant gases for China. Chin. Sci. Bull. 2011, 56, 781–788. [Google Scholar] [CrossRef]
  20. Liu, X.; Easter, R.C.; Ghan, S.J.; Zaveri, R.; Rasch, P.; Shi, X.; Lamarque, J.-F.; Gettelman, A.; Morrison, H.; Vitt, F.; et al. Towards a minimal representation of aerosol direct and indirect effects: Model description and evaluation. Geosci. Model Dev. 2012, 5, 709–735. [Google Scholar] [CrossRef]
  21. Neale, R.B.; Chen, C.-C.; Gettelman, A.; Lauritzen, P.H.; Park, S.; Williamson, D.L.; Conley, A.J.; Garcia, R.; Kinnison, D.; Lamarque, J.-F.; et al. Description of the NCAR Community Atmosphere Model (CAM5.0); NCAR/TN-486 + STR; National Center for Atmospheric Research: Boulder, CO, USA, 2010. [Google Scholar]
  22. Morrison, H.; Gettelman, A. A new two-moment bulk stratiform cloud microphysics scheme in the NCAR Community Atmosphere Model (CAM3), Part I: Description and numerical tests. J. Clim. 2008, 21, 3642–3659. [Google Scholar] [CrossRef]
  23. Ghan, S.J.; Liu, X.; Easter, R.C.; Zaveri, R.; Rasch, P.J.; Yoon, J.H.; Eaton, B. Toward a minimal representation of aerosols in climate models: Comparative decomposition of aerosol direct, semidirect, and indirect radiative forcing. J. Clim. 2012, 25, 6461–6476. [Google Scholar] [CrossRef]
  24. Ghan, S.J. Technical note: Estimating aerosol effects on cloud radiative forcing. Atmos. Chem. Phys. 2012, 13, 9971–9974. [Google Scholar]
  25. Ma, P.-L.; Rasch, P.J.; Wang, M.; Wang, H.; Ghan, S.J.; Easter, R.C.; Gustafson, W.I., Jr.; Liu, X.; Zhang, Y.; Ma, H.-Y. How does increasing horizontal resolution in a global climate model improve the simulation of aerosol-cloud interactions? Geophys. Res. Lett. 2015, 42, 5058–5065. [Google Scholar] [CrossRef]
  26. Kaufman, Y.J.; Tanré, D.; Remer, L.A.; Vermote, E.F.; Chu, A.; Holben, B.N. Operational remote sensing of tropospheric aerosol over land from EOS moderate resolution imaging spectroradiometer. J. Geophys. Res. 1997, 102, 17051–17067. [Google Scholar] [CrossRef]
  27. Xie, X.N.; Liu, X.D.; Peng, Y.; Wang, Y.; Yue, Z.G.; Li, X.Z. Numerical simulation of clouds and precipitation depending on different relationships between aerosol and cloud droplet spectral dispersion. Tellus B 2013, 65, 19054. [Google Scholar] [CrossRef]
  28. Ganguly, D.; Rasch, P.J.; Wang, H.; Yoon, J.-H. Fast and slow responses of the South Asian monsoon system to anthropogenic aerosols. Geophys. Res. Lett. 2012, 39, L18804. [Google Scholar] [CrossRef]
Figure 1. Spatial distribution of the aerosol optical depth (AOD) (550 nm) in summer derived from (a) MODIS; (b) present day (PD); (c) PD2SO2; and (d) pre-industrial (PI). The box indicates the East Asian region defined in this study (20 N−45 N, 100 E−130 E); (e) Comparison of the mean AOD in summer over East Asia between MODIS and the model, where the error bars represent the standard deviation of AOD.
Atmosphere 07 00099 g001
Figure 2. Spatial distributions of the surface sulfate concentration in summer derived from (a) PD and (b) PD2SO2, where the locations with small circles are the observed stations over East Asia (1, Chengdu; 2, Dalian; 3, Gaolanshan; 4, Gucheng; 5, Jinsha; 6, LinAn; 7, Nanning; 8, Panyu; 9, Taiyangshan (Changde); 10, Xian; 11, Zhengzhou); (c) Comparison of the observed and modeled surface sulfate concentration in summer over East Asia.
Atmosphere 07 00099 g002
Figure 3. Spatial distribution of (a, b) aerosol direct radiative forcing (ADF, W·m 2 ), (c, d) aerosol indirect radiative forcing (AIF, W·m 2 ), and (e, f) aerosol total radiative forcing (ADF + AIF, W·m 2 ) in summer for PD−PI and for PD2SO2−PI, respectively. The dots represent the grid points where the changes pass the two-tailed t-test at the 5% significance level. The box indicates the East Asian region defined in this study (20 N−45 N, 100 E−130 E).
Atmosphere 07 00099 g003
Figure 4. Mean values of aerosol direct radiative forcing (ADF, W·m 2 ), aerosol indirect radiative forcing (AIF, W·m 2 ), and aerosol total radiative forcing (ADF + AIF, W·m 2 ) in summer over East Asia (20 N−45 N, 100 E−130 E) for PD−PI and for PD2SO2−PI.
Atmosphere 07 00099 g004
Figure 5. Difference in summer mean 850 hPa winds (m s 1 ) for (a) PD−PI and (b) PD2SO2−PI. The grey shaded area represents the grid points where the changes pass the two-tailed t-test at the 5% significance level, and the yellow shaded area indicates the plateau above 2000 m. The box indicates the East Asian region defined in this study (20 N−45 N, 100 E−130 E).
Atmosphere 07 00099 g005
Figure 6. Difference in summer precipitation (mm day 1 ) for (a) PD−PI and (b) PD2SO2−PI. The dots represent the grid points where the changes pass the two-tailed t-test at the 5% significance level. The box indicates the East Asian region defined in this study (20 N−45 N, 100 E−130 E).
Atmosphere 07 00099 g006
Table 1. Descriptive statistics for liquid water path (LWP), column cloud droplet concentration (CDNUMC), cloud droplet effective radius at 850 hPa (Re), low cloud cover (CLDLOW), mid-level cloud cover (CLDMED), high cloud cover (CLDHGH), total cloud cover (CLDTOT), intergraded water vapor flux (WVF), intergraded water vapor flux convergence (WVFC), and 500 hPa vertical velocity (OMEGA) in summer over East Asia (20 N−45 N, 100 E−130 E) for PI and the corresponding difference for PD−PI and PD2SO2−PI. The symbol (*) represents a statistically significant difference at the 0.05 level between PD and PI or PD2SO2 an PI (two-tailed).
PIPD−PIPD2SO2−PI
LWP (g·m 2 )77.1020.90 *22.35 *
CDNUMC ( 10 6 cm 2 )1.292.49 *2.81 *
RE ( μ m)10.01−1.39 *−1.51 *
CLDLOW (%)29.390.230.06
CLDMED (%)25.760.04−0.14
CLDHGH (%)58.30−1.63−0.97
CLDTOT (%)68.33−0.90−0.53
WVF (kg·m 1 ·s 1 )180.25−14.19 *−14.65 *
WVFC (10 5 kg·m 2 ·s 1 )−3.680.55 *0.58 *
OMEGA (0.01 × Pa·s 1 )−2.560.40 *0.45 *
Table 2. Descriptive statistics for surface temperature (TS), sea-level pressure (SLP), large-scale EASM intensity (EASMI), and surface precipitation (PRECT) in summer over East Asia (20 N−45 N, 100 E−130 E) for PI and the corresponding difference (including the percent change in EASMI and PRECT) for PD−PI and PD2SO2−PI.
PIPD−PIPD2SO2−PI
TS ( C )25.40−0.35−0.37
SLP (hPa)1005.490.430.45
EASMI (m·s 1 )4.42−0.41(−9.3%)−0.43(−9.7%)
PRECT (mm·day 1 )5.74−0.54(−9.3%)−0.61(−10.7%)

