Article

Effects of Plastic Mulch on Soil Heat Flux and Energy Balance in a Cotton Field in Northwest China

1
Department of Hydraulic Engineering, State Key Laboratory of Hydroscience and Engineering, Tsinghua University, Beijing 100084, China
2
Ministry of Education Key Laboratory for Earth System Modeling, Center for Earth System Science, Tsinghua University, Beijing 100084, China
*
Author to whom correspondence should be addressed.
Atmosphere 2016, 7(8), 107; https://doi.org/10.3390/atmos7080107
Submission received: 5 July 2016 / Revised: 10 August 2016 / Accepted: 11 August 2016 / Published: 19 August 2016

Abstract

:
Surface energy balance (SEB) is a basic principle for all of the atmospheric circulation models, and surface soil heat flux (G0) is an important component of energy balance. Plastic mulch is widely used in arid regions and alters land surface processes. In this study, hourly/daily G0 and SEB over a mulched cotton field were analyzed in Northwest China. The net radiation beneath the mulch was simulated using transmitted down short-wave and down long-wave radiation through the mulch and up short-wave and up long-wave radiation from the soil beneath mulch. The results show that: (1) on the hourly time scale, G0 in mulched soil is much smaller than that in non-mulched soil, day and night. This implies that mulch prevents energy going into the soil during the daytime and reduces soil heat loss at night. On the daily time scale, G0 is similar in mulched and non-mulched soil. (2) During the seedling emergence period when the cotton is small, the energy balance closure over mulched soil (0.79) is slightly smaller than that over non-mulched soil (0.81). (3) Comparing to soil temperature in non-mulched soil, there’s a time offset on soil temperature in mulched soil at the same depth, which will bring a hysteresis on G0 and SEB.

1. Introduction

Energy exchange between the surface and the atmosphere is one of the most crucial ecological processes in terrestrial ecosystems [1,2]. Surface energy balance is the basic principle for atmospheric circulation models [3] and is also essential for surface evapotranspiration estimation [4,5,6,7]. Surface soil heat flux (G0) represents the energy absorbed or released by surface soil during a given time period [2]. It is an important component of the surface energy balance. Although G0 is relatively small on daily and longer timescales, the instantaneous G0 can contribute as much as 50% of the net radiation for dry and bare soil [8,9,10,11]. G0 is also a significant component of the energy balance for vegetated surfaces [12,13] and plays an important role in estimating surface evapotranspiration [14]. Incorrect G0 is supposed to be an important reason for energy imbalance [15]. Land surface change will affect G0 and energy balance and impact atmospheric properties [16]. The land surface characteristics, such as soil moisture, surface albedo, leaf area index and roughness, are related to land surface fluxes and are important for the simulation of local and regional weather and climate variables, including air temperature, wind, humidity and precipitation [17,18,19,20,21]. The land cover change can influence the atmospheric circulation not only at meteorological timescales, but also at climatological timescales [22].
The plastic film mulching technique and drip irrigation method have been widely applied in Xinjiang in Northwest China [23]. The mulched area amounted to more than 1.2 million hectares in 2009 in Xinjiang [24]. The film mulch reduces heat convection and evaporation from the soil to the atmosphere. The mulch also changes surface albedo and soil moisture, which will impact the meteorological parameters. Moreover, the droplets on the film mulch and the water vapor in the air beneath the film mulch can absorb long-wave radiation, resulting in more soil heating due to the greenhouse effect [25]. The soil thermal and moisture conditions are improved by mulch to ensure crop germination and small plant growth [24,26,27,28]. The mulch promotes crop development and yield [29]. Polythene mulch increased soil temperature by approximately 6 °C at a 5-cm depth in northern Vietnam [29] and by 1.6 °C at a 15-cm depth in Xinjiang, China [30]. Mulch greatly retards the loss of moisture from soil, which reduces the irrigation frequency and amount [29]. The mulch is also beneficial for disease control [25].
The mulch alters matter and energy exchanges and affects land surface processes, which has attracted substantial research. Previous studies mainly focused on the effect of mulch on soil temperature, crop growth and yield, while few research studies address its effect on the soil heat flux and energy balance. The present study will explore how the plastic mulch affects the soil heat flux and energy balance with 3-year (2013–2015) continuous observations at the Korla cotton site in Xinjiang, Northwest China. The surface soil heat flux was calculated by the thermal conduction equation using the observed soil temperature and moisture profile. The air heat storage and atmospheric moisture change were taken into account for energy balance, together with the observed sensible and latent heat flux by an eddy covariance system (EC). The net radiation beneath the mulch is essential for the surface energy balance beneath the mulch. It was calculated using transmitted down short-wave and down long-wave radiation through the mulch and up short-wave and up long-wave radiation of soil beneath mulch.

2. Methods and Materials

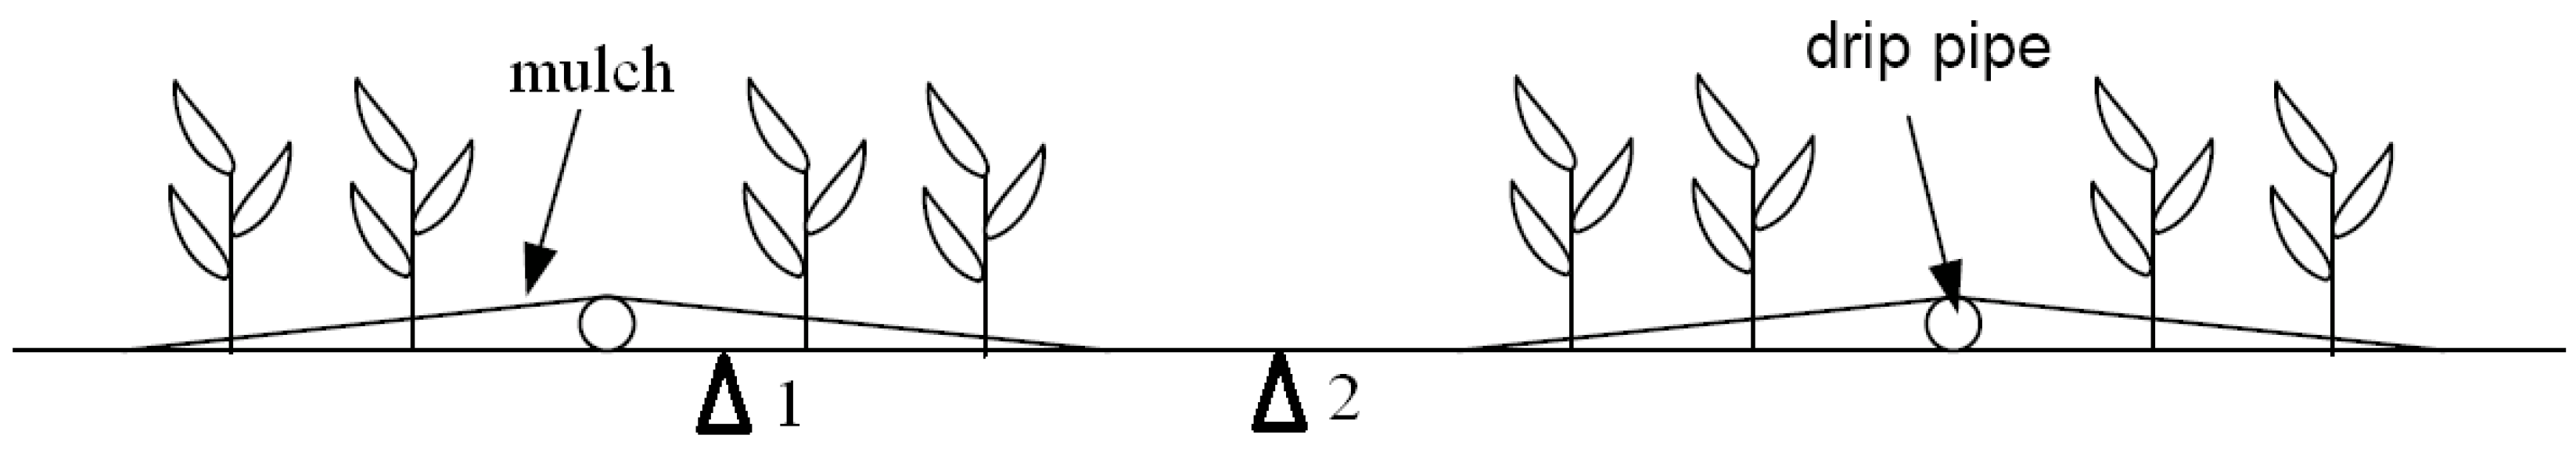
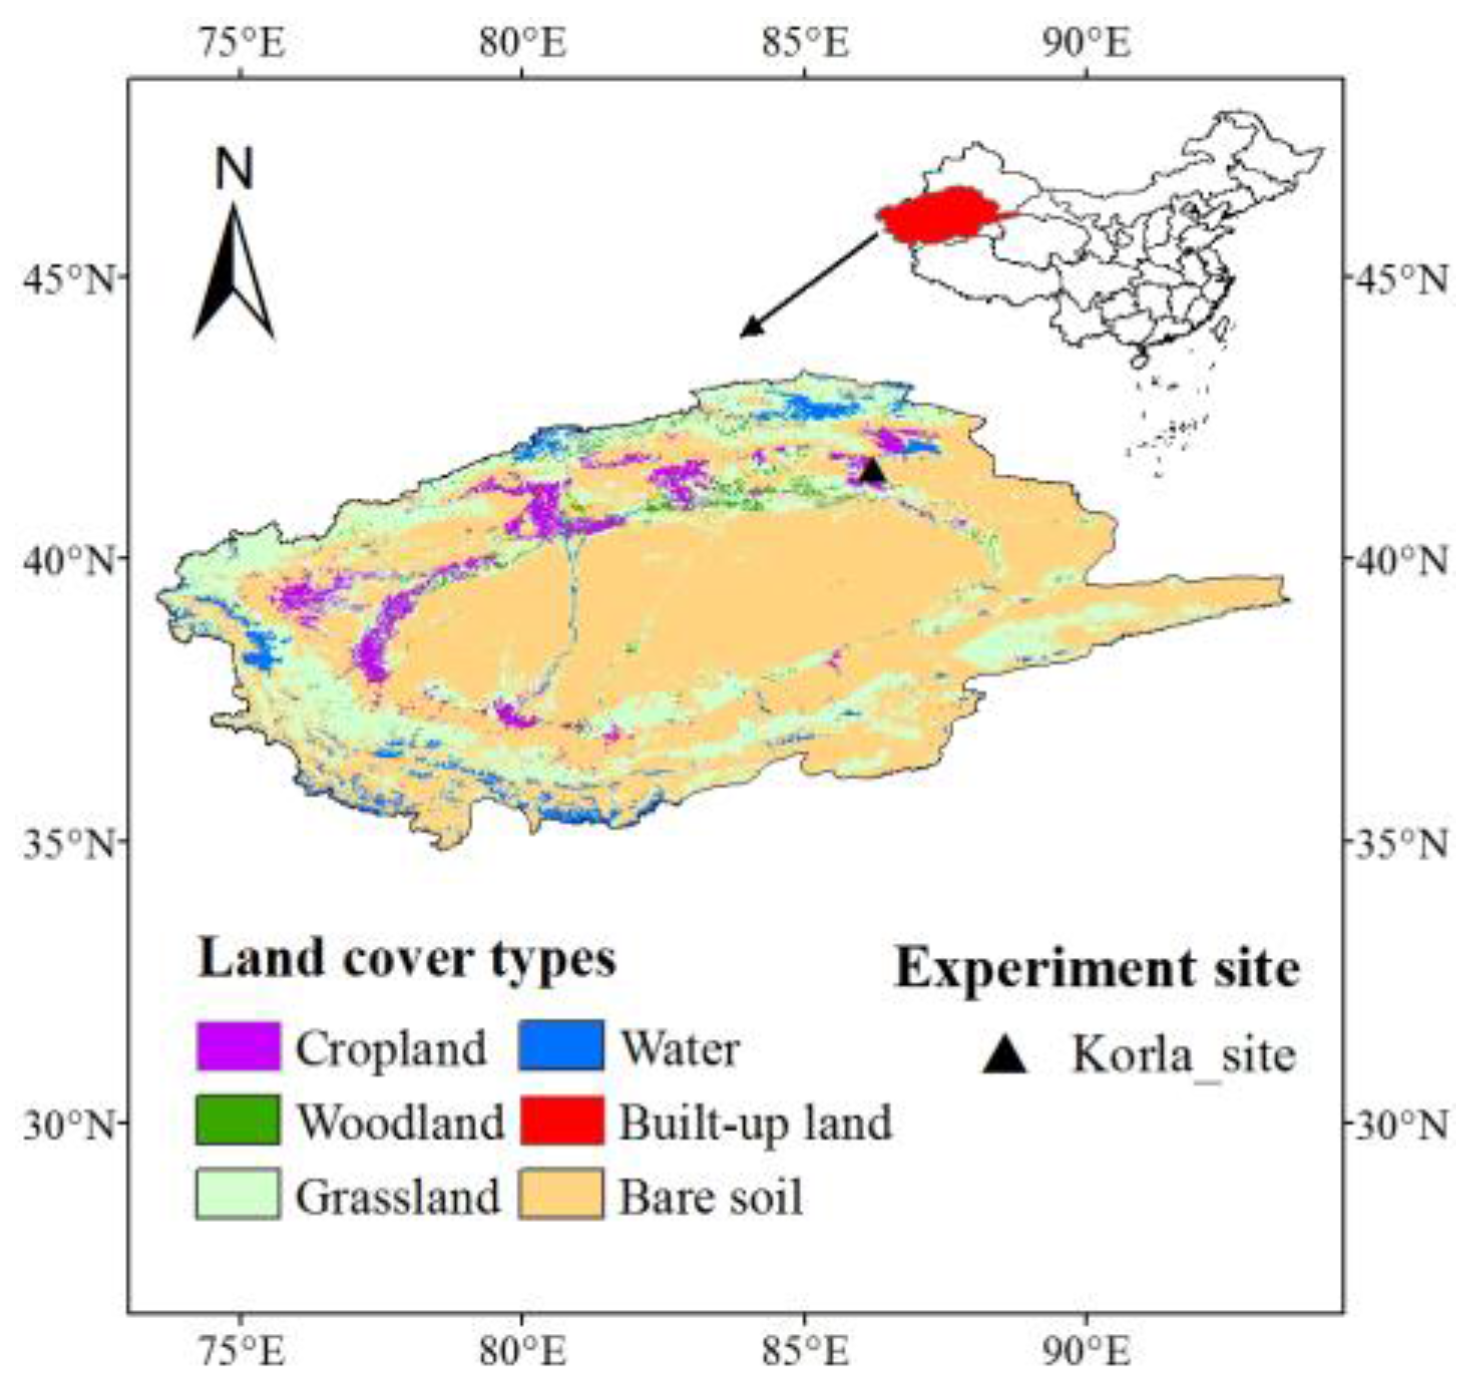
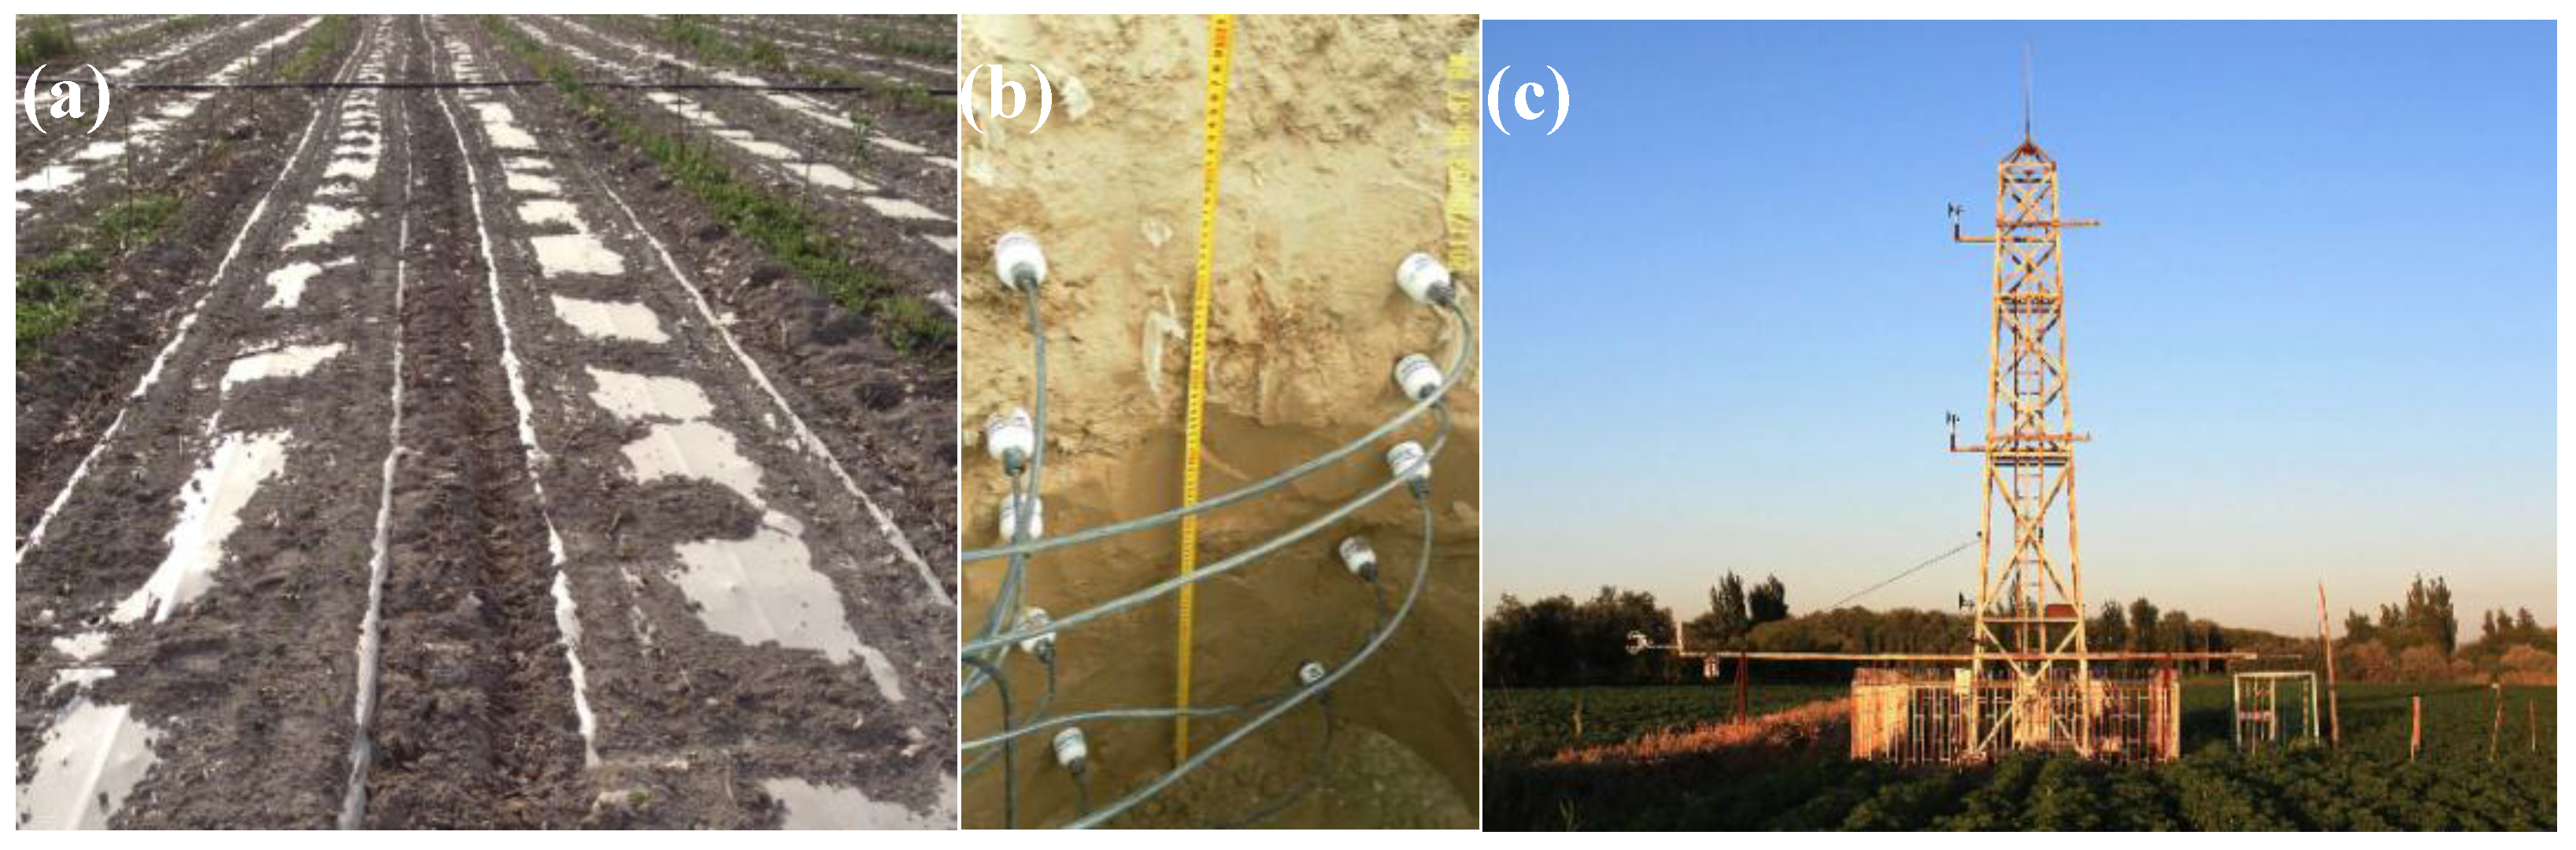
2.1. Experimental Site and Data Records

The Korla site (86°12′E, 41°36′N, 886 m a.s.l.) is located in the northeast Tarim River Basin in the Xinjiang Uygur Autonomous Region (Figure 1). It is characterized by a typical inland arid climate with scarce precipitation and strong diurnal temperature fluctuation [24]. The mean annual precipitation is approximately 60 mm, and the mean temperature is 11.48 °C [24]. The mean annual potential evaporation measured by a Φ20 evaporation pan (20 cm in diameter) is approximately 2788 mm [31]. The Korla site is covered by cotton planted in late April and harvested in September. The major soil type is silt loam. The cotton yield contributes to nearly 50% of the total lint yield of China, with approximately 3.2 million tons in 2012 [24]. The distribution of cotton planting, plastic mulch and drip pipe, shown in Figure 2, is referred to as a “one pipe, one film and four rows of cotton arrangement” [32]. The width of the mulch is approximately 110 cm, and the inter-mulch zone is approximately 40 cm.
The hourly datasets in 2013–2015 were used in the present study and included EC and automatic weather station (AWS) measurements (Figure 3). Table 1 shows detailed information on the datasets. The EC consists of an EC150 open-path CO2/H2O gas analyzer (Campbell Scientific Inc., Logan, UT, USA), a CSAT3 three-dimensional sonic anemometer (Campbell Scientific Inc., Logan, UT, USA) and an air temperature/humidity sensor (HMP155A, Vaisala Inc., Woburn, MA, USA) installed at a 2.25-m height. The EC data were recorded by a data logger (CR3000, Campbell Scientific Inc., Logan, UT, USA) at 30-min time intervals. The energy and water vapor fluxes (latent heat flux LE and sensible heat flux H) and carbon dioxide flux were measured by EC. The AWS measurements contained wind speed and direction, air temperature and pressure, precipitation, net radiation, soil temperature and soil moisture profiles. The net radiation was measured at a height of 2.25 m by a net radiometer (CNR 4, Kipp&Zonen, Delft, The Netherlands). The soil temperature and moisture were measured by a Hydra Probe® sensor (Stevens Water Monitoring System, Inc., Beaverton, OR, USA) in mulched soil and non-mulched soil, respectively (Figure 3b).
The following post-processing procedures were implemented to control the quality of the EC data: linear de-trending, tilt correction through the yaw and pitch rotation, density fluctuation correction and sonic temperature correction [24]. The datasets from 2013–2015 with a 30-min time scale were converted to hourly values in this study. Furthermore, the missing data accounted for less than 1%, and the data collected on a few rainy days were also included.

2.2. Methods

The full surface energy balance equation can be expressed as follows [33,34,35]:
R n = L E + H + G 0 + S c + S p + S a + S q + S d
where Rn is the net radiation, L (J·kg−1) is the latent heat of vaporization and E (kg·m−2·s−1) is the evaporation, the product of which is the latent heat flux. H is the sensible heat flux; G0 is the surface soil heat flux; Sc is the canopy heat storage in the biomass and water; Sp is the photosynthesis flux; Sa is the air storage between the eddy covariance system and the ground surface; Sq is the atmospheric moisture change; and Sd is the canopy dew enthalpy change (all fluxes are in W·m−2). Sc, Sp and Sd were not included in this study, as cotton plants are very small during the period for the study of energy balance.

2.2.1. Surface Soil Heat Flux

The surface soil heat flux was calculated by a “TDEC” method (thermal diffusion equation and correction) proposed by [36], using soil temperature and moisture observations that do not require accurate thermal conductivity. The equation is as follows:
G ( 0 , t ) = G ( z r e f , t ) + z r e f 0 ρ s c s T ( z , t ) t d z
where G (0, t) (W·m−2) is the surface soil heat flux at time t (s) and G (zref,t) (W·m−2) is the soil heat flux at a reference depth zref at time t, assumed to be zero if zref is deep enough. ρs (kg·m−3) is the soil bulk density, and cs (J·kg−1·K−1) is the heat capacity; the product of ρs and cs is the soil volumetric heat capacity (J·m−3·K−1). T (z,t) (K) is the soil temperature at depth z and time t.
The soil volumetric heat capacity can be obtained from the following equation:
ρ s c s = ρ s o l i d c s o l i d ( 1 θ s a t ) + ρ w c w θ
where ρsolidcsolid is the volumetric heat capacity of the soil solids, with a value of 2.1 × 10⁶ J·m−3·K−1. The uncertainty of the ρsolidcsolid value brings little uncertainty of G0. ρwcw is the volumetric heat capacity of liquid water, with a value of 4.2 × 10⁶ J·m–3·K−1. θsat (%) and θ (cm3·cm−3) are soil porosity and observed soil water content, respectively. θsat is 42% observed at the Korla site.
The key issue in calculating G0 is obtaining a reliable soil temperature profile from limited observed temperatures. Yang and Wang (2008) [36] proposed a new method for obtaining a preliminary soil temperature profile (80 layers in the present study) by the tridiagonal matrix algorithm with the T (z0) and T (zbot) as the upper and lower boundary conditions, respectively, and then adjusting the profile with the observed soil temperature. T (z0) (denoted as “Ts”) for bare soil was calculated from the upward and downward long-wave radiation fluxes:
T ( z 0 ) = ( R L ( 1 ε s ) R L ε s σ ) 1 / 4
where R L and R L are the observed upward and downward long-wave radiation fluxes (W·m−2); εs is the land surface emissivity, which is 0.96 for silt loam soils [37]; and the Stefan–Boltzmann constant is σ = 5.67 × 10⁻⁸ W·m−2·K−4 T (z0) for soil beneath mulch will be given in next section. T (zbot) is the bottom soil temperature measurement. The soil heat fluxes at different soil depths can be calculated by integrating the adjusted soil temperature profile with the bottom soil heat flux (e.g., 1.6 m) as zero. The observed soil temperature is assimilated in the process of simulating the soil temperature profile, which leads to the TDEC method’s lack of sensitivity to soil thermal conductivity that is difficult to obtain. In addition, TDEC is also not sensitive to T (z0), as it depends on multiple layers of soil temperature [38].

2.2.2. Net Radiation

The net radiation for bare soil (non-mulched) is as follows:
R n = ( 1 ρ s ) S + R L ε s σ T s 4
where Rn (W·m−2) is the surface soil net radiation, S (W·m–2) is solar radiation and rs is the surface soil reflectivity, 0.15 for silt loam soils [37]. εs is the surface soil emissivity, given as 0.96 [37].
The net radiation in the surface soil beneath mulch is as follows [39]:
R n = ( 1 r s ) τ m 1 S + τ m 2 R L + ε m σ T m 4 ε s σ T s 4
where Rn (W·m−2) is the net radiation over the soil beneath the mulch; τm1 = 0.84 and τm2 = 0.82 are the transmittances of mulch for solar radiation and thermal radiation, respectively [37]; εm is the mulch emissivity, given as 0.05 [37]; Tm (K) is the mulch temperature, and Ts′ (K) is the surface soil temperature beneath the mulch. According to the experiment, Tm was taken as the same as Ts′ in the present study. The observed R L above the mulch contains three parts: reflective R L by mulch, transmitted thermal radiation of soil beneath the mulch through the mulch ( τ m 2 ε s σ T s 4 ), and transmitted R L to soil beneath the mulch reflected by the soil and then transmitted to the air through the mulch. Thus, Ts′ can be calculated by the following equation:
ε s σ T s 4 = R L ( 1 τ m 2 ε m ) × R L ( 1 ε s ) × τ m 2 2 × R L τ m 2

2.2.3. Air Heat Storage

The air heat storage between the ground surface and the eddy covariance system is:
S a = ρ a c a 0 h T a t d z
where ρa (kg·m−3) is the air density; ca (J·kg−1·K−1) is the specific heat capacity of moist air; Ta (K) is the air temperature at 2.8 m in the present study; and h = 2.25 m is the height of the EC.

2.2.4. Atmospheric Moisture Change

The atmospheric moisture change is:
S q = L 0 h q t d z
where q (kg·m−3) is the moist air density and the latent heat of vaporization L = 2.5 × 10⁶ J·kg−1.

3. Results and Discussions

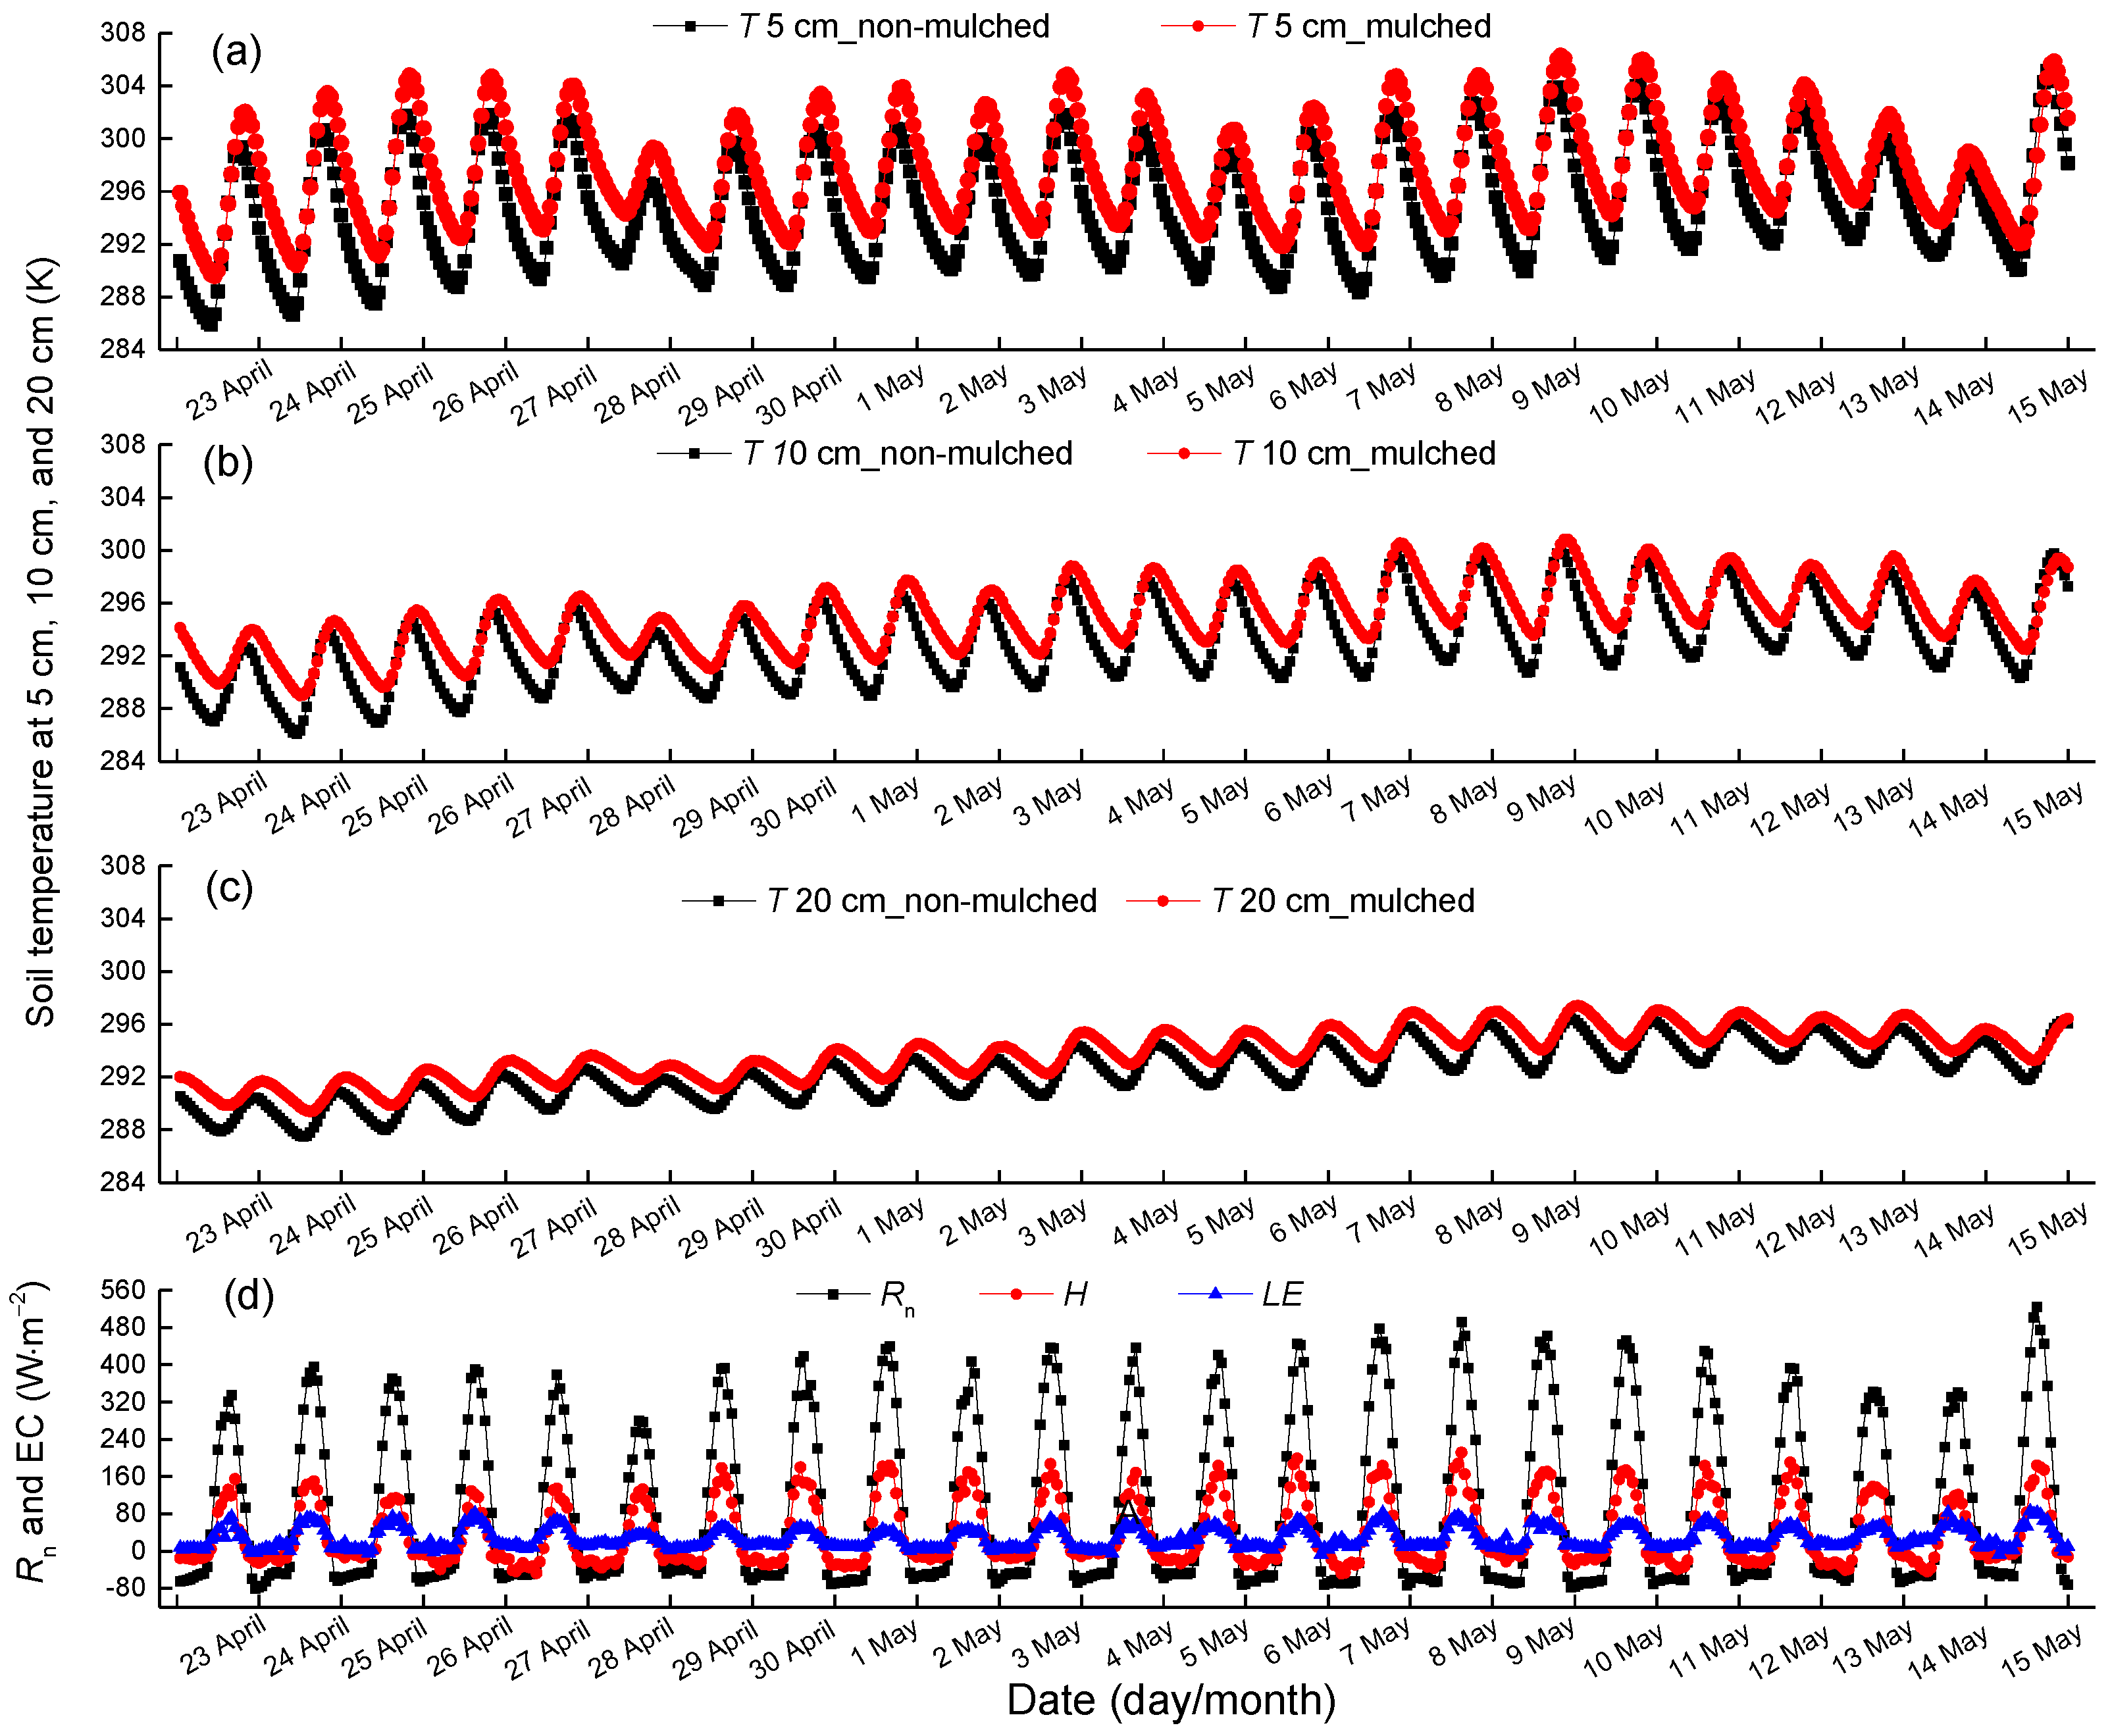
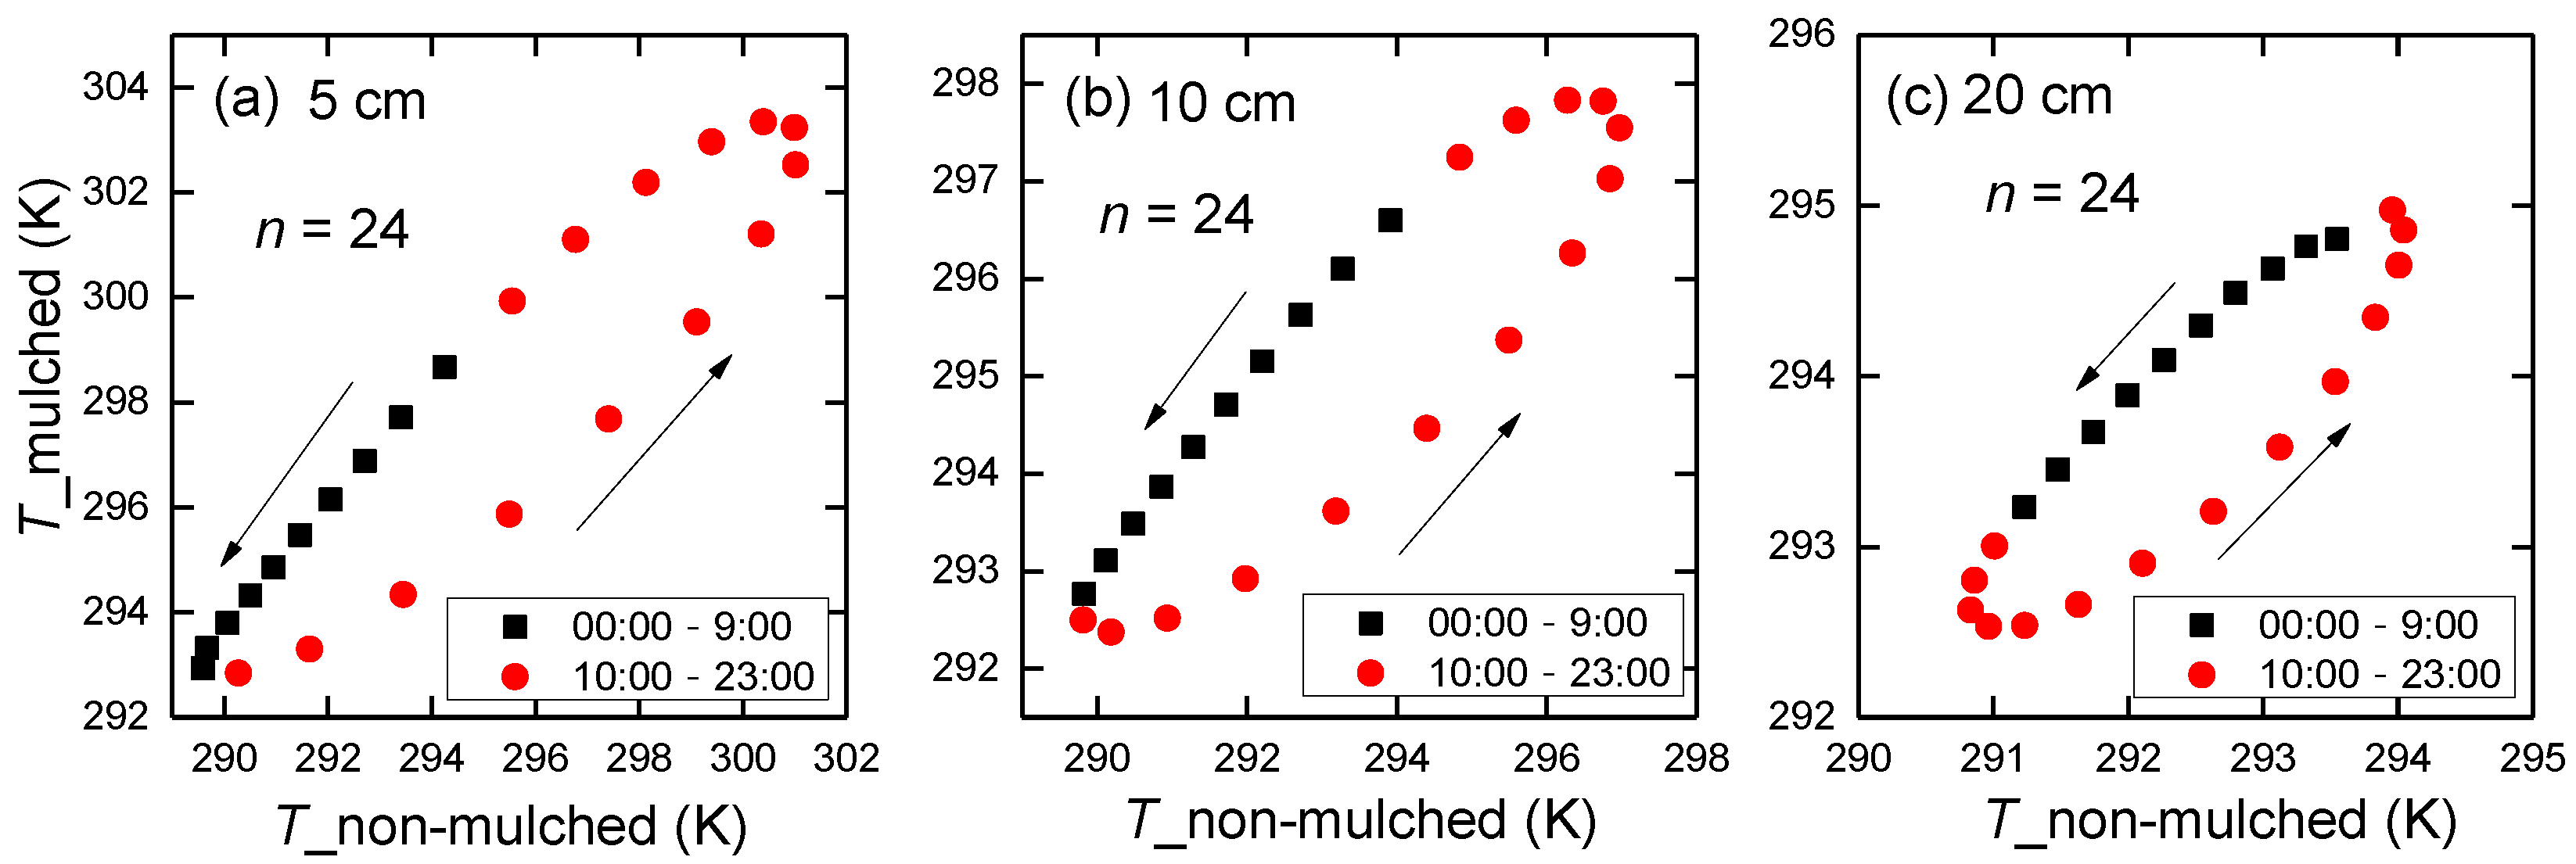
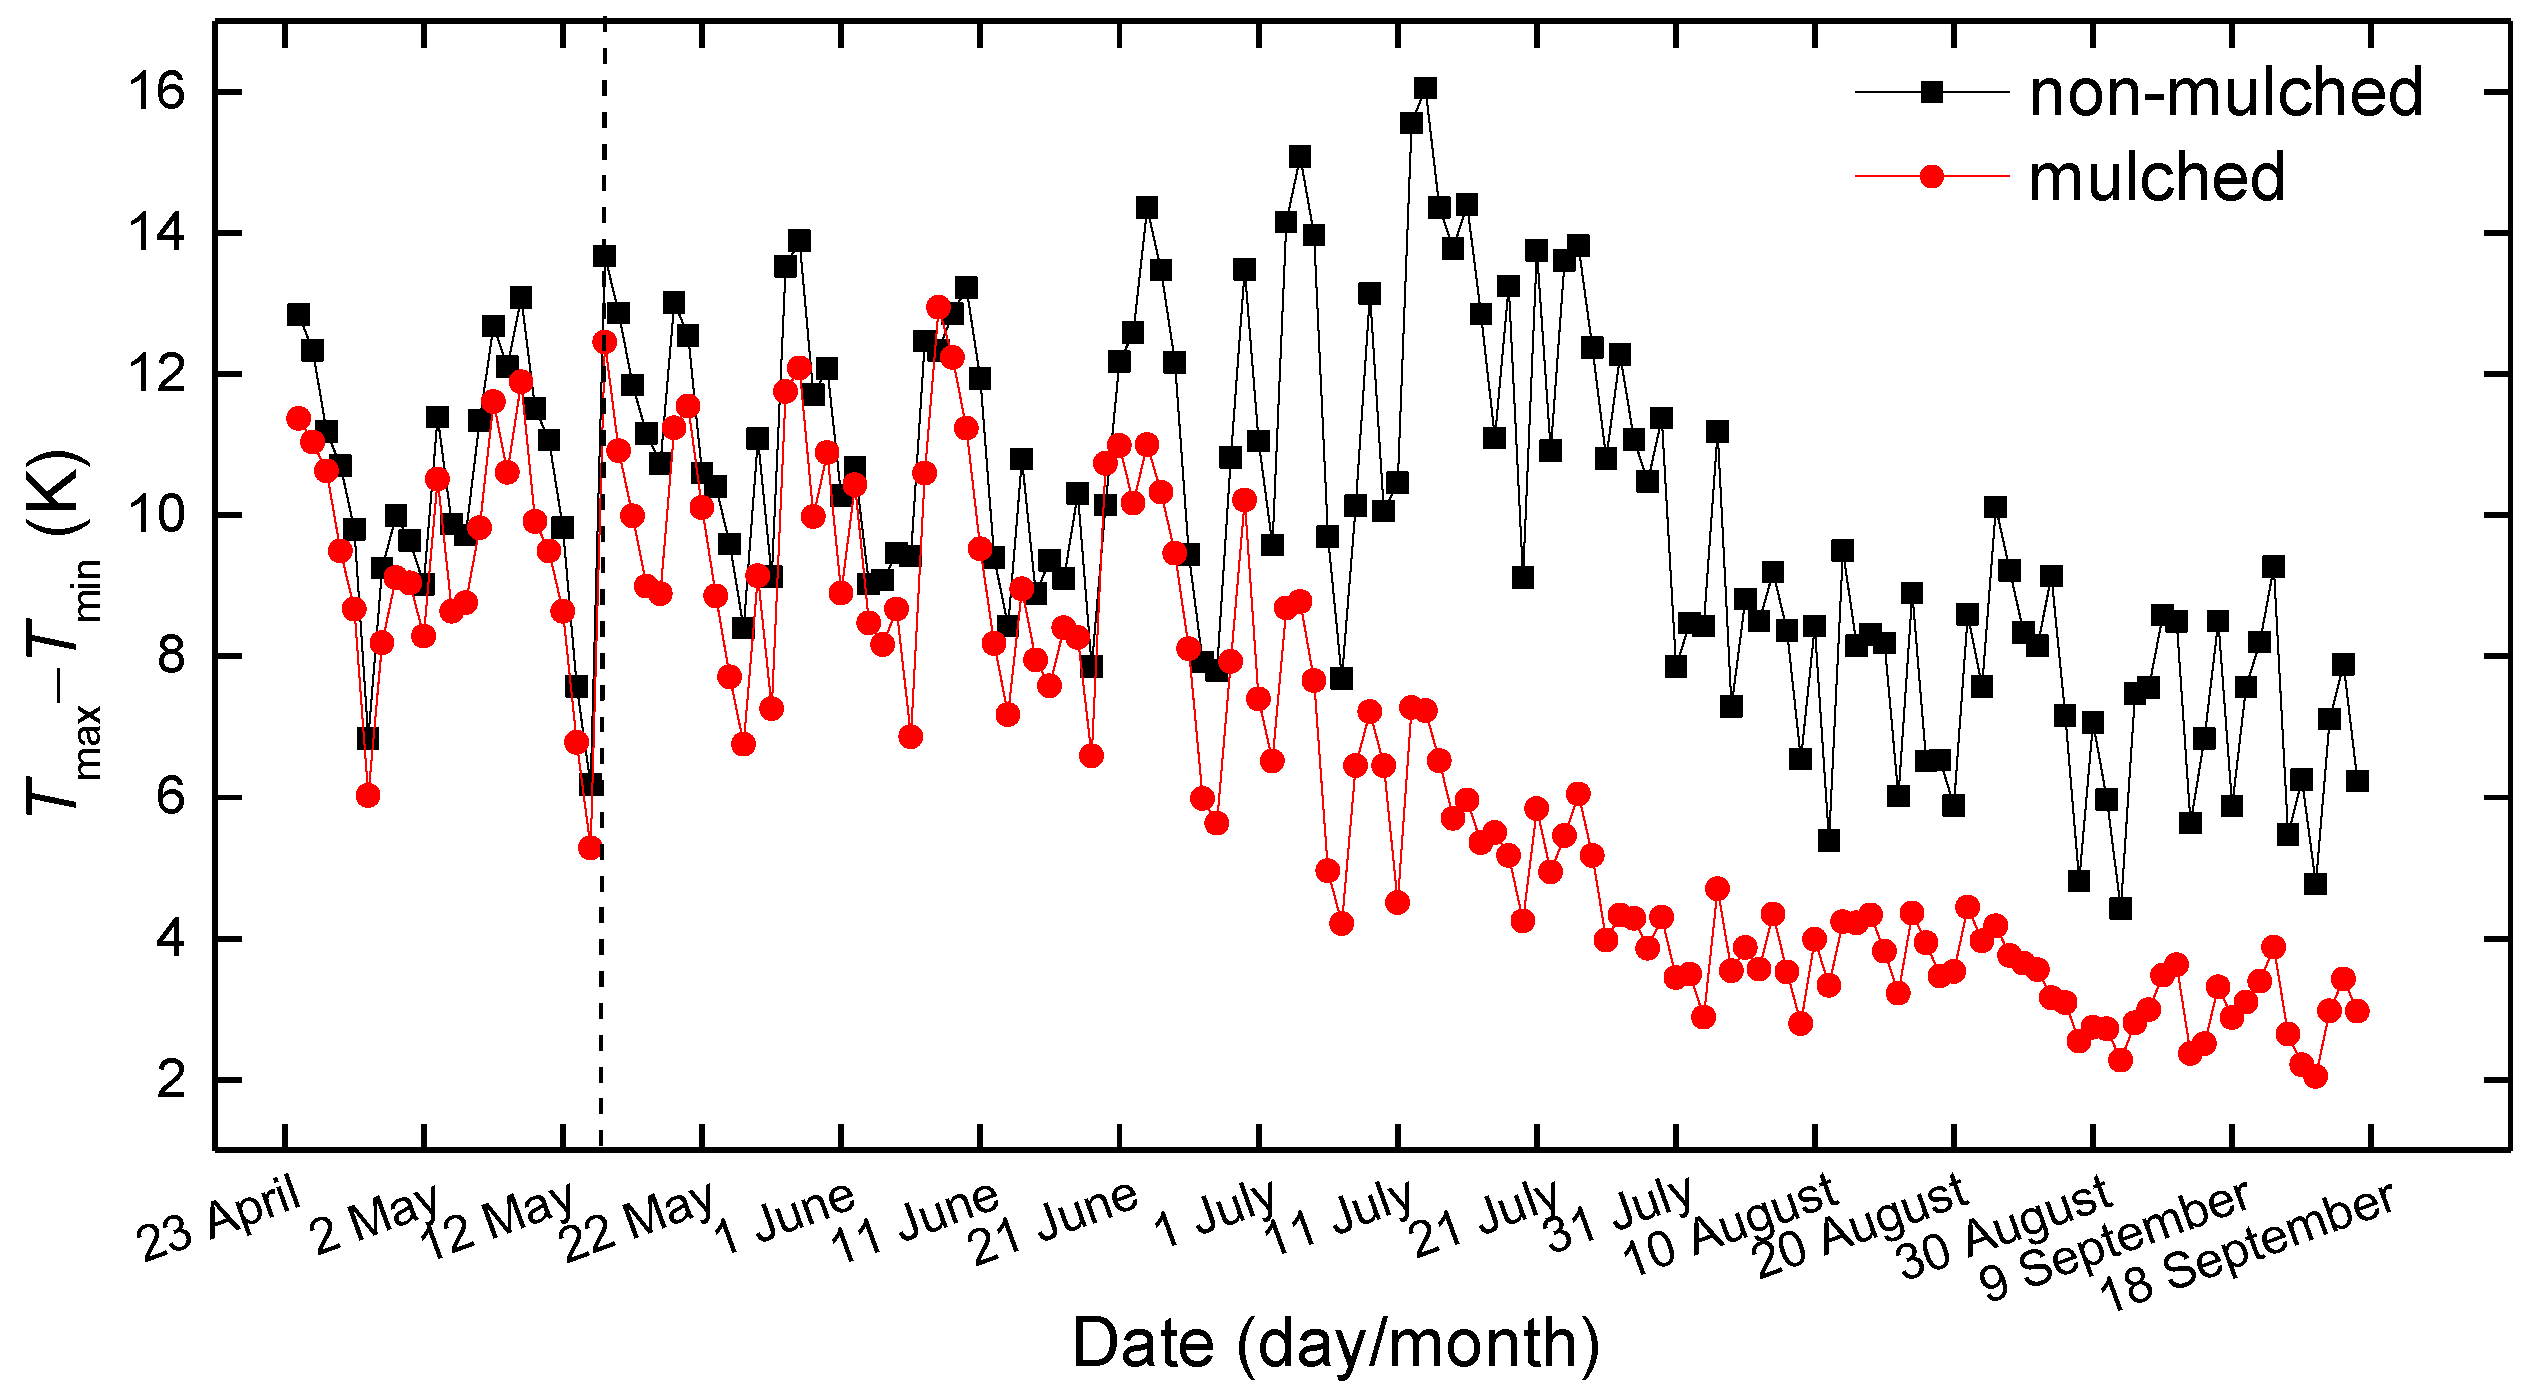
3.1. The Effect of Mulch on Soil Temperature and Energy Fluxes

The soil temperature at depths of 5 cm, 10 cm and 20 cm, as well as Rn, H and LE during the seedling emergence period, are shown in Figure 4. The seedling emergence period is from 23 April–15 May, when the cotton plants are small and there is no drip irrigation. The impact of plastic mulch on land energy/mass exchange is most obvious in this period, and the effect of vegetation on G0 and energy balance can be ignored. The soil temperature at a 5-cm depth in mulched soil is on average 2.9 °C higher than that in non-mulched soil, which shows the thermal insulation of plastic mulch. In addition, the difference of soil temperatures between non-mulched soil and mulched soil decreases as the soil depth increases. The average soil temperature differences at 10 cm and 20 cm are 1.9 °C and 1.3 °C, respectively. The amplitude of soil temperature decreases with deeper soil and the phase shift delays. LE is small, as the cotton plants are very small with less transpiration. Moreover, only soil evaporation in non-mulched soil contributes to LE. The main turbulent flux is H in this period.
There is a hysteresis between soil temperature in non-mulched soil and in mulched soil during the 3-year mean 24-h period, with a counterclockwise distribution (Figure 5). The same soil temperature in non-mulched soil corresponds to two different values in mulched soil in the morning and afternoon, respectively. It shows that the mulch delays soil temperature variation, which affects the phase of G0 in mulched soil.

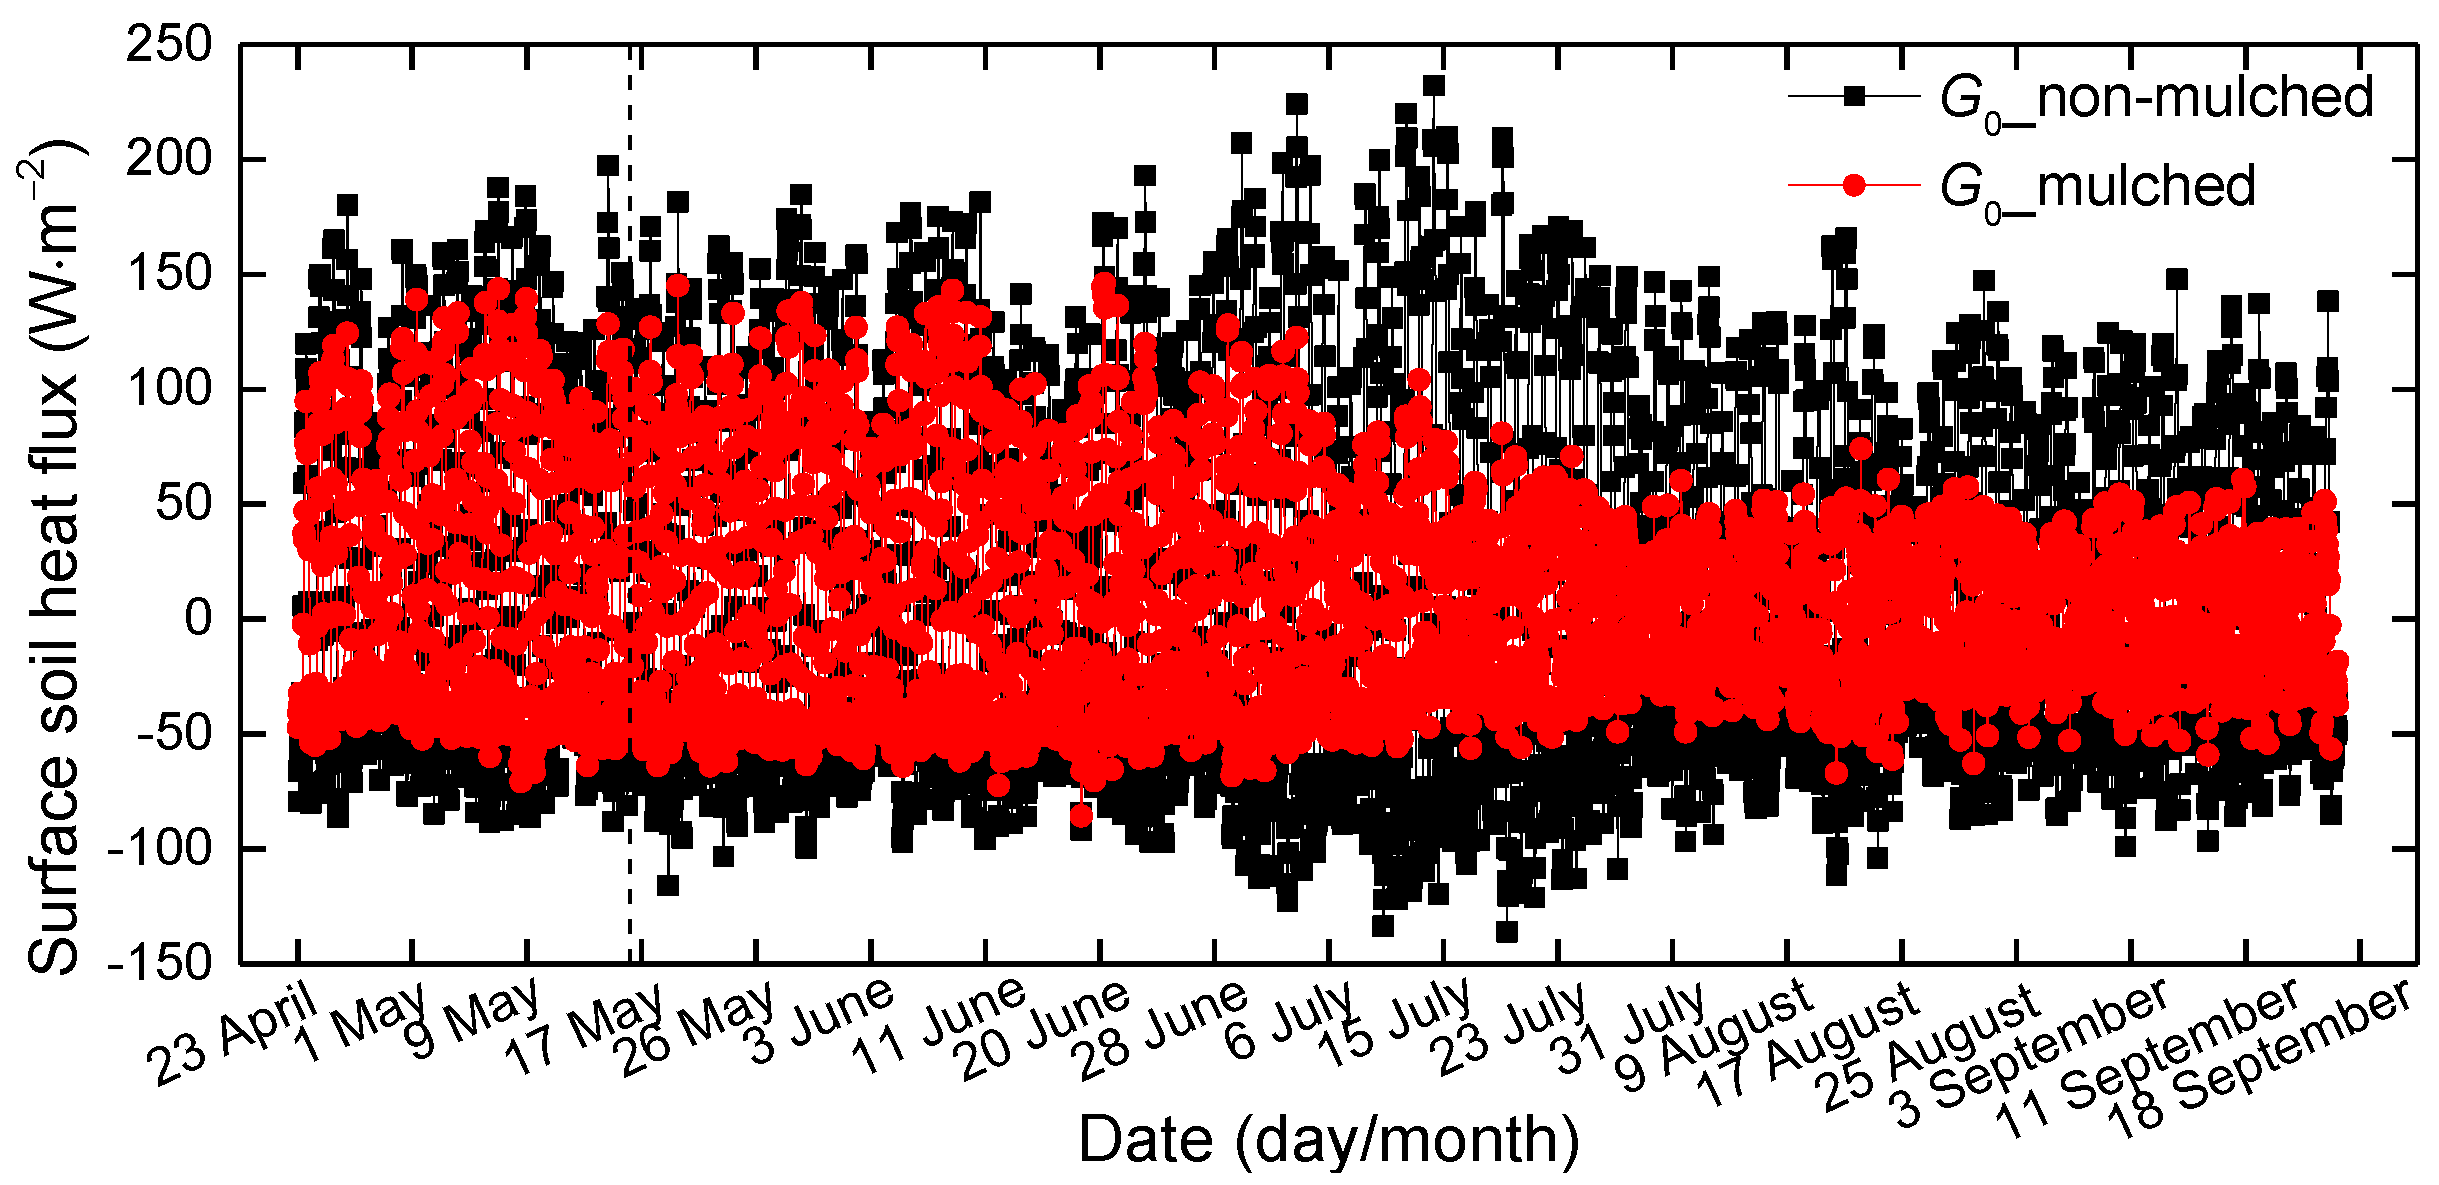
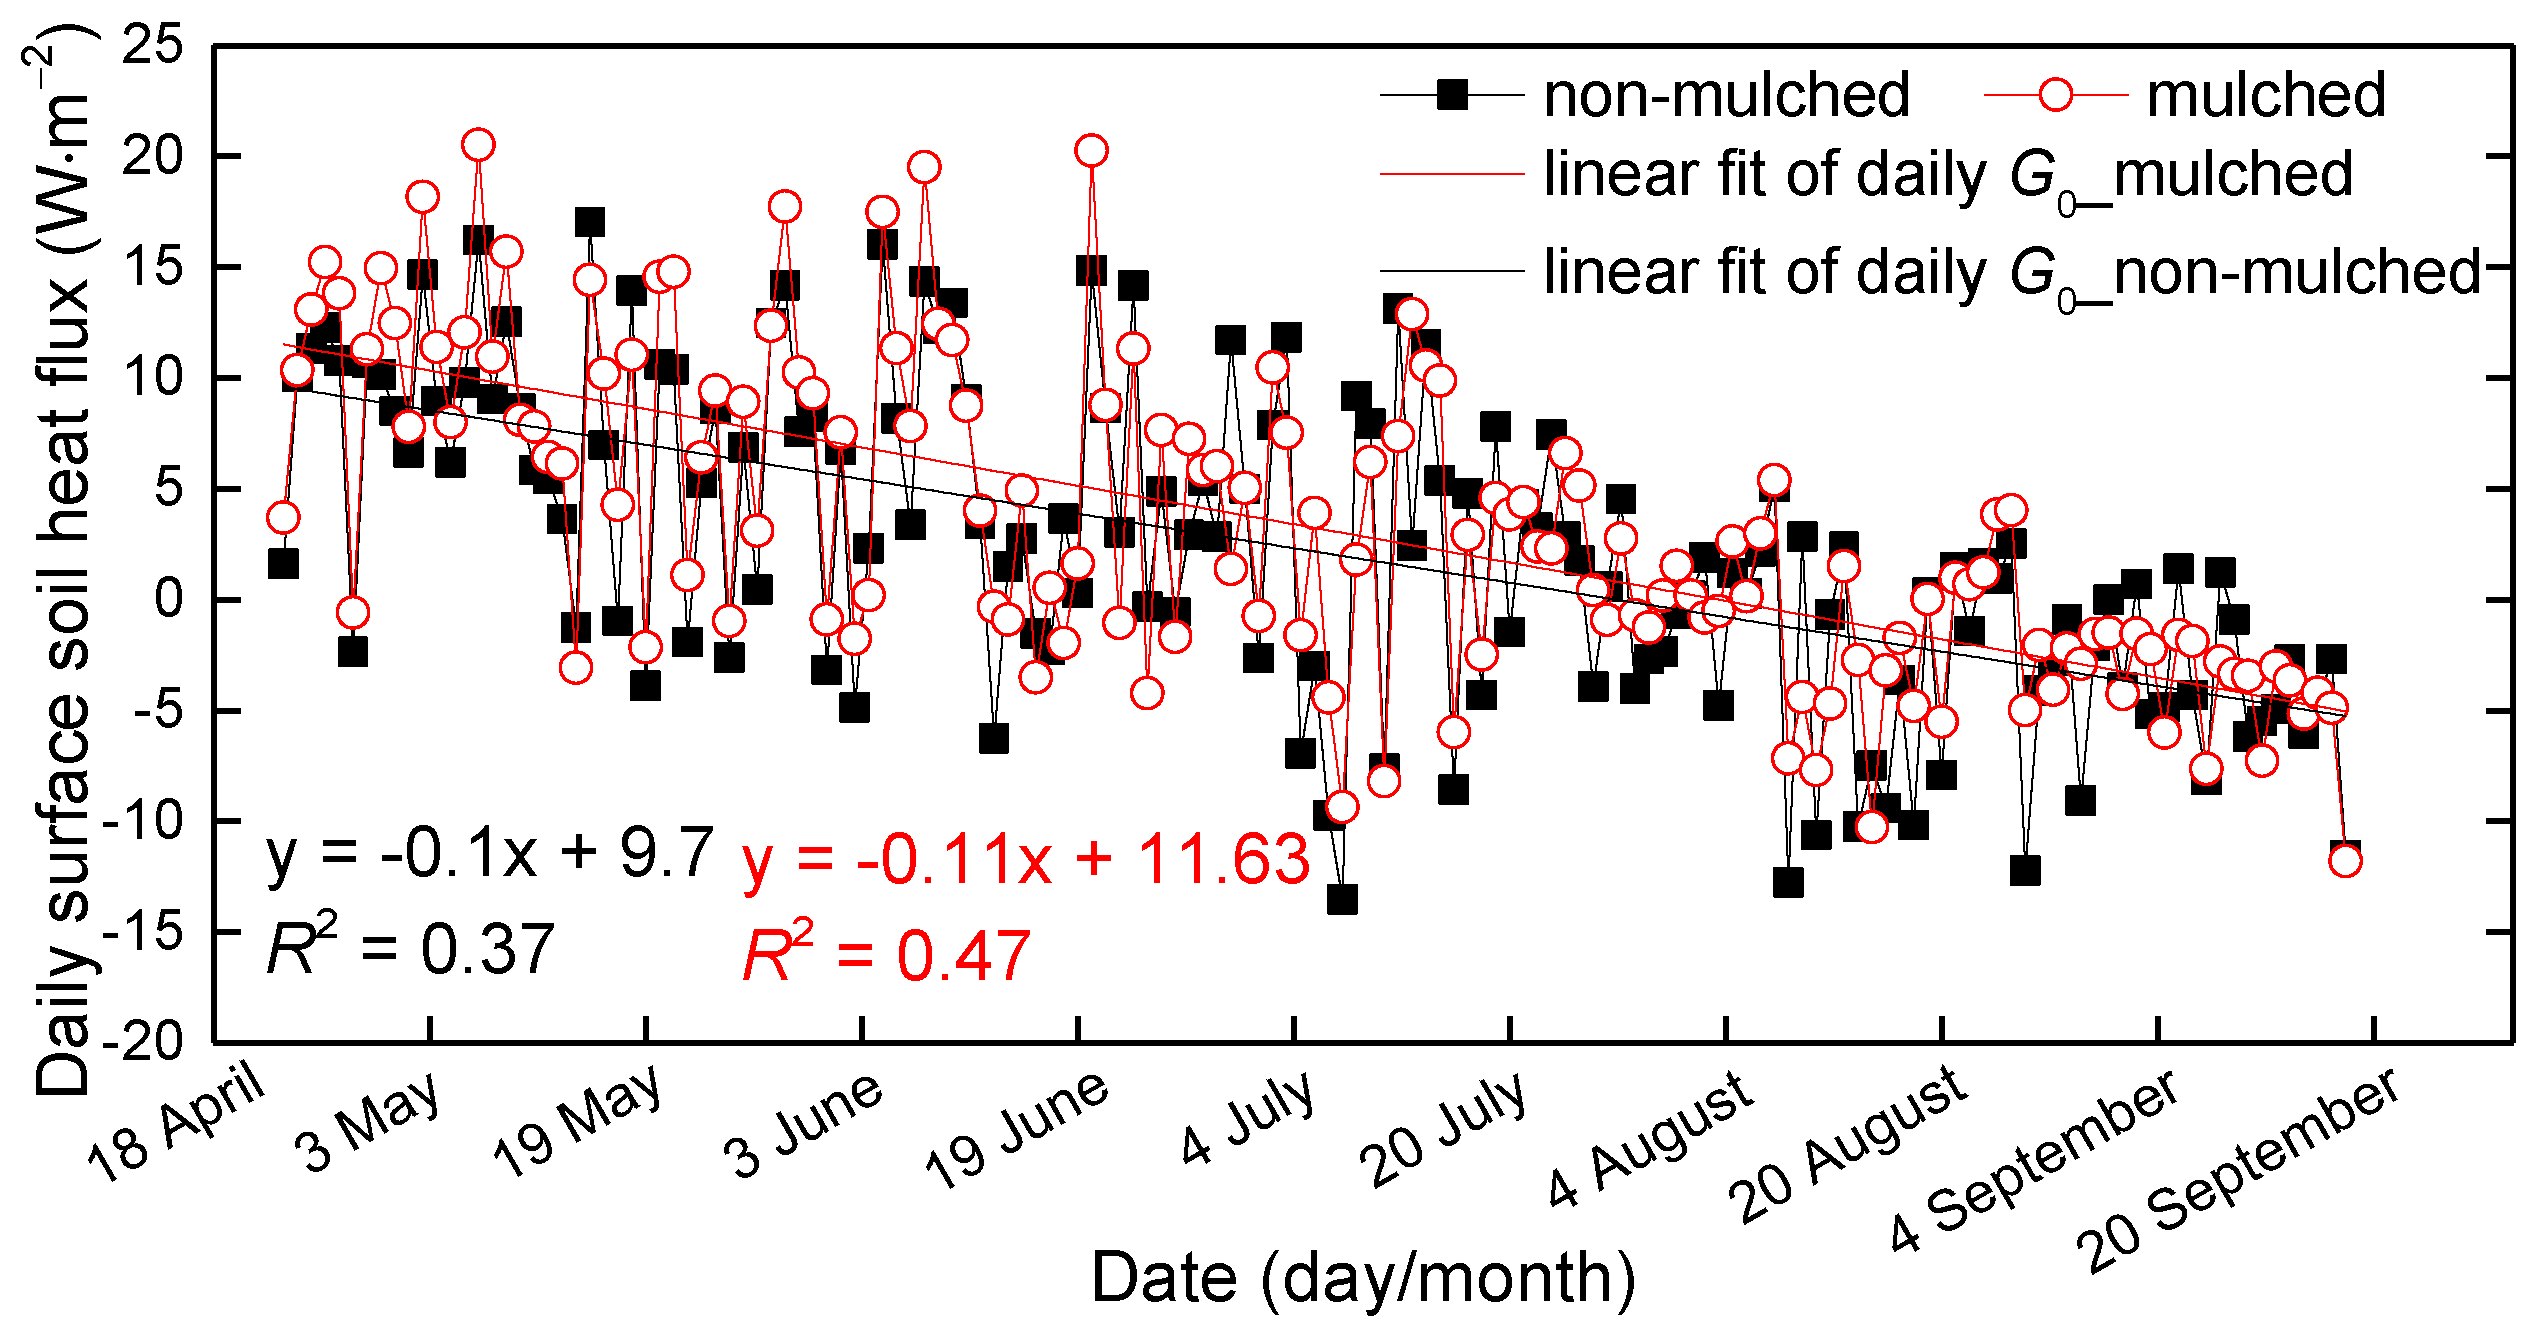
3.2. The Effect of Mulch on Surface Soil Heat Flux

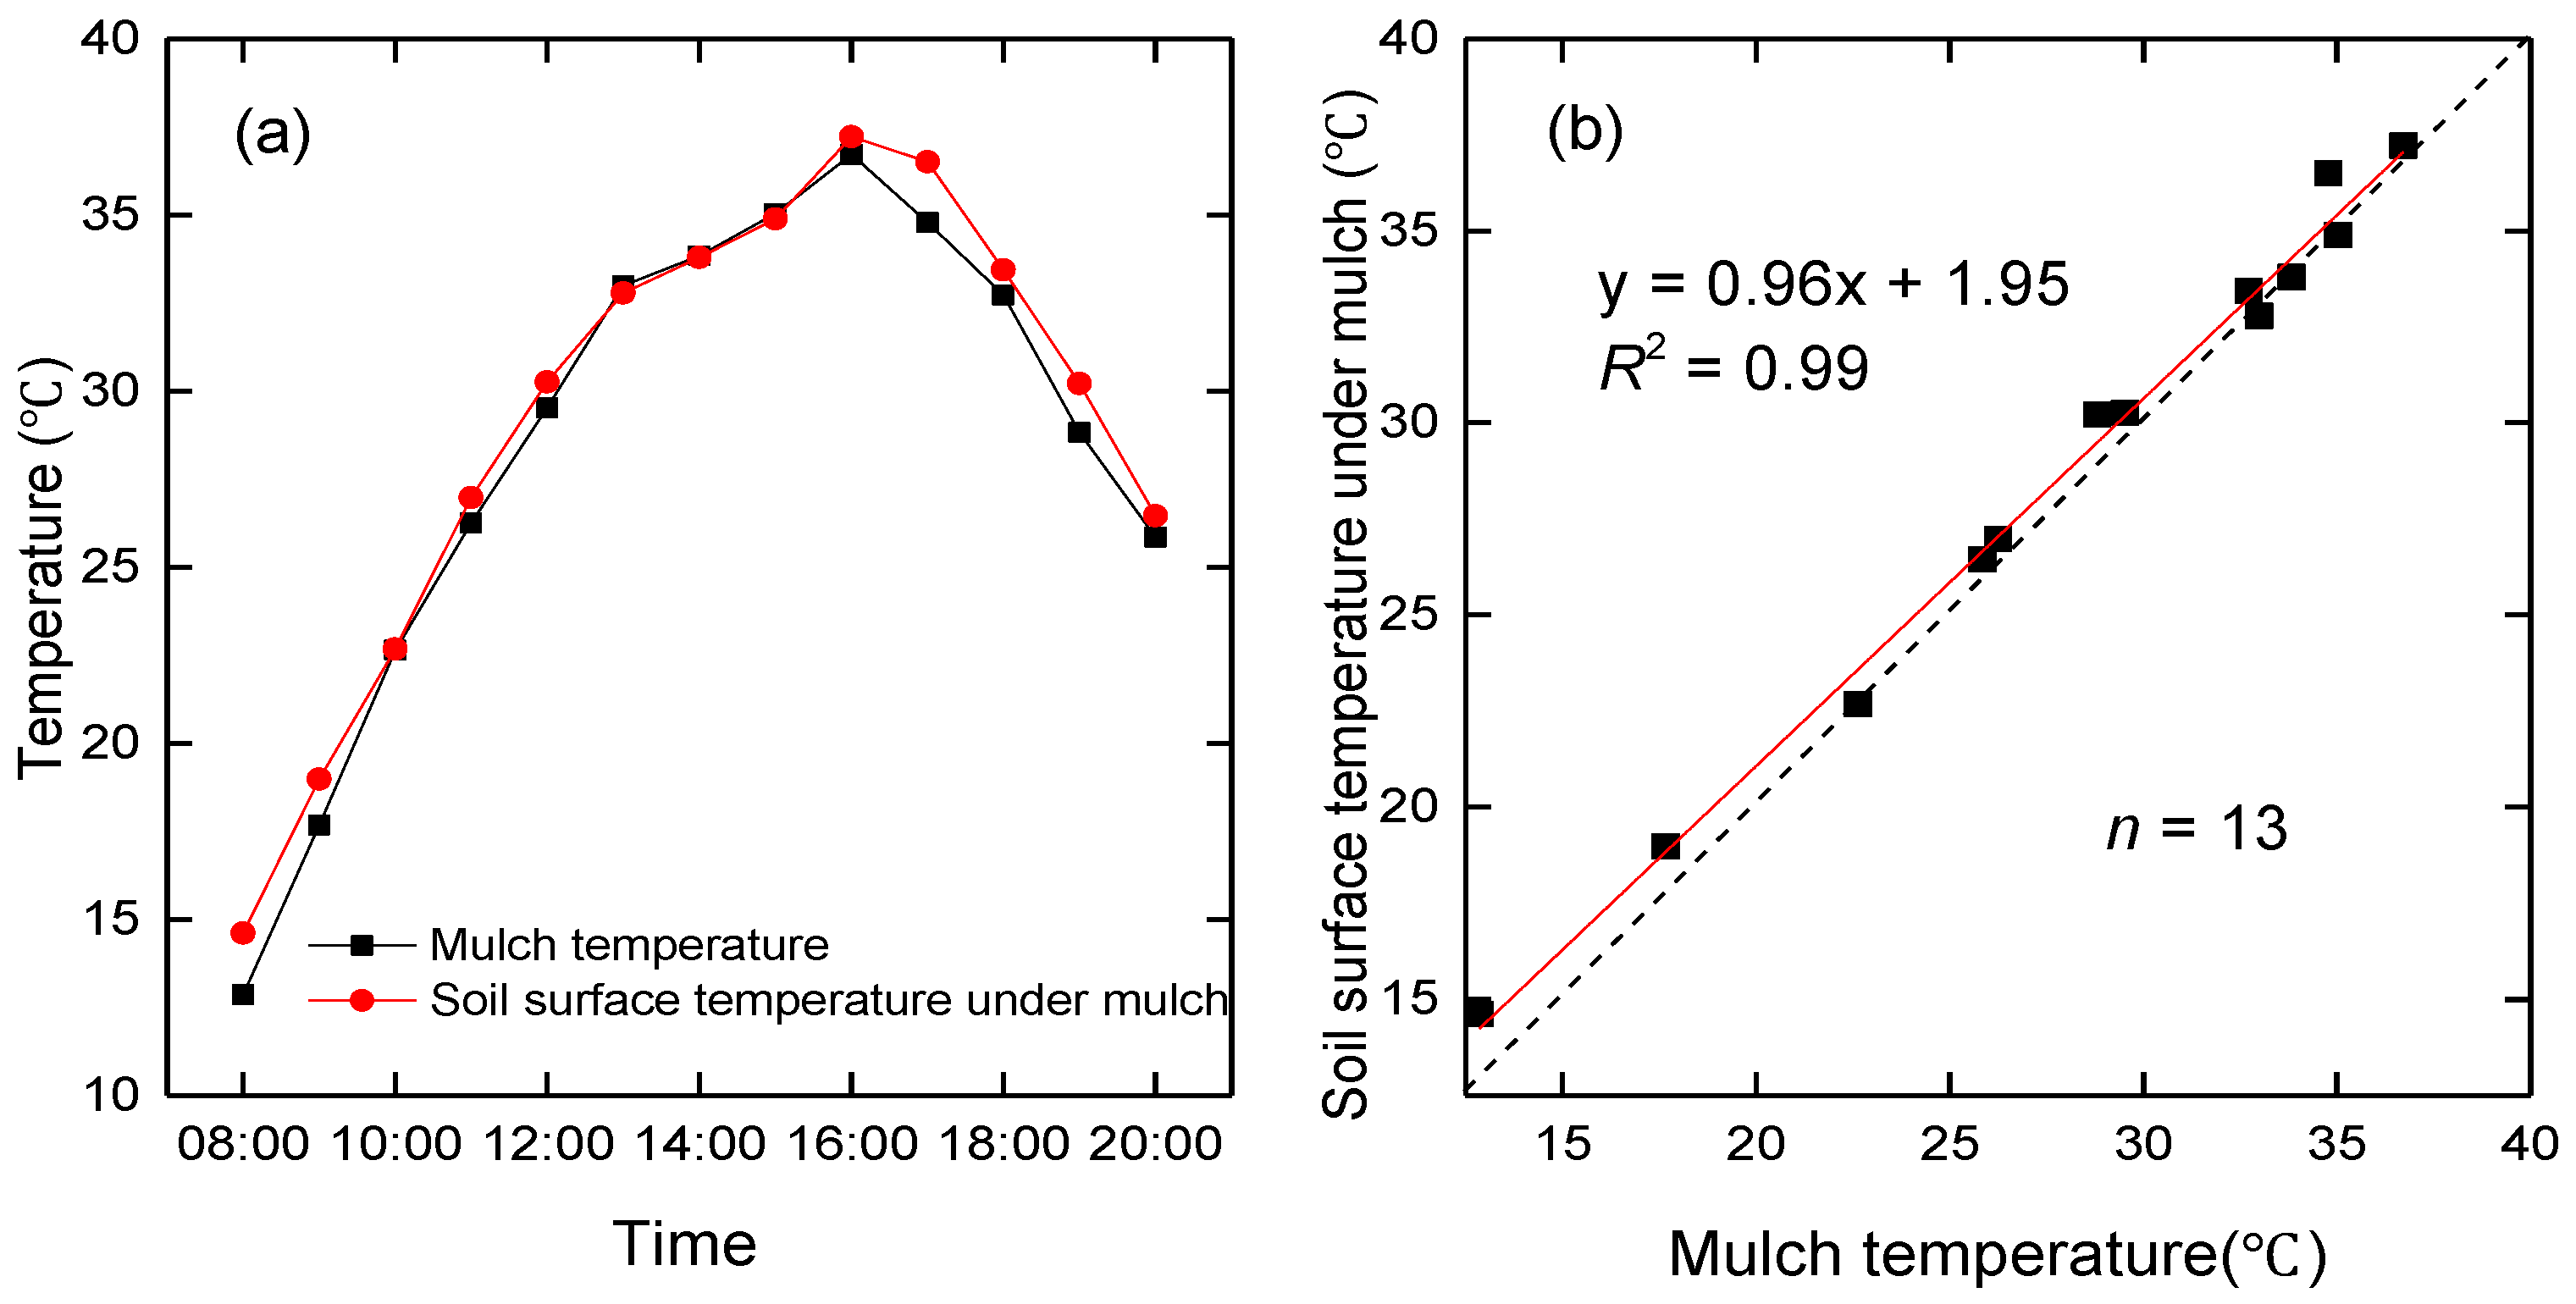
3.2.1. Damped Diurnal Variation of Surface Soil Heat Flux beneath Mulch

The hourly surface soil heat fluxes over non-mulched and mulched soil were calculated by the TDEC method during the growth periods (23 April–18 September) in 2013–2015. To show the evolution of G0 over the growing season, variations of the 3-year average of hourly G0 from April–September are shown in Figure 6. Not only the positive G0 (daytime), but also the negative G0 (nighttime) in mulched soil are smaller than in non-mulched soil. The sign represents the heat flux direction; the positive G0 represents heat flows from the surface to deeper soil; and the negative is opposite. The G0 values in mulched soil decrease obviously in late June. The slope of regression between G0 in non-mulched soil and mulched soil during the growing season (from 16 May–18 September) is 0.52, smaller than the value of 0.72 in the seedling emergence period (Figure 7), because the cotton grows, and the dense canopy attenuates solar radiation entering into the soil. Furthermore, drip irrigation creates higher soil moisture, and the soil temperature beneath the mulch varies slowly, bringing about low G0. However, G0 in non-mulched soil increases about on 21 June, 4 July and 14 July. That is because the soil temperature varies largely in these days, which determines the G0 value. There is no drip irrigation in these days, and soil moisture is small. Furthermore, Rn usually reaches the maximum in July, later than the solar radiation.
The 3-year mean diurnal variation of G0 in the seedling emergence period (23 April–15 May), the blooming and bolling period (1 July–31 August) and the growing season (April–September) were studied separately. The G0 in mulched and non-mulched soil shows significant differences during a 24-h period. Moreover, the absolute value of G0 in mulched soil is smaller than that in non-mulched soil in both day and night, with slopes of regression between G0 in non-mulched soil and mulched soil of 0.72, 0.40 and 0.55 in these three growing periods (Figure 8d,e,f). The plastic mulch not only weakens solar radiation into the soil during the day, but also hinders soil heat into the air during the night. In addition, the difference becomes large in the blooming and bolling periods (Figure 8b), owing to the aforementioned dense vegetation and drip irrigation in addition to the plastic mulch effect. The daily maximum G0 in mulched soil is 106 W·m−2 in the seedling emergence period and 47 W·m−2 in the blooming and bolling period. In addition, the time when heat transmission changes direction (from negative to positive) in the morning in non-mulched and mulched soil is the same, approximately 9:00 a.m. (Figure 8a). However, the heat transmission in non-mulched soil changes earlier in the afternoon than that in mulched soil, around 18:30 and 19:30, respectively (Figure 8b). The plastic mulch delays the change of direction in heat flow in the afternoon.
According to the thermal conduction equation, G0 values are related to the variation of temperature in the topsoil at adjacent hours. In the present study, the daily maximum soil temperature observed in the topsoil minus the daily minimum value (5 cm in 2013 and 2015, 10 cm in 2014) represents the time variation of soil temperature, which controls G0 values. The 3-year averages of the daily amplitude (maximum minus minimum) of the observed soil temperature in mulched and non-mulched zones during April–September are shown in Figure 9. The variations of the amplitudes of soil temperature are consistent with G0 variations. The amplitude of temperature in non-mulched soil is larger than that in mulched soil from April–September. The biggest difference between the amplitudes of temperature in non-mulched and mulched soil appears at the beginning of July, in agreement with G0 variation, which is caused by solar energy, dense vegetation and drip irrigation.
Although the plastic mulch increases soil temperature, the amplitude of soil temperature beneath the mulch is smaller than that in non-mulched soil in the seedling emergence period (Figure 9), which leads to smaller G0. It follows that the plastic mulch keeps soil temperature stable.

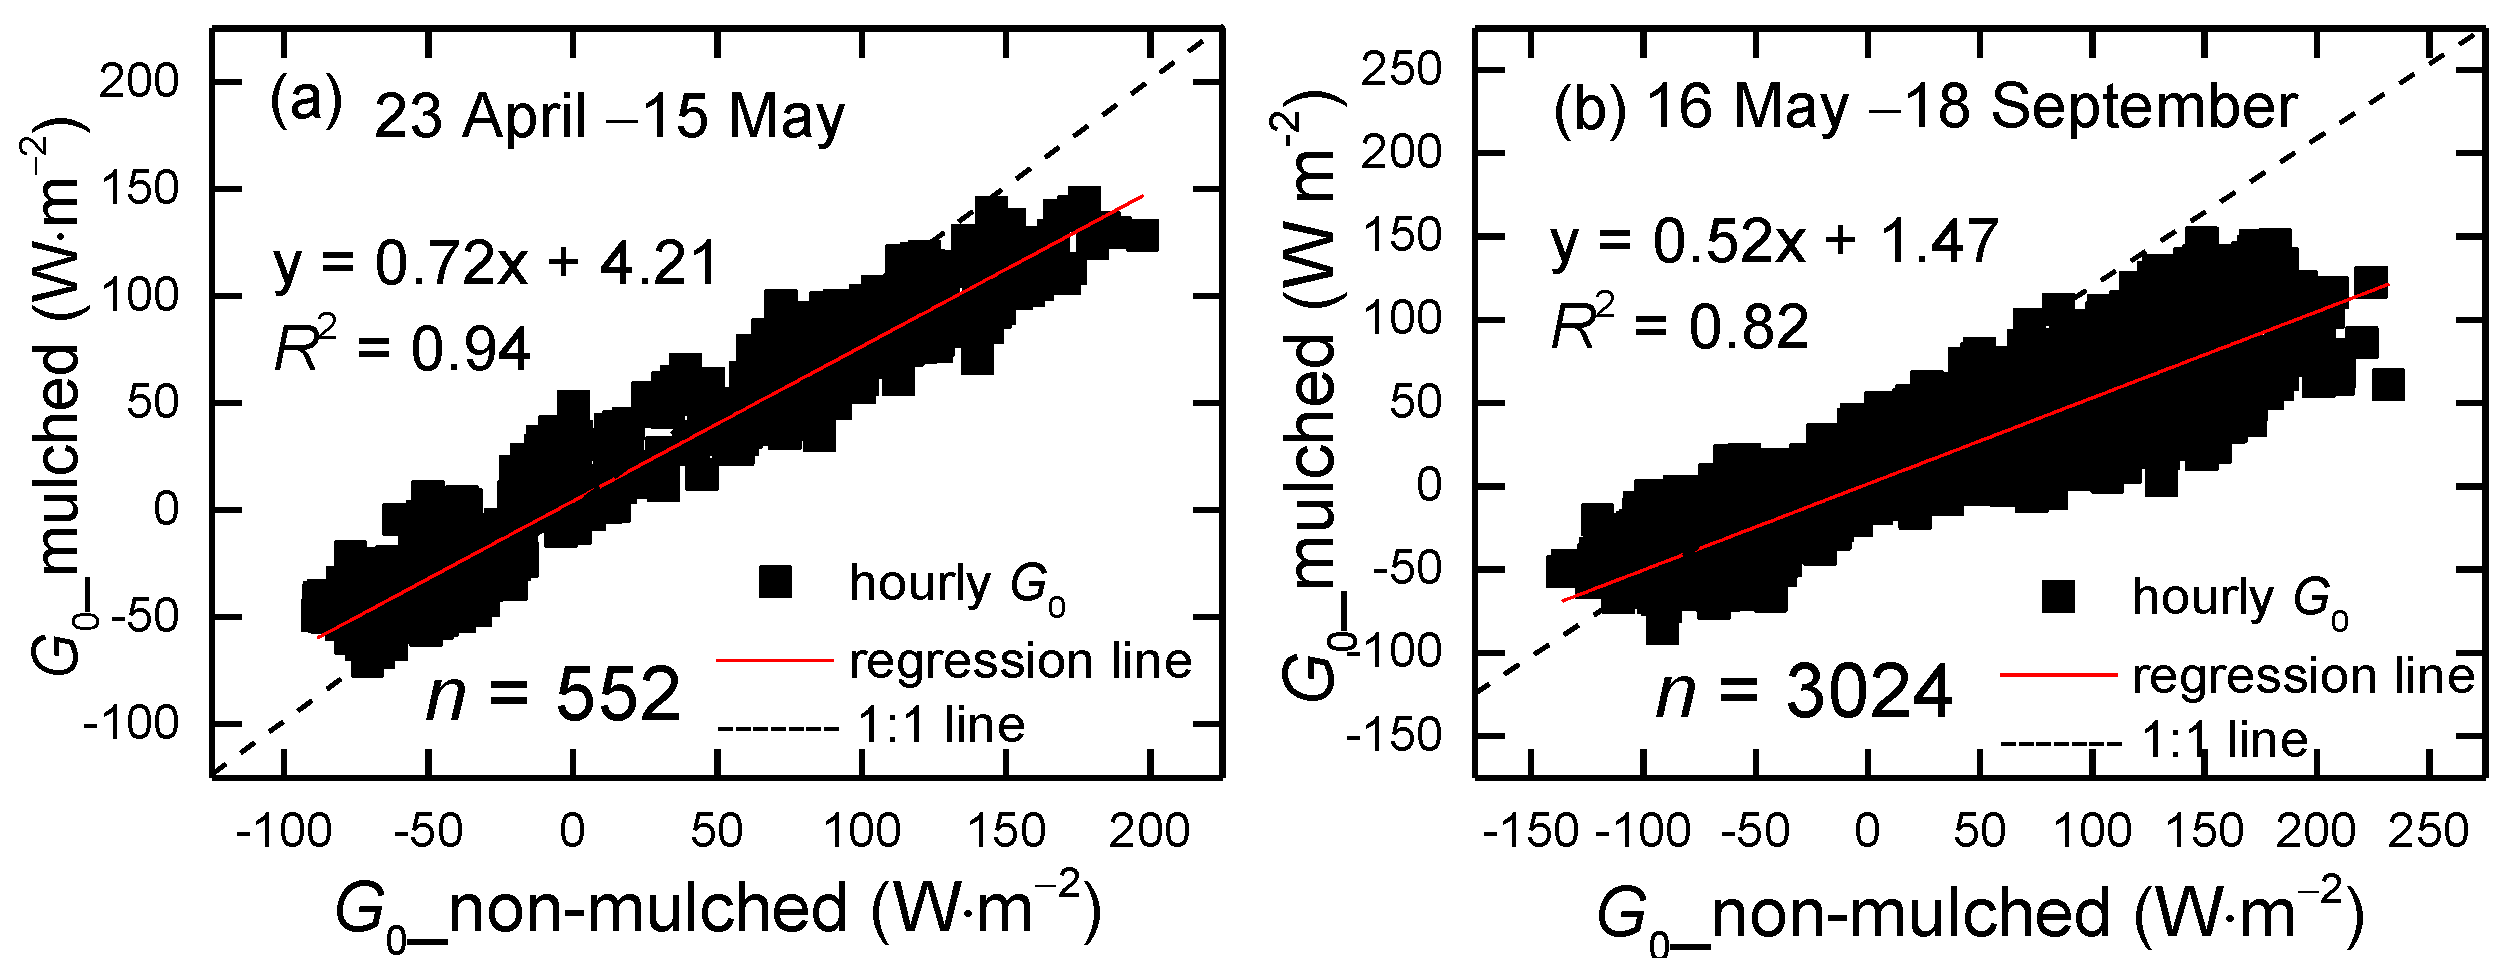
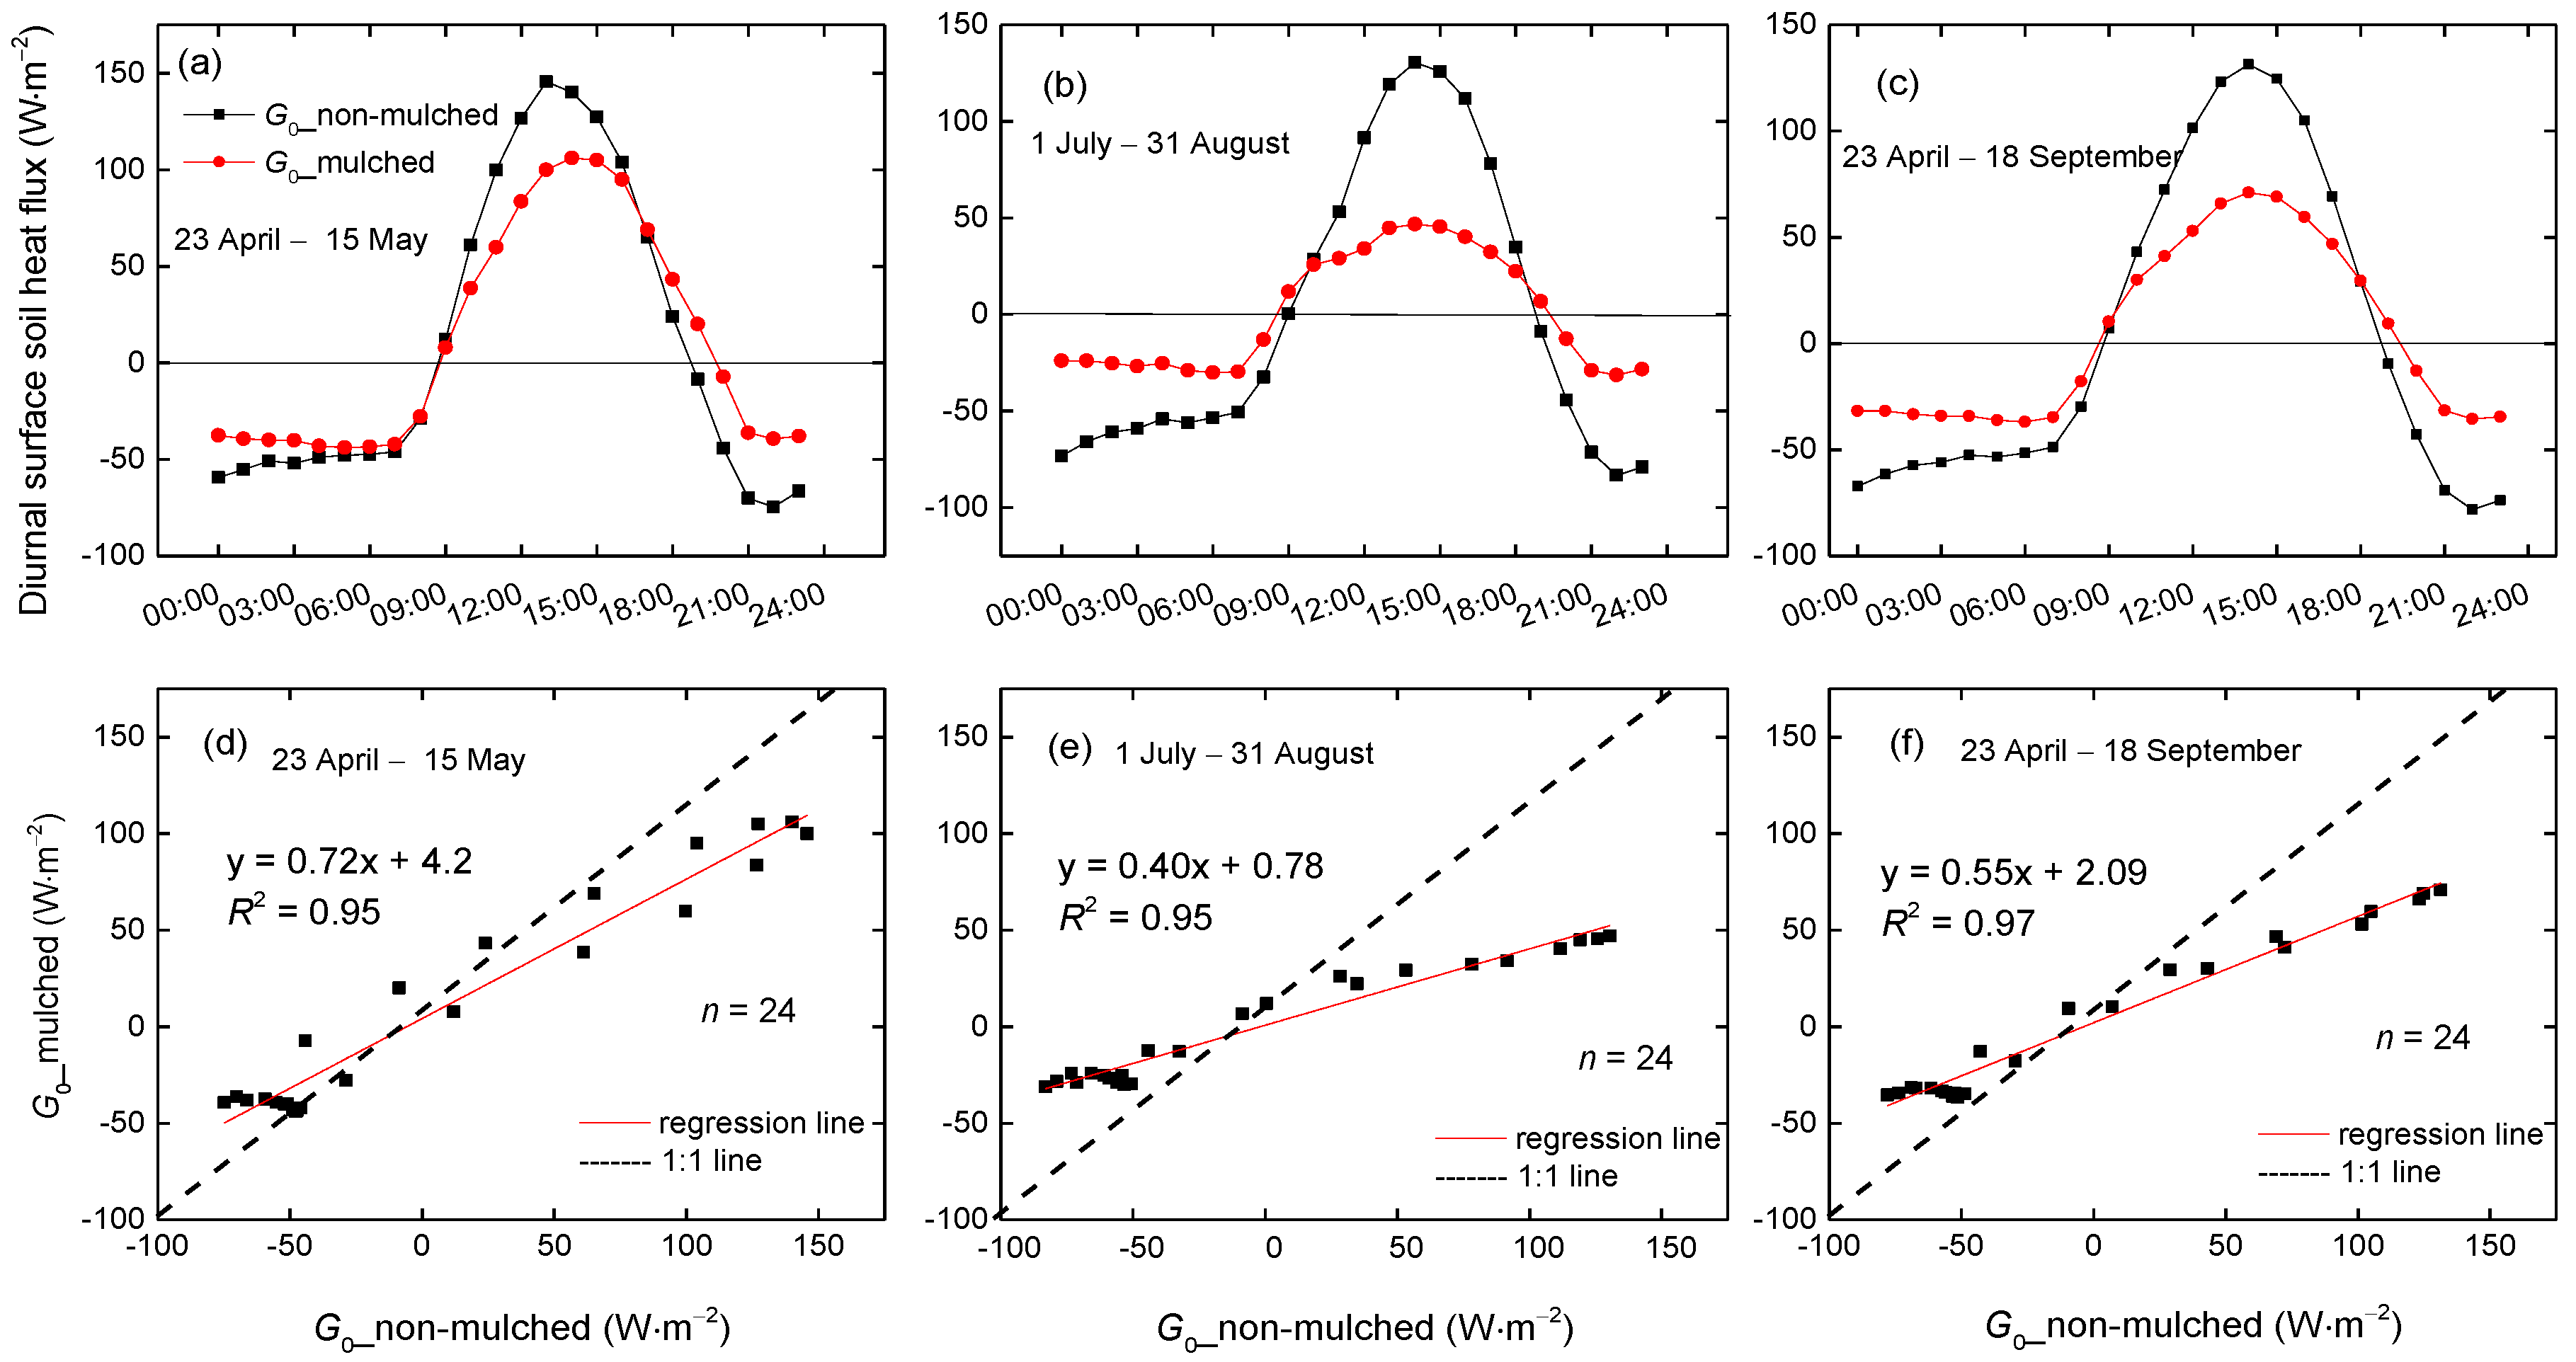
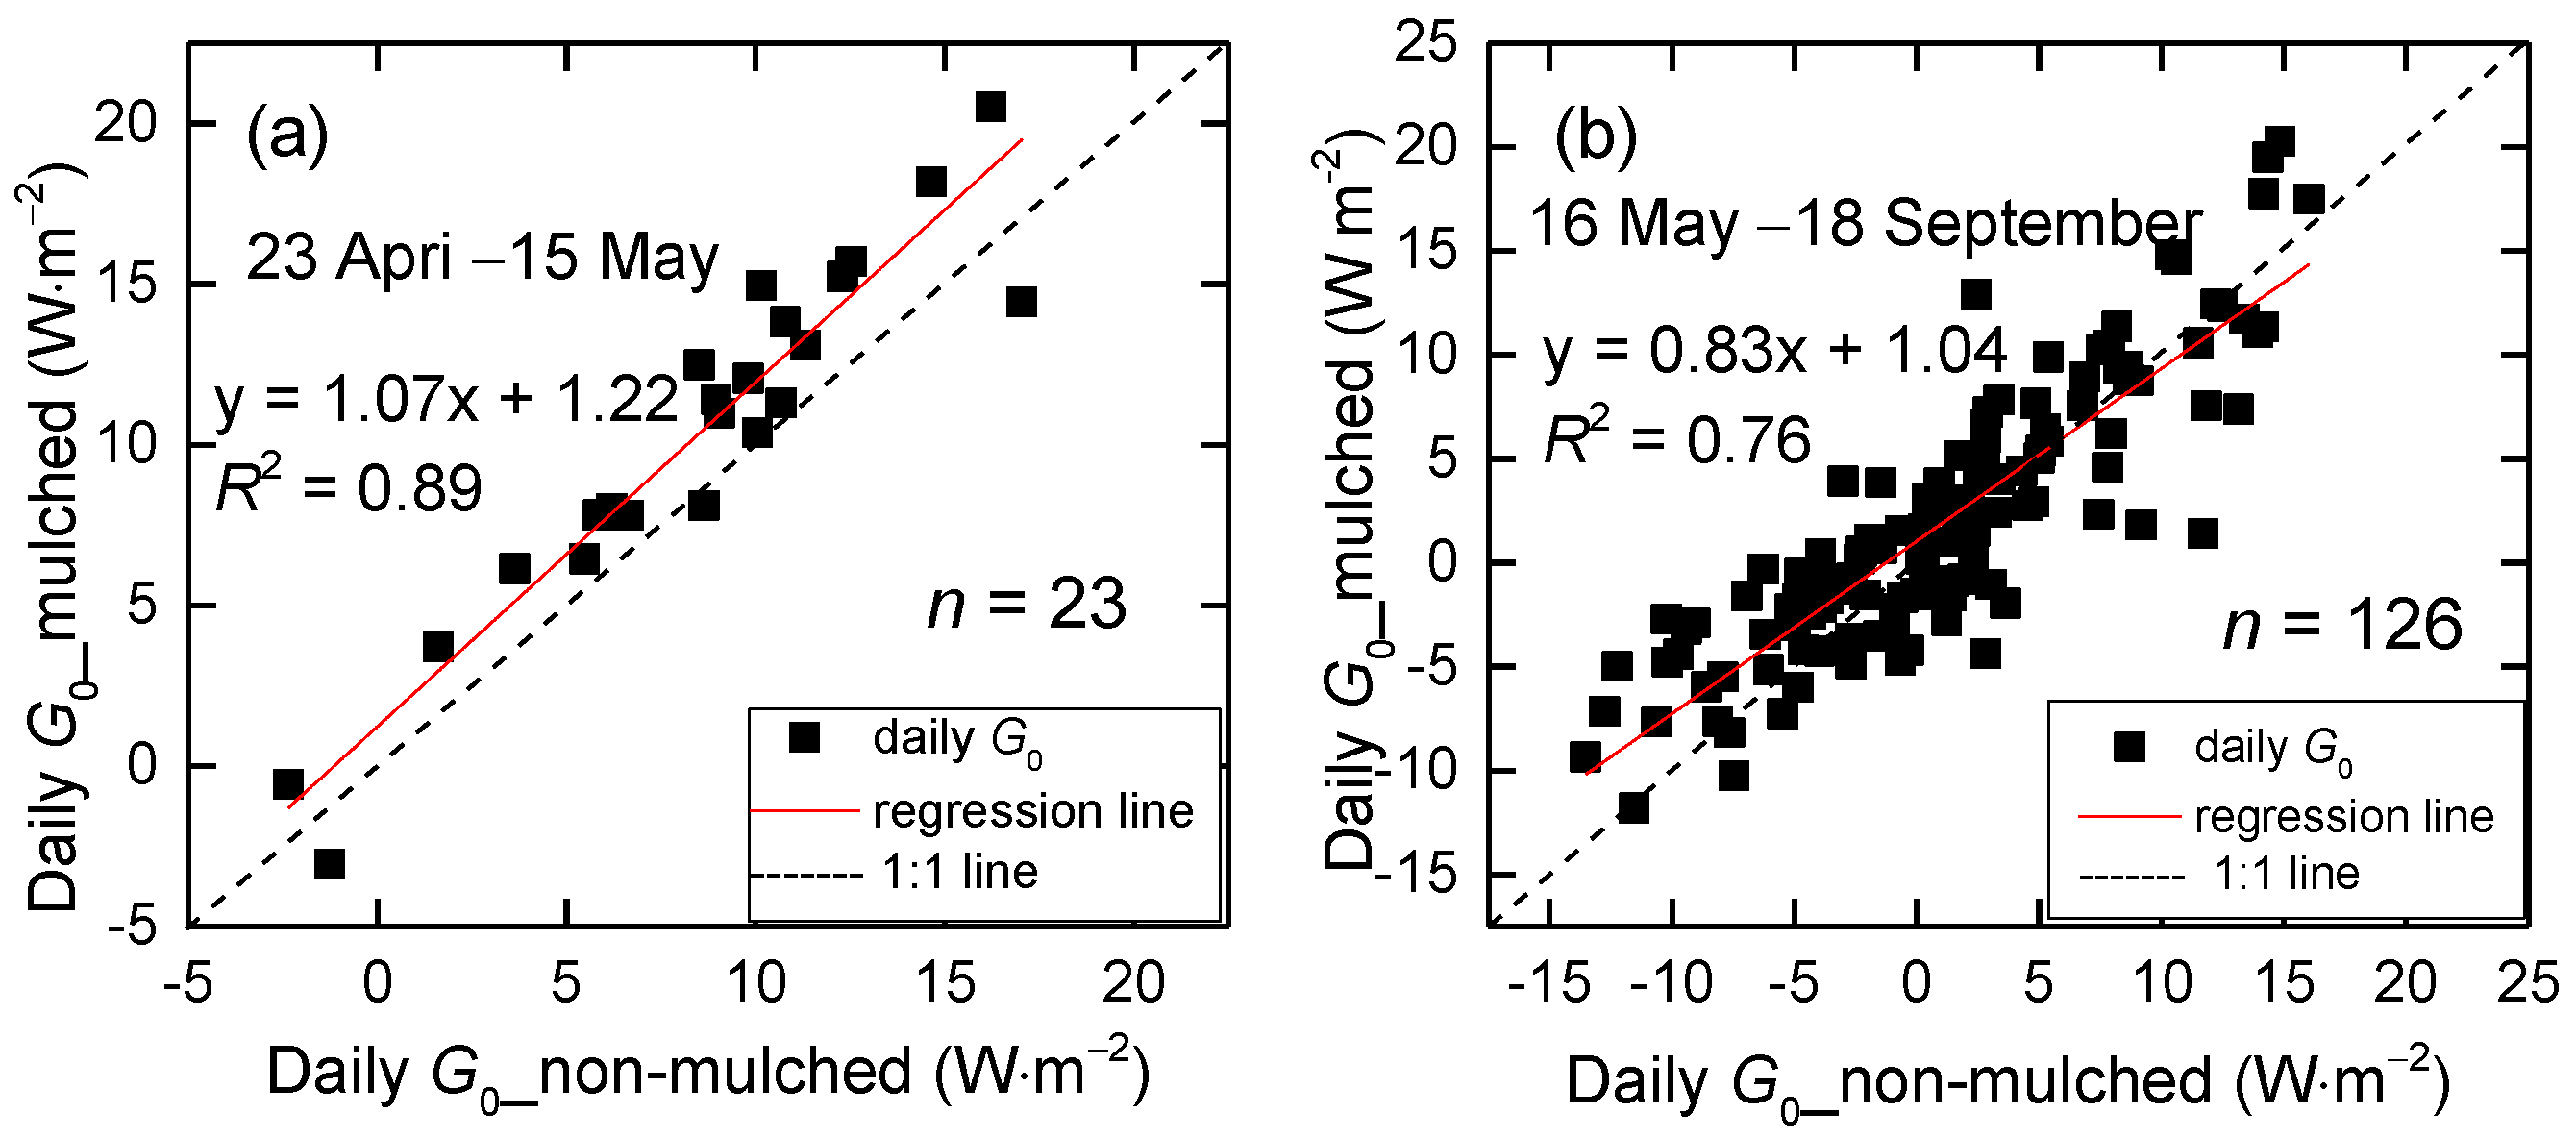
3.2.2. Similar Daily Variation of G0

The solar energy absorbed by the soil is not always equal to the released energy, which depends on the underlying surface and seasons. Thus, the daily G0 (net energy entering the soil) is not always equal to zero [2]. Since the hourly G0 beneath the mulch is much smaller than that in non-mulched soil both in day and night, what about the daily values? The daily G0 in mulched and non-mulched soil are similar, and both monotonically decrease from April–September (Figure 10), changing from positive to negative values. It shows that the soil absorbs energy in the spring and releases energy in the autumn. The G0 values are positive before July, alternately positive and negative from July to early August and almost negative starting from early August. The energy absorbed by the soil beneath the mulch and by bare soil between two mulch zones is larger than the released energy from April–June, which makes for positive G0, and is opposite from early August–September. The maximum G0 beneath the mulch was 20.5 W·m−2 on 7 May, and the minimum is −14 W·m−2 over bare soil on 8 July.
Compared to the hourly G0 in non-mulched soil and that of mulched soil with a slope of 0.72 (Figure 7a), the daily G0 are nearly same, with a slope of 1.07 in the seeding and germination period (Figure 11a). Although n = 23 in Figure 11a and the p-value is 5.88 × 10⁻¹² < 0.05, they are significantly correlated at a confidence level of 0.05. It shows that the effect of mulch on G0 is diminished with increasing time scale and that mulch has a great impact on diurnal G0. However, the daily G0 in non-mulched soil is larger than that in mulched soil from May–September when the cotton grows, with a slope of 0.83 (Figure 11b). That is not only because of the positive G0, but also because the negative G0 in non-mulched soil is larger than that in mulched soil. The dense vegetation and mulch constitute two masks over the soil, which leads to less energy entering the soil and also reduces soil heat loss, leading to smaller positive and negative G0 values.
The sum of positive values of daily G0 beneath the mulch in the seedling emergence period is 242.5 W·m−2, and the sum of negative values is −3.6 W·m−2. These sums of G0 in non-mulched soil are 200 and −3.6 W·m−2, respectively (Table 2). The cumulative energy is positive (absorbing energy), with a value of 238.8 W·m−2 in mulched soil, and larger than that in non-mulched soil, with 196.4 W·m−2 in the seedling emergence period. Furthermore, the heat income to soil beneath mulch is larger than that to bare soil (242.5 > 200 W·m−2), and heat losses from the soil to air are less affected by the presence of the mulch, with the same value of 3.6 W·m−2, similar to Liakatas’s research [39]. This demonstrates that the plastic mulch gathers energy for seed germination and growth. Although the vegetation and mulch reduce soil heat gain and loss, the cumulative energy is positive, with a value of 244.0 W·m−2, larger than 127.4 W·m−2 in non-mulched soil.

3.3. The Effect of Mulch on Energy Balance

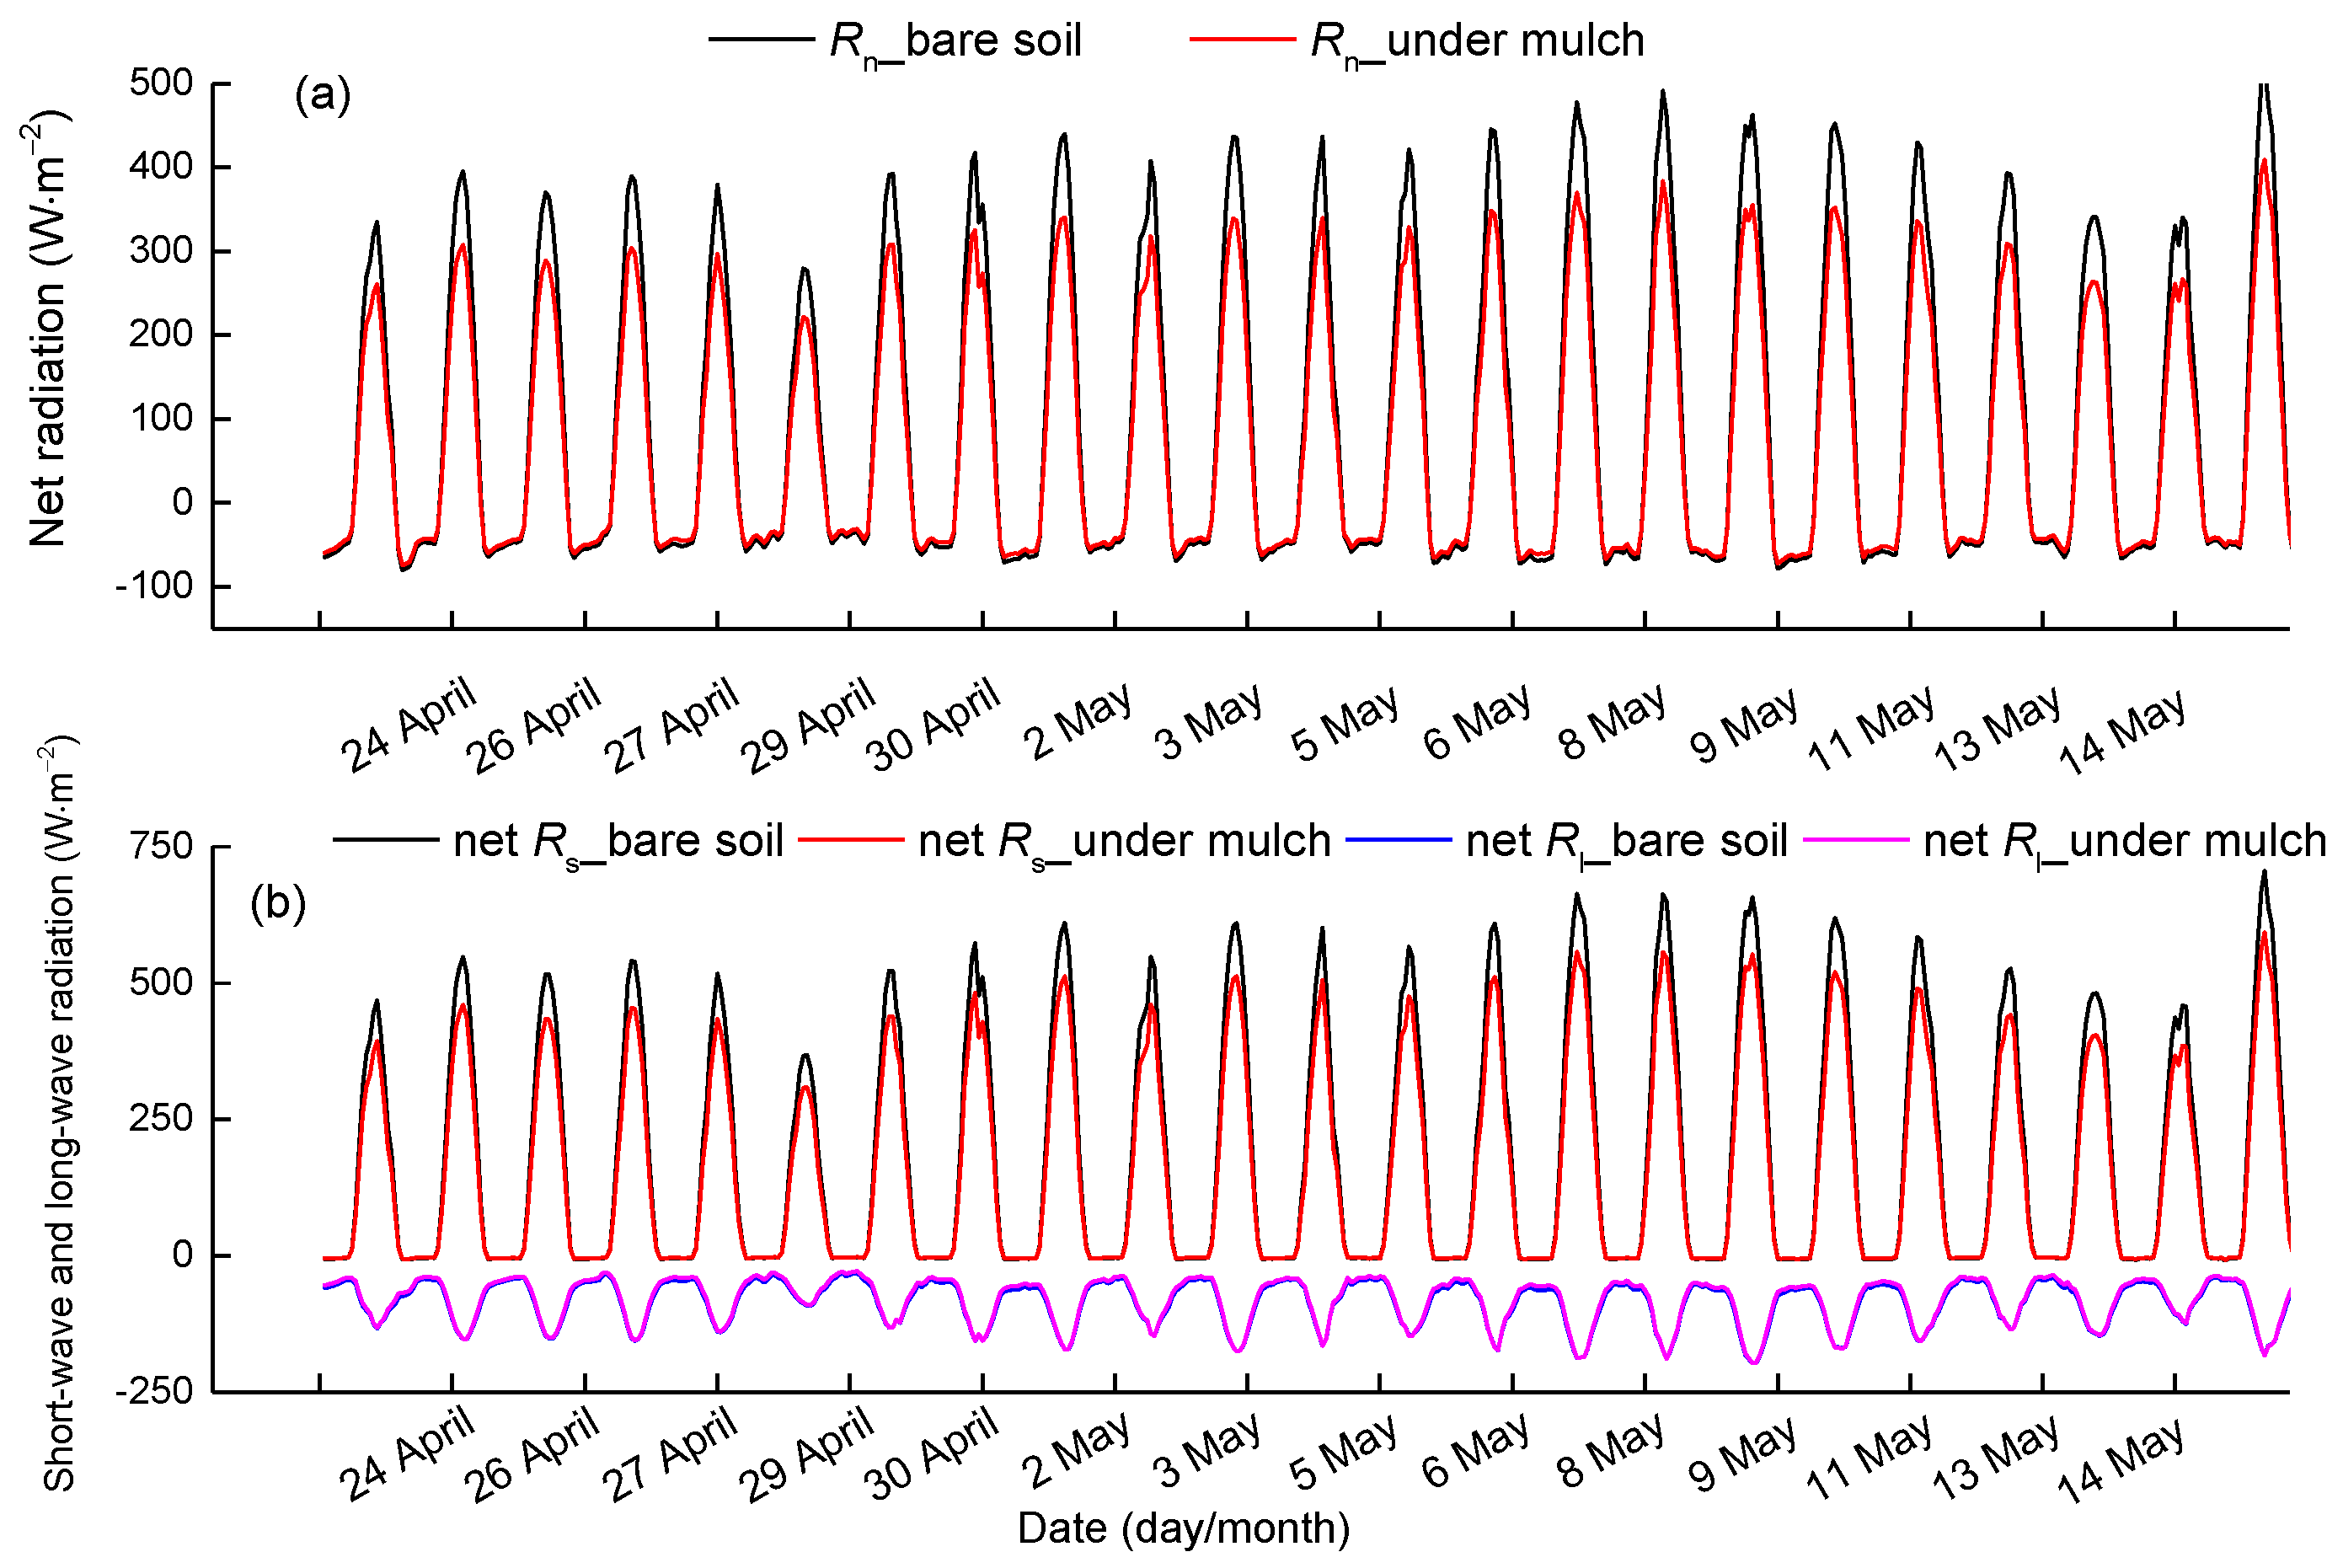
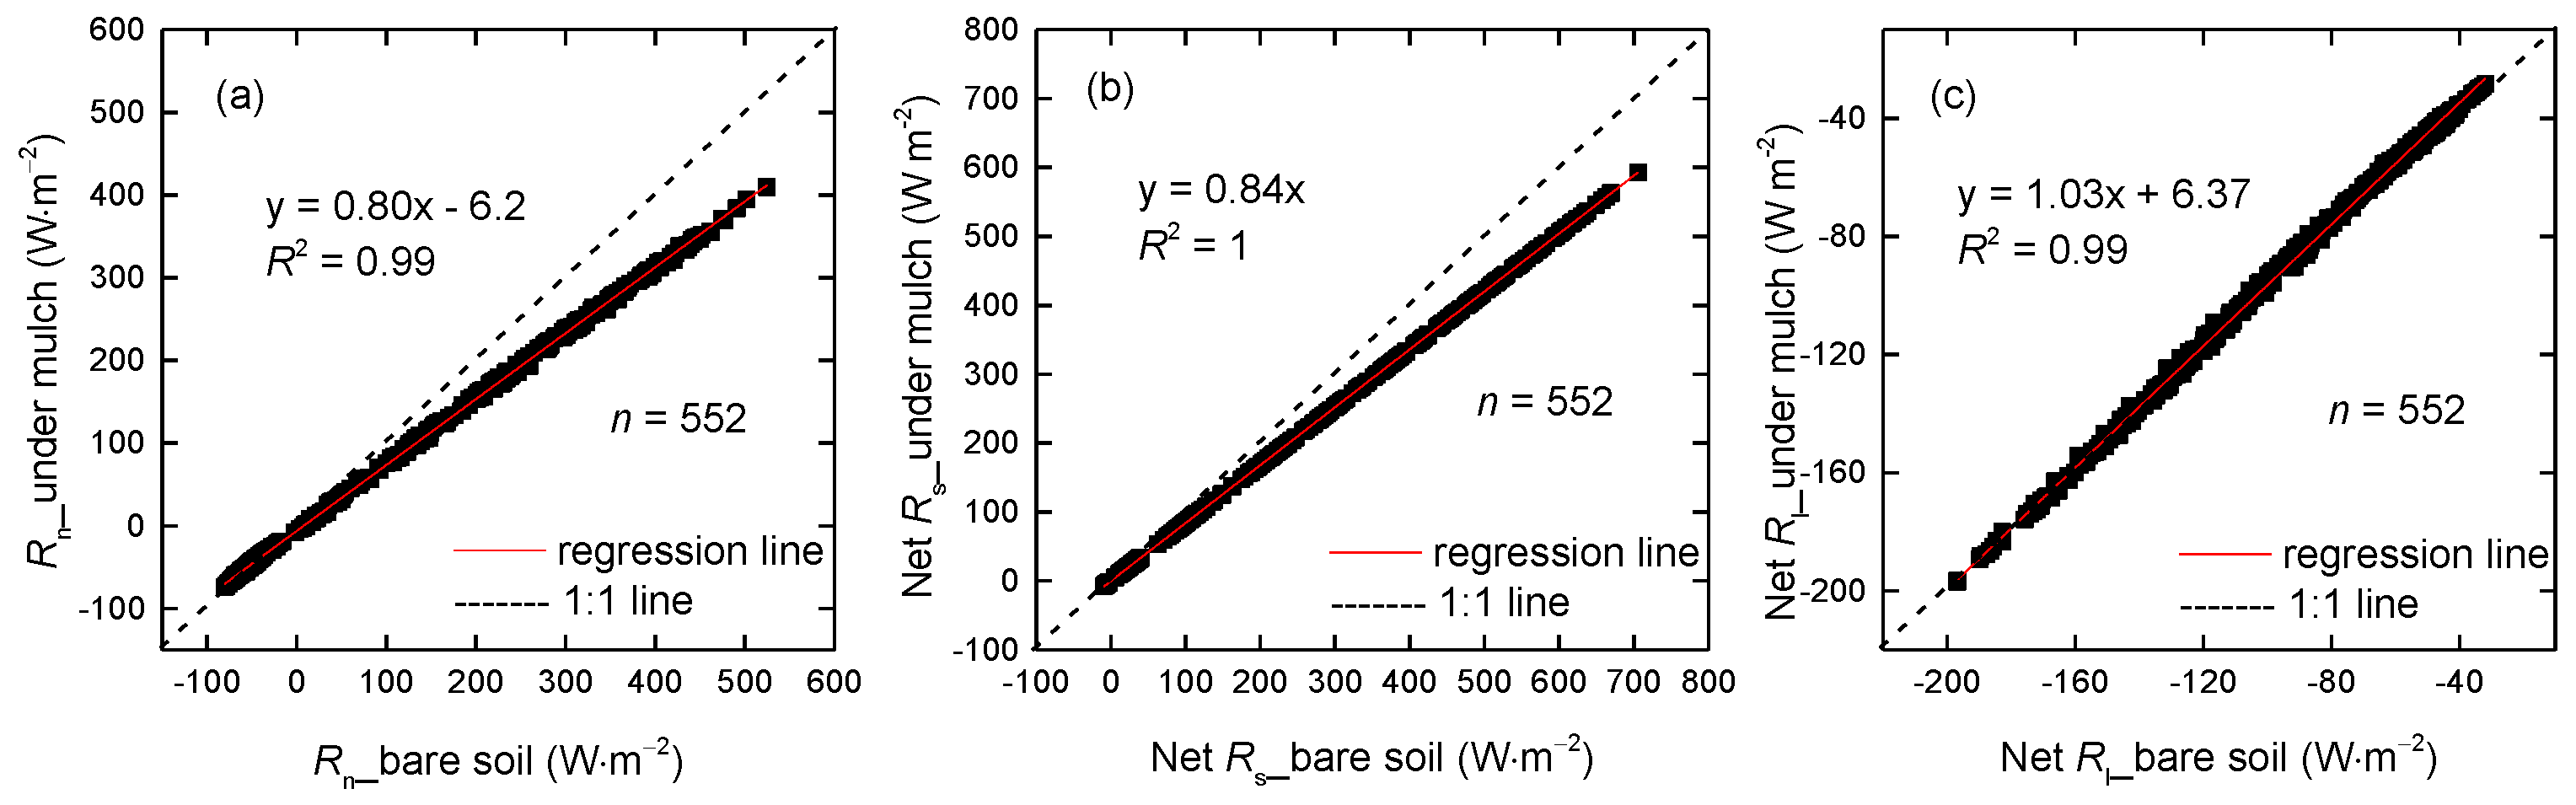
3.3.1. Smaller Net Radiation beneath Mulch

In addition to atmospheric long-wave radiation, the mulch also contributes downward long-wave radiation to the net radiation of the soil beneath the mulch. The hourly mulch temperature and surface soil temperature beneath the mulch (8:00–20:00) were measured using an infrared thermometer (FLUKE Inc., Everett, WA, USA) for seven days (27–30 April and 3–5 May) in 2016. Ten data points per hour were measured for mulch and the soil beneath mulch. The average of the 10 data points was adopted as the final hourly mulch and soil temperatures. The mulch temperature is nearly the same as the soil temperature beneath mulch (Figure 12a) with a slope of regression between mulch temperature and soil temperature of 0.96 (Figure 12b), which is consistent with Liakatas’s study [39].
The 3-year mean hourly net radiation in mulched soil is smaller than that in non-mulched bare soil (Figure 13a), in agreement with other results, such as those of [39,40,41]. The slope of regression between Rn in non-mulched and mulched soil is 0.80, and the determination coefficient is 0.99 (Figure 14a). Primarily because the net solar radiation is reduced by 16% while the net long-wave radiation is approximately equal (Figure 13b). The slopes of regression between net solar radiation in non-mulched soil and that in mulched soil and between net long-wave radiation in non-mulched soil and that in mulched soil are 0.84 and 1.03, respectively (Figure 14b,c). The humid air held below the mulch, which can absorb the downward long-wave radiation penetrating through mulch and upward long-wave radiation emitted by the soil beneath the mulch, will contribute to Rn and SEB. Nevertheless, the humid air is not included in the present study, as the mulch is close to the ground and the space is very small.

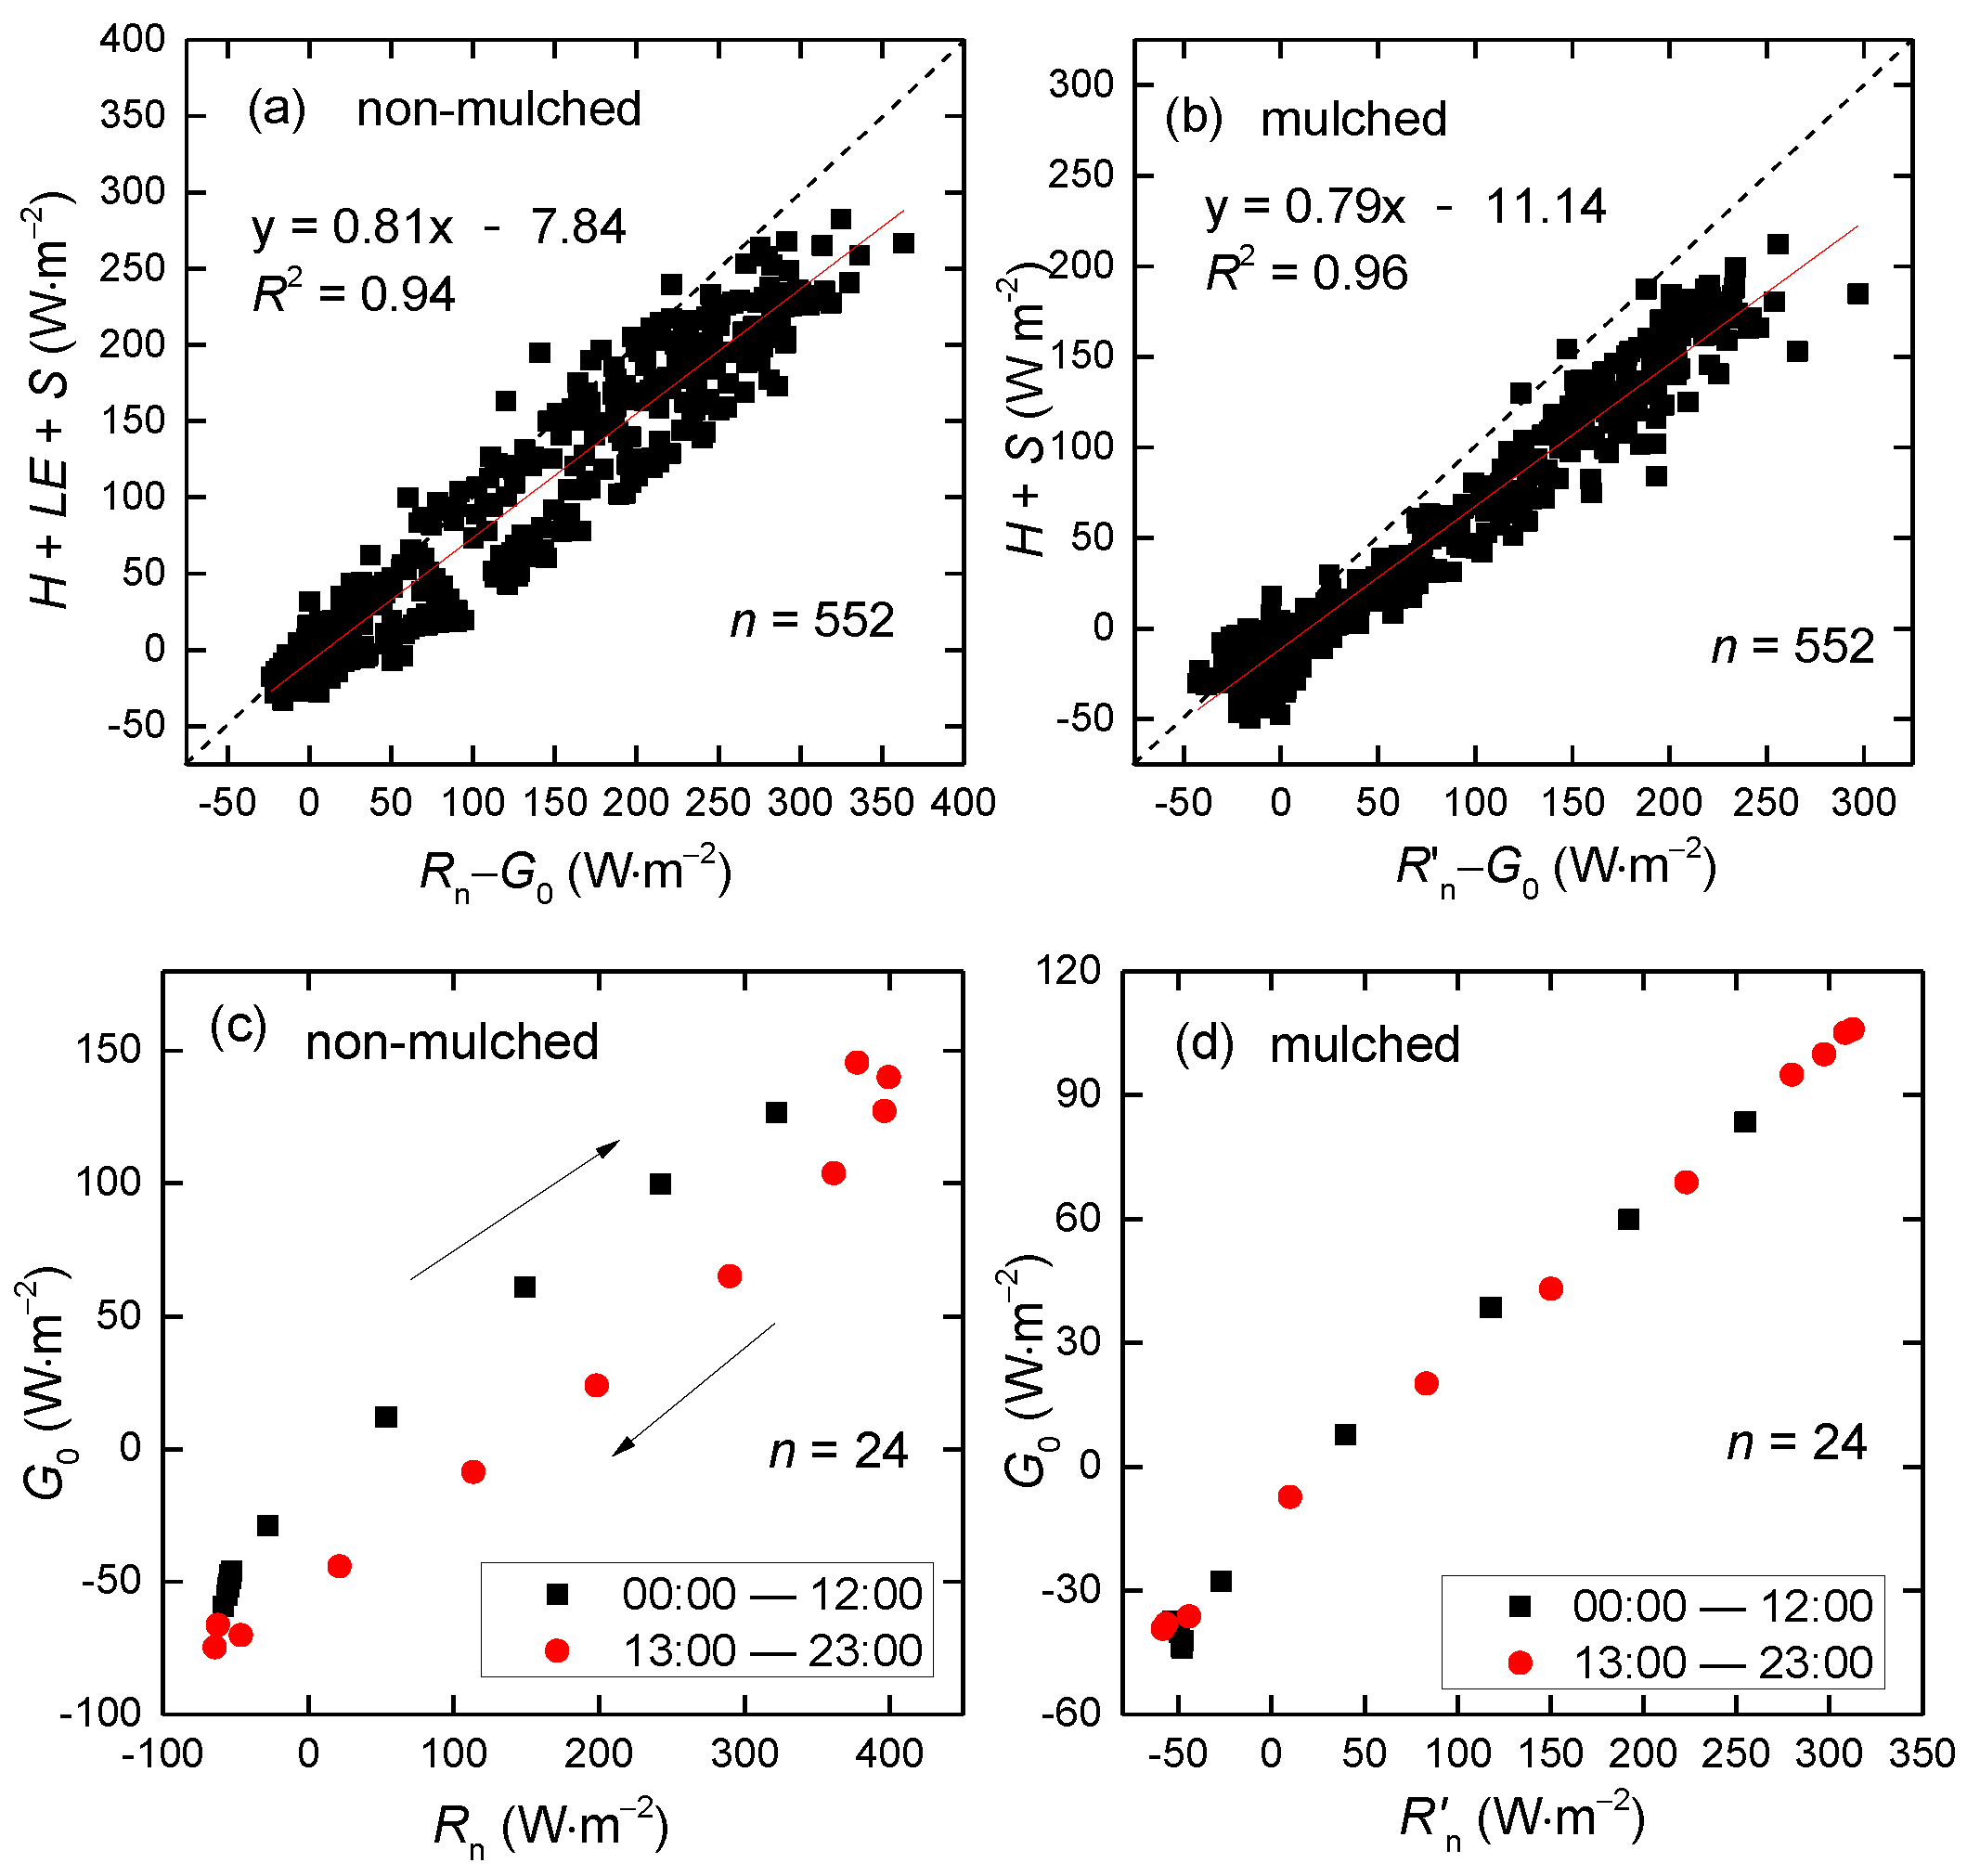
3.3.2. Energy Balance in Mulched and Non-Mulched Soil

To show the effect of plastic mulch on land surface energy balance, data from 23 April–15 May were selected along with the air heat storage and atmospheric moisture change. To show the energy balance closure (EBC), the sum of 3-year mean hourly turbulent energy fluxes (H and LE) and heat storage were plotted against the 3-year mean hourly available energy (RnG0) in Figure 15, using 3-year mean hourly data from 2013–2015 at the Korla site. The EBC in surface soil beneath mulch is 0.79 (Figure 15b), smaller than the 0.81 in non-mulched soil (Figure 15a). That may be because the transpiration is likely not included in mulched soil, as the cotton has emerged on approximately 5 May and has reached a height of 10 cm on 15 May. Moreover, the uncertainty of parameters (emissivity, transmittance of the mulch and the emissivity of soil) in Rn calculation may bring uncertainty of EBC in mulched soil.
There is a hysteresis phenomenon over non-mulched soil (Figure 15a) that appears with an annular distribution with a determination coefficient of 0.94, smaller than the 0.96 over mulched soil. That is mainly because G0 is out of sync with Rn over non-mulched soil (Figure 15c), and G0 generally reaches a diurnal maximum earlier than Rn [4]. In addition, H, LE and S are almost in sync with Rn during the 24-hour period. The available energy is out of sync with turbulent fluxes over non-mulched soil. However, G0 is more in sync with Rn in mulched soil (Figure 15d), as the soil temperature in mulched soil delays, which leads to the hysteresis over G0. That leads to the available energy being in sync with the sum of turbulent energy fluxes and heat storage over mulched soil.

4. Conclusions

Plastic mulch has been widely used in agriculture in Northwest China because it can not only promote soil temperature, but can also reduce water loss from the soil surface, which is beneficial to seed germination. In addition, the mulch also modifies the thermal microclimate of the soil. Nevertheless, few studies address its effect on the soil microclimate and energy balance. This study focused on how the mulch affects G0 and SEB. However, the climate parameters’ change (e.g., air temperature, wind, precipitation, convection cloud, etc.) caused by changed G0 and SEB in mulched soil is not included in the present study. In this study, the hourly surface soil heat flux was calculated from April–September in 2013–2015 using a heat conduction equation based on soil temperature and moisture measurements in mulched and non-mulched soil at the Korla experimental site planted with cotton in the Xinjiang Uygur Autonomous Region. The variations of G0 at different time scales were analyzed. In addition to the surface net radiation beneath mulch, the energy balance in mulched and non-mulched soil were also discussed. The main conclusions obtained from the investigation are summarized as follows:
The 3-year mean hourly G0 in mulched soil is smaller than that in non-mulched soil both day and night from April–September. The plastic mulch not only prevents solar radiation into the soil in the daytime, but also reduces soil heat loss at night. The hourly G0 over mulched soil decreases obviously in late June, as solar energy is blocked by the grown cotton and because the drip irrigation increases soil moisture, making soil temperature vary slowly and bringing about low G0. Moreover, the mulch delays the moment when heat flow changes direction in the afternoon.
Although the hourly G0 are largely different, the 3-year mean daily G0 in non-mulched and mulched soil are similar, with a slope of regression of 1.07 in the seeding and germination period. This shows that mulch has a great impact on instantaneous G0 and less impact on G0 at a daily time scale. During the whole growing season, the daily G0 decreases monotonically. G0 values are positive before July and almost negative starting from early August, which indicates that soil absorbs energy in spring and releases energy in autumn. The sum of positive values of daily G0 in mulched soil is 242.5 W·m−2, larger than 200 W·m−2 in non-mulched soil in the seeding and germination period. The sum of negative G0 over mulched and non-mulched soil is the same, −3.6 W·m−2. Thus, the mulch cumulates more energy into the soil than bare soil.
The surface net radiation beneath the mulch is 0.88 times that over non-mulched soil as less solar radiation enters into the soil through the mulch, while the net long-wave radiation is almost the same as that over non-mulched soil.
The EBC in mulched soil is smaller than that over non-mulched soil, 0.79 versus 0.81, based on 3-year mean hourly Rn, G0, H, LE, air heat storage and atmospheric moisture changes. LE is not included in mulched soil, which may lead to smaller EBC. The uncertainty of R’n coming from the uncertainty of parameters may also affect EBC in mulched soil. A hysteresis phenomenon appears in non-mulched soil between H + LE + S and RnG0, as G0 is out of sync with Rn. However, there is no hysteresis in mulched soil. That is mainly because the soil temperature delays in mulched soil and leads to G0 delays, which makes G0 is sync with Rn. The average EBC is approximately 0.8 in the present study, which is reasonable and consistent with the study of Wilson et al. (2002) [42]. The 20% imbalance may be due to the accuracies of Rn, G0, the mismatch between the turbulent flux footprint and other components of the energy balance, or the absence of advection.

Acknowledgments

This study was supported by NSFC (Natural Science Foundation of China) (51190092) and Key Lab (2016-KY-03).

Author Contributions

The study was carried out in collaboration between all authors. Nana Li and Fuqiang Tian designed the experiment. Nana Li performed the experiment and wrote the manuscript. Hongchang Hu and Hui Lu revised the manuscript. Guanghui Ming checked the experimental data. All authors agreed to the submission of the manuscript.

Conflicts of Interest

The authors declare no conflict of interest.

Abbreviations

The following abbreviations are used in this manuscript:
Rn
net radiation for bare soil (non-mulched)
Rn
net radiation for soil beneath mulch
G0
surface soil heat flux
LE
latent heat flux
L
latent heat of vaporization
H
sensible heat flux
ρscs
soil volumetric heat capacity
ρsolidcsolid
volumetric heat capacity of the soil solids
ρwcw
volumetric heat capacity of liquid water
ρaca
air volumetric heat capacity
θsat
soil porosity
θ
soil water content
T (z,t)
soil temperature at depth z and time t
T (z0)
soil temperature at surface
Ts
soil temperature at surface, same as T (z0)
Ts
surface soil temperature beneath the mulch
Tm
mulch temperature
Ta
air temperature
S
solar radiation
R L
upward long-wave radiation flux
R L
downward long-wave radiation flux
εs
land surface emissivity
εm
mulch emissivity
σ
Stefan–Boltzmann constant
rs
surface soil reflectivity
τm1
transmittance of mulch for solar radiation
τm2
transmittance of mulch for thermal radiation
q
moist air density
h
the height of the EC
Sc
canopy heat storage in the biomass
Sp
photosynthesis flux
Sa
air storage
Sq
atmospheric moisture change
Sd
canopy dew enthalpy change

References

  1. Baldocchi, D.D.; Vogel, C.A.; Hall, B. Seasonal variation of carbon dioxide exchange rates above and below a boreal jack pine forest. Agric. For. Meteorol. 1997, 83, 147–170. [Google Scholar] [CrossRef]
  2. Li, N.; Jiang, L. Temporal variations in the surface soil heat flux over maize and grass surfaces in Northwest China. Soil Sci. Soc. Am. J. 2015, 79, 1084–1093. [Google Scholar] [CrossRef]
  3. Zuo, J.; Wang, J.; Huang, J.; Li, W.; Wang, G.; Ren, H. Estimation of ground heat flux and its impact on the surface energy budget for a semi-arid grassland. Sci. Cold Arid. Reg. 2011, 3, 41–50. [Google Scholar]
  4. Li, N.; Jia, L.; Lu, J. An improved algorithm to estimate the surface soil heat flux over a heterogeneous surface: A case study in the heihe river basin. Sci. China Earth Sci. 2015, 58, 1169–1181. [Google Scholar] [CrossRef]
  5. Katul, G.G.; Oren, R.; Manzoni, S.; Higgins, C.; Parlange, M.B. Evapotranspiration: A process driving mass transport and energy exchange in the soil-plant-atmosphere-climate system. Rev. Geophys. 2012, 50. [Google Scholar] [CrossRef] [Green Version]
  6. Allen, R.G.; Tasumi, M.; Trezza, R. Satellite-based energy balance for mapping evapotranspiration with internalized calibration (metric)—model. J. Irrig. Drain. Eng. 2007, 133, 380–394. [Google Scholar] [CrossRef]
  7. Bastiaanssen, W.; Menenti, M.; Feddes, R.; Holtslag, A. A remote sensing surface energy balance algorithm for land (Sebal). 1. Formulation. J. Hydrol. 1998, 212, 198–212. [Google Scholar] [CrossRef]
  8. Idso, S.B.; Aase, J.K.; Jackson, R.D. Net radiation—Soil heat flux relations as influenced by soil water content variations. Bound.-Layer Meteorol. 1975, 9, 113–122. [Google Scholar] [CrossRef]
  9. Clothier, B.E.; Clawson, K.L.; Pinter, P.J., Jr.; Moran, M.S.; Reginato, R.J.; Jackson, R.D. Estimation of soil heat flux from net radiation during the growth of alfalfa. Agric. For. Meteorol. 1986, 37, 319–329. [Google Scholar] [CrossRef]
  10. Kustas, W.P.; Daughtry, C.S.T. Estimation of the soil heat flux/net radiation ratio from spectral data. Agric. For. Meteorol. 1990, 49, 205–223. [Google Scholar] [CrossRef]
  11. Kustas, W.P.; Daughtry, C.S.T.; Van Oevelen, P.J. Analytical treatment of the relationships between soil heat flux/net radiation ratio and vegetation indices. Remote Sens. Environ. 1993, 46, 319–330. [Google Scholar] [CrossRef]
  12. Gao, Z.Q. Determination of soil heat flux in a tibetan short-grass prairie. Bound.-Layer Meteorol. 2005, 114, 165–178. [Google Scholar] [CrossRef]
  13. Gentine, P.; Entekhabi, D.; Heusinkveld, B. Systematic errors in ground heat flux estimation and their correction. Water Resour. Res. 2012, 48. [Google Scholar] [CrossRef]
  14. Cammalleri, C.; La Loggia, G.; Maltese, A. Critical analysis of empirical ground heat flux equations on a cereal field using micrometeorological data. Proc. SPIE 7472 2009. [Google Scholar] [CrossRef]
  15. Liebethal, C.; Huwe, B.; Foken, T. Sensitivity analysis for two ground heat flux calculation approaches. Agric. For. Meteorol. 2005, 132, 253–262. [Google Scholar] [CrossRef]
  16. Stull, R.B. Boundary layer clouds. In An Introduction to Boundary Layer Meteorology; Stull, R.B., Ed.; Springer Netherlands: Dordrecht, The Netherlands, 1988; pp. 545–585. [Google Scholar]
  17. Sridhar, V. Tracking the influence of irrigation on land surface fluxes and boundary layer climatology. J. Contemp. Water Res. Educ. 2013, 152, 79–93. [Google Scholar] [CrossRef]
  18. Case, J.L.; Crosson, W.L.; Kumar, S.V.; Lapenta, W.M.; Peters-Lidard, C.D. Impacts of high-resolution land surface initialization on regional sensible weather forecasts from the WRF model. J. Hydrometeorol. 2008, 9, 1249–1266. [Google Scholar] [CrossRef]
  19. Dirmeyer, P.A.; Koster, R.D.; Guo, Z. Do global models properly represent the feedback between land and atmosphere? J. Hydrometeorol. 2006, 7, 1177–1198. [Google Scholar] [CrossRef]
  20. Kala, J.; Lyons, T.; Nair, U. Numerical simulations of the impacts of land-cover change on cold fronts in South-West Western Australia. Bound.-Layer Meteorol. 2011, 138, 121–138. [Google Scholar] [CrossRef]
  21. Fu, C. Potential impacts of human-induced land cover change on east Asia monsoon. Glob. Planet. Chang. 2003, 37, 219–229. [Google Scholar] [CrossRef]
  22. Pielke, R.A. Land use and climate change. Science 2005, 310, 1625–1626. [Google Scholar] [CrossRef] [PubMed]
  23. Wang, R.; Kang, Y.; Wan, S.; Hu, W.; Liu, S.; Liu, S. Salt distribution and the growth of cotton under different drip irrigation regimes in a saline area. Agric. Water Manag. 2011, 100, 58–69. [Google Scholar] [CrossRef]
  24. Zhang, Z.; Tian, F.; Hu, H.; Yang, P. A comparison of methods for determining field evapotranspiration: Photosynthesis system, sap flow, and eddy covariance. Hydrol. Earth Syst. Sci. 2014, 18, 1053–1072. [Google Scholar] [CrossRef]
  25. Katan, J. Solar heating (solarization) of soil for control of soilborne pests. Annu. Rev. Phytopathol. 1981, 19, 211–236. [Google Scholar] [CrossRef]
  26. Bonachela, S.; Orgaz, F.; Villalobos, F.J.; Fereres, E. Soil evaporation from drip-irrigated olive orchards. Irrig. Sci. 2001, 20, 65–71. [Google Scholar] [CrossRef]
  27. Hou, X.-Y.; Wang, F.-X.; Han, J.-J.; Kang, S.-Z.; Feng, S.-Y. Duration of plastic mulch for potato growth under drip irrigation in an arid region of Northwest china. Agric. For. Meteorol. 2010, 150, 115–121. [Google Scholar] [CrossRef]
  28. Li, S.; Kang, S.; Li, F.; Zhang, L. Evapotranspiration and crop coefficient of spring maize with plastic mulch using eddy covariance in Northwest china. Agric. Water Manag. 2008, 95, 1214–1222. [Google Scholar] [CrossRef]
  29. Ramakrishna, A.; Tam, H.M.; Wani, S.P.; Long, T.D. Effect of mulch on soil temperature, moisture, weed infestation and yield of groundnut in Northern Vietnam. Field Crops Res. 2006, 95, 115–125. [Google Scholar] [CrossRef]
  30. Zhang, Z.; Tian, F.; Zhong, R.; Hu, H. Spatial and temporal pattern of soil temperature in cotton field under mulched drip irrigation condition in Xinjiang. Trans. CSAE 2011, 27, 44–51. [Google Scholar]
  31. Zhang, Z.; Hu, H.; Tian, F.; Hu, H.; Yao, X.; Zhong, R. Soil salt distribution under mulched drip irrigation in an arid area of Northwestern China. J. Arid Environ. 2014, 104, 23–33. [Google Scholar] [CrossRef]
  32. Hu, H.; Tian, F.; Hu, H. Soil particle size distribution and its relationship with soil water and salt under mulched drip irrigation in Xinjiang of China. Sci. China: Technol. Sci. 2011, 54, 1568–1574. [Google Scholar] [CrossRef]
  33. Heusinkveld, B.G.; Jacobs, A.F.G.; Holtslag, A.A.M.; Berkowicz, S.M. Surface energy balance closure in an arid region: Role of soil heat flux. Agric. For. Meteorol. 2004, 122, 21–37. [Google Scholar] [CrossRef]
  34. Meyers, T.P.; Hollinger, S.E. An assessment of storage terms in the surface energy balance of maize and soybean. Agric. For. Meteorol. 2004, 125, 105–115. [Google Scholar] [CrossRef]
  35. Jacobs, A.G.; Heusinkveld, B.; Holtslag, A.M. Towards closing the surface energy budget of a mid-latitude grassland. Bound.-Layer Meteorol. 2008, 126, 125–136. [Google Scholar] [CrossRef]
  36. Yang, K.; Wang, J. A temperature prediction-correction method for estimating surface soil heat flux from soil temperature and moisture data. Sci. China Ser. D-Earth Sci. 2008, 51, 721–729. [Google Scholar] [CrossRef]
  37. Tarara, J.M. Microclimate modification with plastic mulch. HortScience 2000, 35, 169–180. [Google Scholar]
  38. Xu, Z.; Liu, S.; Xu, T.; Ding, C. The observation and calculation method of soil heat flux and its impact on the energy balance closure. Adv. Earth Sci. 2013, 28, 875–889. [Google Scholar]
  39. Liakatas, A.; Clark, J.; Monteith, J. Measurements of the heat balance under plastic mulches. Part I. Radiation balance and soil heat flux. Agric. For. Meteorol. 1986, 36, 227–239. [Google Scholar] [CrossRef]
  40. Chung, S.O.; Horton, R. Soil heat and water flow with a partial surface mulch. Water Resour. Res. 1987, 23, 2175–2186. [Google Scholar] [CrossRef]
  41. Hares, M.A.; Novak, M.D. Simulation of surface energy balance and soil temperature under strip tillage: II. Field test. Soil Sci. Soc. Am. J. 1992, 56, 29–36. [Google Scholar] [CrossRef]
  42. Wilson, K.; Goldstein, A.; Falge, E.; Aubinet, M.; Baldocchi, D.; Berbigier, P.; Bernhofer, C.; Ceulemans, R.; Dolman, H.; Field, C.; et al. Energy balance closure at fluxnet sites. Agric. For. Meteorol. 2002, 113, 223–243. [Google Scholar] [CrossRef]
Figure 1. The location of the Korla site in the Tarim River Basin in Northwest China.
Atmosphere 07 00107 g001
Figure 2. The plastic mulch and drip pipe in a cotton field at the Korla site. The locations marked 1 and 2 represent mulched soil and non-mulched soil, respectively.
Atmosphere 07 00107 g002
Figure 3. (a) The plastic mulch when the cotton is just planted; (b) the soil temperature and moisture sensors; (c) the net radiation sensor and eddy covariance system at the Korla site.
Atmosphere 07 00107 g003
Figure 4. The 3-year mean hourly soil temperature observation in non-mulched and mulched soil (a) at 5 cm, (b) 10 cm, (c) 20 cm and (d) net radiation Rn, sensible heat flux H and latent heat flux LE observations during the seedling emergence period (23 April–15 May) at the Korla site from 2013–2015.
Atmosphere 07 00107 g004
Figure 5. Scatter plot of soil temperature at (a) 5 cm, (b) 10 cm and (c) 20 cm in non-mulched soil versus in mulched soil during the 3-year mean 24-hour period at the Korla site from 2013–2015. The number of data points is 24.
Atmosphere 07 00107 g005
Figure 6. The variations of the 3-year mean hourly G0 over mulched and non-mulched soil from 23 April 2013–18 September 2015; the vertical dashed line is at 15 May.
Atmosphere 07 00107 g006
Figure 7. Scatter plot of the 3-year mean hourly G0 in non-mulched soil versus in mulched soil during (a) 23 April–15 May and (b) 16 May–18 September at the Korla site in 2013–2015. The number of data points is 552 and 3024, respectively.
Atmosphere 07 00107 g007
Figure 8. The 3-year mean diurnal variations of G0 in mulched and non-mulched soil from (a) 23 April–15 May; (b) 1 July–31 August and (c) 23 April–18 September; (df) scatterplots of the mean diurnal G0 in non-mulched soil versus G0 in mulched soil in the three periods in 2013–2015.
Atmosphere 07 00107 g008
Figure 9. Variations of the 3-year mean daily amplitude of observed soil temperature (5 cm in 2013 and 2015, 10 cm in 2014) over mulched and non-mulched zone from April–September; the vertical dashed line is 15 May.
Atmosphere 07 00107 g009
Figure 10. The 3-year mean daily G0 over mulched and non-mulched soil from 23 April–18 September at the Korla site in 2013–2015.
Atmosphere 07 00107 g010
Figure 11. Scattergrams of the 3-year mean daily G0 over non-mulched soil versus over mulched soil from (a) 23 April–18 September and (b) 23 April–15 May at the Korla site in 2013–2015.
Atmosphere 07 00107 g011
Figure 12. The seven-day mean hourly mulch and soil temperature beneath the mulch observed by an infrared thermometer. (a) Variation of temperature from 8:00–20:00, (b) mulch temperature vs. soil temperature beneath the mulch at the Korla site in 2016.
Atmosphere 07 00107 g012
Figure 13. The 3-year mean diurnal variation of (a) net radiation in non-mulched soil and in soil beneath mulch, (b) net short-wave radiation and net long-wave radiation in non-mulched soil and in soil beneath mulch from 23 April–15 May at the Korla site in 2013–2015. Rs represents short-wave radiation, and Rl is long-wave radiation.
Atmosphere 07 00107 g013
Figure 14. The 3-year mean hourly (a) net radiation in non-mulched soil vs. in soil beneath mulch; (b) net short-wave radiation in non-mulched soil vs. in soil beneath mulch and (c) net long-wave radiation in non-mulched soil vs. in soil beneath mulch at the Korla site in 2013–2015.
Atmosphere 07 00107 g014
Figure 15. Scatterplot of the 3-year mean hourly (a) available energy (RnG0) vs. (H + LE + S) in non-mulched soil and (b) (RnG0) vs. (H + S) in mulched soil at the Korla site from April–May in 2013–2015. The 3-year mean 24-hour Rn vs. G0 (c) in non-mulched and (d) in mulched soil. H and LE are the sensible and latent heat flux measured by EC, and S is the sum of air heat storage and atmospheric moisture change calculated by Equation (8) and Equation (9). Rn is net radiation in mulched soil.
Atmosphere 07 00107 g015
Table 1. The parameters and depths/heights of sensors at the Korla site during 2013–2015.
InstrumentParameters2013 (m)2014 (m)2015 (m)
Eddy covariance system (EC)Latent heat flux and sensible heat flux2.252.252.25
Atmospheric moisture density2.252.252.25
Automatic weather station (AWS)Soil temperature0.05, 0.1, 0.2, 0.3, 0.4, 0.5, 0.6, 0.80.1, 0.2, 0.3, 0.5, 0.60.05, 0.1, 0.2, 0.3, 0.4, 0.6, 0.8, 1.0, 1.2
Soil water content0.05, 0.1, 0.2, 0.3, 0.4, 0.5, 0.6, 0.80.1, 0.2, 0.3, 0.5, 0.60.05, 0.1, 0.2, 0.3, 0.4, 0.6, 0.8, 1.0, 1.2
Net radiation2.252.252.25
Air temperature2.82.82.8
Table 2. The sum of positive, negative and all 3-year mean daily G0 values over non-mulched and mulched soil from 23 April–15 May and from 16 May–18 September at the Korla site in 2013–2015.
Non-mulchedBeneath MulchNon-mulchedBeneath Mulch
23 April–15 May (W·m–2)16 May–18 September (W·m–2)
Sum of positive200.0242.5409.0446.5
Sum of negative−3.6−3.6−281.7−202.5
Sum196.4238.8127.4244.0

