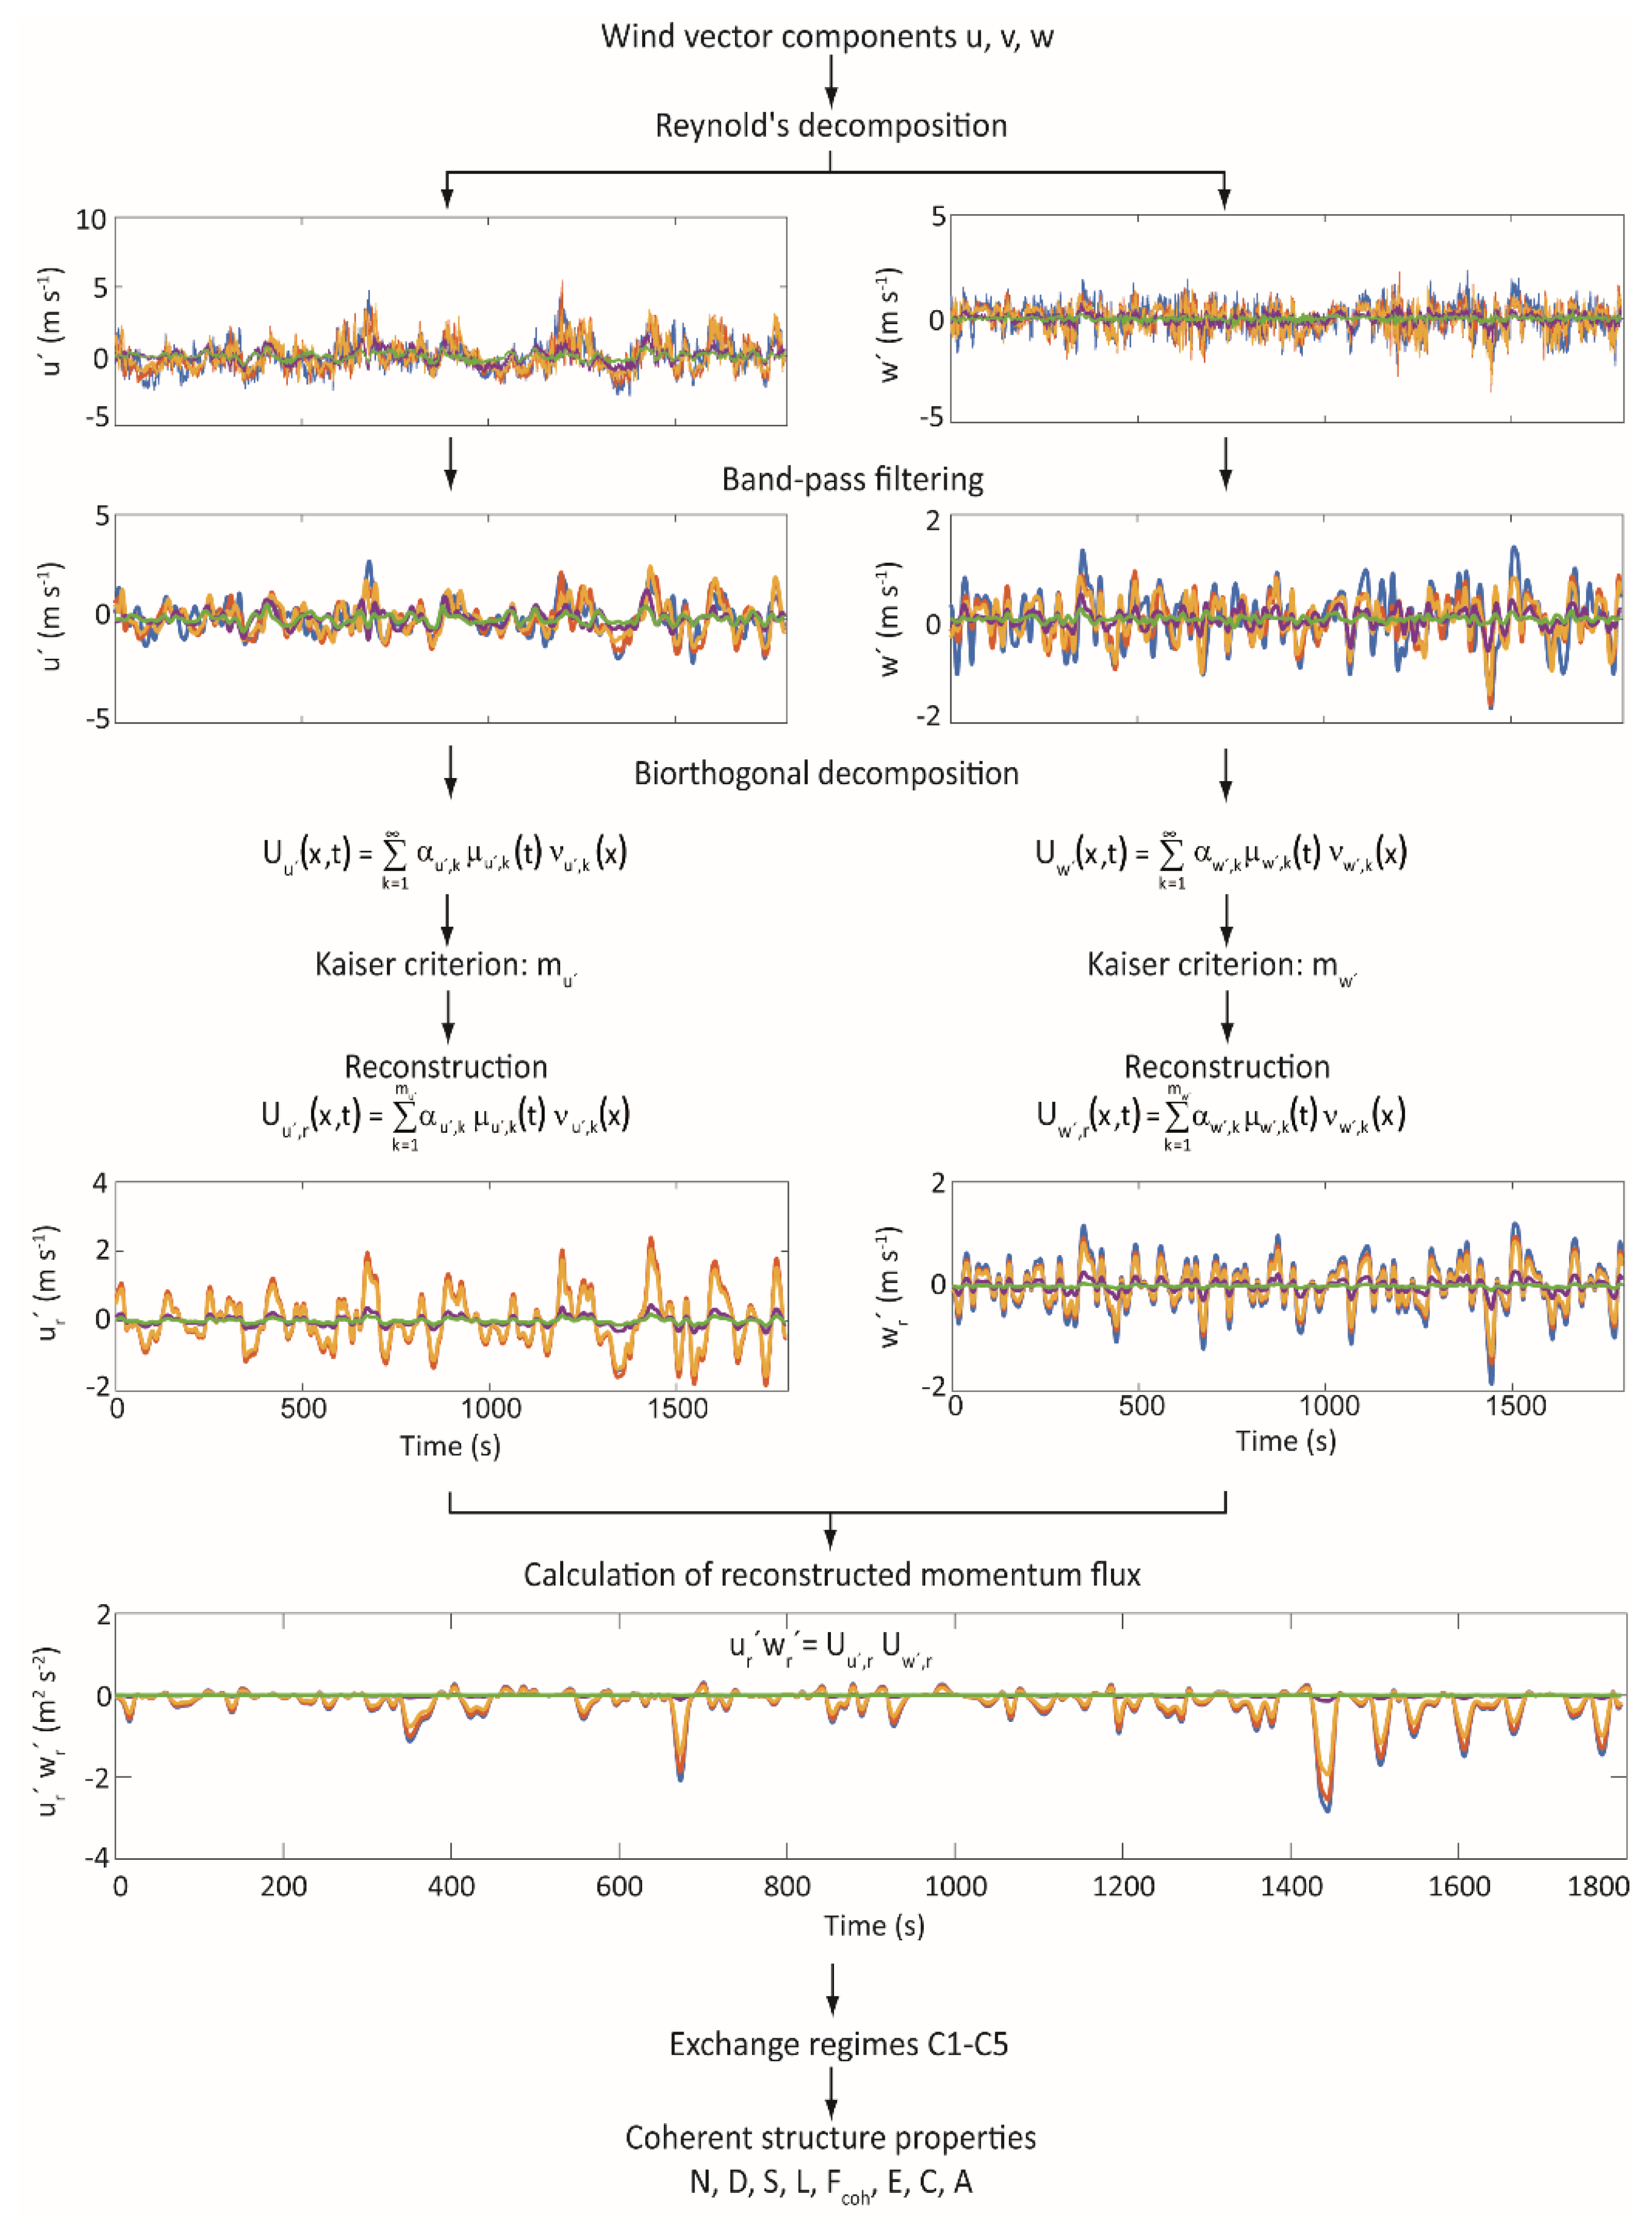
3.1. Wavelet Analysis vs. BOD
To highlight the differences in the temporal behavior of
Cpeak and reconstructed momentum flux
,
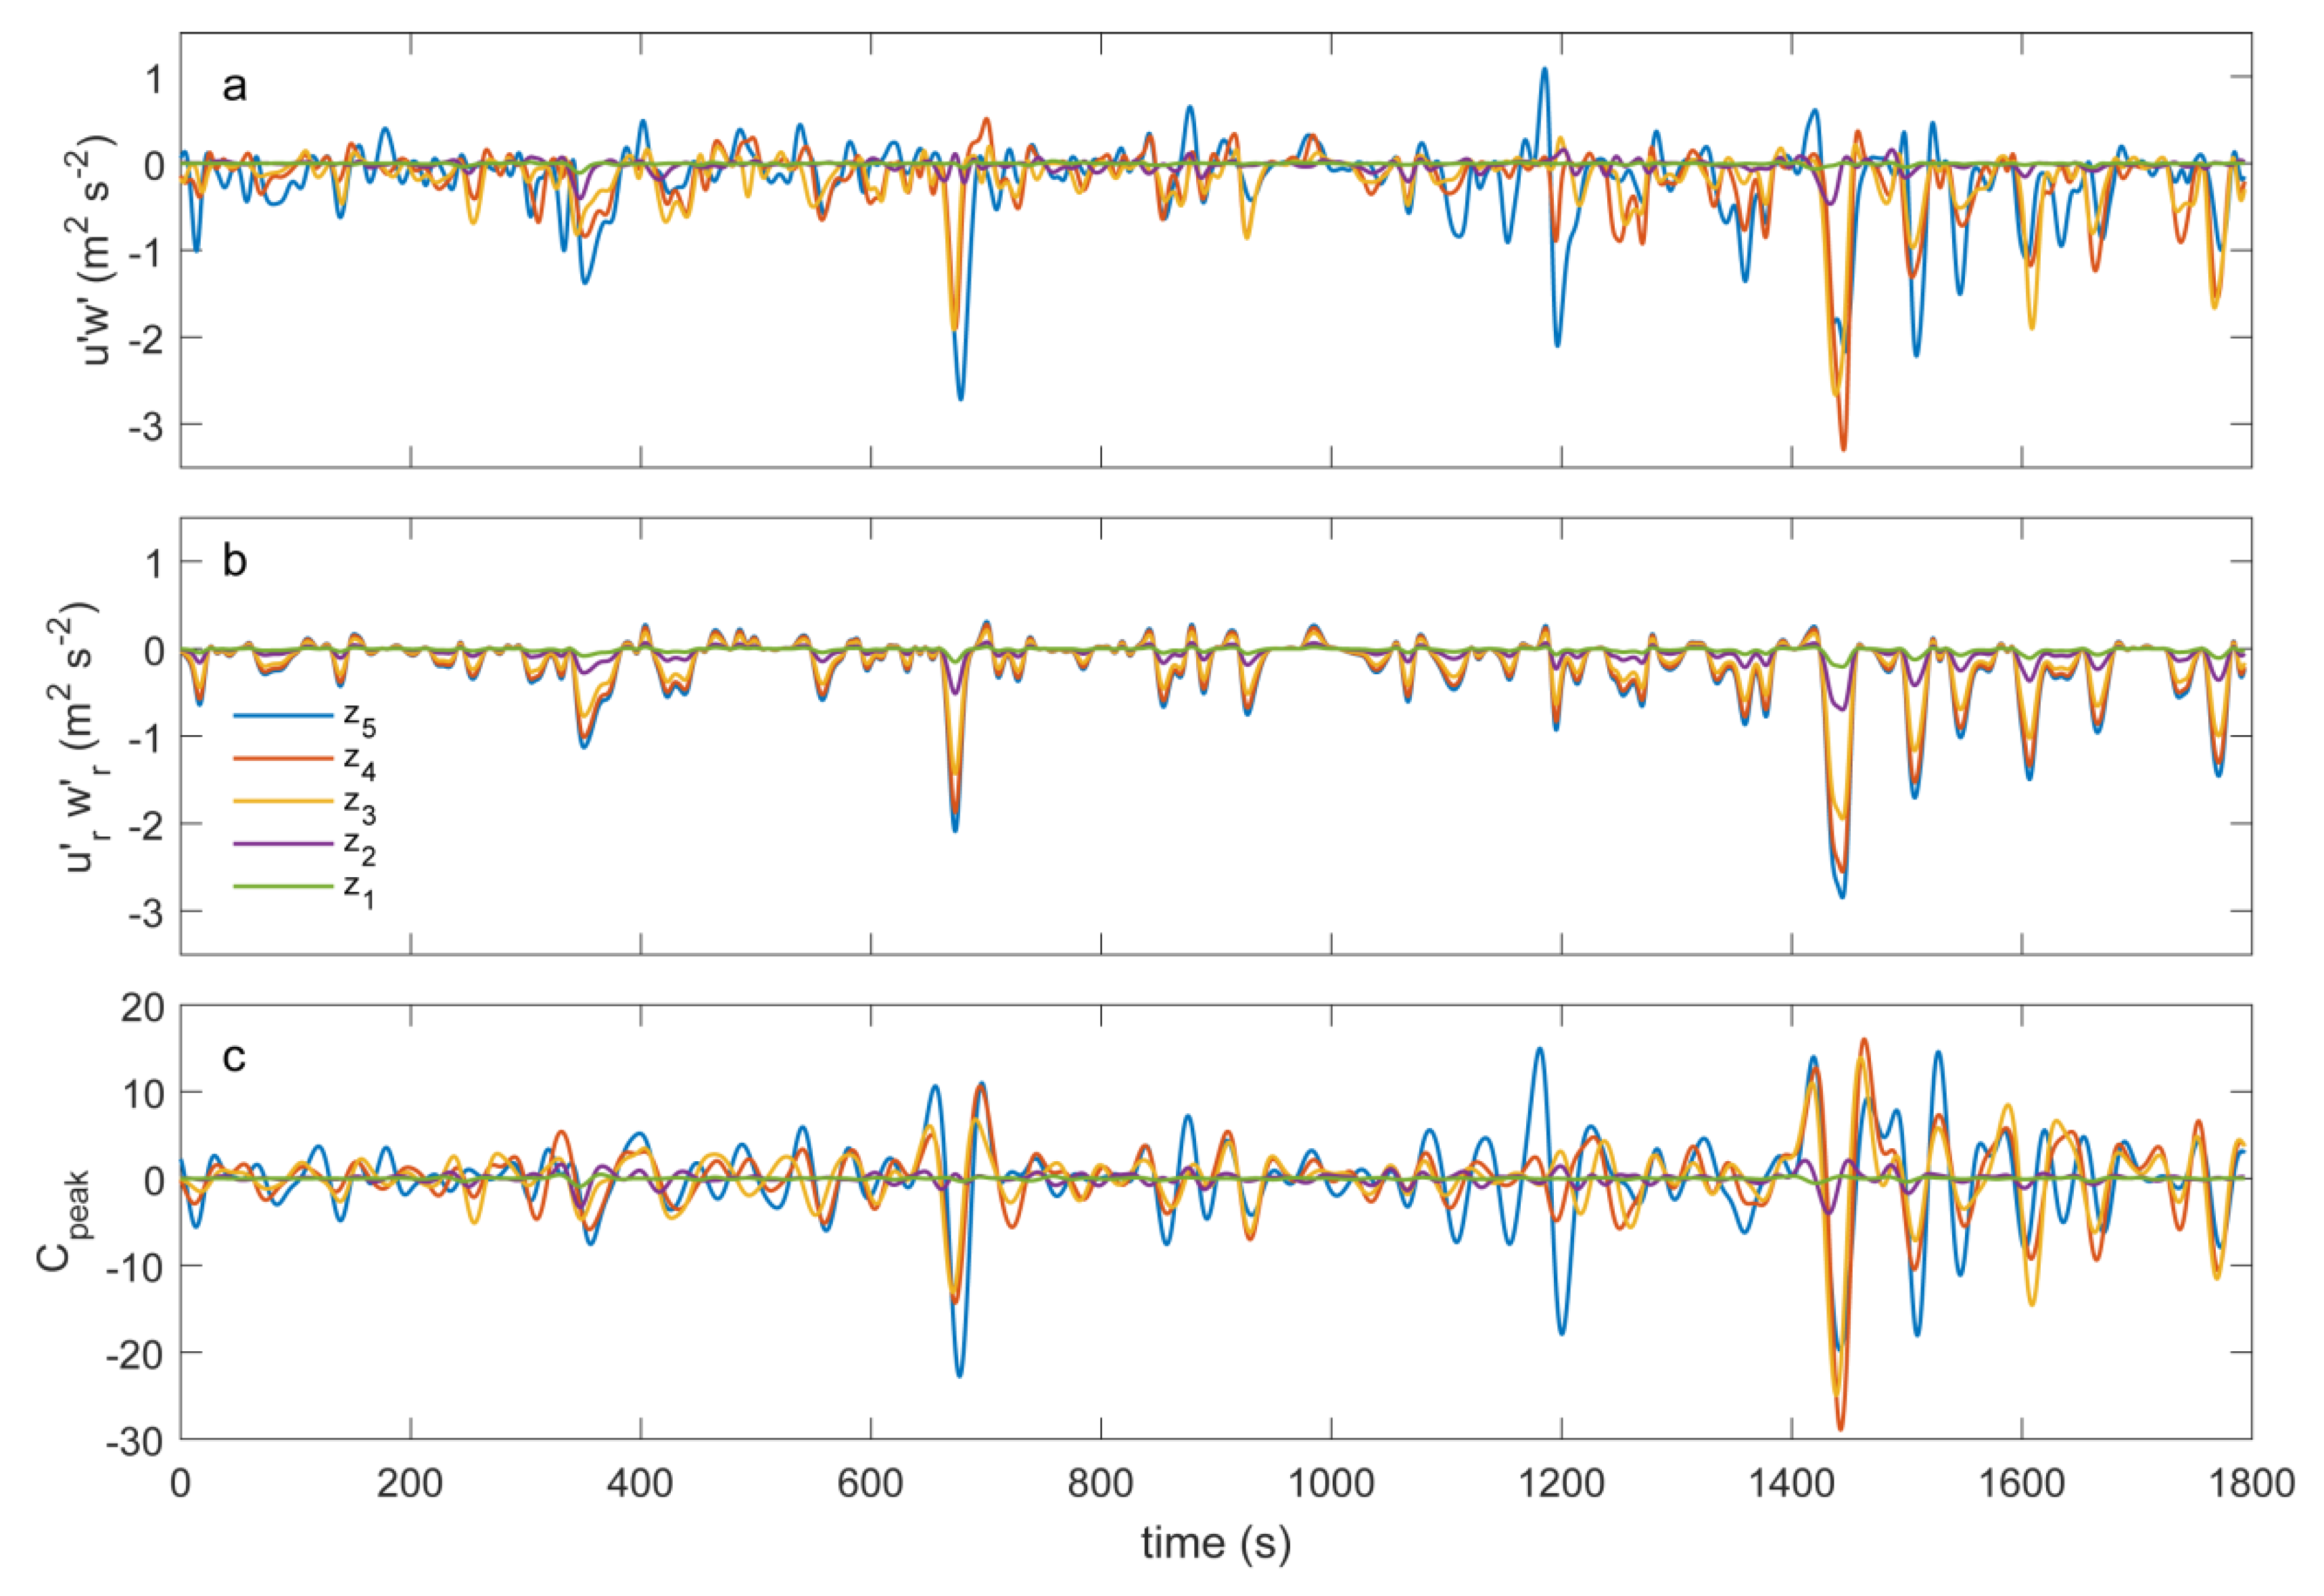
Figure 4 shows a comparison of
with
and
Cpeak over a half-hourly interval (12:30–13:00 CET, 2 August 2014). One useful BOD component explaining 79% of total
variance was used to build
, and one BOD component explaining 82% of total
variance was used to build
.
The wavelet analysis is carried out separately at every height. As a consequence, the peak scales speak vary from height to height, which poses a problem when comparing similarities between of adjacent heights. The calculated peak scales for z1–z5 are 91, 95, 104, 106 and 100, corresponding to Fourier-equivalent frequencies (periods) of 0.028 Hz (36.4 s), 0.029 Hz (34.0 s), 0.024 Hz (41.6 s), 0.024 Hz (42.4 s) and 0.025 Hz (40.0 s). On the other hand, the BOD includes z1–z5 simultaneously and produces similar temporal behavior at all measurement heights. Thus, extracts the features in that are common to all heights.
The calculation of the absolute differences between the correlation coefficients obtained from BOD and wavelet analysis over all half-hourly intervals leads to the result that the correlation between
,
and
calculated for any two adjacent heights is 21%, 32% and 46% stronger for BOD than for wavelet analysis (
Table 3).
3.2. Exchange Regimes
In the measurement period, C1 covers 42.4% of the analyzed half-hourly intervals. The exchange regime C2 was not detected in the analyzed dataset. The exchange regimes C3–C5, which indicate increasing penetration depth of coherent structures into the below-canopy space, were detected in 23.6%, 15.2% and 18.8% of the half-hourly intervals.
In
Table 4, fractions of C1–C5 are summarized as a function of atmospheric stability. From that, it can be inferred that C1 is the dominant exchange regime under stable conditions and transition to stable, covering 92.7% and 64.0% of all cases. Furthermore, it is obvious that with increasing instability, the occurrence of coherent structures penetrating into the canopy clearly increases, as the fractions of C4 and C5 increases. Under forced convection, C4 and C5 dominate,
i.e., momentum is transferred from above the canopy into the below-canopy space.
A comparison of the results obtained by BOD with the results reported in previous studies shows general agreement on the proportions of exchange regimes. A study investigated exchange regimes in a spruce forest based on wavelet analysis during a period of five days with
[
9]. The definition of exchange regimes used in that study was based on the vertical profiles of buoyancy exchange of coherent structures [
33]: wave motion (Wa), decoupled canopy (Dc), decoupled sub-canopy (Ds), coupled sub-canopy by sweeps (Cs) and fully-coupled canopy (C).
In terms of coupling between above- and below-canopy airflow, C1 and C2 can be compared to Wa and Dc, C3 to Ds and C4 and C5 to Cs and C. The proportions of exchange regimes reported by [
9] are: Wa = 47.3%, Dc = 4.3%, Ds = 17.9%, Cs = 20.1%, C = 10.3%. The results obtained here are: C1 = 42.4%, C2 = 0.0%, C3 = 23.6%, C4 = 15.2%, C5 = 18.8%.
Although a comparison between both studies is not straightforward, because [
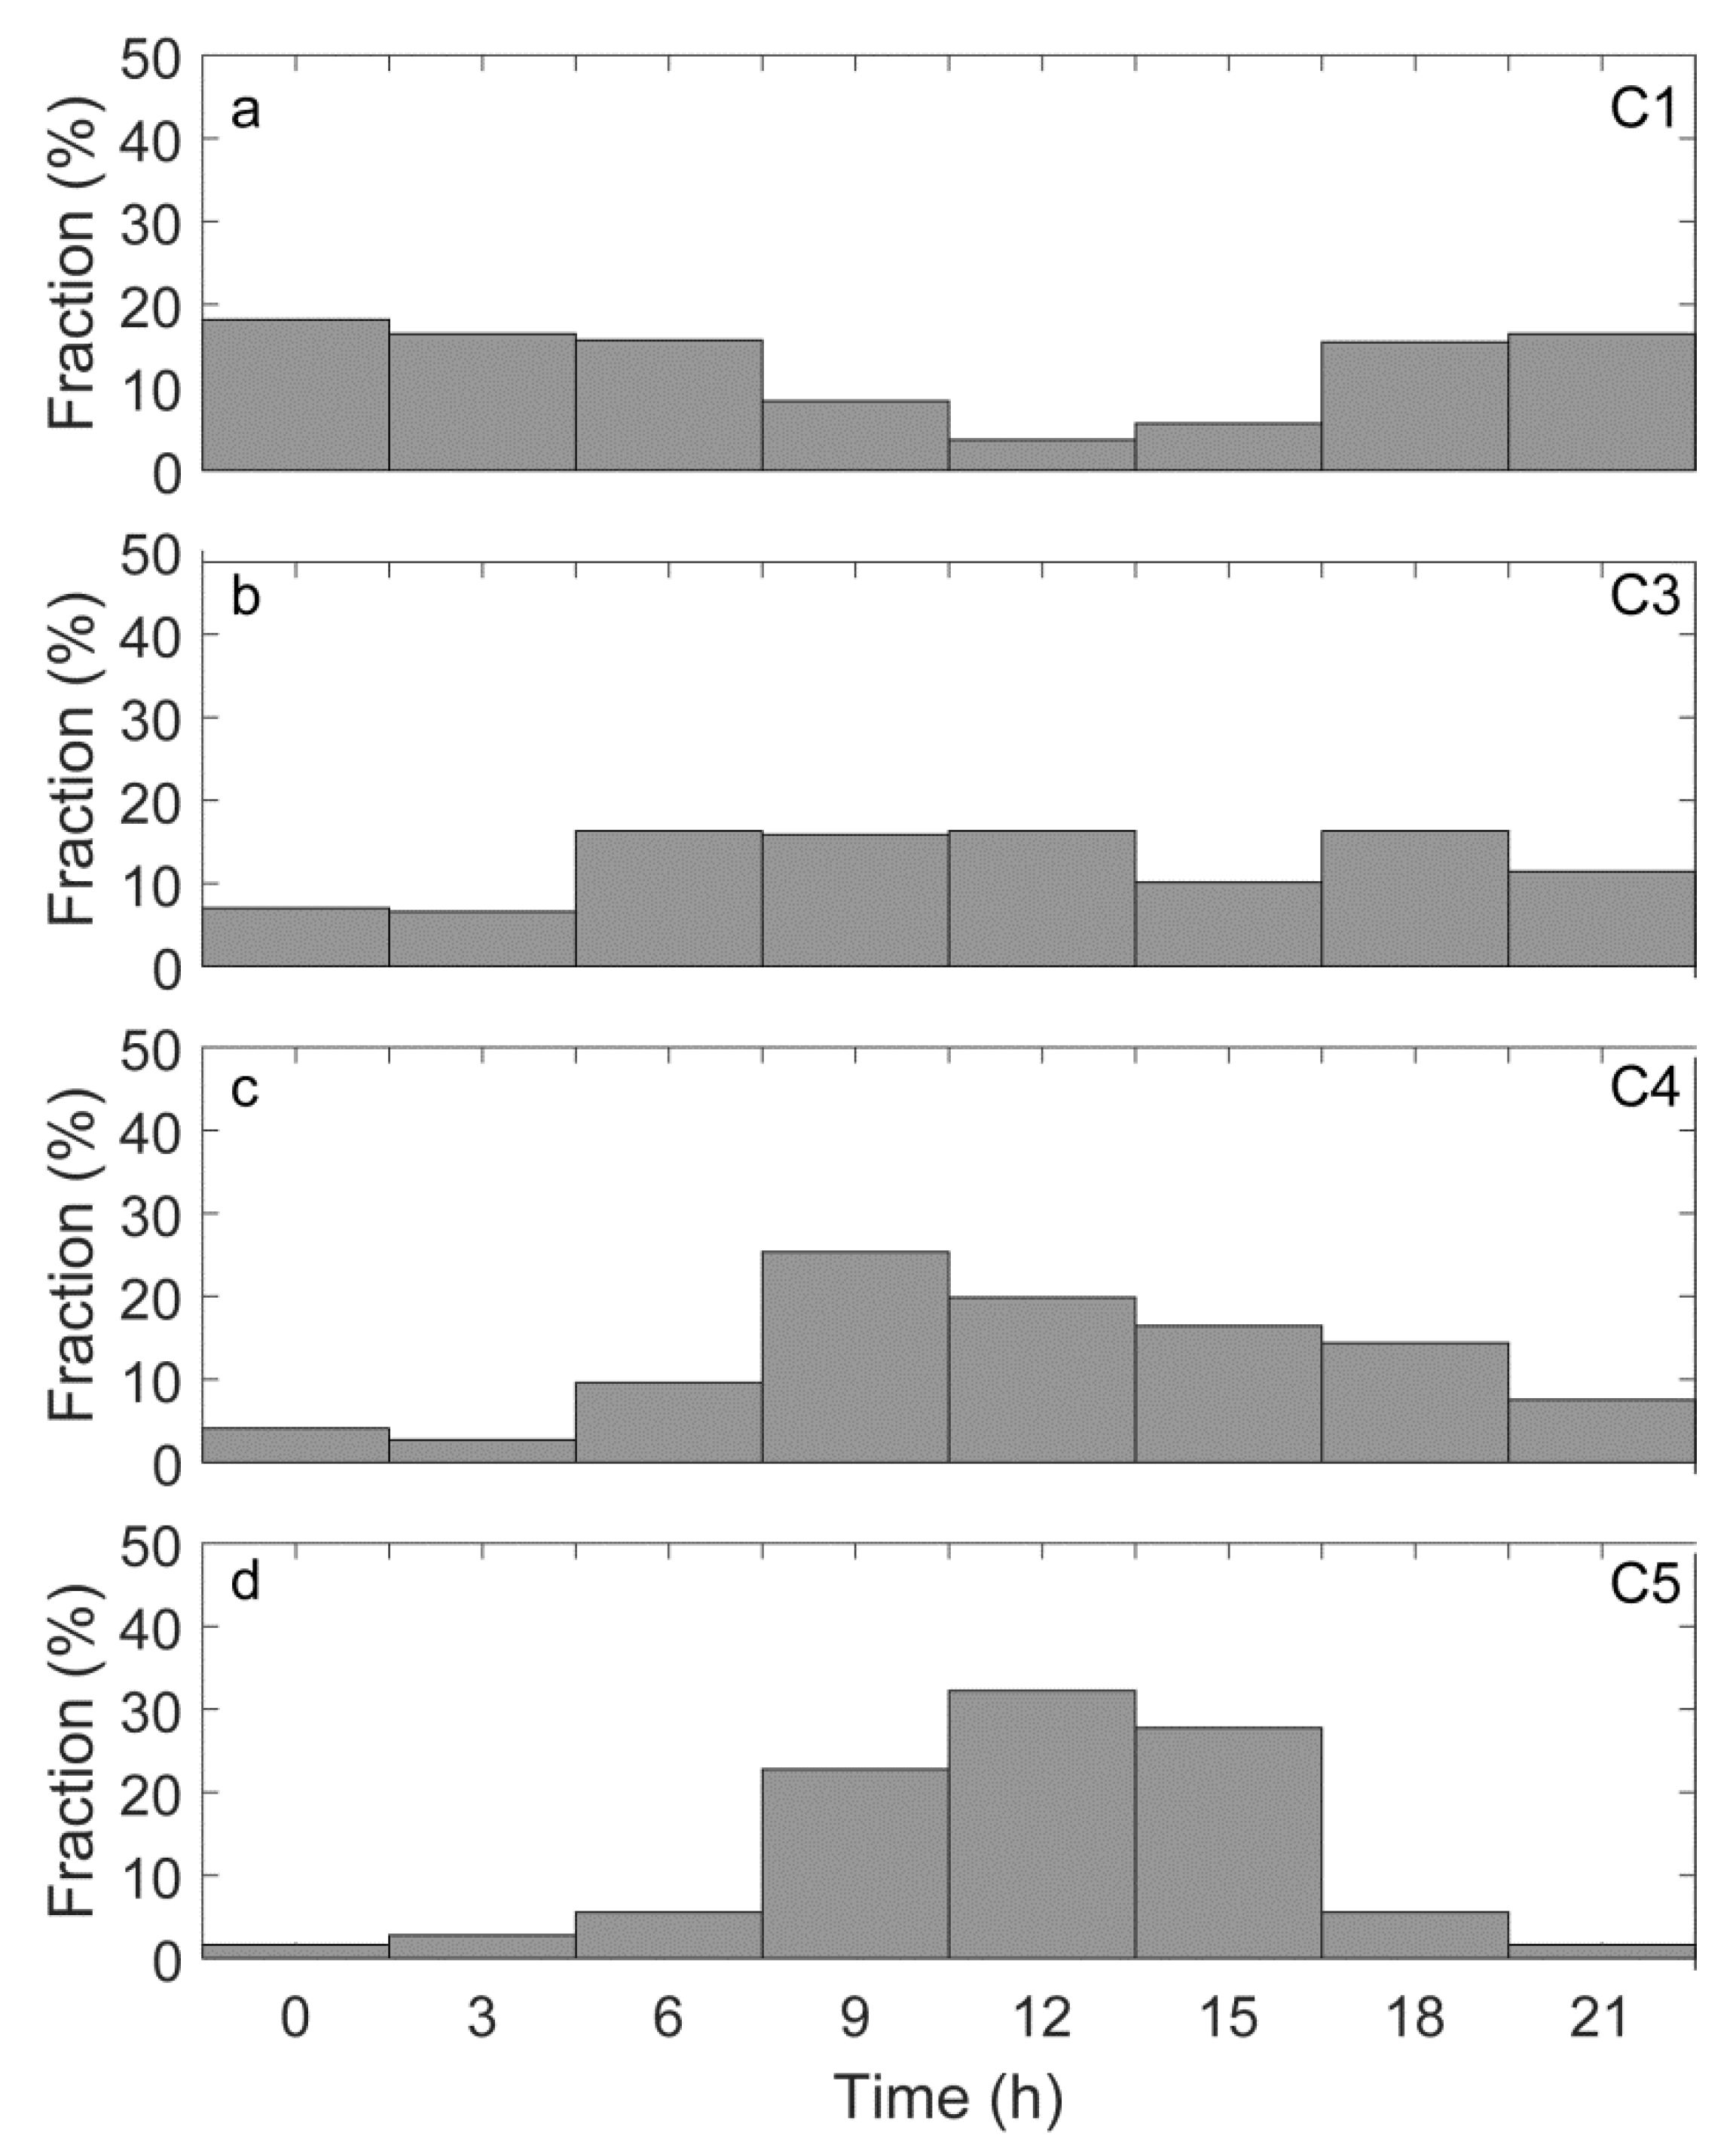
9] used a classification of exchange regimes based on buoyancy exchange, some common results are found. First, most of the time, there is no coupling between above-canopy air and below-canopy air (Wa + Dc = 51.6%; C1 + C2 = 42.4%). Second, the proportions of exchange regimes associated with a coupling between above- and below-canopy air are in a similar range (Cs + C = 30.4%; C4 + C5 = 34.0%). Furthermore, specific exchange regimes seem to occur at certain times throughout the day (
Figure 5). While C1 was observed more often at night, C3–C5 occurred mostly during daytime with C4 occurrence peaking in the morning and C5 occurrence peaking at noon, which is in good agreement with previous findings [
33]. With increasing solar radiation, however, stability decreases, which increases the vertical transport. Thus, coupling between air above and below the canopy becomes more likely.
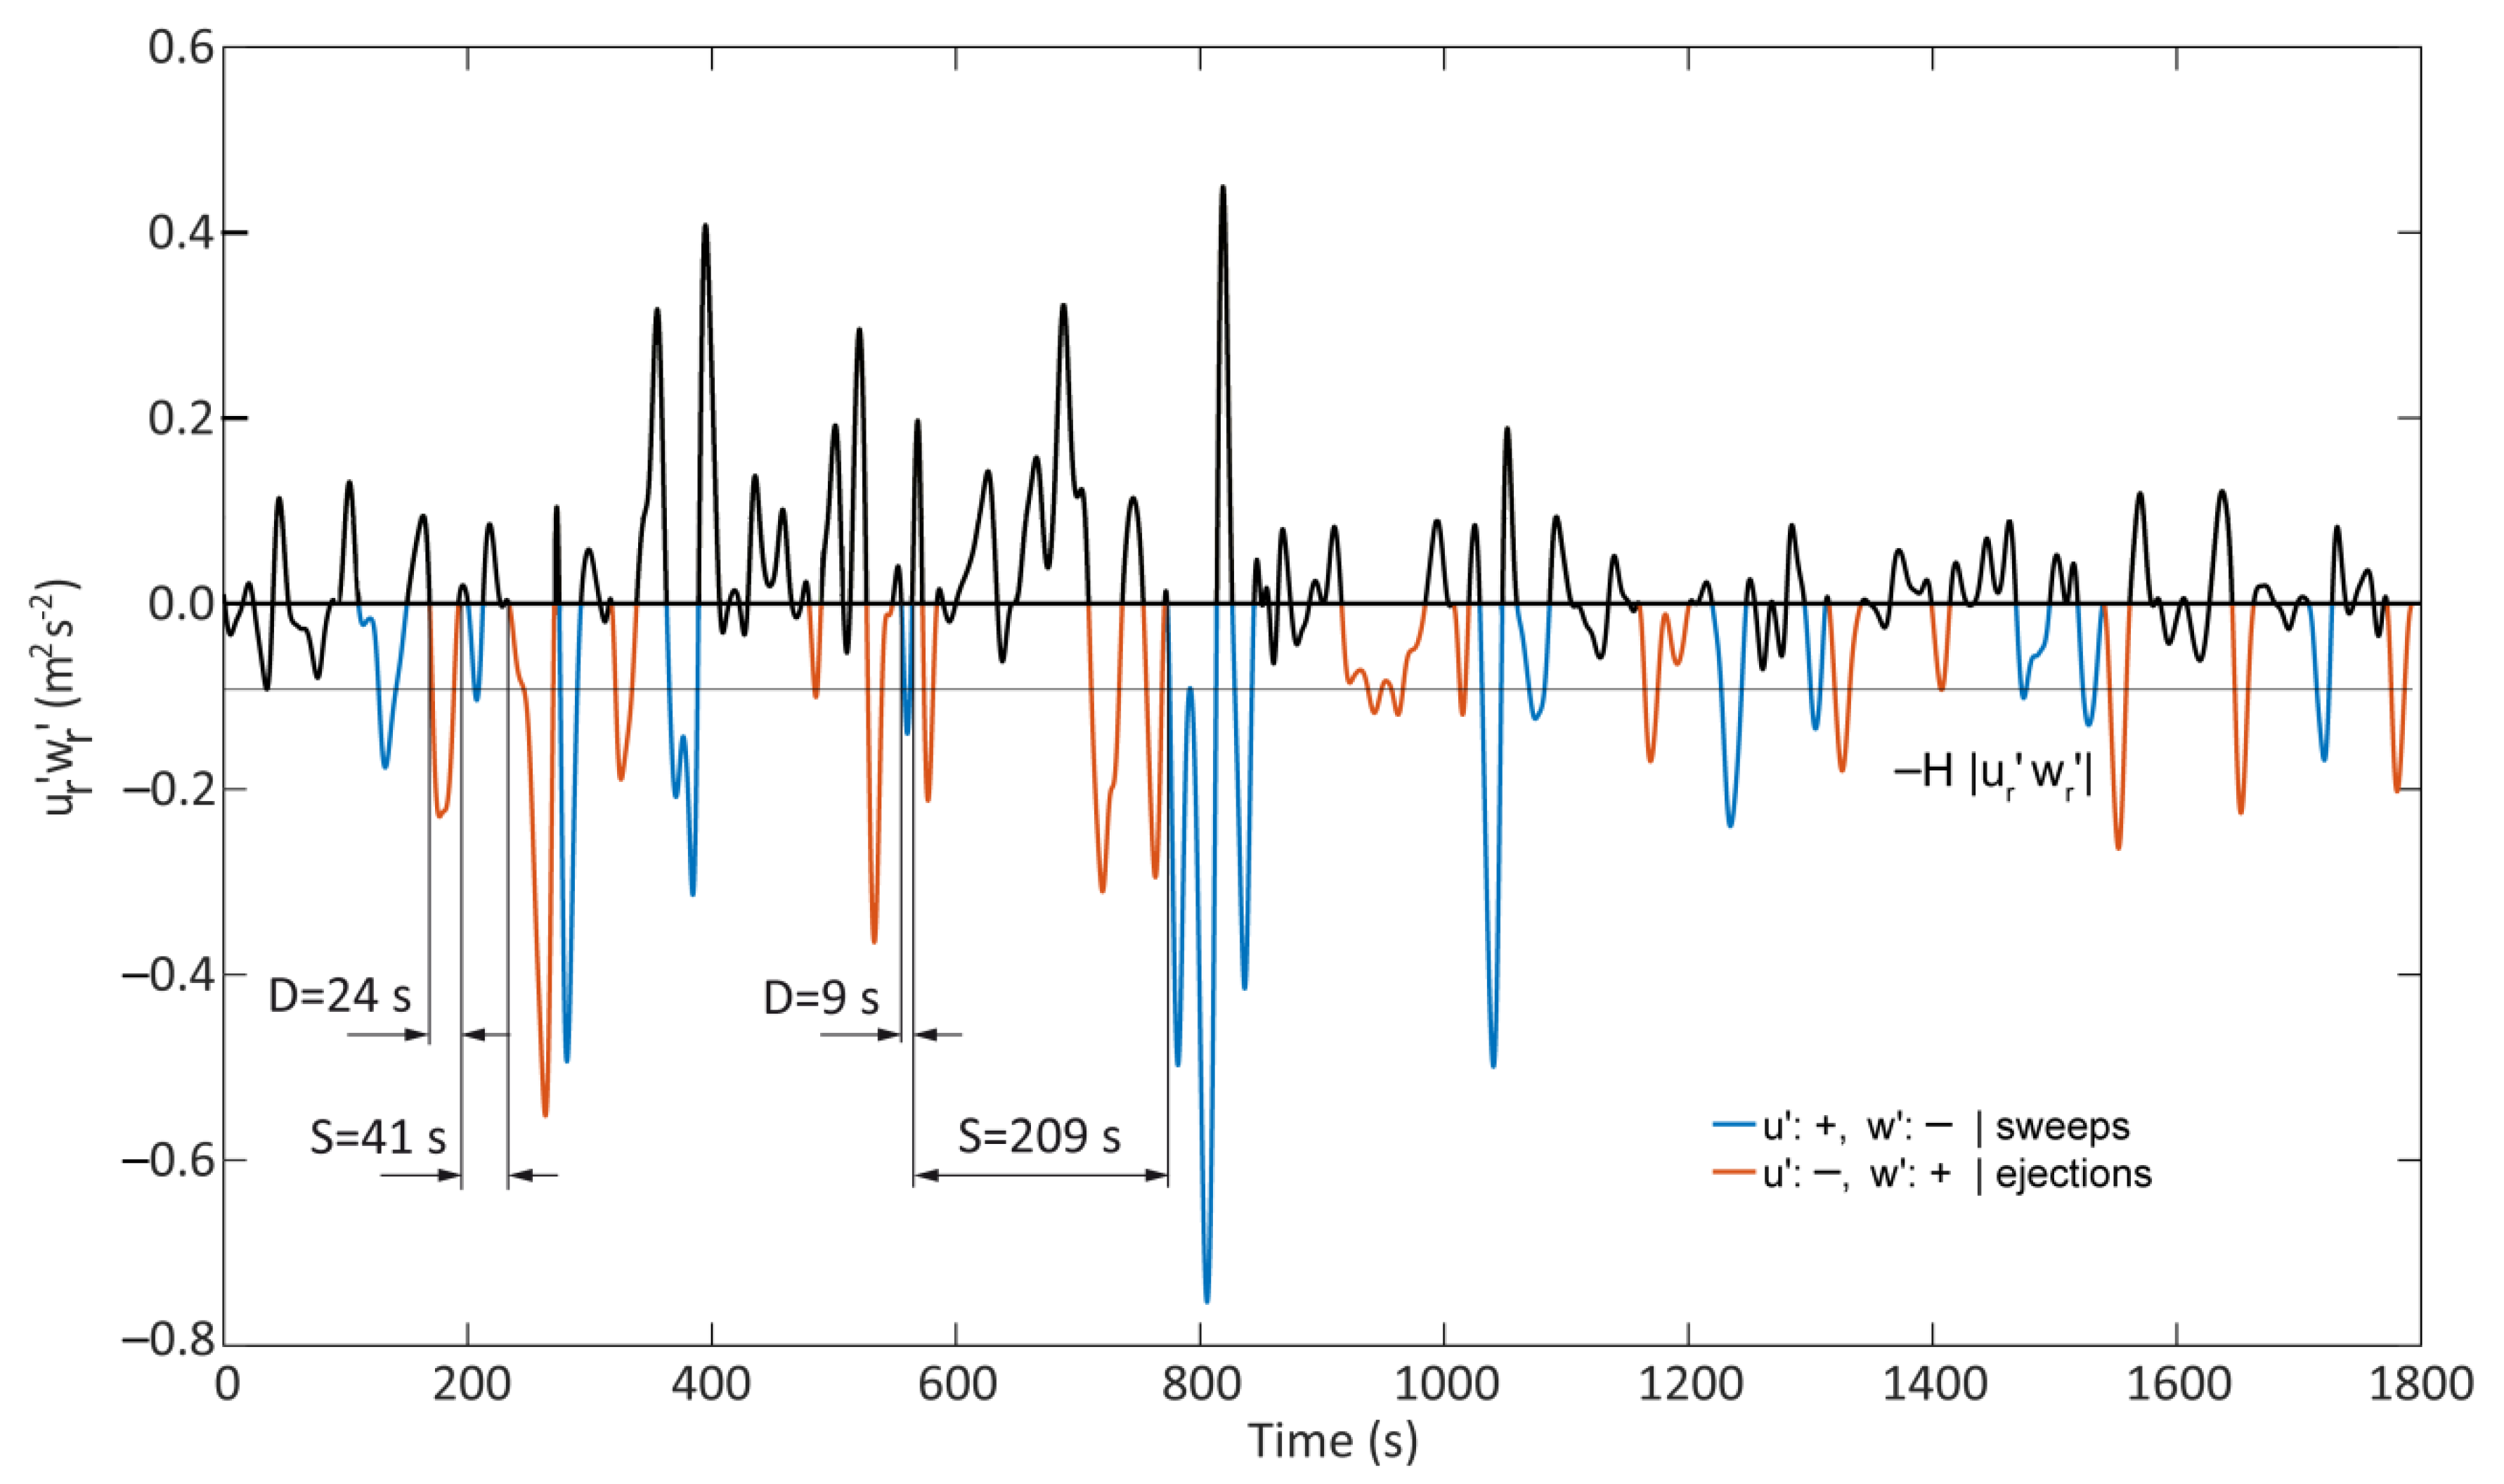
3.3. Detection of Coherent Structures
After applying the BOD, sweeps and ejections were detected separately, and their properties were quantified. In
Figure 6, the detection is exemplified for
z5. It shows
being calculated over an arbitrarily-chosen half-hourly interval (15:00–15:30 CET, 3 June 2014). The reconstruction of
is based on two BOD components that explain 85.3% of
variance and 81.6% of
variance.
Counting sweeps and ejections gives
Nmeas = 14 and
Nmeas = 16. For each sweep and ejection, its duration, as well as the separation of a subsequent event of the same type is determined for
z1–
z5 by monitoring the crossings of –
H . For example, the first ejection shown in
Figure 6 has a duration of
Dmeas = 24 s and is followed by a second ejection event after
Smeas = 41 s. After determination of
Nmeas,
Dmeas and
Smeas for all 30-min intervals, the values were converted to normalized
N,
D and
S according to Equations (14)–(16).
Table 5 provides comprehensive information on the central tendencies of
N for
z1–
z5 under different exchange regimes. In the entire measurement period
varied between seven and 21, and IQR represented 6–27 detected coherent structures, which is comparable to the range of
N found in previous studies using wavelet analysis [
11,
16].
Under fully-coupled conditions, the results of the WRS test demonstrated that at z5, related to sweeps and ejections were significantly larger than below the canopy. Thus, it can be inferred that not all coherent structures detected at z5 contributed to the momentum exchange into the forest. Moreover, for C3–C5, the number of sweeps was significantly larger than the number of ejections at all measurement heights. Therefore, sweeps were the dominating coherent structure type.
3.4. Typical Event Duration and Separation
The median values of
D varied between 19.2 s and 26.0 s with IQR spanning from 14.4 s–36.6 s (
Table 6). Results from the WRS test showed only significant height-dependent differences under fully-coupled conditions, with
D of sweeps and ejections being significantly larger at
z1 than at
z5. Furthermore,
D values of sweeps were significantly shorter than
D values of ejections at all heights under C3–C5.
Under all exchange regimes,
values varied between 75.7 s and 106.6 s at
z1–
z5 with IQR spanning from 37.0–201.2 s (
Table 7). Results from the WRS test showed no height-specific differences. However, results indicated that for C1–C4,
S values for sweeps were shorter than
S values for ejections at all measurement heights.
Although there is general agreement between the tendencies obtained for N, D and S in this work and the results obtained in previous studies, a comparison of absolute values is not straightforward because in previous studies: (i) different methods have been applied to detect and study coherent structures for only one or several levels separately; (ii) investigation periods were often much shorter; (iii) the reported results do not refer to the same central tendencies in the data; (iv) a diversity of coherent structure definitions have been used, leading to different definitions of D and S; and (v) a possible bias due to different wind speed at different stability conditions was often not considered.
A study investigated coherent structures during a period of five days with
conditions in a spruce forest and found
D values in the range 10–30 s [
9]. Another study determined a median coherent structure duration of 90–115 s with wavelet analysis and 1.3–1.8 s with quadrant analysis during stable and unstable conditions [
7]. Based on visual inspection,
D was reported to vary between 24 and 39 s below a deciduous forest canopy and between 20 and 23 s above the canopy during three 30-min intervals with stable, neutral and unstable conditions [
2]. Furthermore, based on visual analysis, a mean duration of coherent structures above a pine forest of 33–40 s was determined, with separations of 97–124 s during two 100-min intervals under unstable conditions [
49]. Two studies used wavelet analysis to detect coherent structures at a pine forest site during slightly unstable conditions and found characteristic durations and separations around 4 s and 29 s [
8,
15].
3.5. Further Coherent Structure Characteristics
Median values obtained for
L (
),
Fcoh (
),
E (
),
C (
) and
A (
) for different exchange regimes are summarized in
Table 8.
The values spanned between = 43.6 m determined for C1 and = 96.4 m determined for C4. The median values of Fcoh varied between 18.7% and 21.3% below the canopy and between 29.8% and 39.4% at and above the canopy. Median transport efficiency included values between = 0.6 and = 0.7 below the canopy and between = 1.1 and = 1.3 at the canopy height and above the canopy. Median total time cover of coherent structures varied between = 27.5% and = 29.2%.
Results from the WRS test showed that the values of for C4 and C5 were significantly larger than the values calculated for C1 and C3, suggesting that only large coherent structures reached the subcanopy space. For C3–C5, the values for and at z5 were significantly smaller than the values at canopy height, but significantly larger than the values below the canopy. This suggests that momentum flux was enhanced through shear-generated momentum flux at canopy height, but weakened through dissipation in the subcanopy space. Height-specific differences in indicate that coherent structures transferred momentum efficiently above the canopy. However, below the canopy, the transport efficiency of momentum flux through coherent structures was weakened.
This is also visible in the calculated values for . The amplitude of coherent structures involved in momentum transport from z5–z1 was strongly attenuated below the canopy.
Median values obtained for
L,
Fcoh,
E and
C related to different stability conditions are summarized in
Table 9.
Results from the WRS test indicated a dependence of
on atmospheric stability. For all heights,
was significantly larger during near-neutral conditions and forced convection than under stable conditions and transition to stable. Thus, in agreement with findings from a previous study [
11], an increase of
with increasing instability was found. Under stable stratification, the formation of large coherent eddies was inhibited, which led to the dominance of eddies with smaller sizes.
Although the magnitude of
Fcoh largely depends on the method of analysis [
33], the results above the canopy obtained in this study agree well with the results from previous studies: One study [
7] reported median values of
Fcoh between 40% and 48% by analyzing coherent structures in a deciduous forest at canopy height. Another study [
11] found mean values of
Fcoh between 38% and 51% at 10 m and 30 m above a mixed surface. Over a pine forest,
Fcoh of 92.7% ± 3.2% was reported [
49]. In an urban area, a study [
39] found that
Fcoh ranged between 41% and 107% at
z/
h = 1.5 under unstable conditions. Values of
Fcoh between 55% and 95% were derived in a walnut orchard during different stability conditions from quadrant analysis using a hole parameter of
H = 3 [
6].
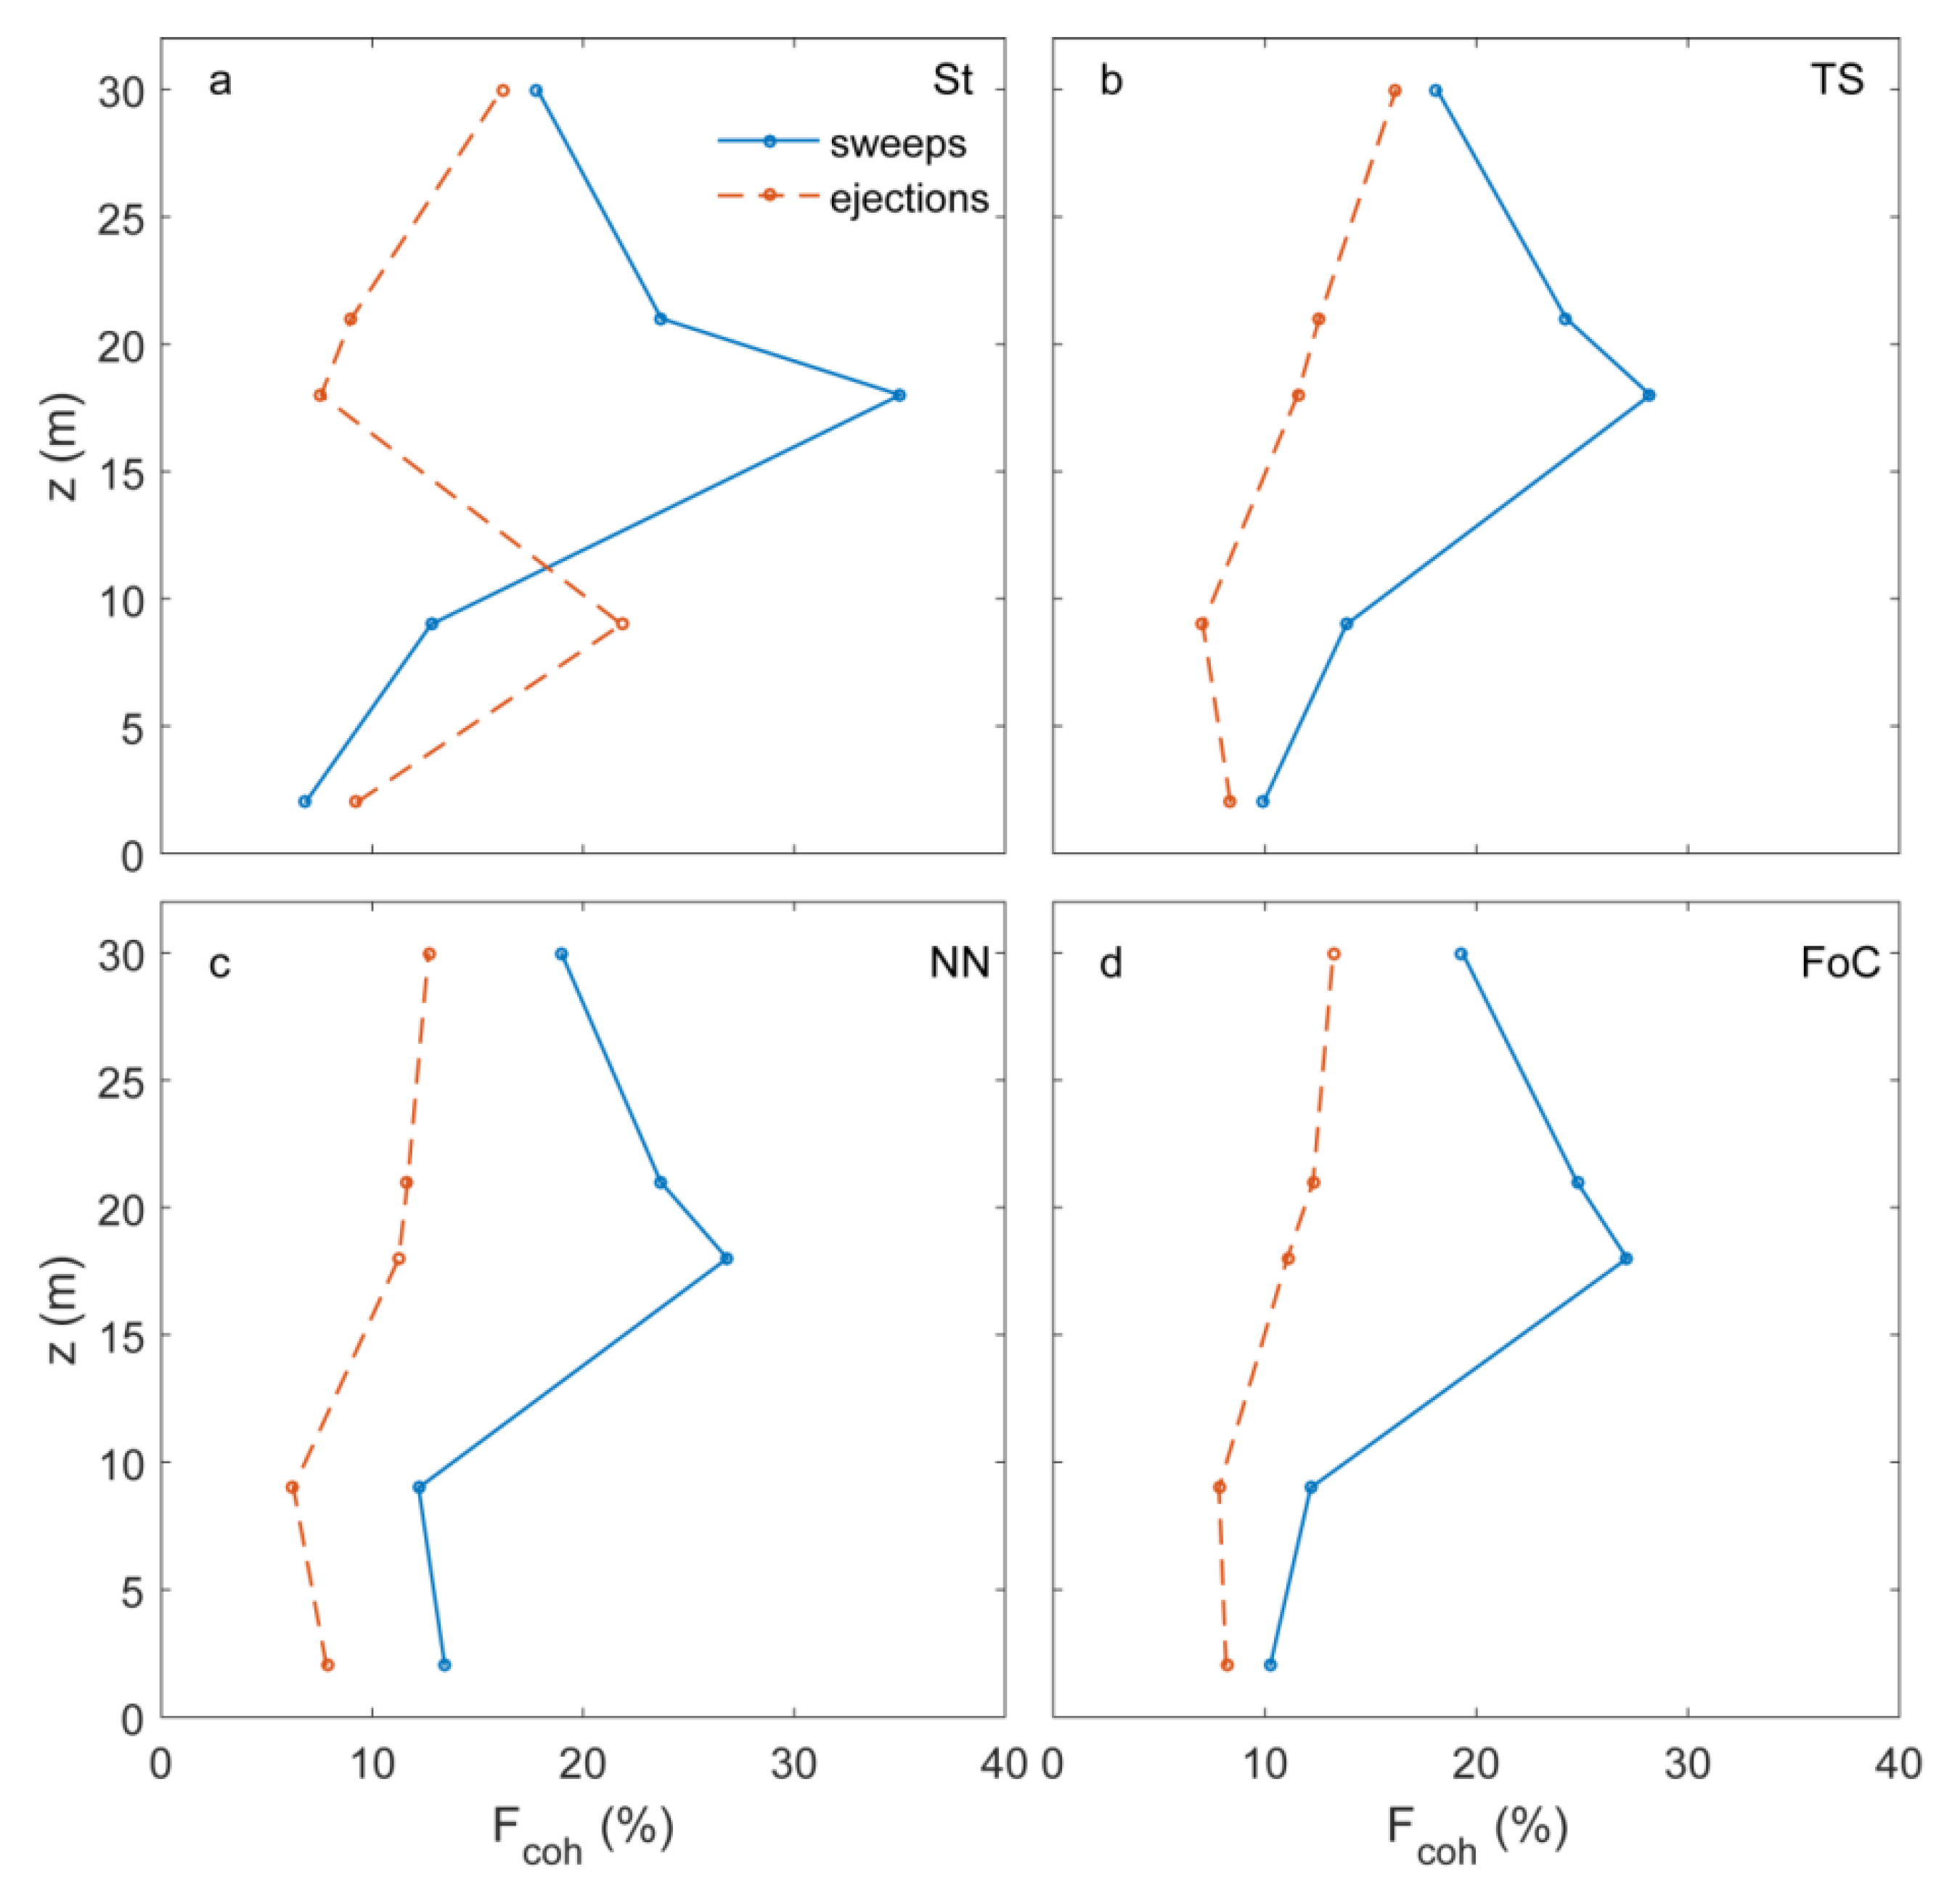
Results from the analysis of the contribution of sweeps and ejections to
Fcoh under different atmospheric stabilities are shown in
Figure 7. Values for
Fcoh,sw peaked at canopy height and decreased with height above the canopy, whereas
Fcoh,ej still increased above the canopy. This behavior was also observed in a previous study [
33]. Increasing
Fcoh,ej above the canopy indicates the transition from a flow dominated by shear-driven coherent structures to a flow associated with rough-wall boundary layers [
6].
The authors of a previous study [
3] concluded from their results that the magnitude of sweeps are larger than the magnitude of ejections under unstable conditions and that the strength of both decreases with increasing stability. The larger magnitude of sweeps was also observed in this study. However, a decrease in the strength of sweeps and ejections with increasing stability was not found.
An investigation [
49] of coherent structures above a pine forest under unstable conditions (–1 <
ζ < 0) came to the conclusion that the proportions of sweeps are higher compared to ejections at canopy height and that the importance of ejections increases with increasing height from the canopy top. Numerous studies [
1,
2,
6,
33,
45] found similar results.
An increase of ejections with height was also observed in this study. Furthermore, the authors of some studies [
2,
50] concluded from their results that sweeps and ejections contribute most to the overall transport in the canopy and that the sweeps-related contribution dominates. This statement can be confirmed from the findings obtained in this study.
It was also reported that the contribution of ejections increased in the below-canopy space and that the contributions of sweeps and ejections become equal further down to the ground [
33]. An increase of ejections with decreasing height was not found in this work, whereas the contributions of sweeps and ejections did approach each other near the ground. During stable conditions, ejections dominated in the sub-canopy space.
The
values determined above the canopy were similar to the
values (1.05–1.66) found by previous studies [
11,
16]. Under different atmospheric stabilities,
varied between 24.4% and 30.8%. Results from the WRS test showed significant height-specific differences, as well as stability-specific differences. During transition to stable,
at
z5 was significantly larger than
at
z4 and
z3, but also significantly smaller than
below the canopy. Under stable conditions,
at
z5 was larger than directly at
z4 and
z3. Since
Fcoh always peaked at the canopy top, this result indicates the occurrence of strong, but short sweeps and ejections during transition to stable and stable conditions. Overall, the
values are in good agreement with previous studies ([
11]:
= 25%–45%; [
49]:
= 28%–38%).


