Article

Prediction of a Visible Plume from a Dry and Wet Combined Cooling Tower and Its Mechanism of Abatement

1
Department of Mechanical Engineering, National Institute of Technology, Kure College, 2-2-11, Agaminami, Kure, Hiroshima 737-8506, Japan
2
Department of Mechanical Engineering, Kindai University, 3-4-1, Kowakae, Higashiosaka, Osaka 577-8502, Japan
3
Department of Mechanical Engineering and Science, Kyoto University Kyoto Daigaku-Katsura, Kyoto 615-8540, Japan
*
Author to whom correspondence should be addressed.
Atmosphere 2016, 7(4), 59; https://doi.org/10.3390/atmos7040059
Submission received: 10 February 2016 / Revised: 14 April 2016 / Accepted: 15 April 2016 / Published: 20 April 2016
(This article belongs to the Special Issue Air Pollution in the Asia-Pacific Region)

Abstract

:
Heated moist air from a cooling tower forms a visible plume and needs to be predicted, not only for the performance design of the cooling tower, but also for environmental impact assessments. In this study, a computational fluid dynamics analysis is conducted to predict the scale of a visible plume rising from a cross flow cooling tower with mechanical draft (provided by a rotating fan). The results of computational fluid dynamics analysis are verified by comparing predictions with an actual observed plume. The results show that the predicted visible plume represents the observed plume in an error range of 15%–20%, which is permissible for designing a cooling tower. Additionally, the mixing condition of heated dry air and moist air under dry and wet combined operation is examined, and the condition is thought to affect the scale of the visible plume. It is found that, in the case of a mechanical-draft cooling tower, the fan has a mixing function which performs the complete mixing of wet and dry air, and this suggests that the generation of the plume can be determined by the intersection of the operation line and saturation line. Additionally, the effect of external wind on the scale of the visible plume is large, especially for dry and wet combined operation.

1. Introduction

Heated moist air rising from a cooling tower forms a visible plume in winter, the rainy season, and/or a time of day having high relative humidity, such as early morning. The plume itself is simply an oversaturated air-water mixture, and thus not a pollutant; however, it sometimes causes environmental issues such as creating lower visibility, obstructing sunshine, increasing humidity in the surroundings, being mistaken for fire, visually impacting the landscape, and icing [1]. Therefore, the environmental impact assessment and plume abatement of a cooling tower have been necessary for district heating and cooling systems in cities and airports, in power generation plants near cities, and in nature parks.
The prediction of a visible plume has been investigated since the 1970s, mainly in the case of natural draft cooling towers. For example, a plume has been numerically obtained using a one-dimensional integral model for momentum, energy and pollutant mass transport equations, where the wind velocity, temperature and moisture were found experimentally with Gaussian distribution in the plane perpendicular to the flue [2,3]. The results agree well with the actual visible plume rising from a cooling tower of a power plant. An experimental study found that the effect of wind and obstacles on a visible plume can be clarified using a wind tunnel to establish the diffusion model for predicting the scale [4]. Additionally, a study on mutual interference and the impact on the surrounding environment of a large-scale visible plume was conducted by making aerial observations [5].
The phenomena of research described above were of such large scale that it is expensive and very time-consuming to predict the occurrence of a visible plume under various conditions, and a cost-reducing procedure is therefore required for the design of a cooling tower and the consideration of the effect of a tower on the environment.
From the late 1980s to 1990s, with the development of computers and analysis code of fluid flow, computational fluid dynamics (CFD) analysis has been applied as an alternative method of physical experiments to obtain complicated flow behavior and transport phenomena. However, CFD analysis uses momentum and energy transport equations to obtain the velocity and temperature distributions [6,7]. To visualize the plume from a cooling tower, a moisture transport equation has to be used together with the equations mentioned below.
For such a situation, Takata et al. [8] predicted the visible plume from a cooling tower for design purposes. Their results show that the predicted visible plume rising from a mechanical-draft cooling tower agrees well with observed plumes within a practically permissible error range. The effectiveness of predicting main features such as the length, width, and volume of the visible plume were demonstrated. A Reynolds-averaged Navier–Stokes (RANS) model with the standard kε model has been used in simulation, but the effects of the wind fluctuation and exhaust plume have not been well expressed in the RANS model. It may be possible to well express the effects if direct numerical simulation is applied. However, this would require huge computer capacity and computation time to predict the phenomena. At this time, direct numerical simulation cannot be applied for the purpose of design.
The present study applies the RANS model to predict a visible plume rising from a dry and wet combined-type cooling tower with a mechanical-draft device (fan) that abates the plume. Additionally, by predicting the flow behavior within the cooling tower where moist air and dry air are mixed, and dominant phenomenon of reducing the visible plume is considered together with the effect of external wind on the visible plume.

2. Outline of a Cooling Tower

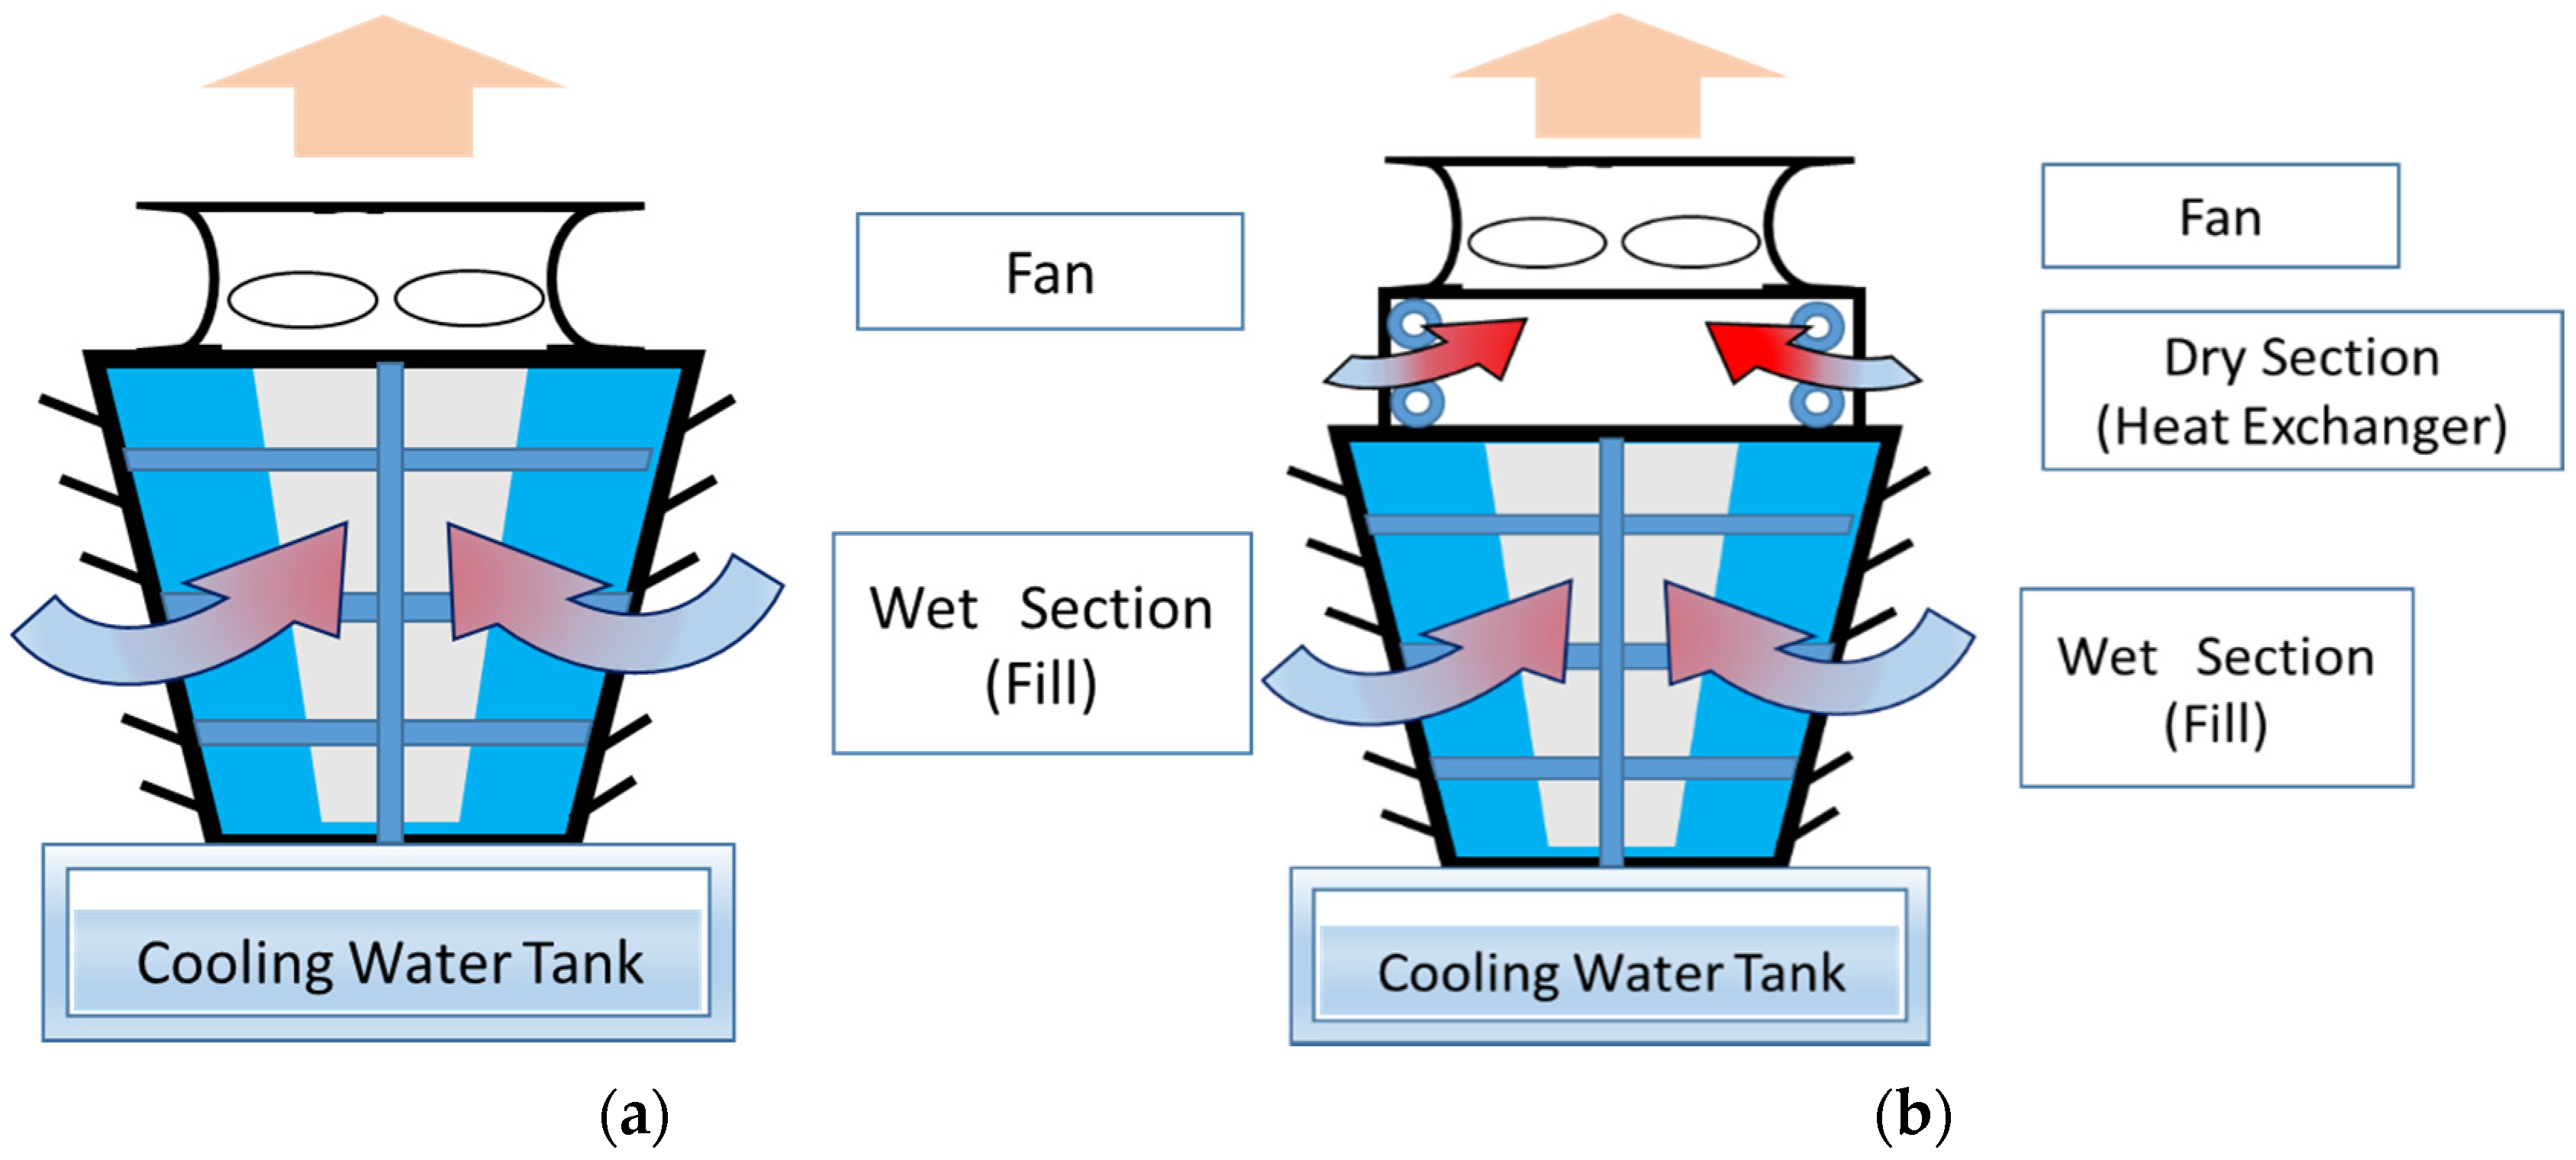
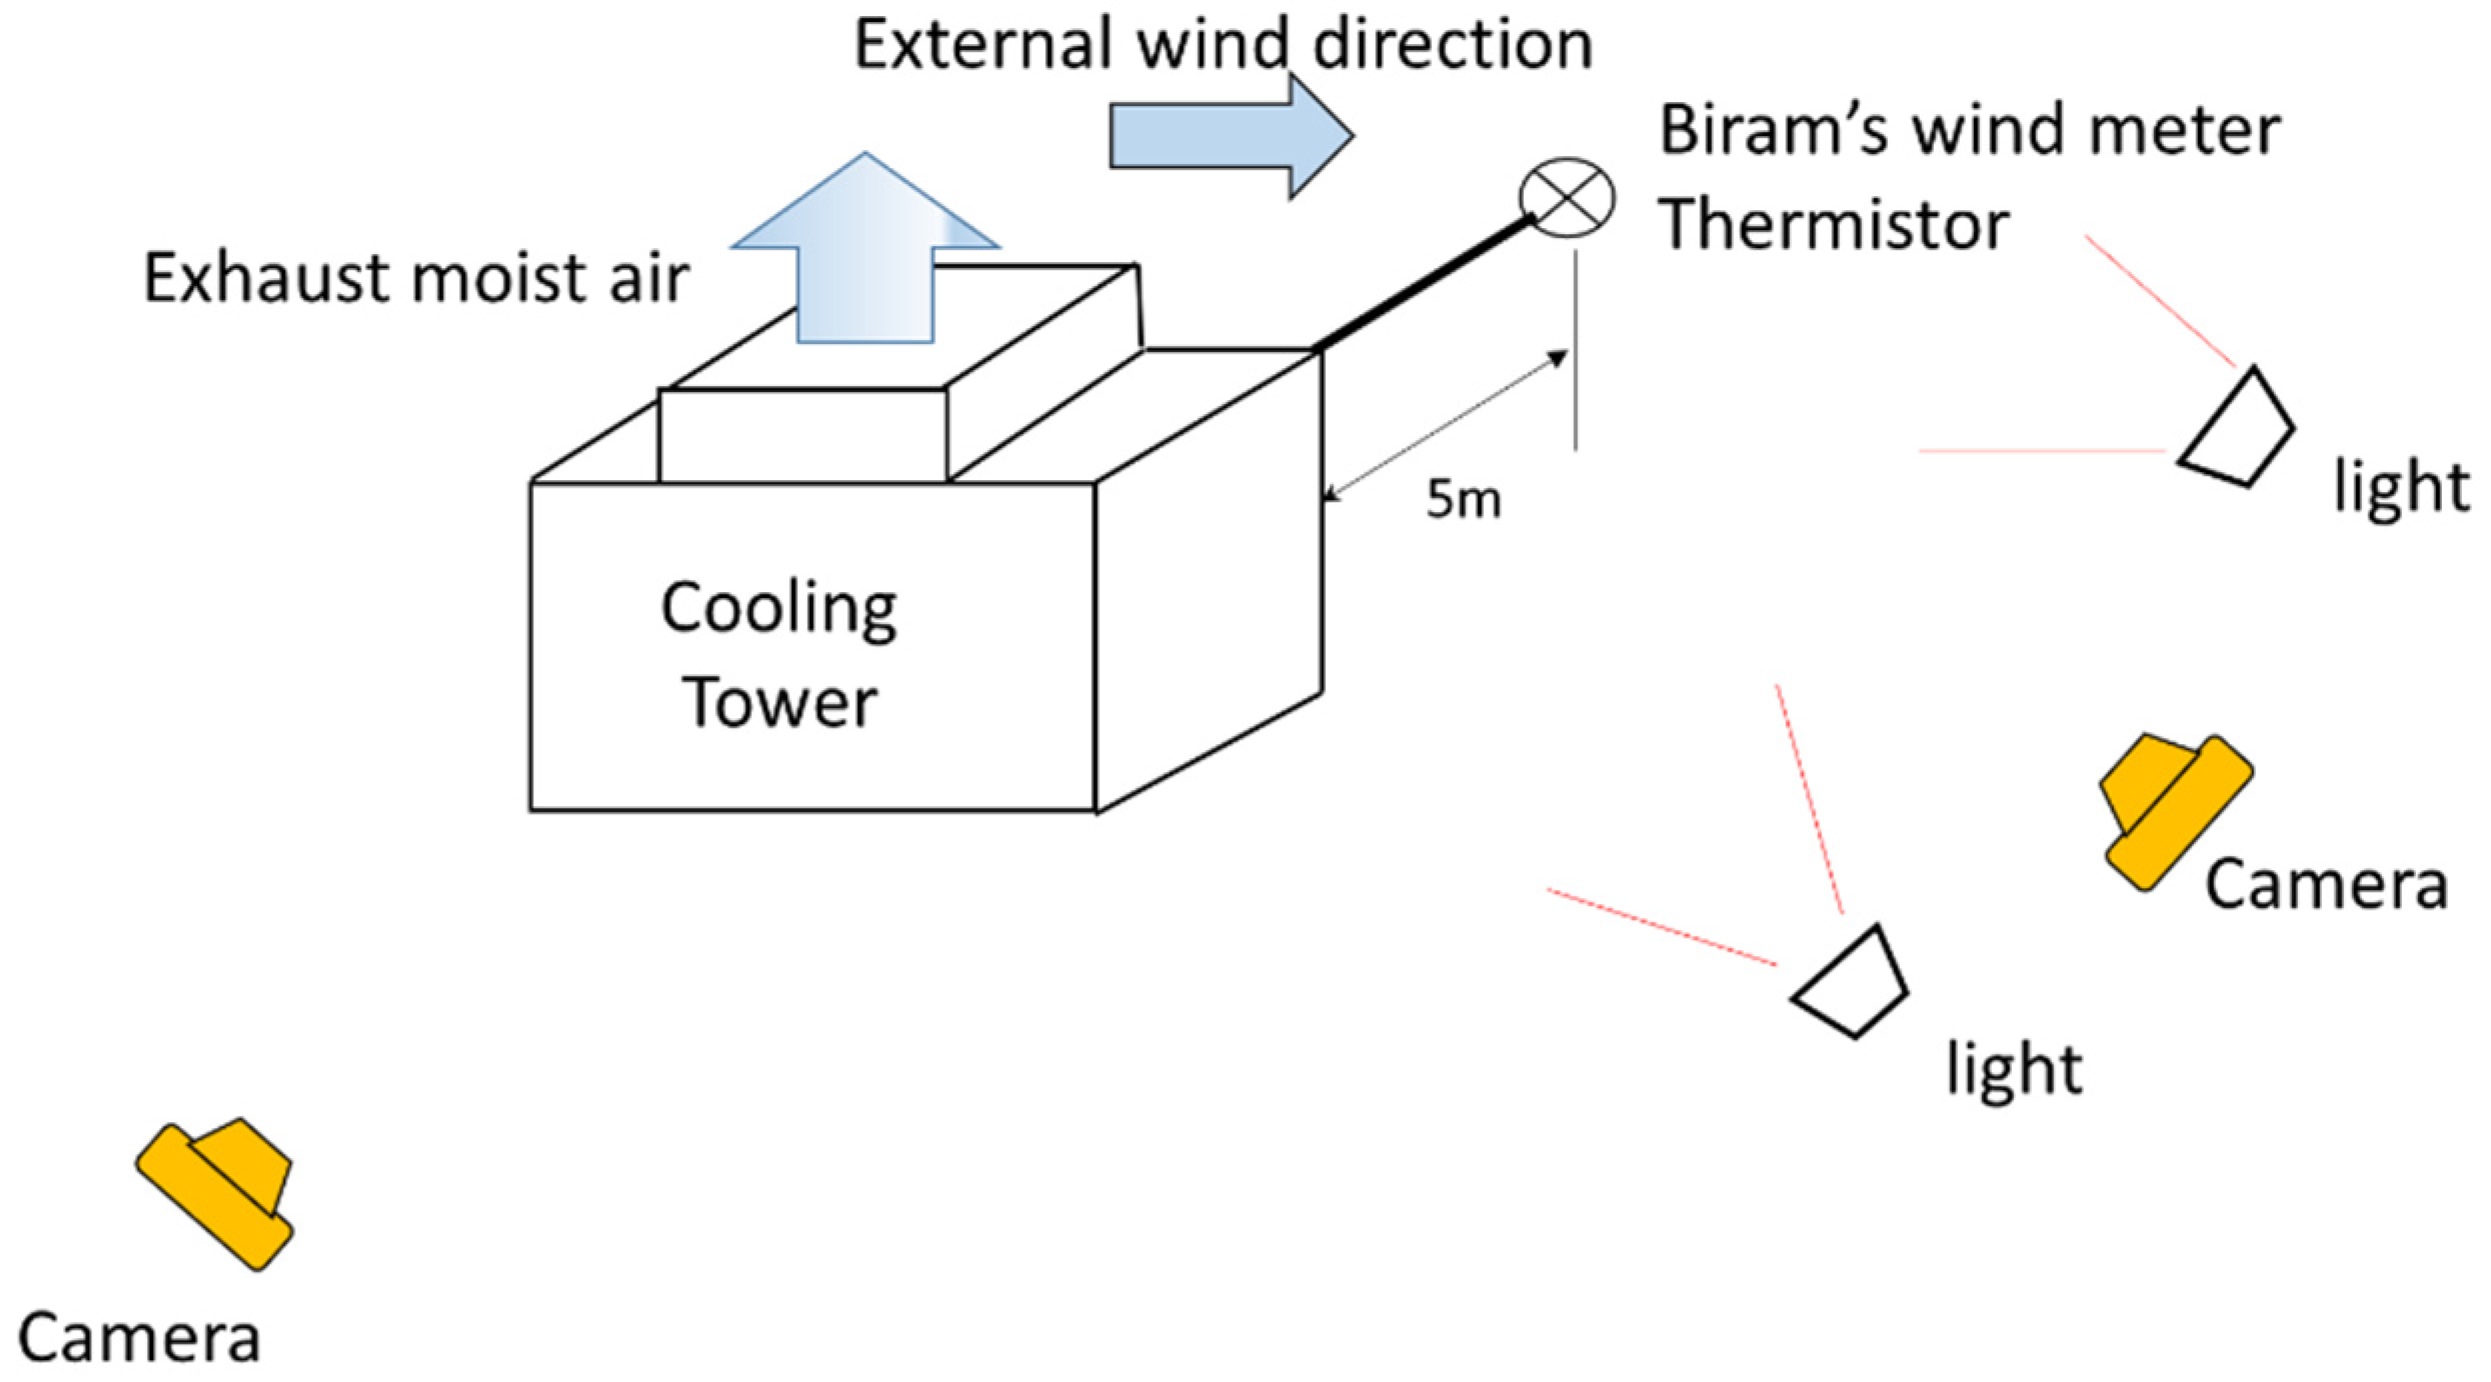
There are many adoptions of cross flow cooling towers with a mechanical-draft device in various industrial fields, and a schematic diagram is shown in Figure 1a. The cooling tower mainly consists of frame structures including a water tank, rotating fan as a mechanical-draft device, water spray system, and fill for heat exchange. A rotating fan is set on top of the cooling tower and introduces outside air to the inside of the cooling tower. Hot water is sprayed on the top of the fill and then comes into direct contact with the introduced air while flowing down inside the fill, and cooled water flows down into the cooling water tank. The introduced air is heated and humidified, and is exhausted by a fan to the atmosphere as moist air. The exhausted moist air is cooled through contact with the atmosphere, the temperature of which is below the exhaust-air temperature. The water vapor contained in the exhaust air then condensates and forms a visible plume.
For the abatement of the visible plume, a dry and wet cooling tower is used, as shown in Figure 1b. A dry section is added above the wet section, and a fin-tube heat exchanger is usually used. First, hot water is supplied to the heat exchanger to heat the introduced air and to reduce the relative humidity in the dry section. Hot water is then sprayed on the fill (wet section) and flows downward while being cooled. The airs from dry and wet sections are mixed and exhausted from a fan. The air from the wet section is humidified to almost its dew point; however, the relative humidity of exhaust air is reduced by mixing the exhaust air with air from the dry section. The extent of the visible plume is therefore reduced outside the cooling tower.
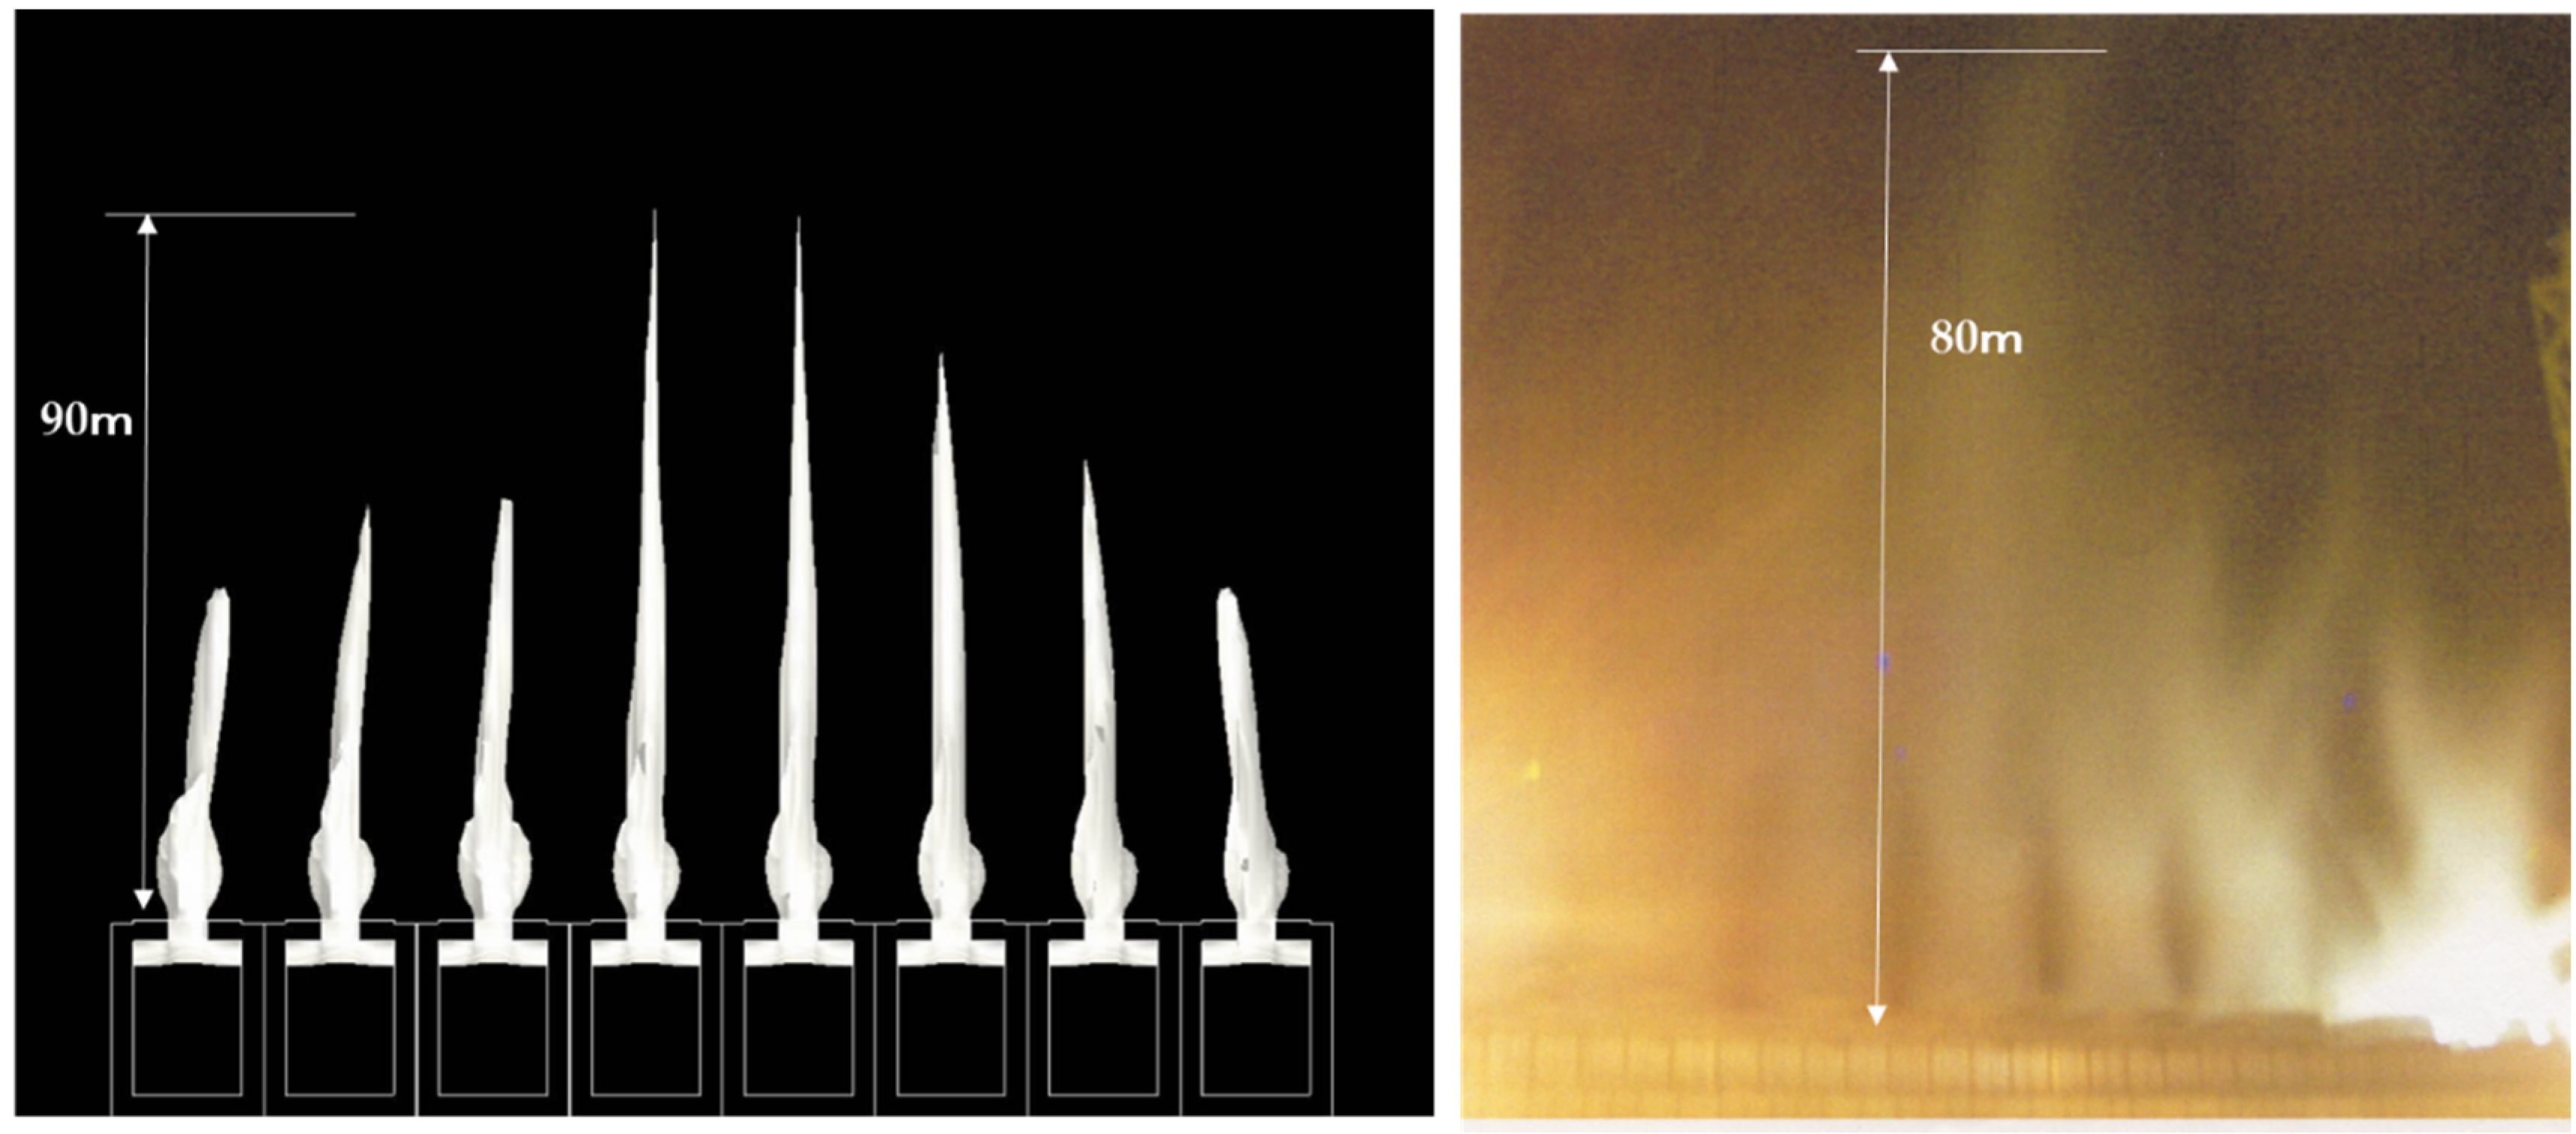
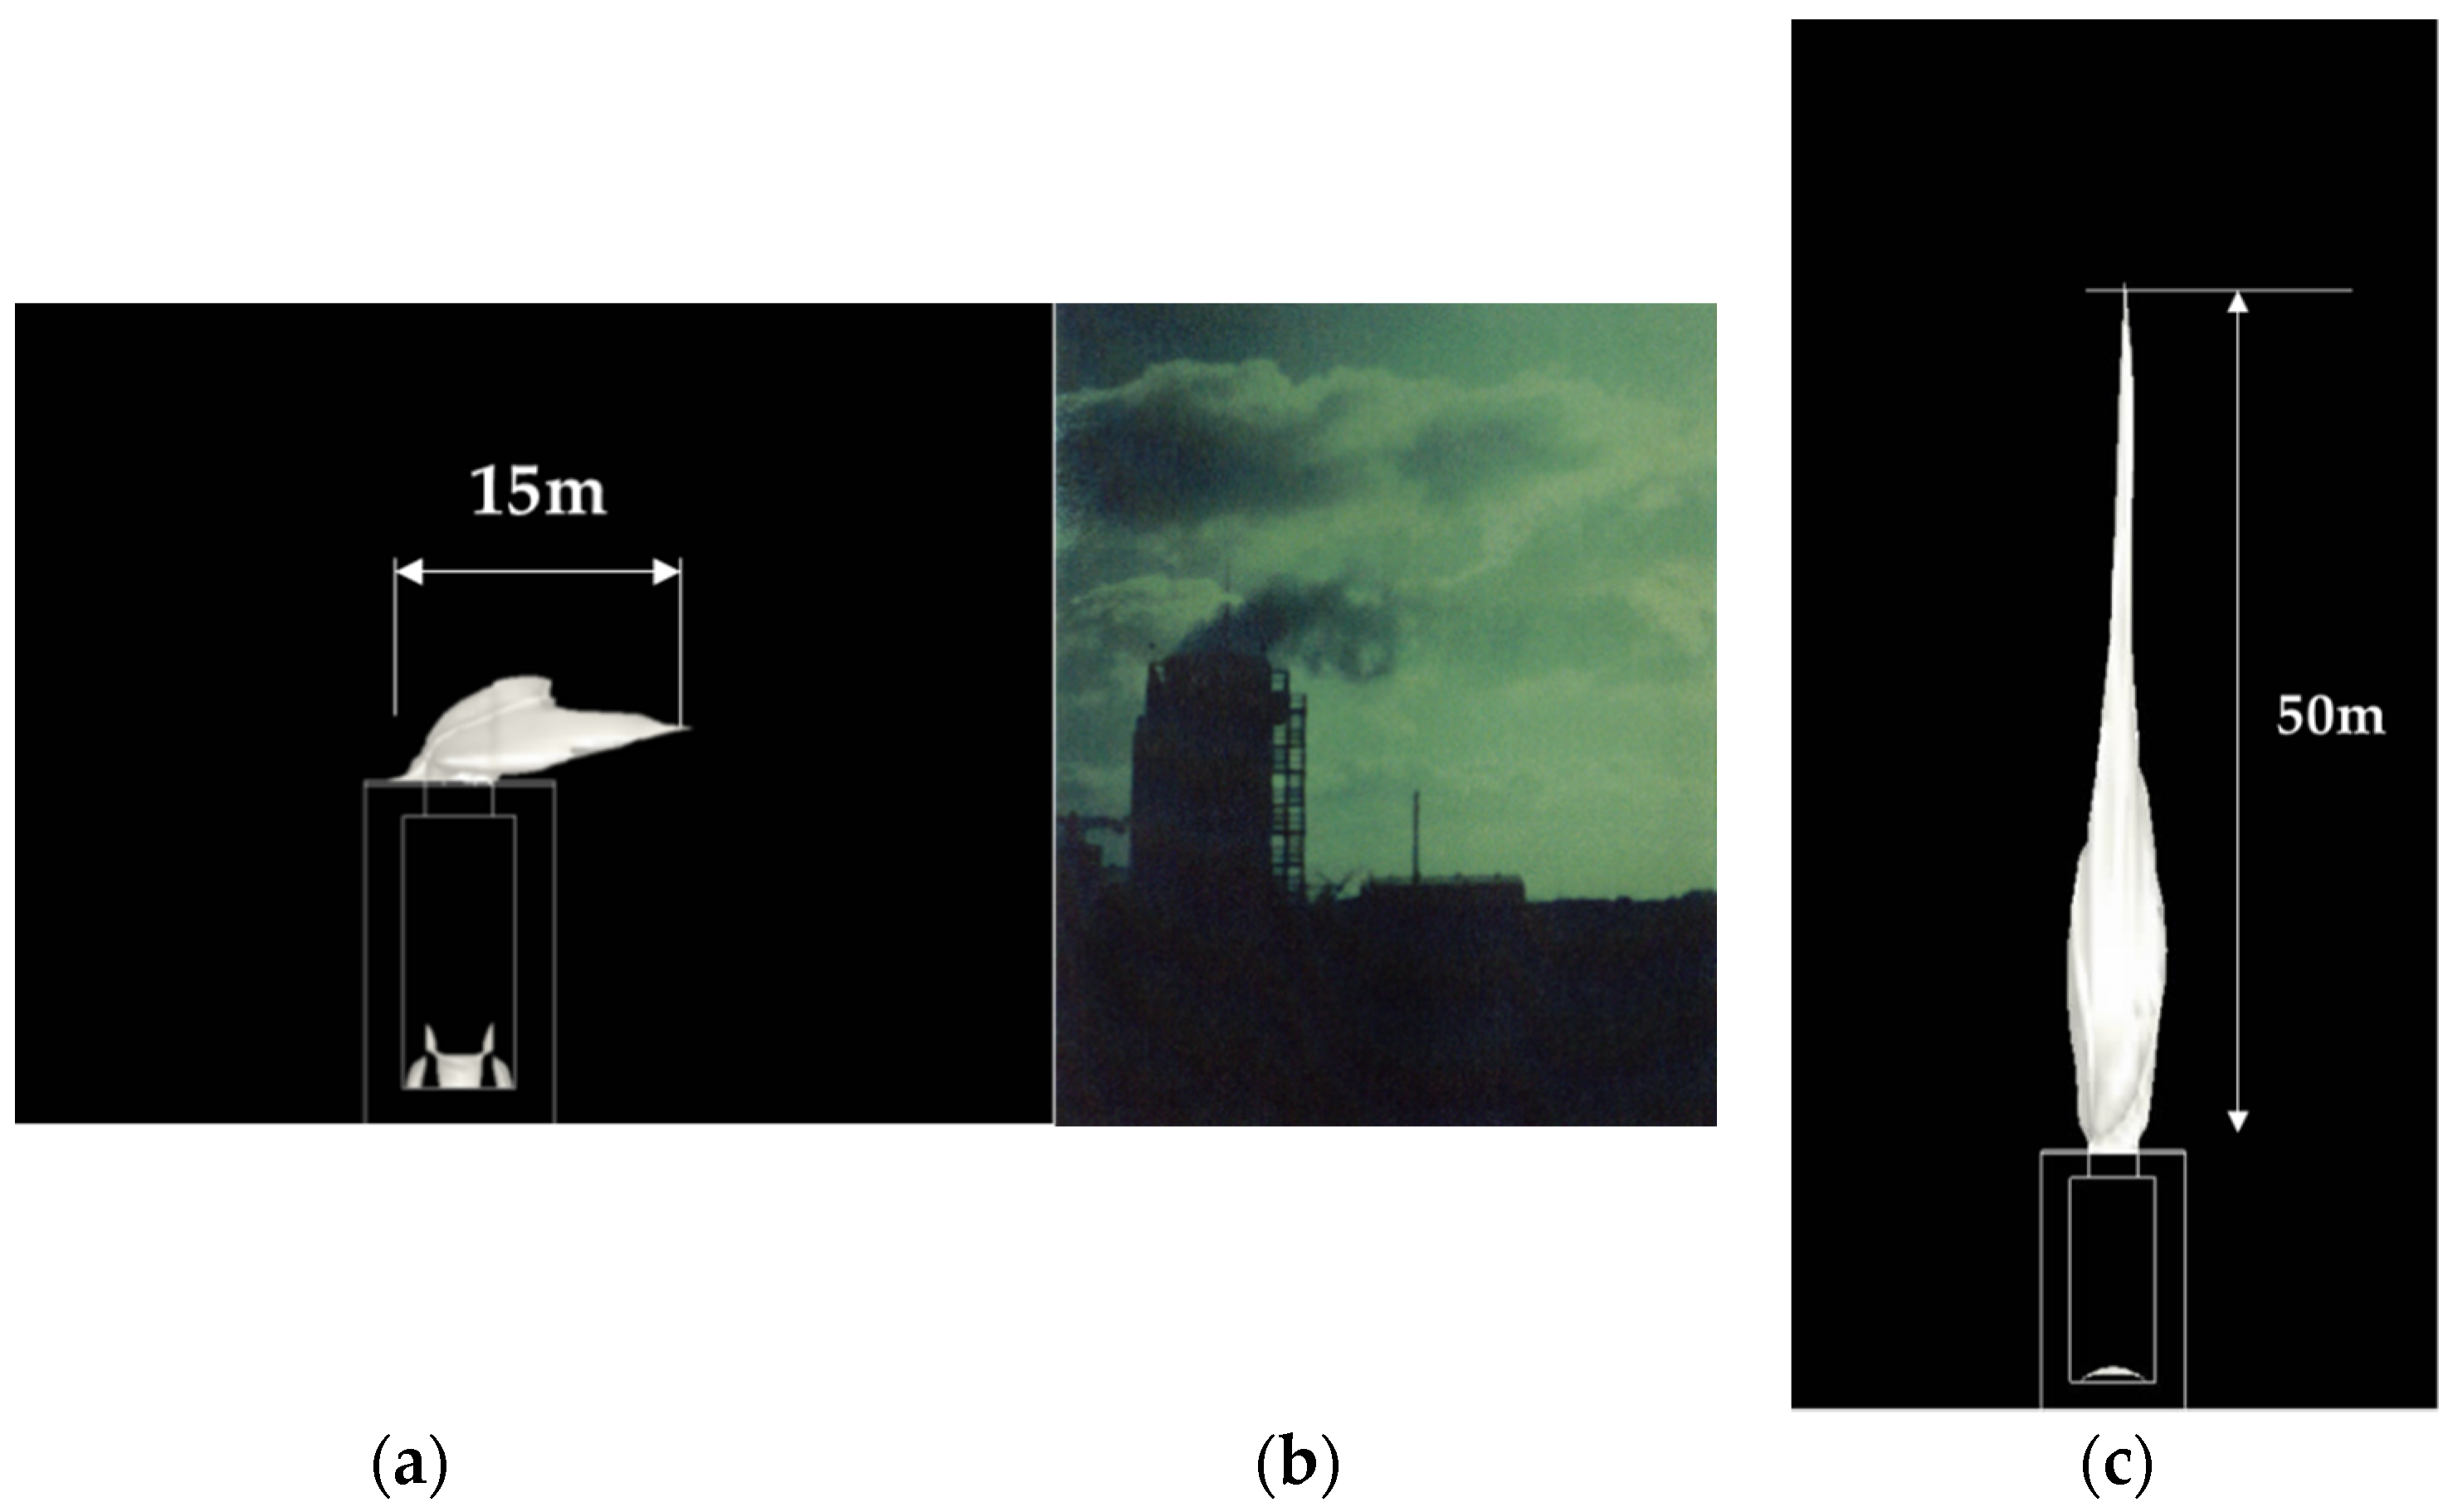
The present study predicts the visible plume of both wet and dry and wet cooling towers and examines the validity of the calculation by comparing the prediction with observed plumes. Additionally, the behavior and abatement mechanism of the plume are investigated.

3. Numerical Calculation

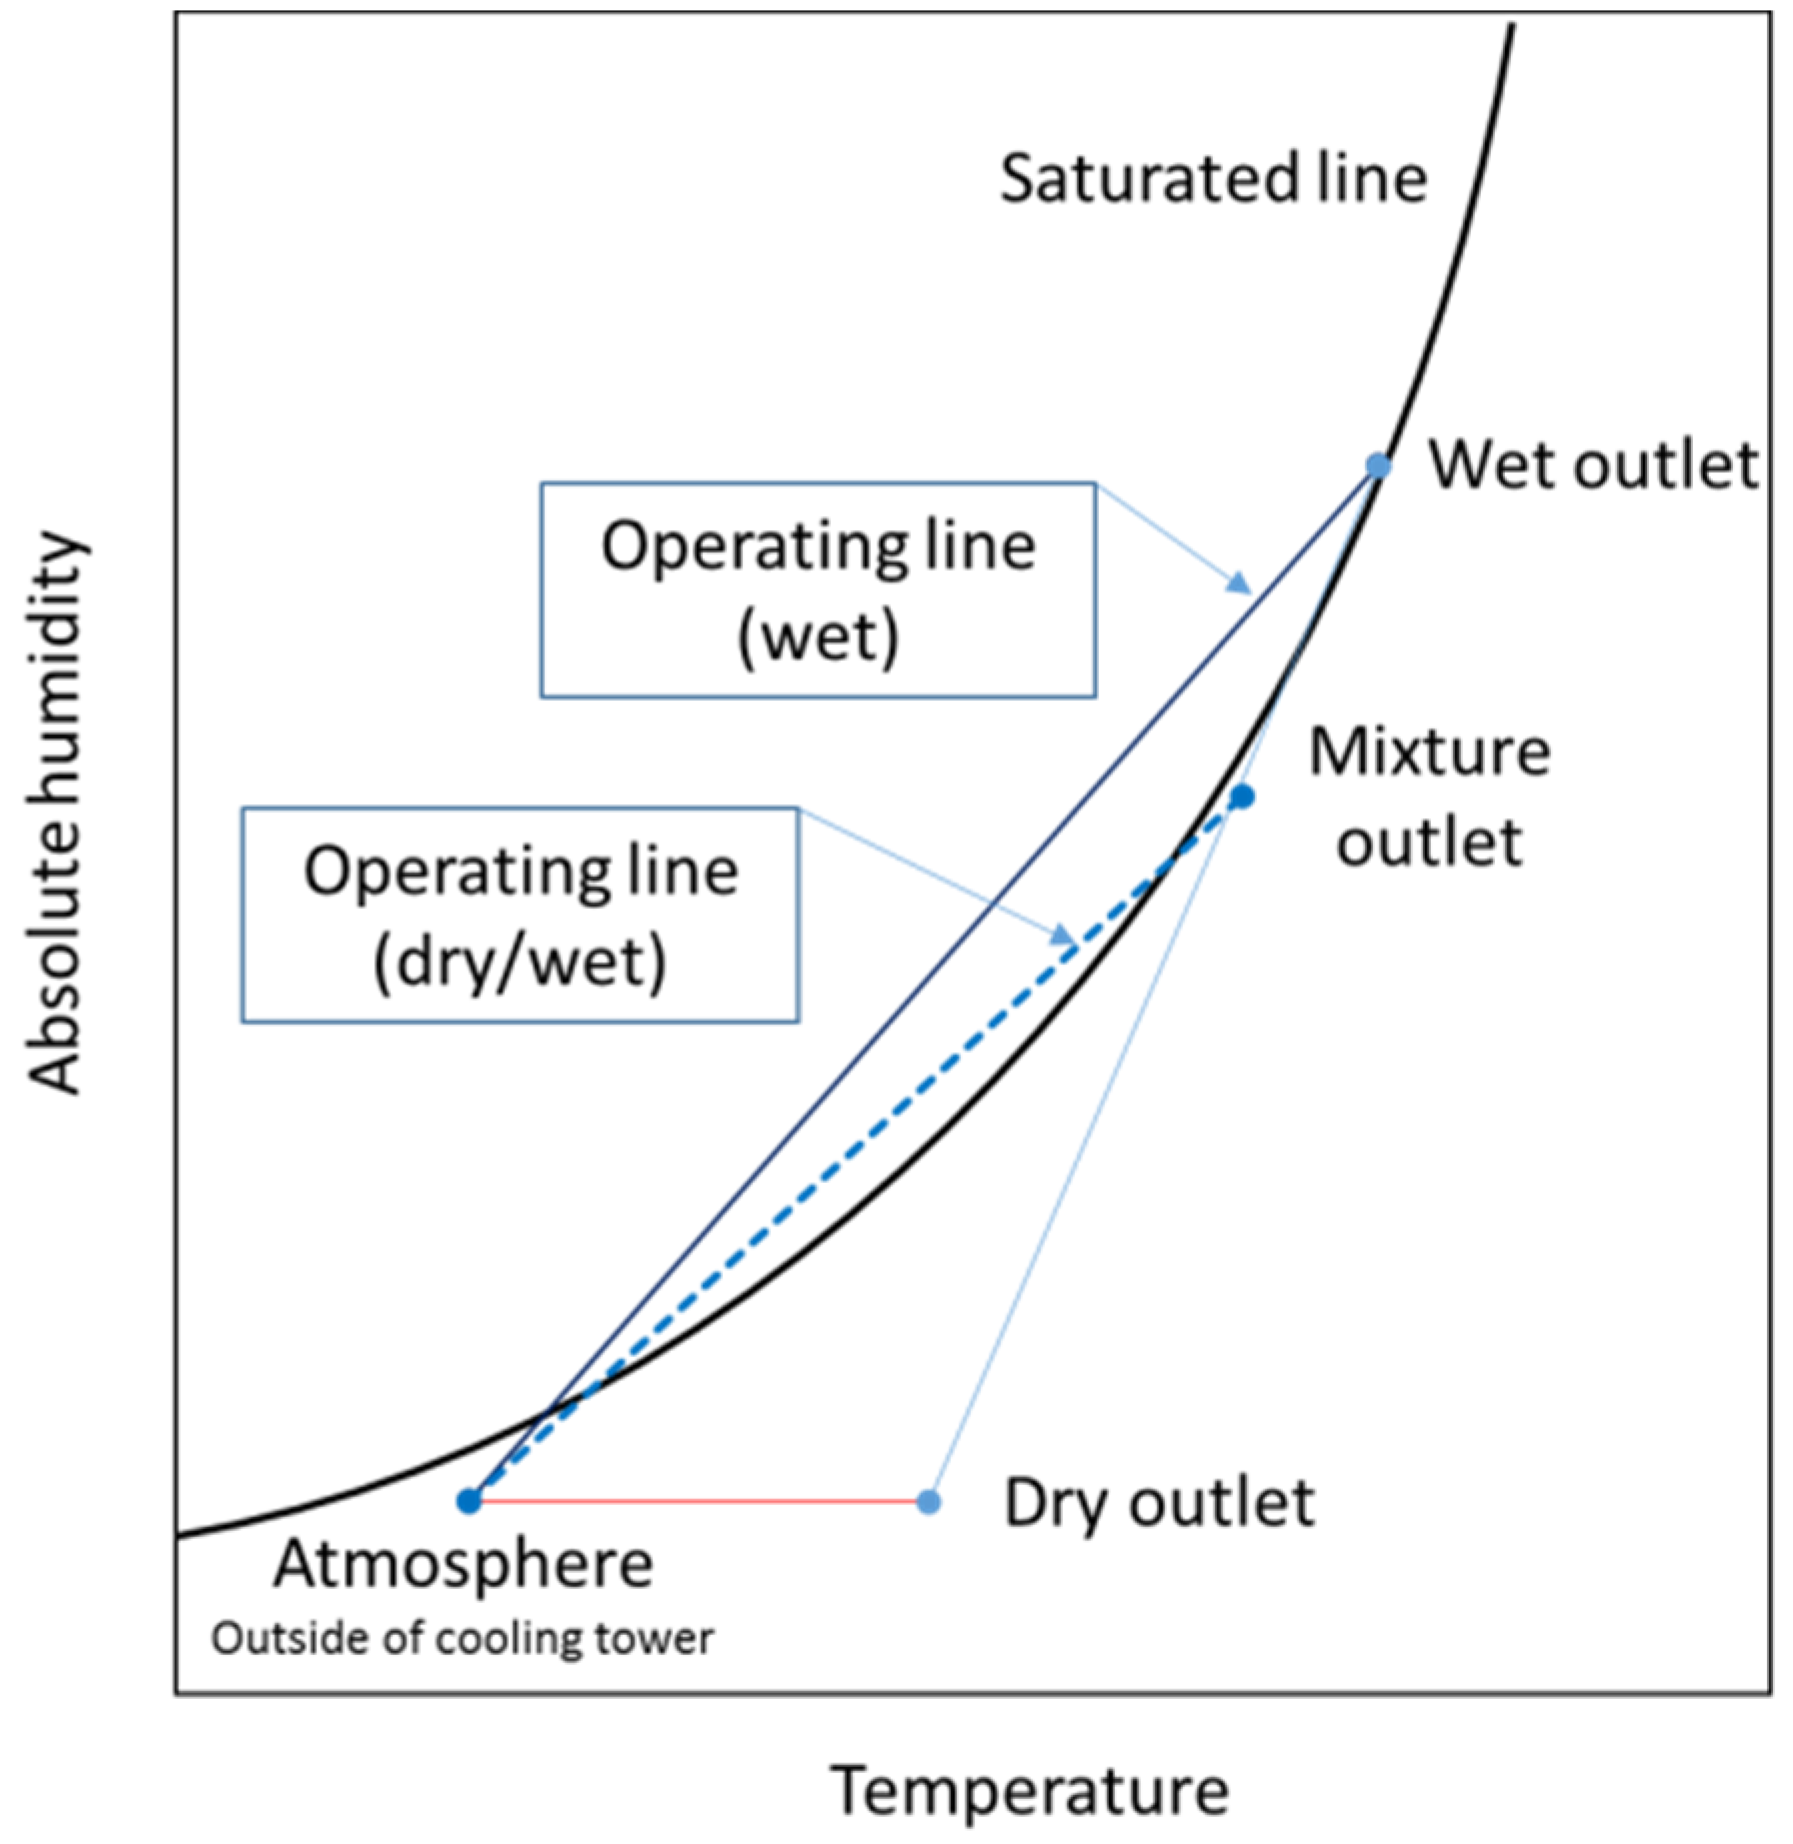
Figure 2 shows the operating lines of both wet and dry/wet combined operation lines on an air chart, which connect the exhaust air from the cooling tower to outside air conditions. In wet operation, the condition of air exhausted from the cooling tower is thought to change along the operating line (wet), and humidified exhaust air conditions finally become similar to the outside air condition at a distant point through turbulent diffusion in the atmosphere. At the same time, the air condition under dry and wet combined operation is shown in Figure 2. The introduced outside air is heated by the heat exchanger with constant absolute humidity. The heated outside air from the dry section and moist air from the wet section are mixed and exhausted. The operating line connects the mixed exhaust and outside air conditions as shown in Figure 2. It is obvious that the crossing points of the two operation lines and the saturated line are different, and the oversaturated area of dry/wet combined operation becomes small compared with that of wet operation. The change in air condition on the operating lines can be obtained through CFD analysis considering momentum, energy, and moisture (absolute humidity) transport equations, and this procedure allows the prediction of the visible plume.

3.1. Governing Equations and Calculation Procedure

The air velocity of the cooling tower at the exhaust fan is considered to be 20 m/s at maximum, and compressibility is thus considered to be low. Therefore, governing equations for an incompressible fluid used in this study are the continuity equation, Navier Stokes equation with Bousinessq approximation employing a renormalization-group kε model, and transport equations of energy (k), turbulent dispersion rate (ε) temperature (T), and absolute humidity (M) as follows:
U i x i = 0
  ρ   U i t = U j ρ   U i x j P x i + x j [ μ U i x j ρ   u i u j ] ρ   g   i β ( T T 0 )
ρ k t + U i ρ k x i = x i [ μ t σ k ( k x i ) ] G s + G T + ρ   ε
ρ   ε t + U i ρ   ε x i = x i [ μ t σ ε (   ε x i ) ] + C 1 ε k ( G s + G T ) ( 1 + C 3 R f ) C 2 ρ ε 2 / k
  ρ C p T t + U j ρ C p T x j = x j [ K T x j ρ C p u j t ]
  ρ M t + U j ρ M x j = x j [ ρ D M x j ρ u j m ]
where μ, ρ, g and β mean fluid viscosity, density, gravity force and volumetric thermal expansion coefficient, respectively Also Cp, K, and D mean specific heat, thermal conductivity and diffusion coefficient of air, respectively. In the model, the Reynolds stress term appearing in Equation (2) is assumed as follows:
ρ u i u j   =   2 3 k   ρ   δ i j μ t ( U i x j + U j x i )
where μt means eddy viscosity of fluid and defined as follows:
μ t   =   C μ ρ k 2 ε
The fluctuation correlation term appeared in Equations (5) and (6) are assumed as follows:
u i t = K t ρ   C p T x j , K t = μ   t C p P r t
ρ   u i m   =   ρ   D t M x j , D t = μ   t ρ   S c t
where Kt means turbulent thermal conductivity, and Dt means turbulent diffusion coefficient. In this calculation, the turbulent Prandtl number Prt = 0.9, and turbulent Schmidt number Sct = 0.9 were used. The abbreviations appeared in Equations (3) and (4) are shown as follows:
G S = μ t ( U i x j + U j x i ) U i x j
G T   = g i   β μ t σ t U i x i
R f = G T G s + G T
Also, the following numerical values are used in the parameters appearing in the above equations.
σ k = 1.0 , σ ε = 1.3 , σ t = 0.9 , C 1 = C 1 ( η ) , C 2 = 1.68 , C 3 = 0.00 , C μ = 0.085
where
C 1 ( η ) =   1.42 η ( 1 η / 4.38 ) 1 + 0.012   η 3
η =   k ε S
S = { 1 2 ( U i x j + U j x i ) ( U i x j + U i x i ) } 1 / 2
An orthogonal grid was used in this simulation, and the equations were solved using the analysis code “stream”. The calculation was conducted under the time-dependent condition, and continued until the time when the velocity, temperature and moisture were no longer varied. The oversaturated area in the computational domain was visualized as a visible plume.

3.2. Cooling Tower Model, Initial and Boundary Conditions

3.2.1. Calculation Model

Cooling tower models and computational domains were designed as follows. The actual shape of a cooling tower is an inverted trapezoid as shown in Figure 1. As an orthogonal grid is applied in this study, a huge number of grid points is required to express the actual shape of a cooling tower. To reduce the number of grid points and to shorten the computational time, the shape of the cooling tower is adjusted to a rectangular module that has dimensions almost the same as those of the actual cooling tower. The effect of this small adjustment on the computation is considered to be small. 
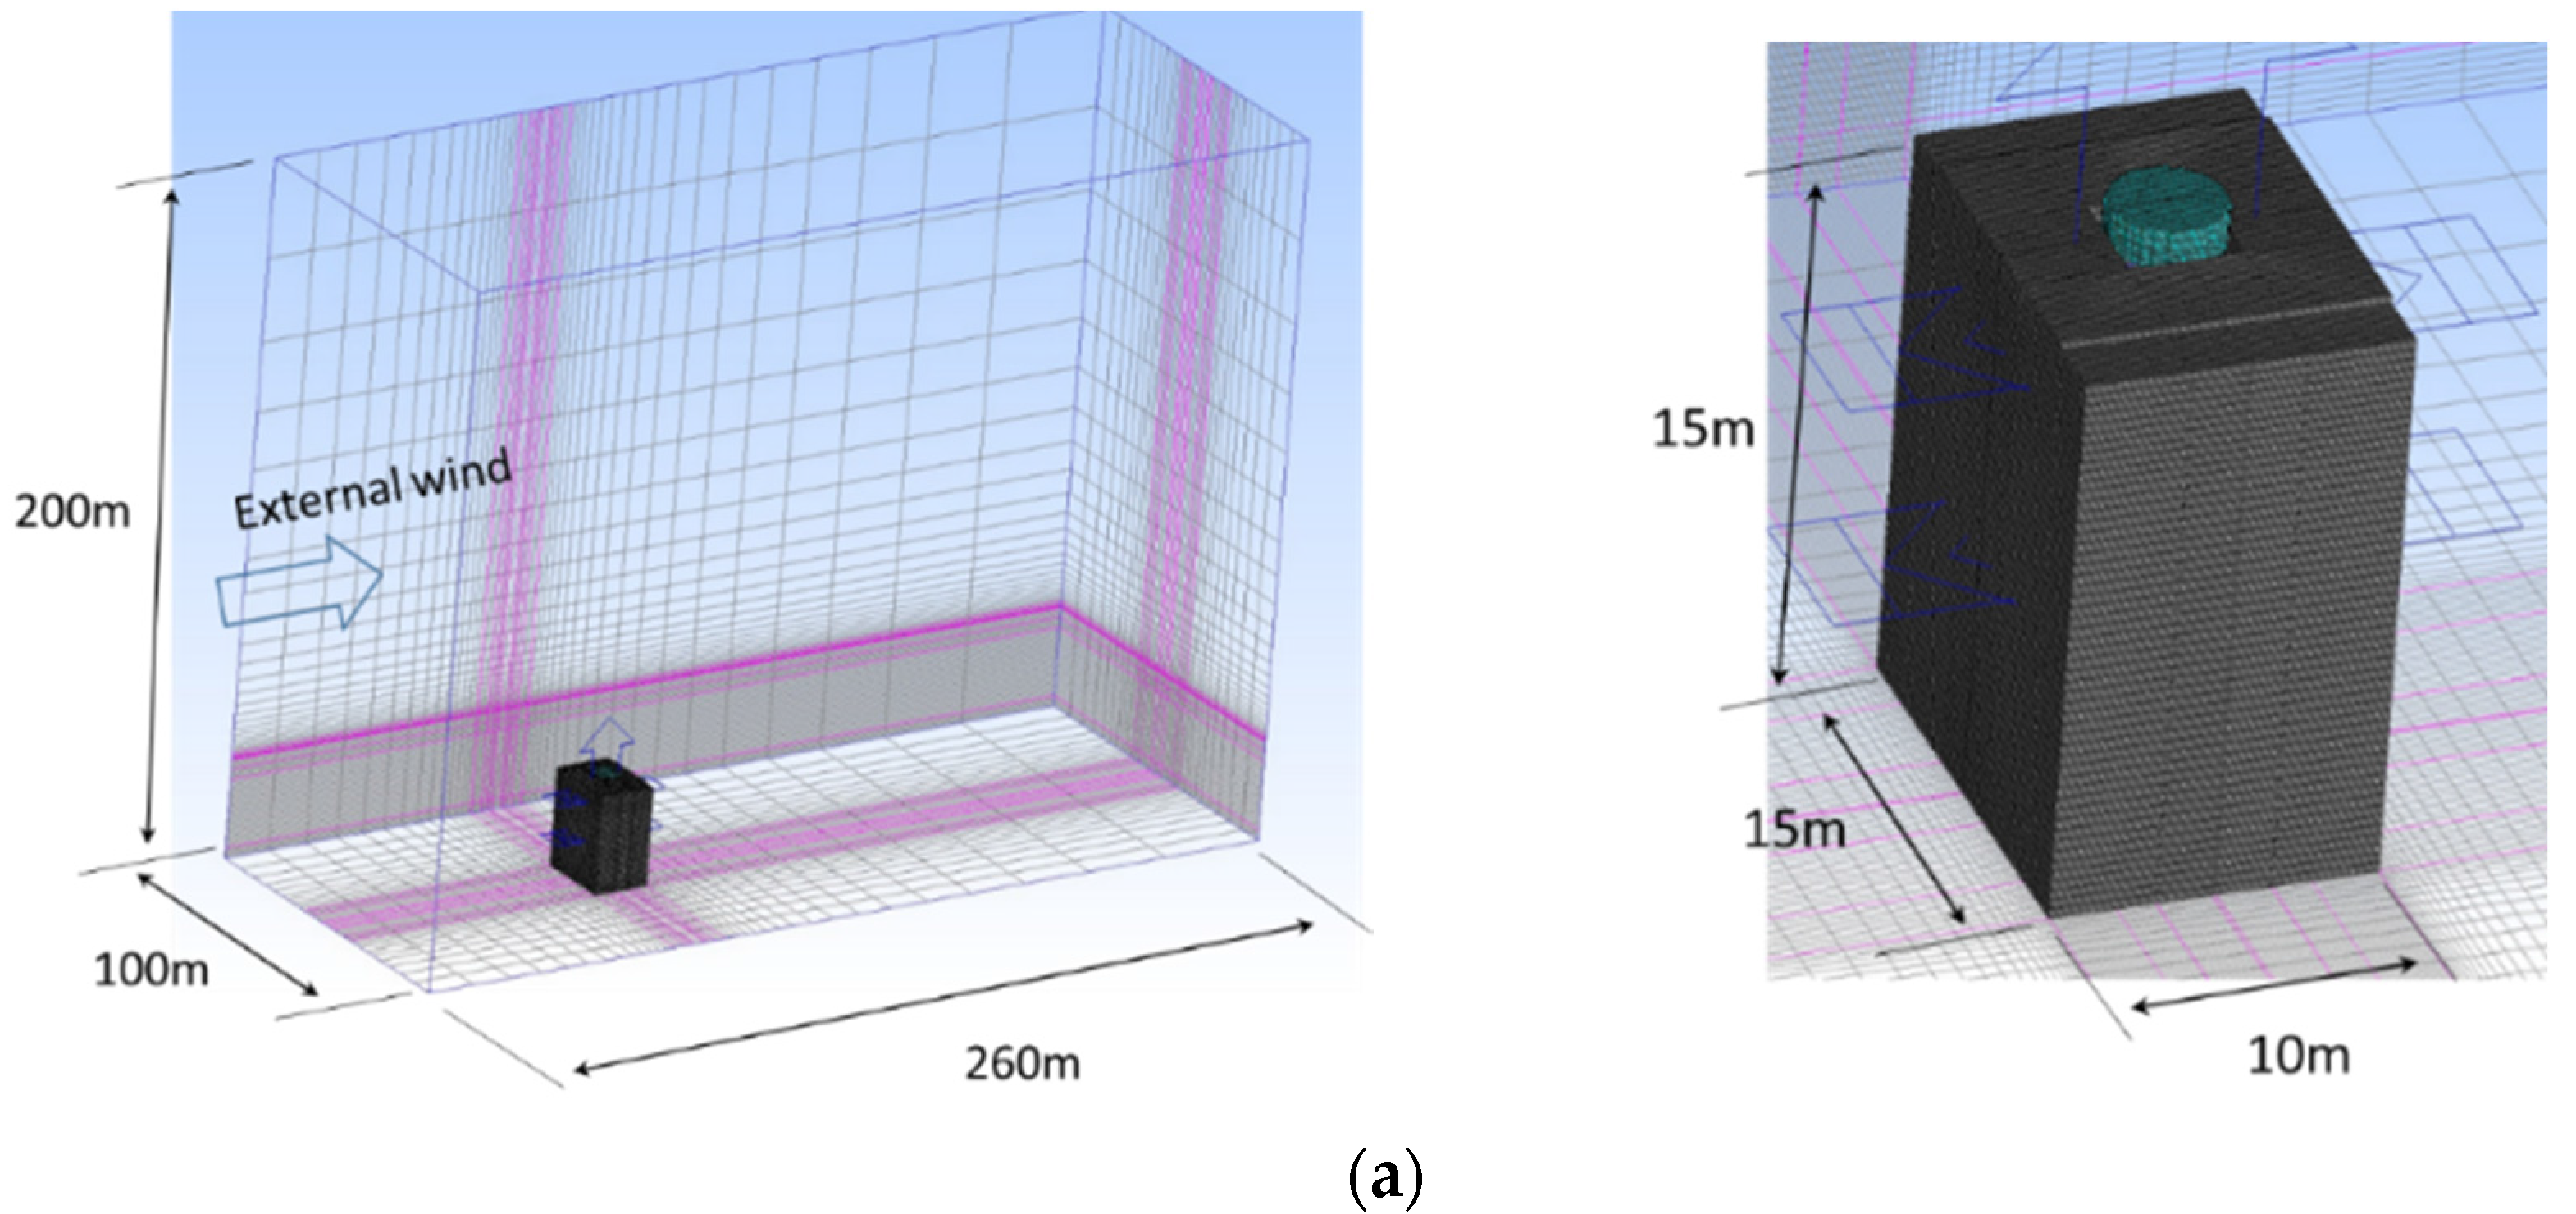
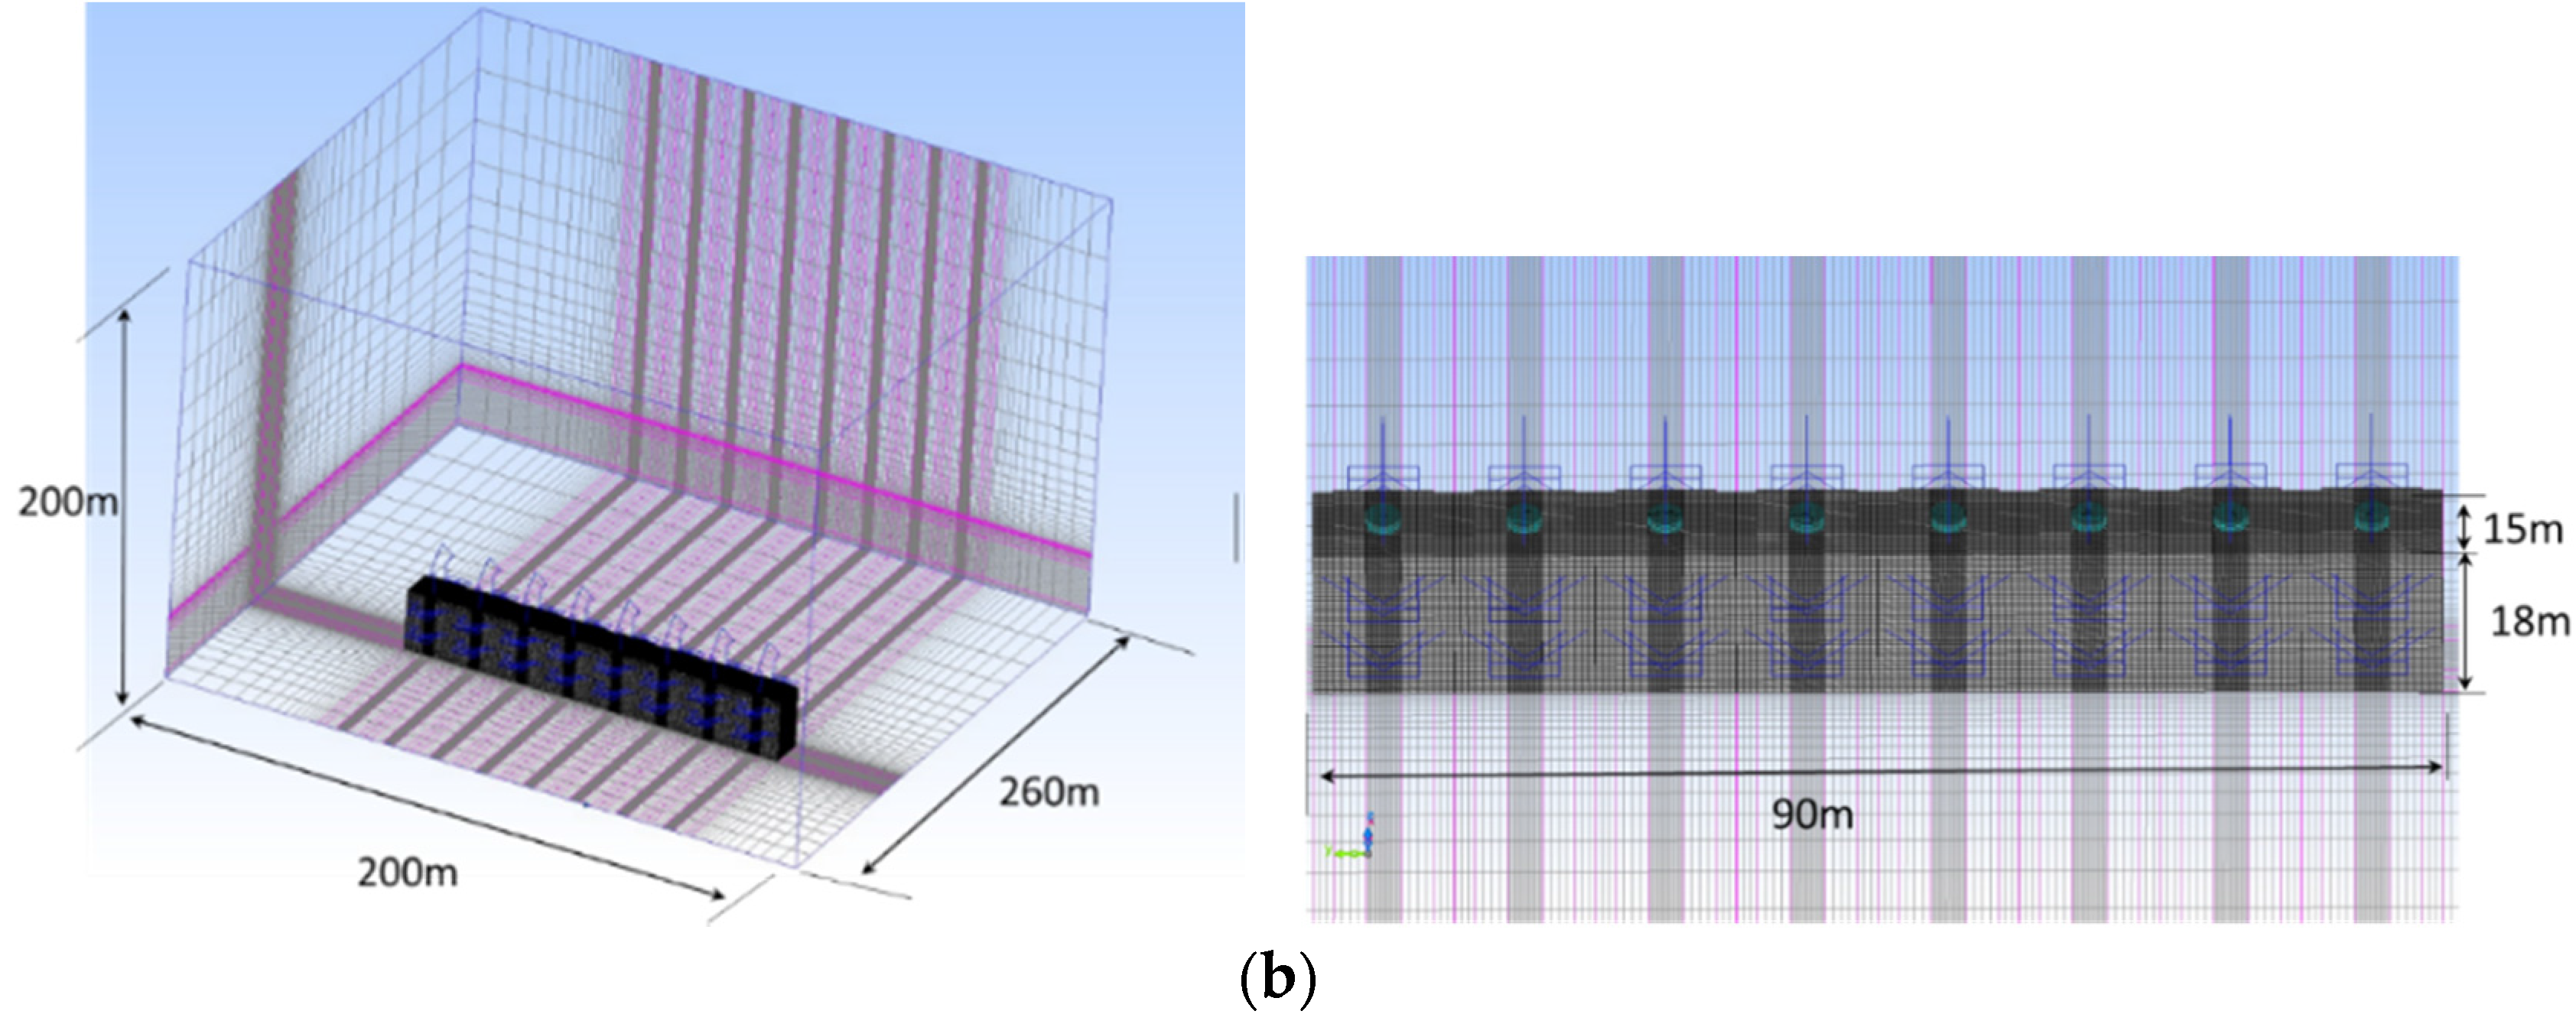
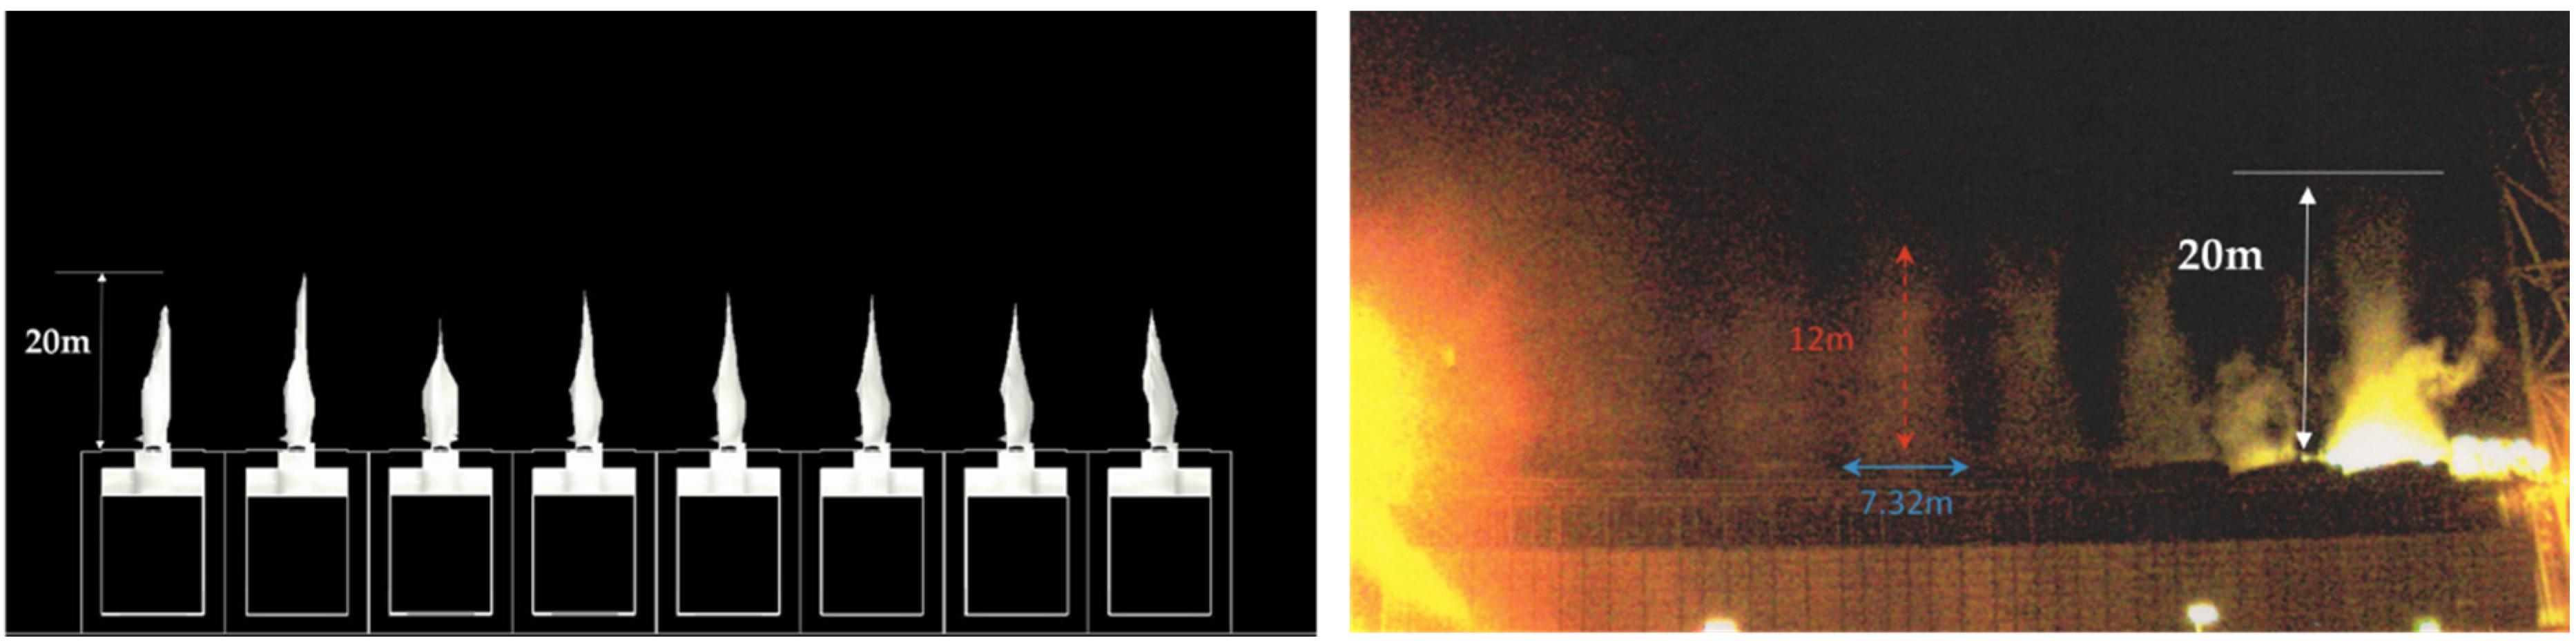
Figure 3 shows two cases of the calculation model. Figure 3a corresponds to Runs 1, 2, 5, 6, 7, 8 of Table 1 described later, and Figure 3b corresponds to Runs 3 and 4 composed of eight cooling towers. In this calculation, a finer grid was applied in the fan area, and a rectangular fill shape was applied to reduce the number of mesh cells.

3.2.2. Wet Operation

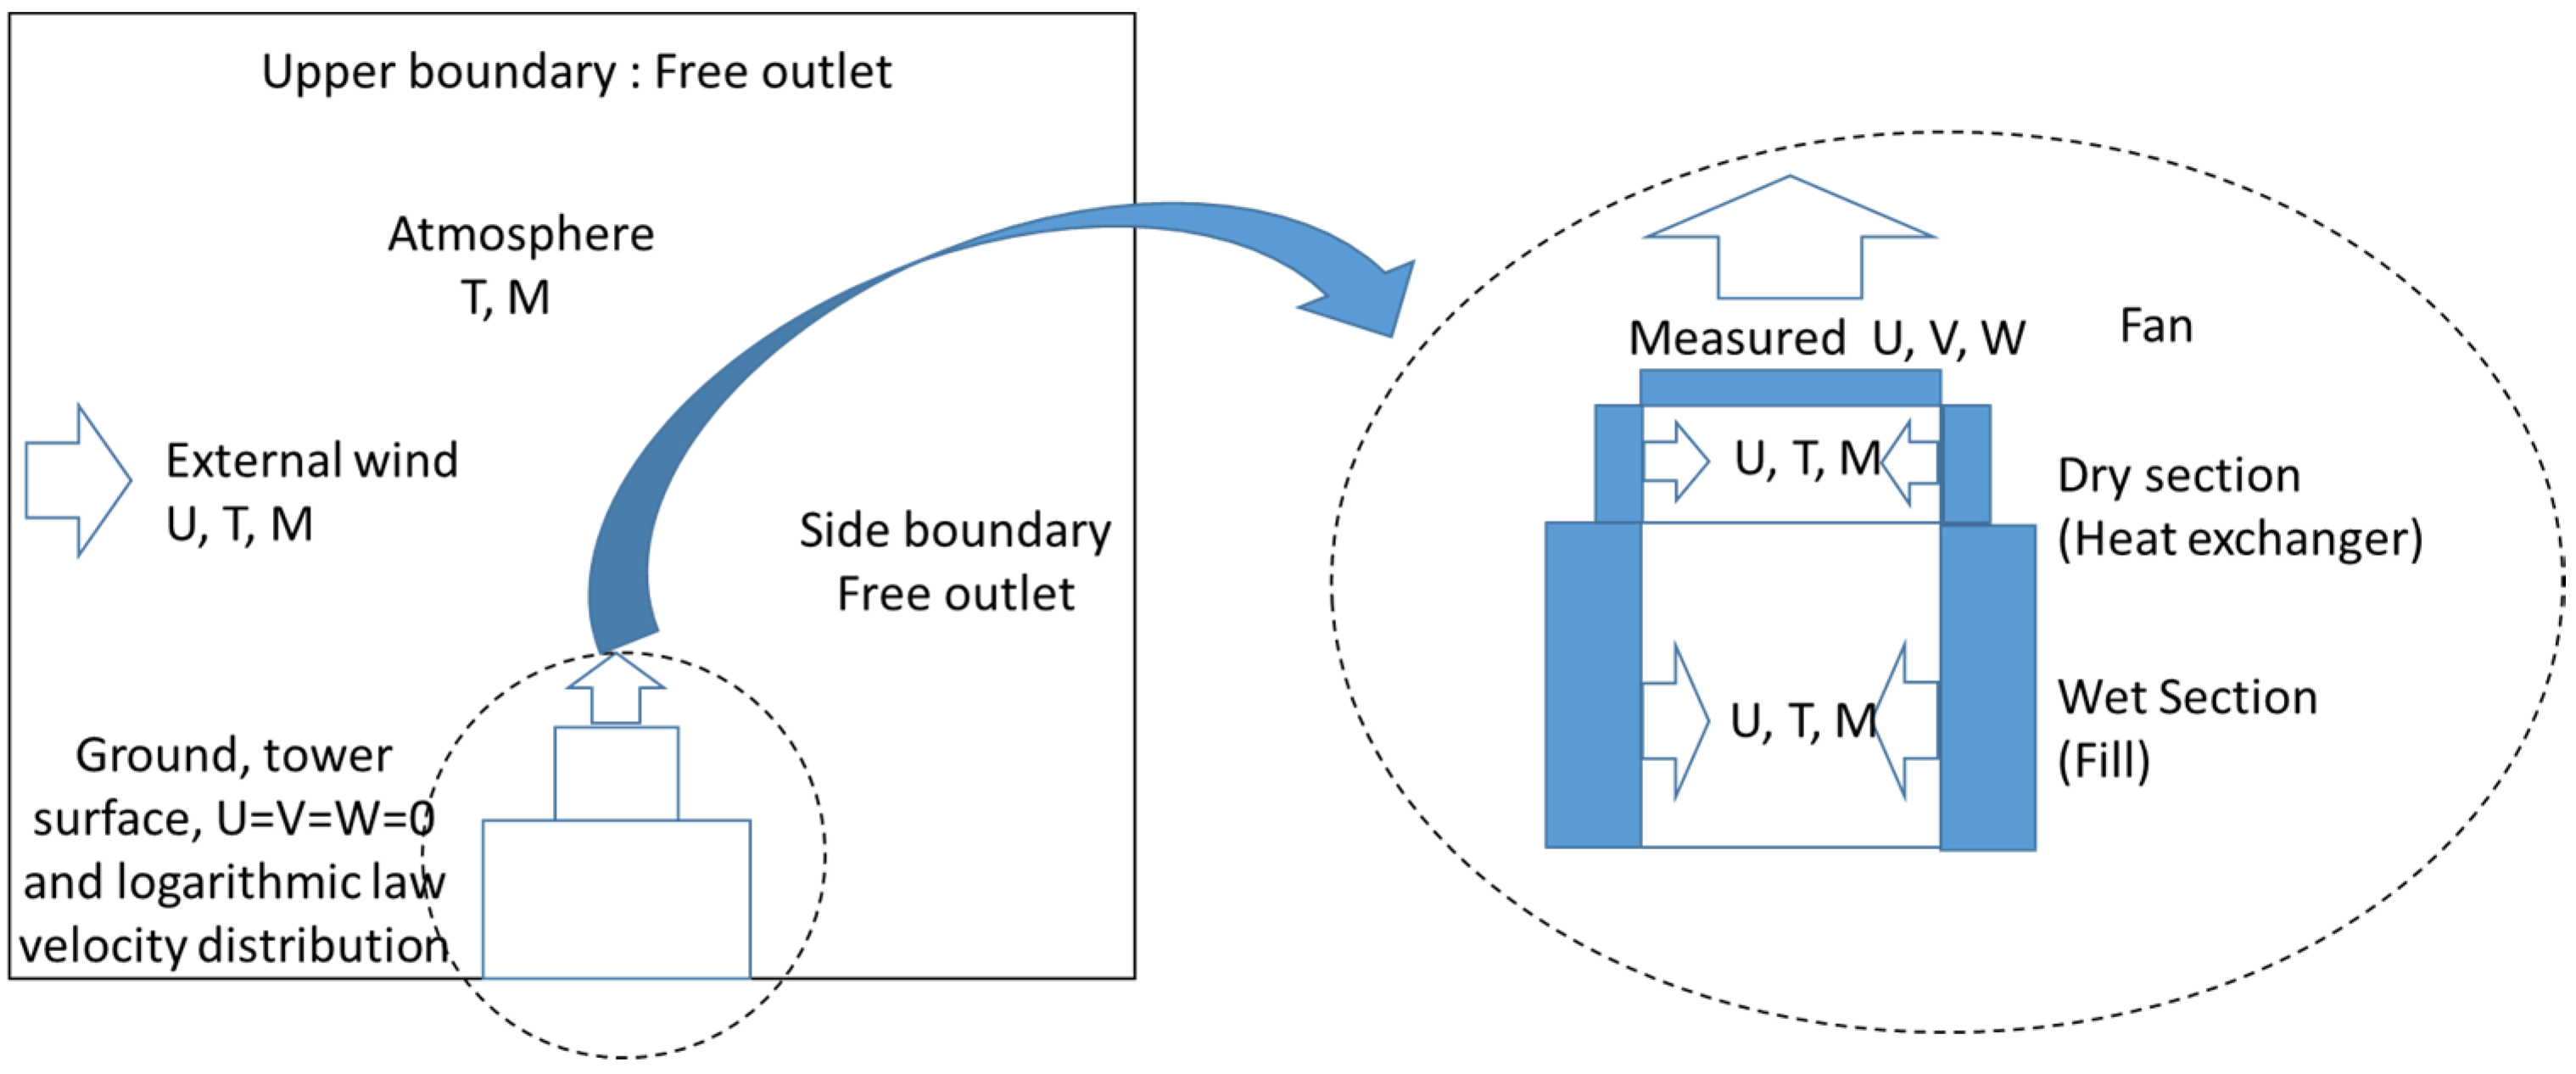
Figure 4 shows the initial and boundary conditions used in this calculation. In wet operation, measured velocity distributions, temperature and moisture were given as the boundary conditions. The velocity distribution at the exit of the fan was measured using model equipment with a fan diameter of 580 mm by Takata et al. [8]. 
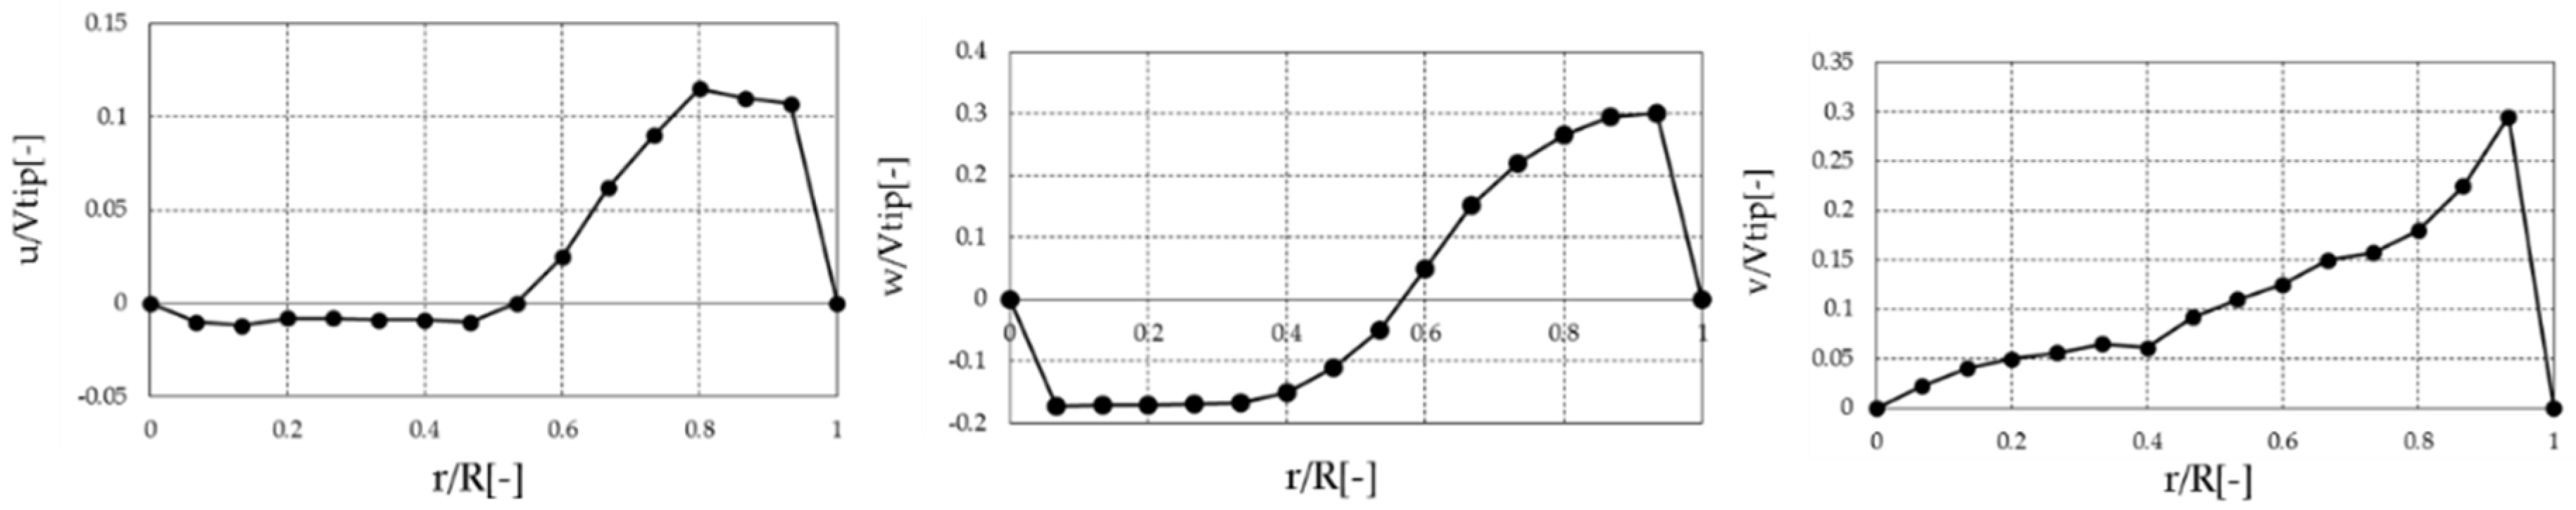
Figure 5 shows the measured velocity distributions obtained by a laser doppler velocimeter at the outlet of the exhaust fan. The velocities in three directions are normalized by the peripheral tip velocity of the rotating fan, and the positions of measured velocities are normalized by the radius of the fan. The measured velocity profile was assumed to be similar to that of the actual tower. The use of measured velocities as a boundary condition is considered to be effective in accurately predicting the effect of radial and circumferential direction flows produced by the rotating fan. However, although it would be ideal to solve the velocity distributions generated by the rotating fan, it is difficult to obtain the detailed velocity distribution through CFD analysis applying a moving boundary problem to the fan. Therefore, for simplification of the calculation, the measured velocity distribution was used. Additionally, measured outside air temperatures (dry bulb temperature and wet bulb temperature, hereafter DBT and WBT), moisture surrounding the cooling tower and wind velocity shown in Figure 5 and Table 1 were given as the initial and boundary conditions in the computational domain.

3.2.3. Dry-and-Wet Combined Operation

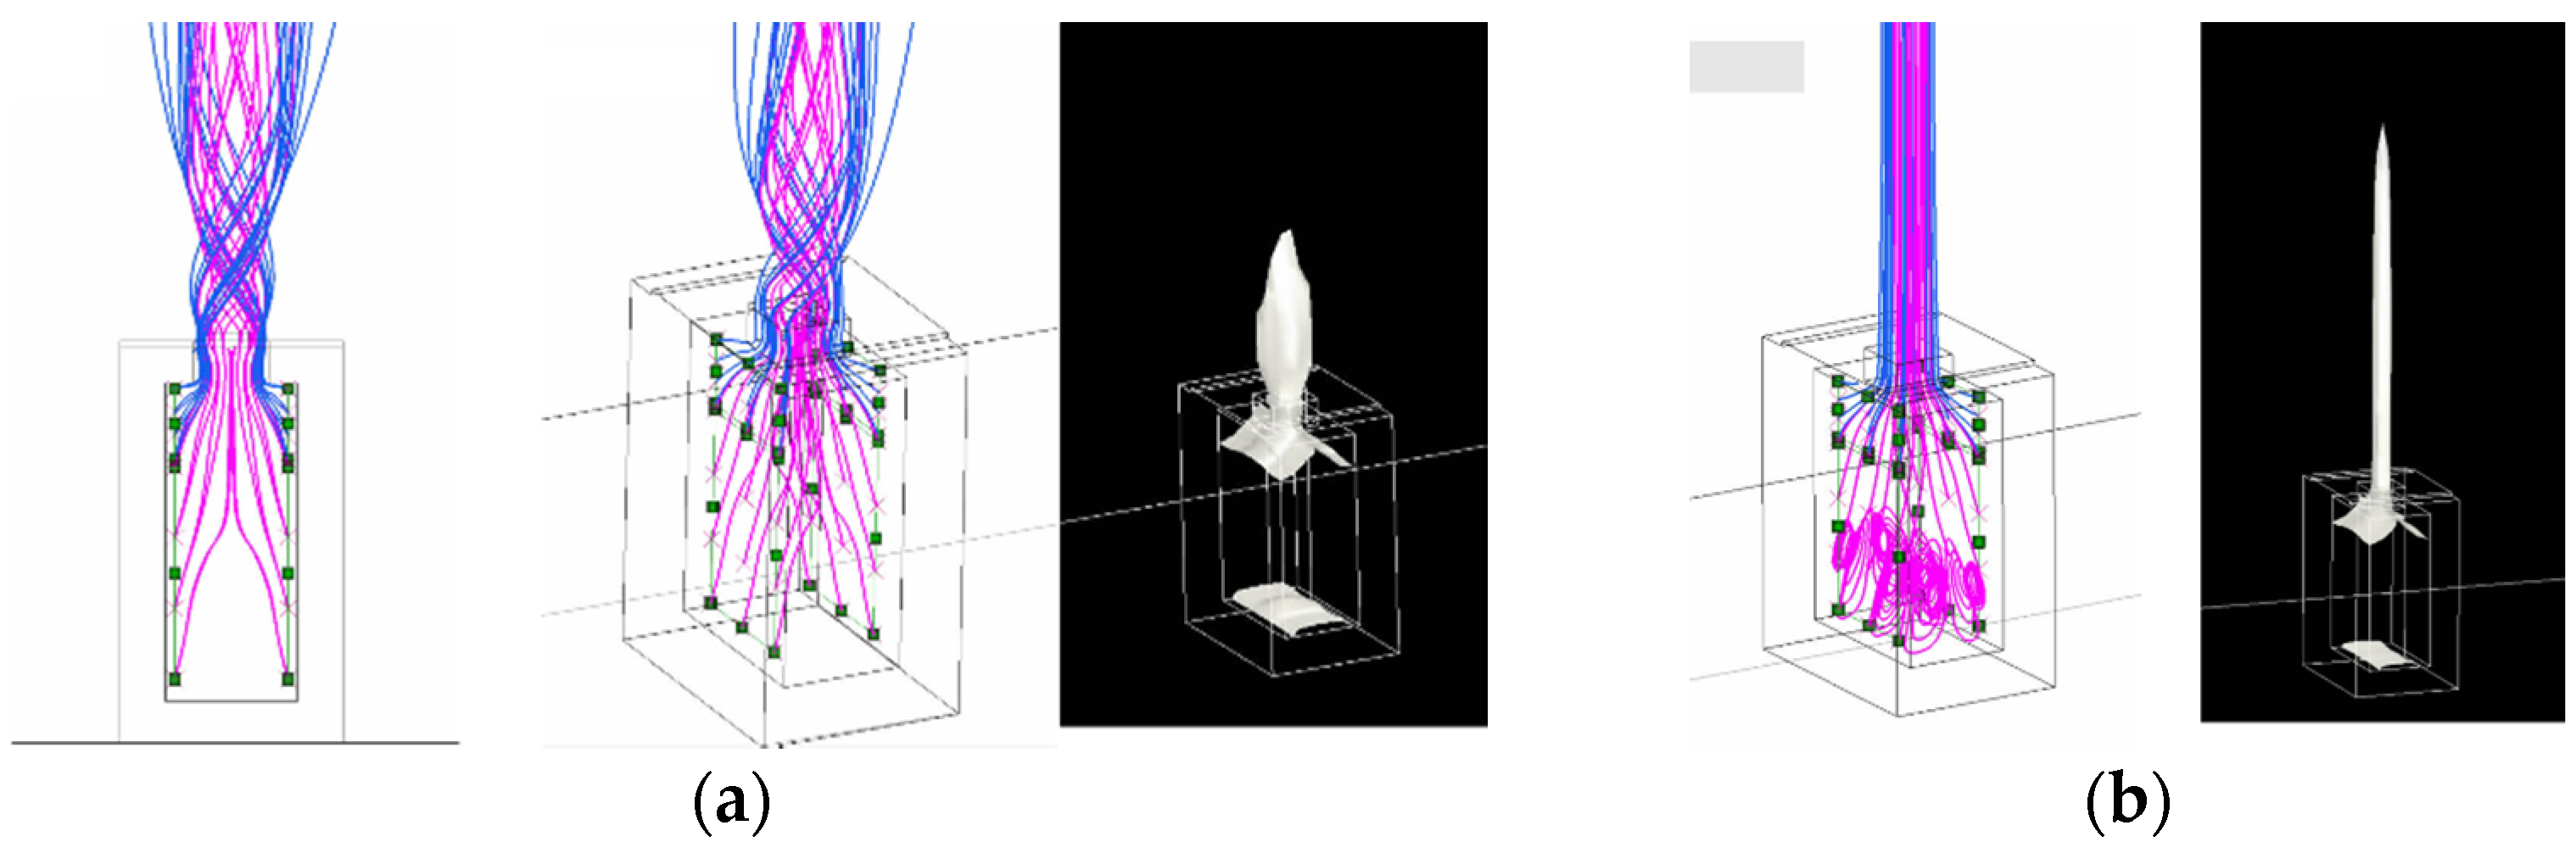
In dry and wet combined operation, air conditions and the flow rates at the outlets of dry and wet sections were given as boundary conditions. Here, the outlets of the dry and wet sections are located inside the cooling tower as schematically shown in Figure 4. Because the air passes through the dry and wet sections, it might be ideal to determine the outlet conditions of dry and wet sections through CFD analysis considering the material and heat exchanges under the direct contact of air and water in the fill. However, the transport phenomenon in the fill is so complex that it is difficult to simulate. In this CFD analysis, the air flow rate and temperature at the exits of dry and wet sections were determined according to the actual design calculation, based on the experiments of cooling performance. The same velocity distributions used in the wet operation were also given in the exhaust fan area. In this calculation, the velocities of the fan area and dry and wet sections were given in the computational domain, so that air volume from the exhaust fan and that from wet and dry sections were set equal to maintain mass conservation. By adopting such a procedure, we clarify the effect of velocity components in three directions produced by the fan on the mixing of dry air and wet air following the collision immediately under the fan.

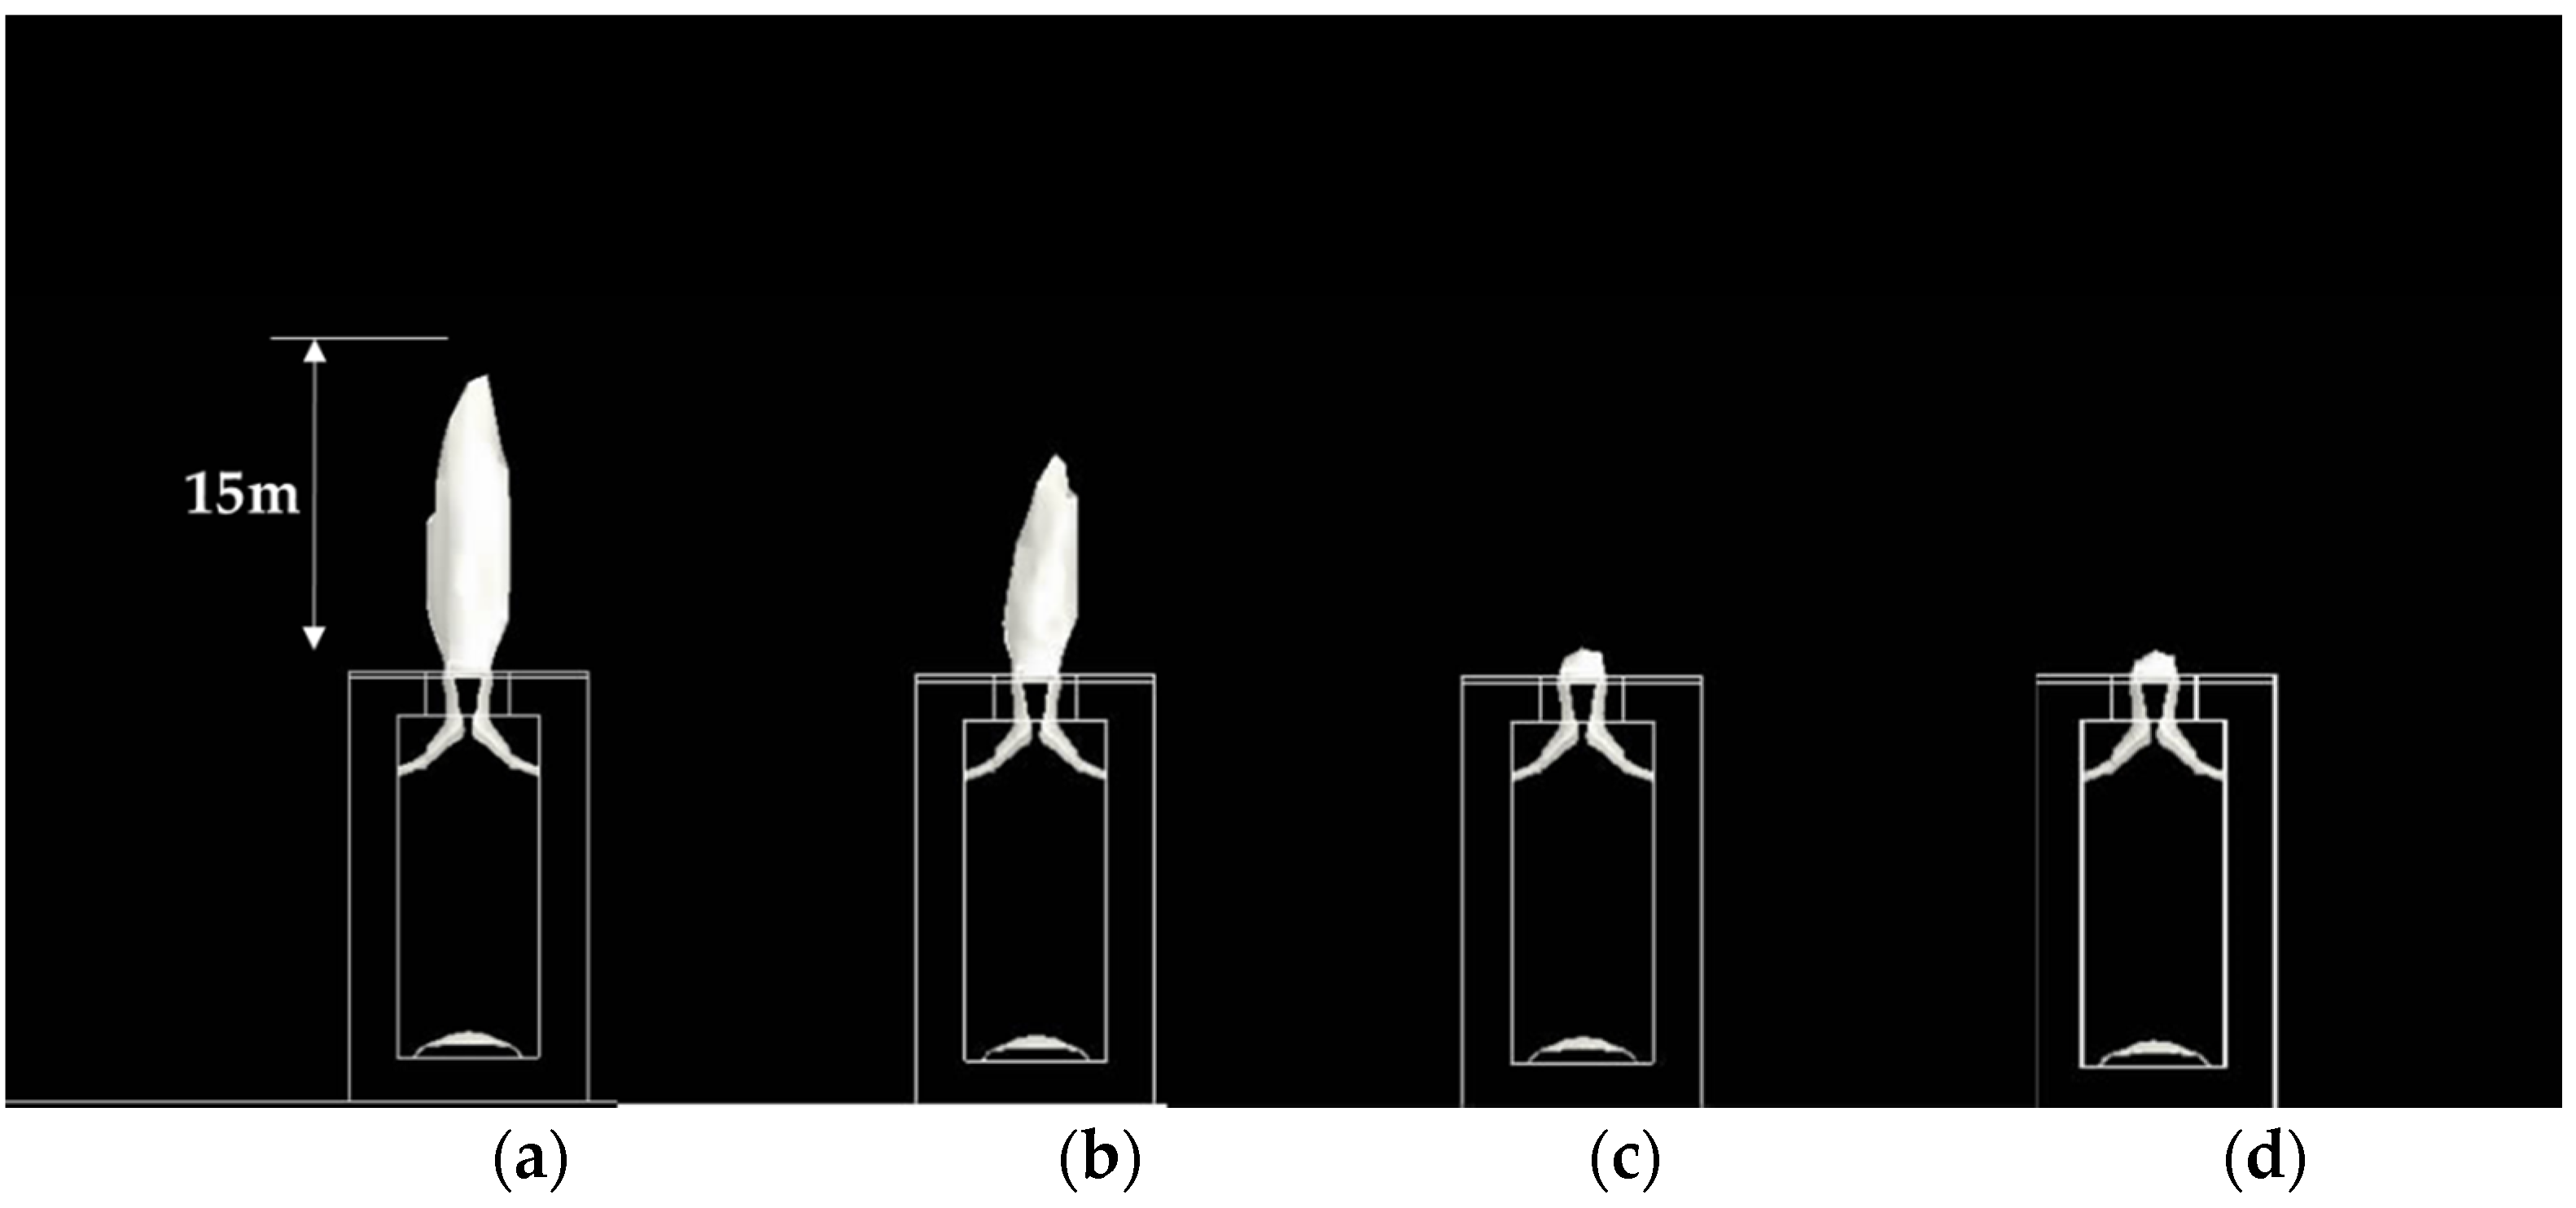
3.3. Calculation Conditions

Calculation conditions are given in Table 1. In this calculation, the plume length was validated under several conditions.

4. Observations

The observation of the visible plume and measurements of the air condition are important not only for determining the calculating conditions, but also for the verification of the calculation results. Figure 6 shows the schematic of observation in the field. In the observation, the visible plume was photographed by camera. The external wind velocity and its temperature (DBT and WBT) were measured by a Biram wind gauge and thermistor. These sensors were installed at the tip of the rod, and the rod was extended 5 m horizontally from the top scaffolding of the cooling tower. In this study, measured air conditions (DBT, WBT and external wind velocity) were given as the initial and boundary conditions of the CFD analysis. The observation was conducted in the early morning and after sunset when the relative humidity was relatively high, and the scale of the visible plume (length, volume) was determined by measuring the length of the plume from a photograph that was taken from a distant point.

5. Results and Discussion

5.1. Validity of CFD Analysis

The calculation and observation results of visible plumes are shown in Figure 7 (Run 1). A region of supersaturated volume is graphically shown as a visible plume. The visible plume obtained by the calculation is in good agreement with that observed, and the diffusion effect by the external wind seems to shorten the length of the visible plume. In other words, the scale of the visible plume is reduced by turbulent diffusion due to the effect of external wind. To clarify the effect of external wind on the visible plume, the scale of the plume without external wind was also calculated to investigate the discrepancy with regard to the plume with external wind. Figure 7c shows the results of the visible plume without external wind (Run 2). The calculation result shows that the scale of the visible plume without external wind increases approximately three times in length and four times in volume relative to that with external wind. From the estimation of the calculation, it is obvious that there is a reduction effect on the scale of the visible plume due to the effect of external wind. This result shows that the present CFD analysis using the turbulent model is effective in predicting the scale of a visible plume in evaluating its scale during the design stage of industrial facilities. CFD analysis is verified in the next section for the case of low or negligible external wind velocity.

5.2. Dry and Wet Combined Operation (without External Wind)

Figure 8 compares the calculation and observation results of a visible plume rising from eight cooling towers with wet operation installed at a power plant in a costal industrial zone (Run 3). Observation was carried out after sunset, and the photograph is therefore not clear. However, the photograph is considered to show the main features and height of the visible plume. In the case of wet operation as shown in Figure 8, the length of the plume at the center portion of the eight cooling towers is the longest, and the calculation results are consistent with the observation. The length of the plume is approximately 90 m according to calculation, and 80 m according to observation. It is thought that the maximum length is in the vicinity of the center of the cooling towers because turbulent diffusion in the central portion is suppressed by the adjacent thermal exhaust on both sides. In contrast, at the outer ends of the cooling towers, the opportunity of contact with outside air is considered to be large and, therefore, heat and mass transfer between the plume and outside air is enhanced and the scale of the plume is reduced. The validity of the calculation is thus also shown in predicting the visible plume without external wind.
Figure 9 compares the calculation and observation results of a visible plume in dry and wet combined operation (Run 4). The visible plumes according to both calculation and observation are largely reduced compared with the plumes in Figure 8, and it is obvious that dry and wet combined operation abates the plume. For the engineering design of a mechanical-draft cooling tower, the generation of a visible plume is judged by checking the absence or presence of the intersection of the saturated line and operating line on the air chart. Note that in conducting an actual environmental impact assessment, CFD analysis is recommended when the geographical location of the cooling tower and the surrounding obstacles should be considered.

5.3. Effect of Air Mixing on the Visible Plume

The previous section described that the air mixing condition of heated air from the dry section and moist air from the wet section affects the scale of the visible plume. To investigate the air mixing conditions, air flow from both sections to the fan area is examined. Figure 10a shows the trajectories of marked particles from both sections to the outside of the cooling tower through the fan. Each streamline is pushed radially outward by the centrifugal force together with further twisting in the circumferential direction, and the two streams of air are vigorously combined and mixed in the fan area. The mixing of dry air and moist air from the two sections is promoted by the behavior of the rotating fan. Additionally, the motion maximizes the mixing efficiency of the two streams of air and minimizes the scale of the visible plume. For one example, Figure 10b shows the calculation results obtained without the fan for further discussion.
Interestingly, a longer visible plume is calculated without the fan, although the exhaust moist air volume is the same. This phenomenon is attributed to the insufficient mixing of the two streams of air when they only meet in the cooling tower. In the case of the fan, the length of the visible plume is shorter, and the diameter of the visible plume is a little larger than that without the fan. These phenomena are due to the diffusion effect in the radial direction being enhanced by the rotation of the fan. Therefore, the fan has a function of mixing the two streams of air. This result indicates that, in the design stage of a mechanical-draft cooling tower, it is necessary to judge by checking the cross line of saturated and operation lines whether the visible plume is generated.

5.4. Effect of the External Wind Velocity on the Visible Plume

In this section, the effect of dry and wet combined operation on the visible plume and the effect of external wind on the scale of the visible plume are considered in the CFD analysis, since the CFD used in this study is applicable within a permissible error range for actual design. Figure 11a shows the calculated visible plume for dry and wet combined operation and zero external wind velocity (Run 5). This calculation is based on the actual cooling tower of Run 2, for which the economically designed dry and wet sections are used. It is observed that the visible plume is abated by the installation of the dry section, compared with that of wet operation, as shown in Figure 7. In Section 5.1, it was found that the effect of external wind on the scale of the visible plume is large and the effect is to abate the visible plume. This section also demonstrates by calculation the effect of external wind on the scale of the visible plume rising from a dry and wet combined cooling tower. In particular, a dry and wet combined cooling tower is designed so as to reduce the extent of the visible plume, and a strong effect of external wind on the scale of the visible plume is expected. Figure 11b–d show the effect of the external wind velocity on the scale of the visible plume, where the external wind velocity has been set to 1 m/s (Run 6), 3 m/s (Run 7), and 5 m/s (Run 8), respectively. The results show that the visible plume abates as the external wind becomes stronger and disappears at a certain wind velocity. The visible plume rising from the cooling tower is usually observed in the ground boundary layer of the atmosphere and the scale is not very large, and it is therefore thought that external wind appreciably affects the scale of the visible plume.

6. Conclusions

The prediction of a visible plume rising from a cross flow mechanical-draft cooling tower was examined under the conditions of wet operation and dry and wet combined operation in this study. Additionally, the effects of mixing in the cooling tower and external wind on the scale of the visible plume were examined. The obtained results are summarized as follows.
(1)
The prediction of a visible plume rising from a cooling tower with dry and wet sections is possible employing CFD analysis and a turbulent model. The calculated results were validated with observed plumes, and the accuracy was found to be within the error range of 15%–20%, which is permissible for conducting practical design.
(2)
The mixing condition of heated air from the dry section and moist air from the wet section affects the scale of the visible plume. In the case of a mechanical-draft cooling tower, two streams of air are well mixed by the combined effect of twisting flow in the circumferential direction and radial outward flow due to the centrifugal force. A rotating fan is considered to function as a mixer. Therefore, in designing a cooling tower with a rotating fan, it is considered that the performance design for plume abatement can be conducted using the operating line on an air chart.
(3)
The effect of external wind on the scale of the visible plume under dry and wet combined operation is appreciable, and the visible plume becomes small as the external wind becomes stronger. These results are considered to suggest that the visible plume is relatively small and the diffusion effect of external wind thus reduces the extent of the visible plume.

Supplementary Files

Supplementary File 1

Acknowledgments

Authors would like to express our thanks to the support of the members of Kobelco Eco-Solutions Co., Ltd. in conducting the field observations.

Author Contributions

Kazutaka Takata wrote the majority of the manuscript and conducted the simulations and observations, according to the company carrier of engineering on a cooling tower. Takenobu Michioka and Ryoichi Kurose contributed various scientific insights and helped edit the manuscript.

Conflicts of Interest

The authors declare that they have no conflict of interest.

References

  1. Nevins, S.; Libert, J.P. Cooling tower plume. CTI 2011, 32, 14–30. [Google Scholar]
  2. Schatzsmann, M.; Policastro, A.J. Effects of the Boussinesq approximation on the results of strongly-buoyant plume calculations. J. Clim. Appl. Meteorol. 1984, 23, 117–123. [Google Scholar] [CrossRef]
  3. Haman, K.E.; Malinowski, S.P. Observations of cooling tower and stack plumes and their comparison with plume model “ALINA”. Atmos. Environ. 1989, 23, 1223–1234. [Google Scholar] [CrossRef]
  4. Andreopolous, J. Wind tunnel experiments on cooling tower plumes. J. Heat Trans. 2013, 111, 941–948. [Google Scholar] [CrossRef]
  5. Michoka, T.; Sato, A.; Sada, K.; Shimoda, A.; Ichikawa, Y. Visible plume model for a mechanical draft cooling tower-development of the plume height and diffusion models. J. Jpn. Soc. Atmos. Environ. 2009, 44, 147–154. [Google Scholar]
  6. Demruen, A.O.; Rodi, W. Three-dimensional numerical calculations on flow and flume spreading past cooling towers. J. Heat Trans. 1987, 109, 113–119. [Google Scholar] [CrossRef]
  7. Kouchi, A.; Ohba, R.; Okabayashi, K.; Nonaka, T. Prediction Technique for Visible Plume from Cooling Tower. Tech. Rev. MHI LND. 1999, 36, 75–79. [Google Scholar]
  8. Takata, K.; Nasu, K.; Yoshikawa, H. Prediction of the plume from a Cooling Tower. CTI 1996, 17, 26–37. [Google Scholar]
Figure 1. Schematics of cross flow cooling towers with a mechanical draft device (rotating fan): (a) wet type; (b) dry and wet combined type.
Atmosphere 07 00059 g001
Figure 2. Schematic diagram of an air chart, describing the operating lines of a cooling tower.
Atmosphere 07 00059 g002
Figure 3. Analysis model and computed domain in the case of a single cooling tower (a) and eight towers (b).
Atmosphere 07 00059 g003aAtmosphere 07 00059 g003b
Figure 4. Initial and boundary conditions for the numerical calculations.
Atmosphere 07 00059 g004
Figure 5. Velocity distributions at the outlet of the exhaust fan measured using model equipment [8].
Atmosphere 07 00059 g005
Figure 6. Schematic picture of observation and measuring condition of visible plume and external wind velocity and temperature.
Atmosphere 07 00059 g006
Figure 7. Comparisons of (a) calculated and (b) observed visible plumes with external wind, and (c) the calculated visible plume without external wind.
Atmosphere 07 00059 g007
Figure 8. Comparisons of calculated and observed visible plumes under wet operation.
Atmosphere 07 00059 g008
Figure 9. Comparisons of calculated and observed visible plume under dry and wet operation.
Atmosphere 07 00059 g009
Figure 10. Trajectories of marked particles from dry and wet sections to outside the cooling tower: (a) with a fan; (b) without a fan.
Atmosphere 07 00059 g010
Figure 11. Effect of the external wind velocity on the scale of the visible plume for dry and wet combined operation; wind velocity of (a) 0 m/s, (b) 1 m/s, (c) 3 m/s, and (d) 5 m/s.
Atmosphere 07 00059 g011
Table 1. Calculation conditions.
Run-1Run-2Run-3Run-4Run-5Run-6Run-7Run-8
Mode of OperationWetWetWetWet/DryWet/DryWet/DryWet/DryWet/Dry
Cooling Tower Size (m)15 × 10 × 15 H15 × 10 × 15 H15 × 90 × 18 H15 × 90 × 18 H12 × 10 × 15 H12 × 10 × 15 H12 × 10 × 15 H12 × 10 × 15 H
Fan Diameter (m)5.495.497.427.425.495.495.495.49
Wind Velocity (m/s)6.80.00.00.00.01.03.05.0
Number of Tower11881111
Observation PhotoYesNoneYesYesNoneNoneNoneNone
Outside Air Conditions
DBT (°C)1.811.410.210.211.411.411.411.4
WBT (°C)7.410.09910.010.010.010.0
Fan Exit (Wet mode)
DBT (°C)303026.5-----
WBT (°C)303026.5-----
H/EX Exit (Wet/Dry mode)
DBT (°C)---1718181818
WBT (°C)---12.511.511.511.511.5
Fill Exit (Wet/Dry mode)
DBT (°C)---26.530303030
WBT (°C)---26.530303030
Analysis Area
Mesh Numbers200 × 100 × 80200 × 100 × 80312 × 82 × 80312 × 82 × 80200 × 100 × 80200 × 100 × 80200 × 100 × 80200 × 100 × 80
Analysis Domain (m)260 × 100 × 200260 × 100 × 200200 × 260 × 200200 × 260 × 200260 × 100 × 200260 × 100 × 200260 × 100 × 200260 × 100 × 200

