Article

Effect of Pollution Controls on Atmospheric PM2.5 Composition during Universiade in Shenzhen, China

1
Department of Chemistry and Biochemistry, University of Denver, Denver, CO 80208, USA
2
College of Resources and Environment, University of Chinese Academy of Sciences, Beijing 100049, China
3
Huairou Eco-Environmental Observatory, Chinese Academy of Sciences, Beijing 101408, China
4
Key Laboratory for Urban Habitat Environmental Science and Technology, School of Environment and Energy, Peking University Shenzhen Graduate School, Shenzhen 518055, China
*
Author to whom correspondence should be addressed.
Atmosphere 2016, 7(4), 57; https://doi.org/10.3390/atmos7040057
Submission received: 31 December 2015 / Revised: 30 March 2016 / Accepted: 9 April 2016 / Published: 14 April 2016
(This article belongs to the Special Issue Air Quality and Source Apportionment)

Abstract

:
The 16th Universiade, an international multi-sport event, was hosted in Shenzhen, China from 12 to 23 August 2011. During this time, officials instituted the Pearl River Delta action plan in order to enhance the air quality of Shenzhen. To determine the effect of these controls, the current study examined the trace elements, water-soluble ions, and stable lead isotopic ratios in atmospheric particulate matter (PM) collected during the controlled (when the restrictions were in place) and uncontrolled periods. Fine particles (PM2.5) were collected at two sampling sites in Shenzhen: “LG”—a residential building in the Longgang District, with significant point sources around it and “PU”—Peking University Shenzhen Graduate School in the Nanshan District, with no significant point sources. Results from this study showed a significant increase in the concentrations of elements during the uncontrolled periods. For instance, samples at the LG site showed (controlled to uncontrolled periods) concentrations (in ng·m−3) of: Fe (152 to 290), As (3.65 to 8.38), Pb (9.52 to 70.8), and Zn (98.6 to 286). Similarly, samples at the PU site showed elemental concentrations (in ng·m−3) of: Fe (114 to 301), As (0.634 to 8.36), Pb (4.86 to 58.1), and Zn (29.5 to 259). Soluble Fe ranged from 7%–15% for the total measured Fe, indicating an urban source of Fe. Ambient PM2.5 collected at the PU site has an average 206Pb/204Pb ratio of 18.257 and 18.260 during controlled and uncontrolled periods, respectively. The LG site has an average 206Pb/204Pb ratio of 18.183 and 18.030 during controlled and uncontrolled periods, respectively. The 206Pb/204Pb ratios at the PU and the LG sites during the controlled and uncontrolled periods were similar, indicating a common Pb source. To characterize the sources of trace elements, principal component analysis was applied to the elements and ions. Although the relative importance of each component varied, the major sources for both sites were identified as residual oil combustion, secondary inorganic aerosols, sea spray, and combustion. The PM2.5 levels were severely decreased during the controlled period, but it is unclear if this was a result of the controls or change in meteorology.

Graphical Abstract

1. Introduction

Due to an increase in urbanization and economic growth in China, air pollution has become a severe problem. PM2.5 is a key pollutant strongly impacted by the rapid development in China [1,2,3]. High PM2.5 levels are associated with human mortality [4,5,6], climate change [7], visibility degradation [8,9], and agricultural yield reduction [10]. Increased morbidity and mortality rates and the adverse health effects of particle exposure are predominantly linked to chemical composition of PM [11,12]. From a toxicological viewpoint, the trace metals play an important role in increasing the redox activity of ambient PM [13,14,15]. Metals are hard to eliminate and they therefore accumulate in organisms and plants and can cause severe human health related problems and environmental pollution [16,17]. The inhalation of metals is associated with disruption of the nervous system and the functioning of internal organs [18,19,20].
Shenzhen (22°33’N, 114°06’E), home to a population of 10.62 million residents, is one of the most important industrial centers in China. It is a coastal city in the Guangdong Province located at the mouth of the Pearl River Delta (PRD), bordering Hong Kong. Previous studies measured PM2.5 mass concentrations during winter and summer months in Shenzhen and Hong Kong. The PM2.5 levels (in µg·m−3) were higher at Shenzhen, 47 ± 17 and 61 ± 18, relative to Hong Kong, 31 ± 17 and 55 ± 23, during summer and winter months, respectively [21,22]. Overall, Shenzhen displayed maximum PM2.5 levels in winter months relative to summer months [23], both of which exceed the 24-h mean ambient air quality standards of the World Health Organization (WHO) of 25 µg·m−3 [24] and the annual ambient air quality standards of People’s Republic of China (GB 3095-2012) of 35 µg·m−3 [25].
The 16th Universiade, an international multi-sport and cultural event organized for university athletes by the International University Sports Federation, was hosted in Shenzhen, China from 12 to 23 August 2011. During this time, officials instituted several restrictions: (a) the PRD action plan [26], which includes the prevention and control of industrial pollution, flow source pollution, and dust and point source pollution; (b) an ozone controlling plan which includes control of emissions of volatile organic compounds (VOCs) and promotion of an oil to gas project for thermal power plants; and (c) traffic-control actions such as restricting access within the region in order to enhance the air quality of Shenzhen. In this study, airborne PM2.5 (aerodynamic diameter <2.5 µm) was collected at two sampling sites in Shenzhen during the controlled period (when the restrictions were implied) and during the uncontrolled period (when the restrictions were released). A previous study had evaluated the impact of emission controls and traffic intervention measures during the 29th Olympic and Paralympics games in Beijing [27], where significant reductions in vehicle emissions and ambient traffic-related air pollutants were observed.
In this study, we employed several chemical and statistical methods to determine the impact of the emission restrictions on PM2.5 and trace elements. We report trace elements as well as water-soluble major ions. For the first time in the region, Pb isotopic ratios, as well as soluble iron oxidation state speciation, are reported. In addition to quantification, we employ principal component analysis (PCA) to determine the source of trace elements, allowing a unique interpretation of the quantitative data.

2. Materials and Methods

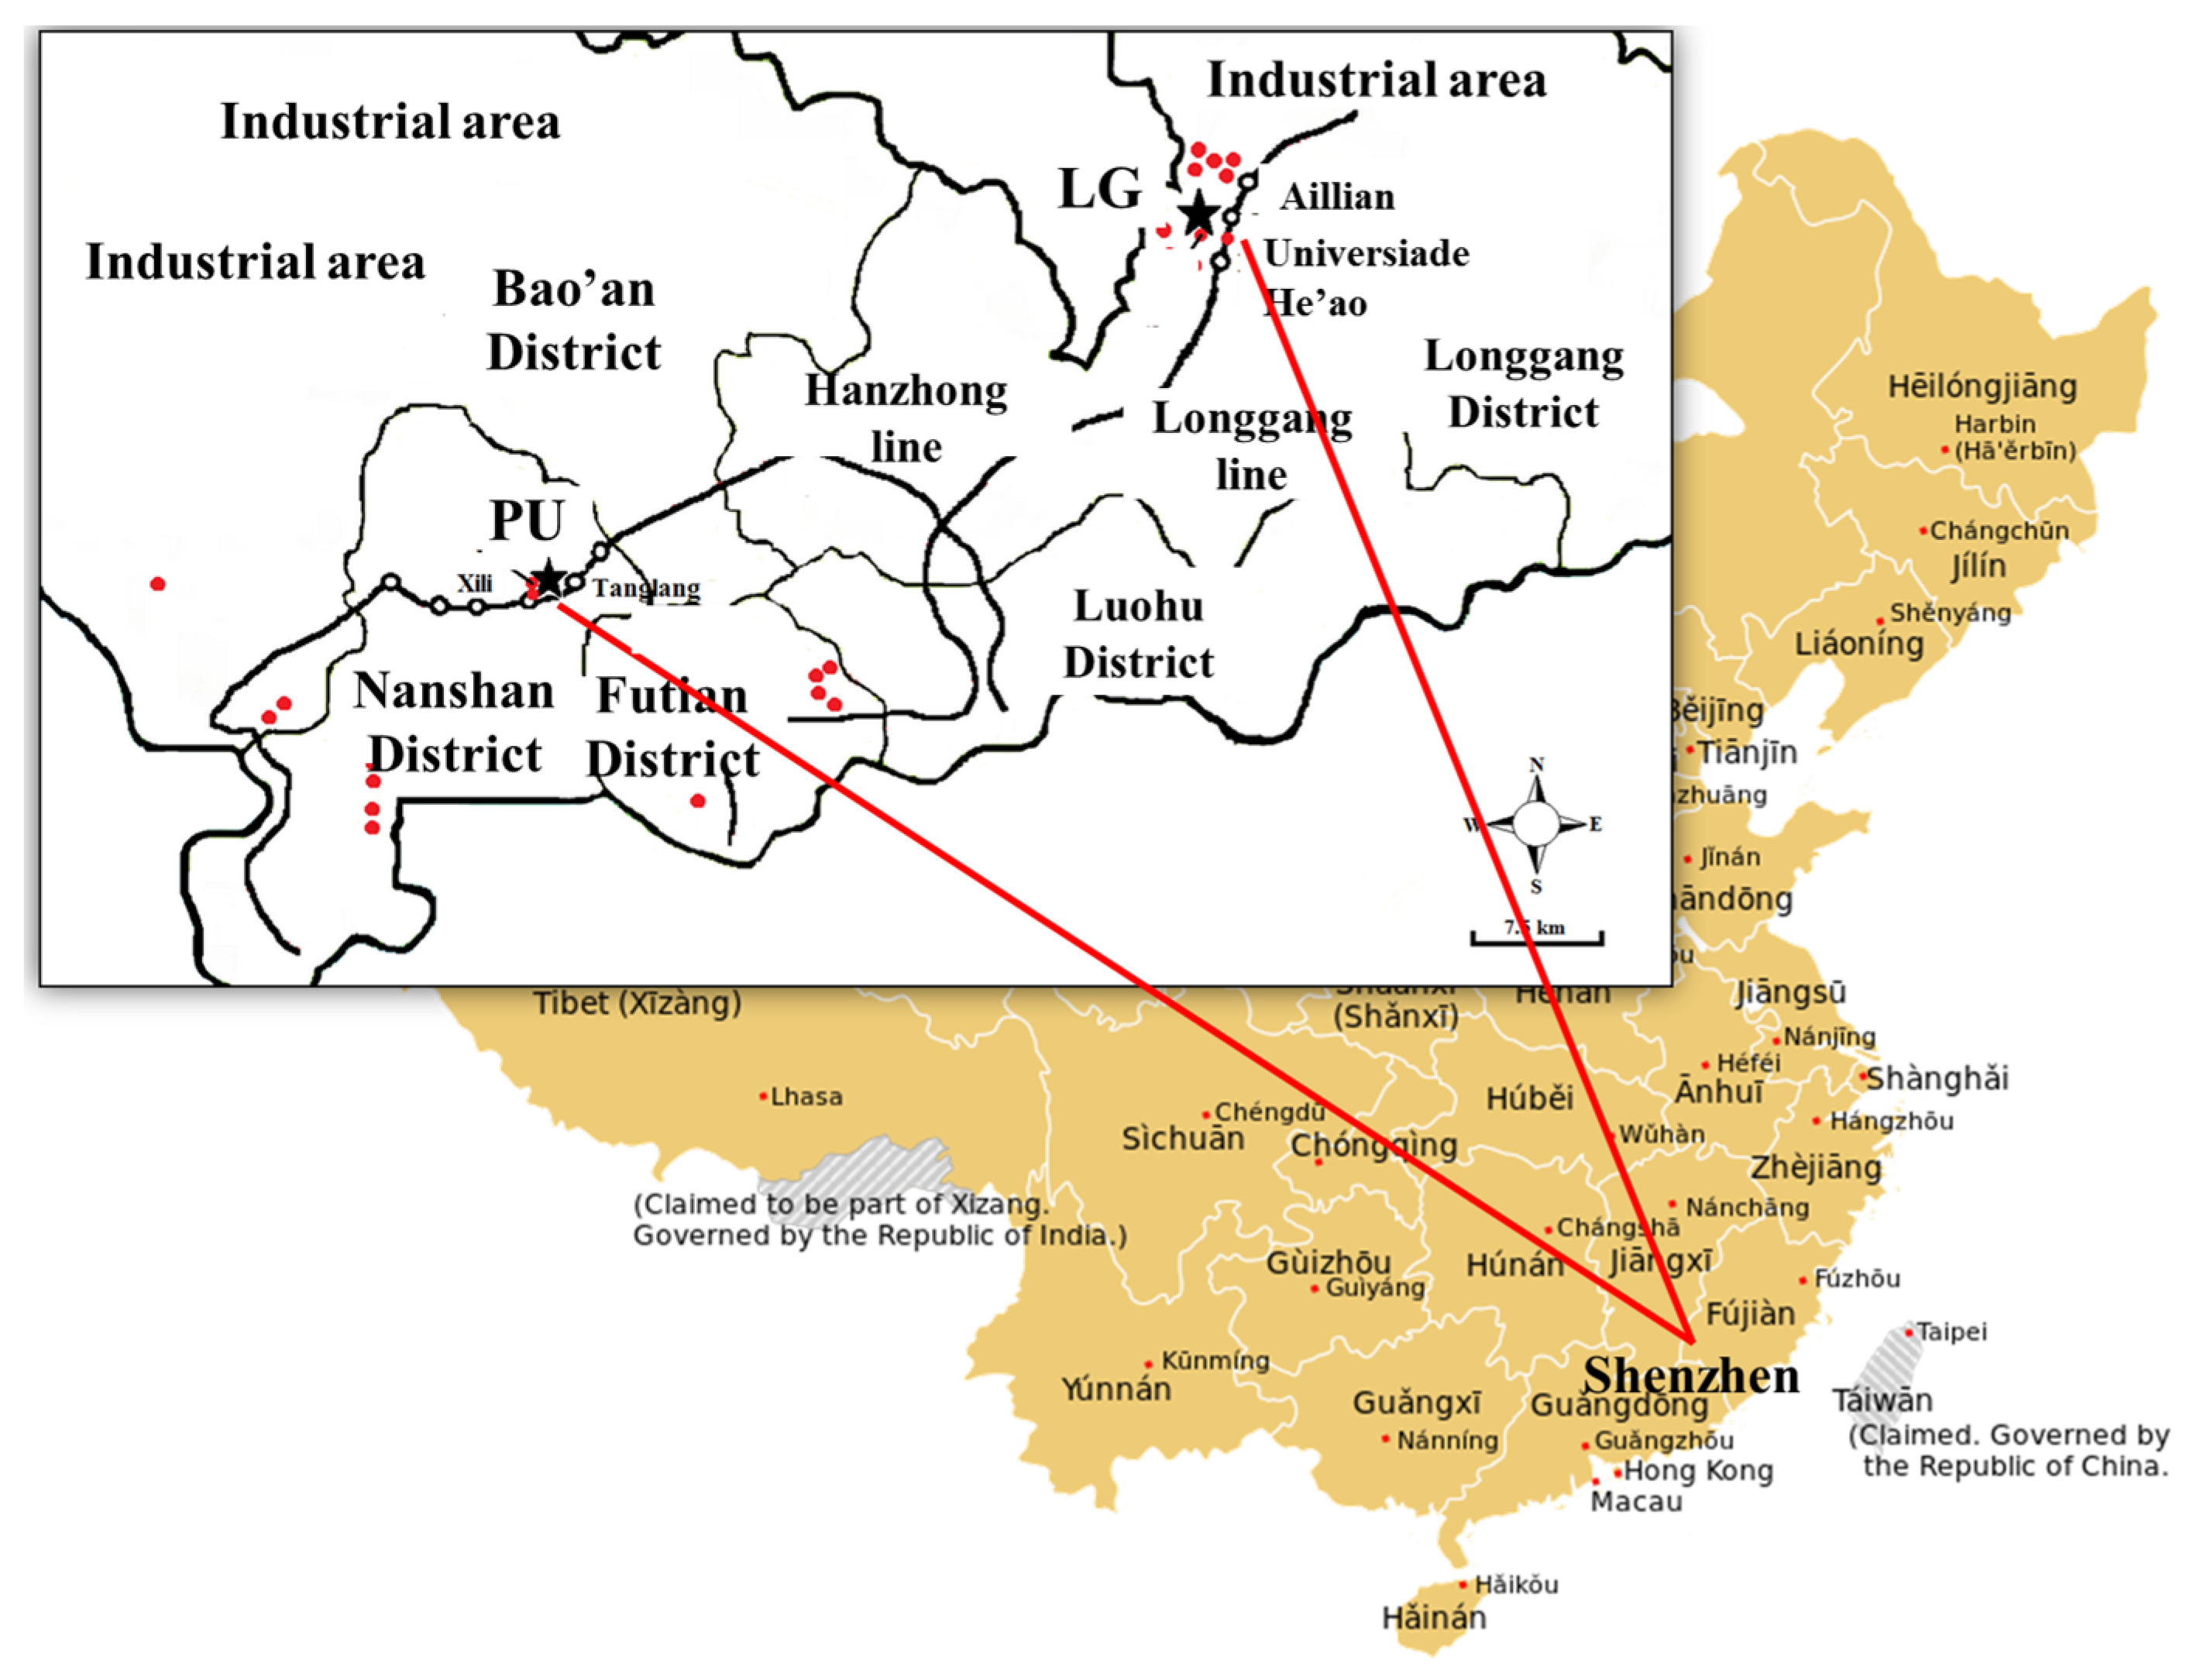
2.1. Sample Collection

Airborne PM2.5 was collected at two sampling sites (LG and PU) in Shenzhen in 2011 both during the controlled period (12 August–23 August) and uncontrolled period (24 August–4 September) of Universiade. The map of the region showing the two sampling sites is shown in Figure 1 [28]. The “LG” site (22.70°N, 114.21°E), about 500 m away from the main venue, is located on top of a 31 floor Lotus residential building in the Longgang District, with significant point sources (e.g., plastic processing plants, glass factories, papermaking and painting industries) nearby. During the controlled periods, these point sources were supposed to be closed. However, we note that there was no accountability and no way of verification. The “PU” site (22.60°N, 113.97°E) is located at the top of Building E of the Peking University Shenzhen Graduate School in the Nanshan District, with no significant point sources around it and about 33 km away from the main venue. The LG site was located at 161 m and the PU site was located at 50 m above ground level, with no major geological features between the sites. The distance between the two sampling sites is about 45 km. A previous study during the same time period at these sites showed that both PM mass and PM composition (EC/OC) were significantly (and similarly) altered when comparing the controlled and uncontrolled periods [26].
Co-located samples were collected on both 47 mm quartz and Teflon filters (Whatman, Pittsburgh, PA, USA) for 24-h from 12 August to 4 September with a flow rate of 21 L·min−1 using dual channel samplers (GUCAS 1.0) [29]. The quartz filters were used for EC/OC analysis following the protocol mentioned in EPA/NIOSH [30] and these results are reported elsewhere [26]. All sample preparation was performed under positive pressure HEPA filtered air. A microbalance (Mettler Toledo AX105DR, Columbus, OH, USA) was used for determination of mass (estimated total uncertainty of ±6 µg). Prior to weighing, the filters were equilibrated in a constant humidity (40% ± 3%) and temperature (20 ± 1 °C) environment for 48 h.
The temperature, pressure, wind directions, and relative humidity were constant during the controlled periods. Based on the 72-h backward HYSPLIT (Hybrid Single Particle Lagrangian Integrated Trajectory) model [31], the air mass was transported from the South Sea at both sampling sites during the controlled periods. During the uncontrolled periods, the wind directions were more variable, but northern winds were more prominent and, based on trajectory analysis, air mass was transported from an industrial zone to both sites. Additional details of the meteorology during this time can be found in a previous manuscript [26]. There were two minor rain events during the controlled and three during the uncontrolled periods, all less than 12 mm. There were no reductions observed in the overall PM mass during those days.

2.2. Total Elemental Analysis

Prior to digestion, the polypropylene ring was removed from the Teflon filter using a ceramic blade. The Teflon filters were digested in sealed, pre-cleaned Teflon digestion bombs in a 30-position Microwave Rotor (Milestone Ethos, Shelton, CT, USA) with trace metal grade acid matrix (Fisher, Waltham, MA, USA) consisting of 1.5 mL of nitric acid (16 M), 750 µL of hydrochloric acid (12 M), 200 µL of hydrofluoric acid (28 M), and 200 µL of 30% hydrogen peroxide. Digestates were diluted to 30 mL with high purity water (>18 MΩcm, MQ) and elemental concentrations (Al, As, Ba, Ca, Cd, Cr, Cu, Fe, K, Mg, Mn, Mo, Na, Ni, Pb, Rb, Sb, Se, Sr, Ti, V, and Zn) were quantified by quadrupole inductively coupled plasma-mass spectrometry (ICP-MS, Agilent 7700, Santa Clara, CA, USA) with indium (In) as an internal standard. The accuracy of the results from the elemental analysis was verified by National Institute of Standards and Technology (NIST) Standard Reference Materials (SRM). The SRMs, San Joaquin Soil (NIST 2709) and Urban Dust (NIST 1649a), were digested and analyzed with every batch of 25 samples. The percent recovery of the reported elements from these SRMs was 85%–120%. Data were also blank-corrected using the average of multiple field filter blanks. Blank concentrations (in µg·L−1) ranged from 0.0041 (2.4% of the total) to 14.65 (5.3% of the total) for the elements during the controlled and uncontrolled periods at the two sampling sites. The uncertainty associated with each element in every sample was calculated from an error propagation analysis, which included uncertainty in the field blanks and in the air flow rates.

2.3. Soluble Ions Analysis

For soluble ion analysis, the Teflon filters were leached in 10 mL high purity water for 2 h. Water-soluble ions were analyzed from the unacidified portion using ion exchange chromatography (Dionex-ICS5000, Bannockburn, IL, USA) followed by a self-regeneration suppressor (model CSR 300 for cations and ASR 300 for anions) and coupled with conductivity detector (Thermo). Cations (NH4+, K+, Na+, and Mg2+) were separated by Dionex IonPac CS12A column and using 20 mM of methanesulfonic acid as a mobile phase at a flowrate of 0.5 mL·min−1. For anions (Cl, NO3, and SO42−), a Dionex IonPac AS22 column was used for separation along with a mixture of 4.5 mM sodium carbonate and 1.4 mM sodium bicarbonate as a mobile phase with a flowrate of 0.5 mL·min−1. A calibration curve of authentic standard (Dionex) for target ions was used to identify and quantify cations and anions in the samples. Details about calibration, method and instrument detection limits, and other measurement parameters have been previously reported [32].

2.4. Iron Oxidation State Analysis

Iron (Fe) speciation analysis was also performed with the water-soluble extracts. 1.8 mL of the soluble extract was mixed with 0.2 mL of 5.88 µM Ferrozine reagent ((3-(2-pyridyl)-5,6-diphenyl-1,2,4-triazine-4’,4”-disulfonic acid sodium salt), Sigma, St. Louis, MO, USA). The absorbance of the Fe(II)–Ferrozine complex was measured at 560 nm using a 1 m liquid waveguide capillary cell spectrophotometer [33,34]. The pH for all water extracts (each site, controlled vs. uncontrolled) ranged between 4.28 and 4.41. This suggests that, despite an unbuffered extract solution, pH effects were not important. The calibration curve generated using known Fe(II)-Ferrozine solutions provided Fe(II) concentration. Soluble Fe(III) was then determined by subtracting total soluble Fe concentration (from ICP-MS) from the soluble Fe(II) concentration.

2.5. Stable Pb Isotope Analysis

Stable Pb isotopic ratios were measured in the digested extracts with no further purification using high-resolution magnetic sector inductively coupled plasma mass spectrometer (MC)-ICP-MS (Thermo-Finnigan Neptune Plus). For the Pb isotope analysis, the digests were evaporated in Teflon vials and diluted to 2 mL using 2% optima grade HNO3 acid (Fisher, Waltham, MA, USA). The Pb content of the digests ranged from 15 to 30 ng. The uncertainties for Pb isotope ratios depended on the isotope system and were in the range of 0.0025 and 0.0034 for 206Pb/204Pb and 207Pb/206Pb, respectively. Analysis of the common Pb isotopic standard (NIST 981) yielded 206Pb/204Pb = 16.937 ± 0.018 (n = 18) and 207Pb/206Pb = 0.9145 ± 0.0001 (n = 17) versus the certified values of 16.944 ± 0.015 and 0.9146 ± 0.0003, respectively.

2.6. Principal Component Analysis (PCA)

To identify the potential origin of the elements in PM2.5, PCA was conducted using SPSS statistical software (SPSS, version 22). A varimax rotation was employed for interpretation of the principal components and factors with eigenvalues greater than unity were retained in the analysis [35]. Given that the bulk properties, Pb isotope ratios, and elements trends were similar at each site, it is clear that similar sources affect each site. Therefore, the sites were grouped together for the PCA analysis. Prior to conducting factor analysis, we performed a Pearson correlation matrix of 52 samples collected at two sampling sites during controlled and uncontrolled periods. Based on correlations matrix, we had a total of 26 samples with OC [26], 8 elements, and 6 ions as variables, resulting in a sample/variable ratio consistent with recommended criteria for a robust PCA analysis with KMO test of sampling adequacy >0.5 [36]. In addition, the significance value (0.000) for Bartlett’s test of sphericity indicates that the correlations are appropriate for this data set.

3. Results and Discussion

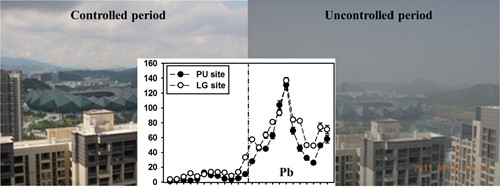
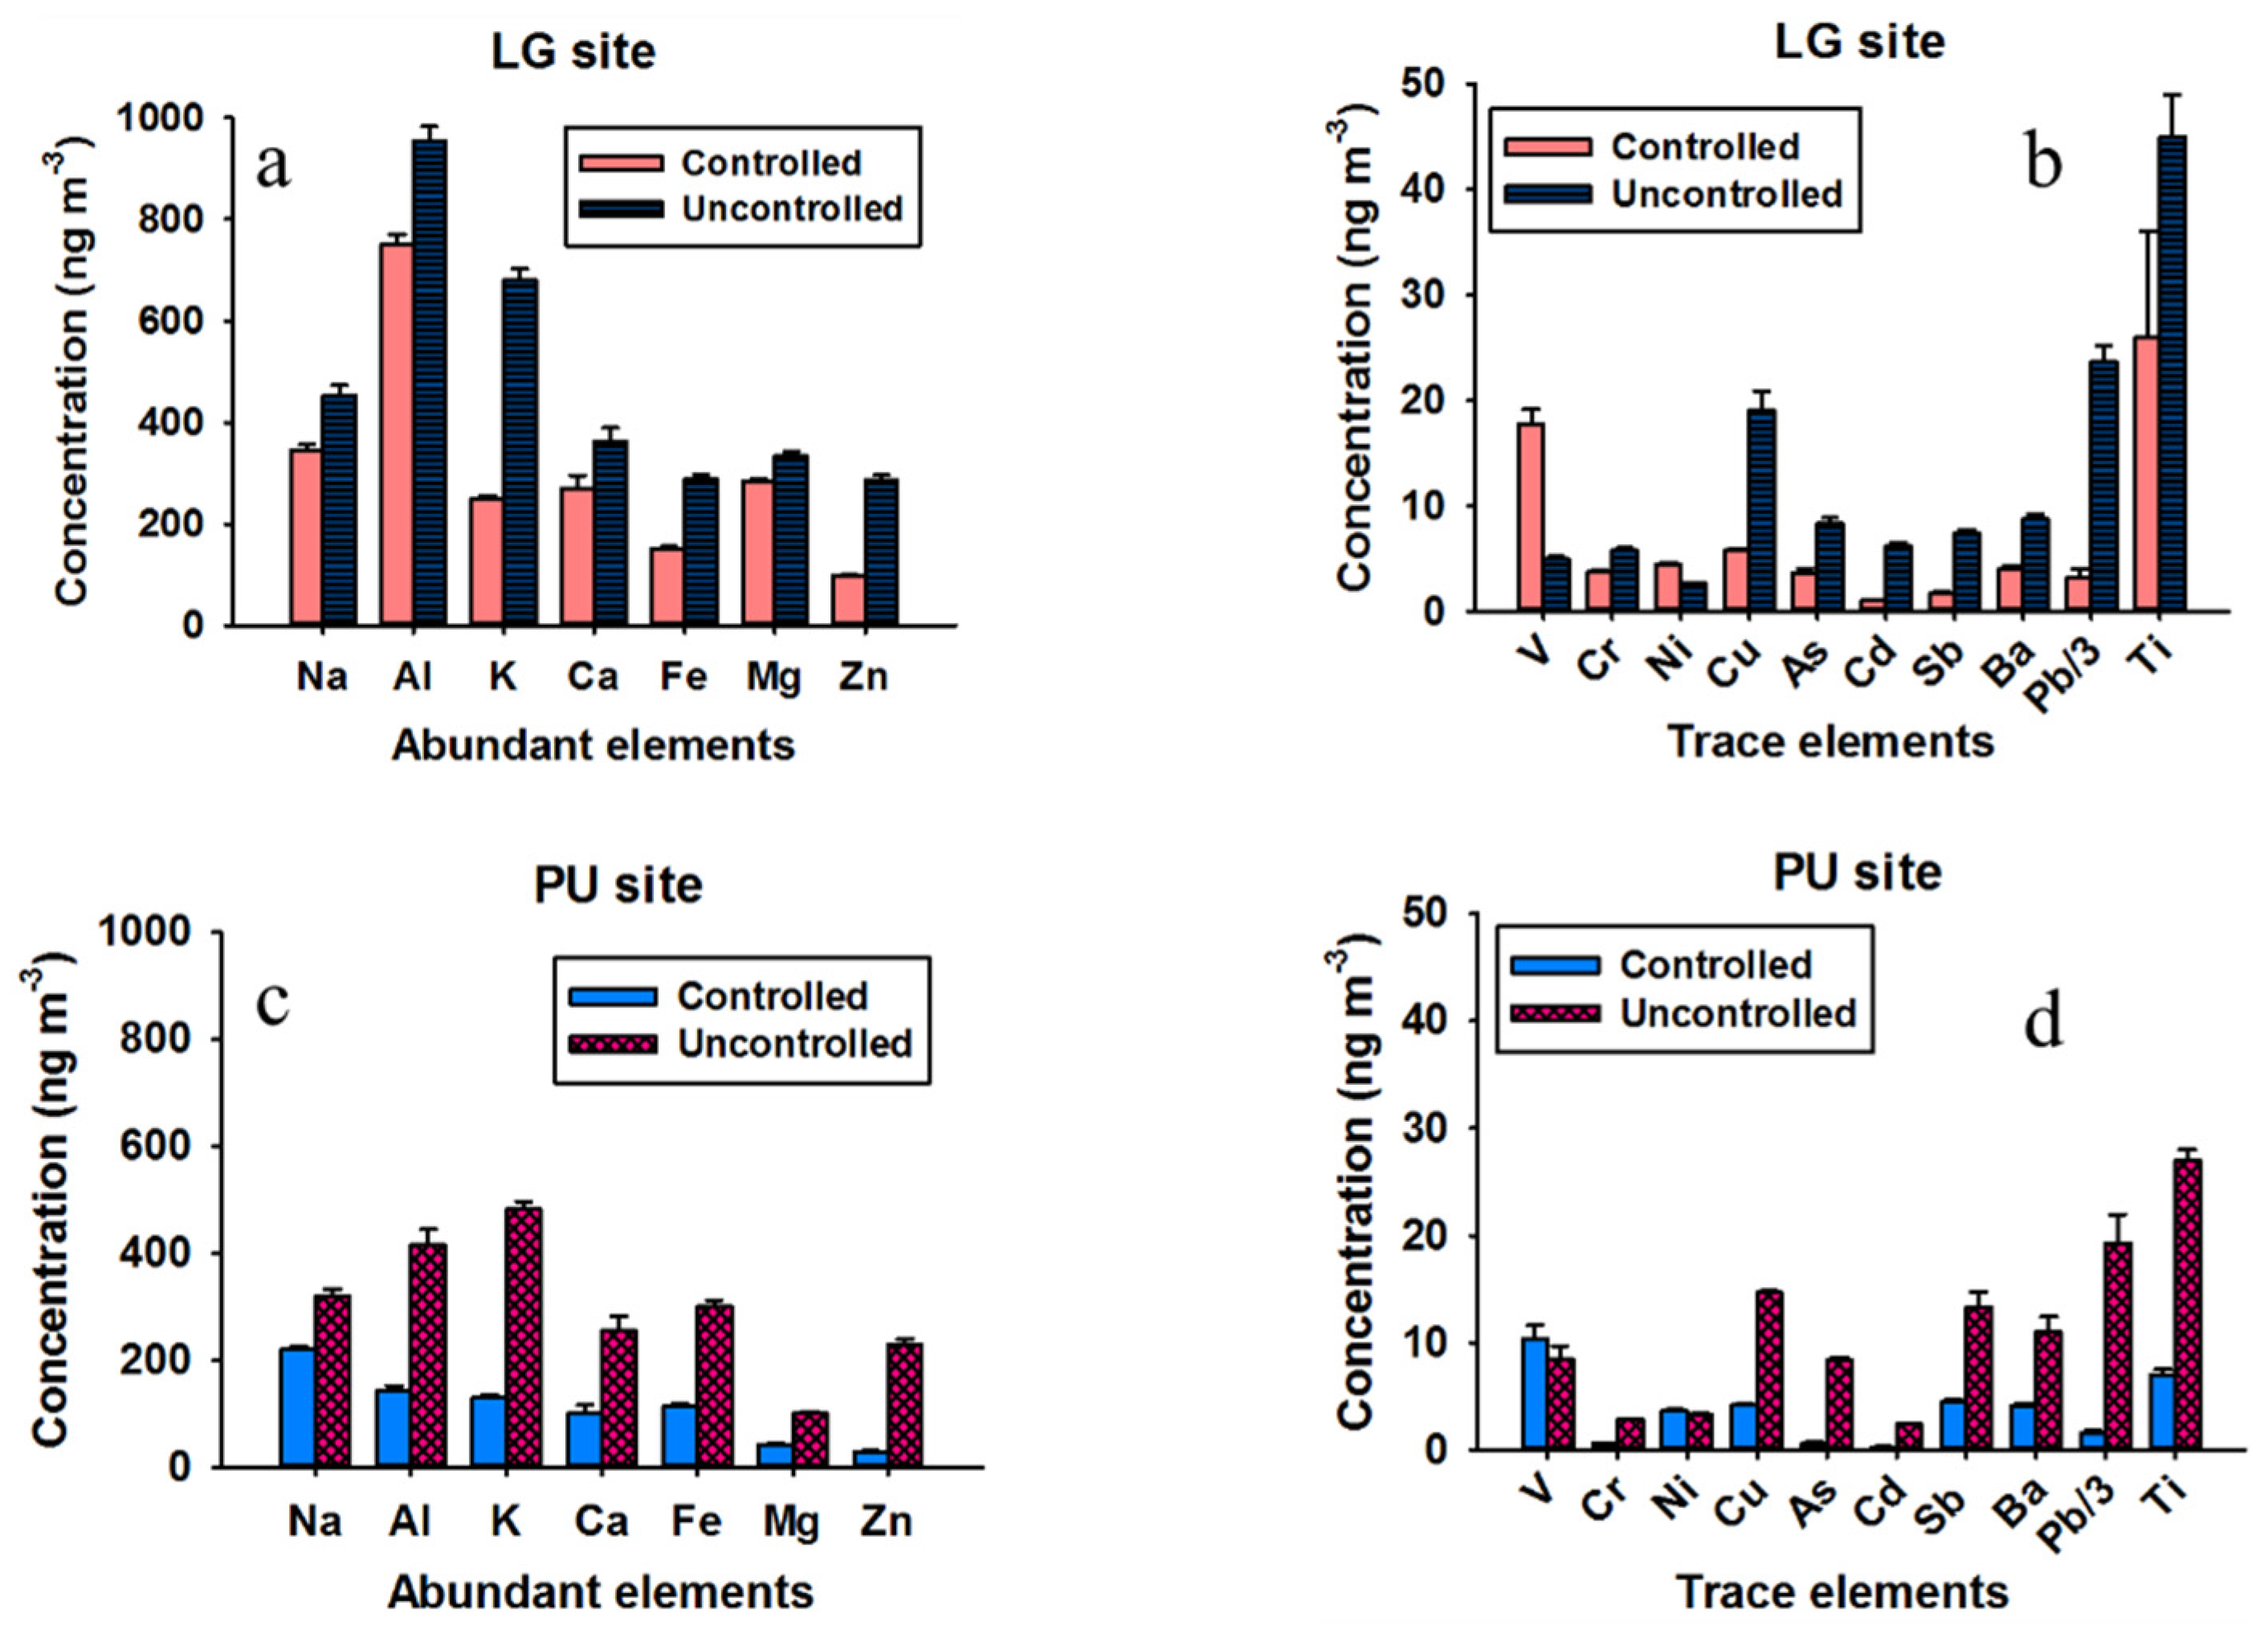
3.1. Trace Element Concentrations

One previous study [26] has shown that during the controlled periods, the monitored PM2.5 mass concentrations were 12.9 ± 3.7 μg·m−3 at the PU site and 25.2 ± 5.2 μg·m−3 at the LG site. During uncontrolled periods, significant increases in the PM2.5 mass concentrations were observed (PU = 48.0 ± 8.7 μg·m−3 and LG = 54.0 ± 6.5 μg·m−3). The fact that the wind directions were drastically different during controlled and uncontrolled periods complicate the effects of the controls and this may be another reason why such drastic differences in PM were observed between the two periods. Consistent with the increased PM mass, results from our study showed an increase in the concentrations of most abundant and trace elements in PM2.5 collected at the PU and LG sites during uncontrolled periods (Figure 2a–d). For instance, average Ca and Fe concentrations were ~360 (range, 264–467) and ~290 (range, 216–412) ng·m−3, respectively, during uncontrolled periods and ~270 (range, 169–340) and ~152 (range, 90–352) ng·m−3 during controlled periods at the LG site. Similarly, at the PU site, average Ca and Fe concentrations were ~250 (range, 114–469) and ~300 (range, 201–588) ng·m−3, respectively, during uncontrolled periods and ~100 (range, 29–160) and ~115 ng·m−3 (range, 55–169) during controlled periods. The elemental analysis showed that both Al and K were the dominant elements at both sampling sites. Also, all trace elements, except Ni and V, had higher concentrations during uncontrolled periods at both sites. Both Ni and V are markers for the residual oil combustion, which suggests that oil combustion sources were essentially unaffected by the controls. The significant increase in V during the controlled periods could be attributed to emissions from ships around the Shenzhen city, however this is speculation as reliable data regarding the ship traffic are not available. There were no large scale oil power generation plants [37]. Therefore, control of oil combustion sources was likely very challenging, since all of these sources were probably small. Some striking differences include an approximate eleven-fold increase for Pb and an eight-fold difference for Zn for PM2.5 during uncontrolled periods at the PU site. Similarly, an approximate eight-fold difference was observed in the concentrations of Pb and a three-fold difference for Zn during uncontrolled periods at the LG site. Overall, the concentrations of most of the elements were higher at the LG site relative to the PU site. This may be because the LG site is close to significant point sources.
Water-soluble ions were quantified in the PM2.5 collected at the two sampling sites during controlled and uncontrolled periods and are presented in Figure 3. Elevated levels of SO42− were observed in PM2.5 during uncontrolled periods at both sites. Sources like coal power plants and industries may be playing an important role in the emissions of sulfur dioxide, which leads to sulfate. NO3/SO42− ratio can be used as an indicator of the type of anthropogenic activity [38]. If the ratio is >1, it indicates greater NOx emissions, indicating vehicular emissions are likely dominant. If the ratio is <1, it indicates greater SO2 emissions, and that stationary sources are dominant [38,39]. The average ratio at the PU site was 0.071 ± 0.003 and 0.12 ± 0.02 during controlled and uncontrolled periods respectively, whereas the average ratio at the LG site was 0.15 ± 0.01 and 0.13 ± 0.01 during controlled and uncontrolled periods, respectively. At the two sampling sites, both during controlled and uncontrolled periods, the ratio is lower than 1, indicating that stationary sources like industry emissions and power plants are important contributors to PM2.5 emissions in Shenzhen.

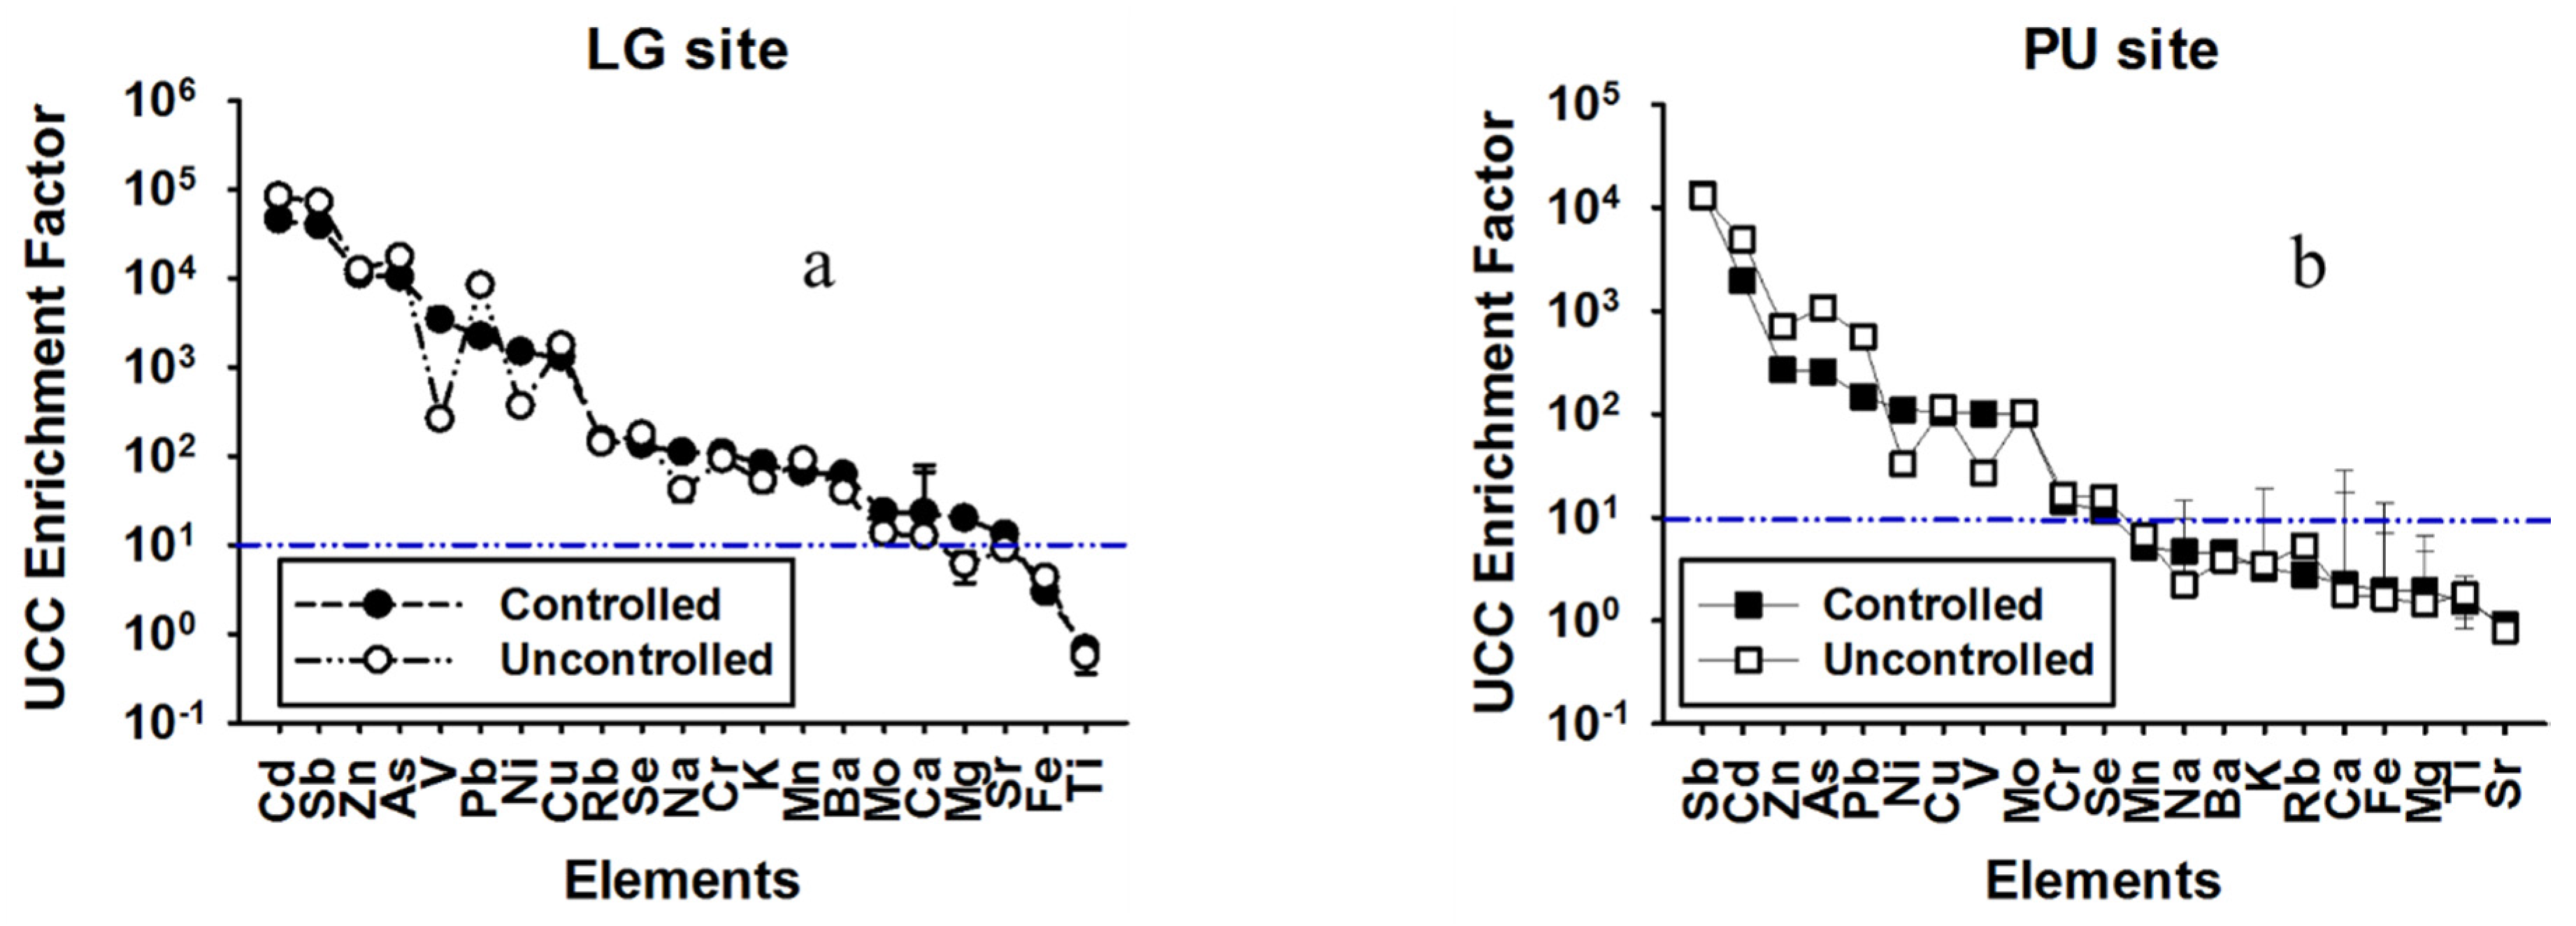
3.2. Crustal Enrichment Factors

Enrichment factors (EF) are used to assess whether the elements have a major crustal component [40]. EF of the elements was calculated by first normalizing the measured elemental concentrations in the sample with aluminum (Al), and then dividing by the Upper Continental Crust (UCC) ratio [41,42]. EF is calculated using the following formula:
EF element = ( Concentration of element in sample /   Concentration of Al in sample ) ( Concentration of element in crust  /  Concentration of Al in crust )
EF is close to unity for the elements related to the reference, Al (marker for crustal emissions). A high EF (>>10) suggests that particular elements are enriched relative to the crust and thus are anthropogenically derived [43]. The dashed line (EF = 10) on the plots shown in Figure 4a,b represents the level above which the element is considered to have a major anthropogenic source. The error bar represents the standard deviation of the 13 samples each during the controlled and uncontrolled periods at the two sites. The dots represent the average EF of the 13 samples for each element.
As observed in Figure 4, almost every measured element appears to have some anthropogenic source at the LG site. Conversely, at the PU site, mainly the industrially-sourced elements have high EF. Specifically, As, Cd, Cr, Cu, Ni, Pb, Sb, Se, Pb, V, and Zn, as well as K and Na were highly enriched at the LG site during both the controlled and uncontrolled periods (Figure 4a). Similarly, the elements As, Cd, Cr, Cu, Mo, Ni, Pb, Sb, Se, Pb, V, and Zn were associated with an anthropogenic source at the PU site during both the controlled and uncontrolled periods (Figure 4b). The fact that these elements are highly enriched is consistent with many other studies in urban areas [44,45]. It is also important to note that, while the concentrations were increased during uncontrolled periods, the EF essentially did not change. Significant differences in EF, however, were observed between the two sites.

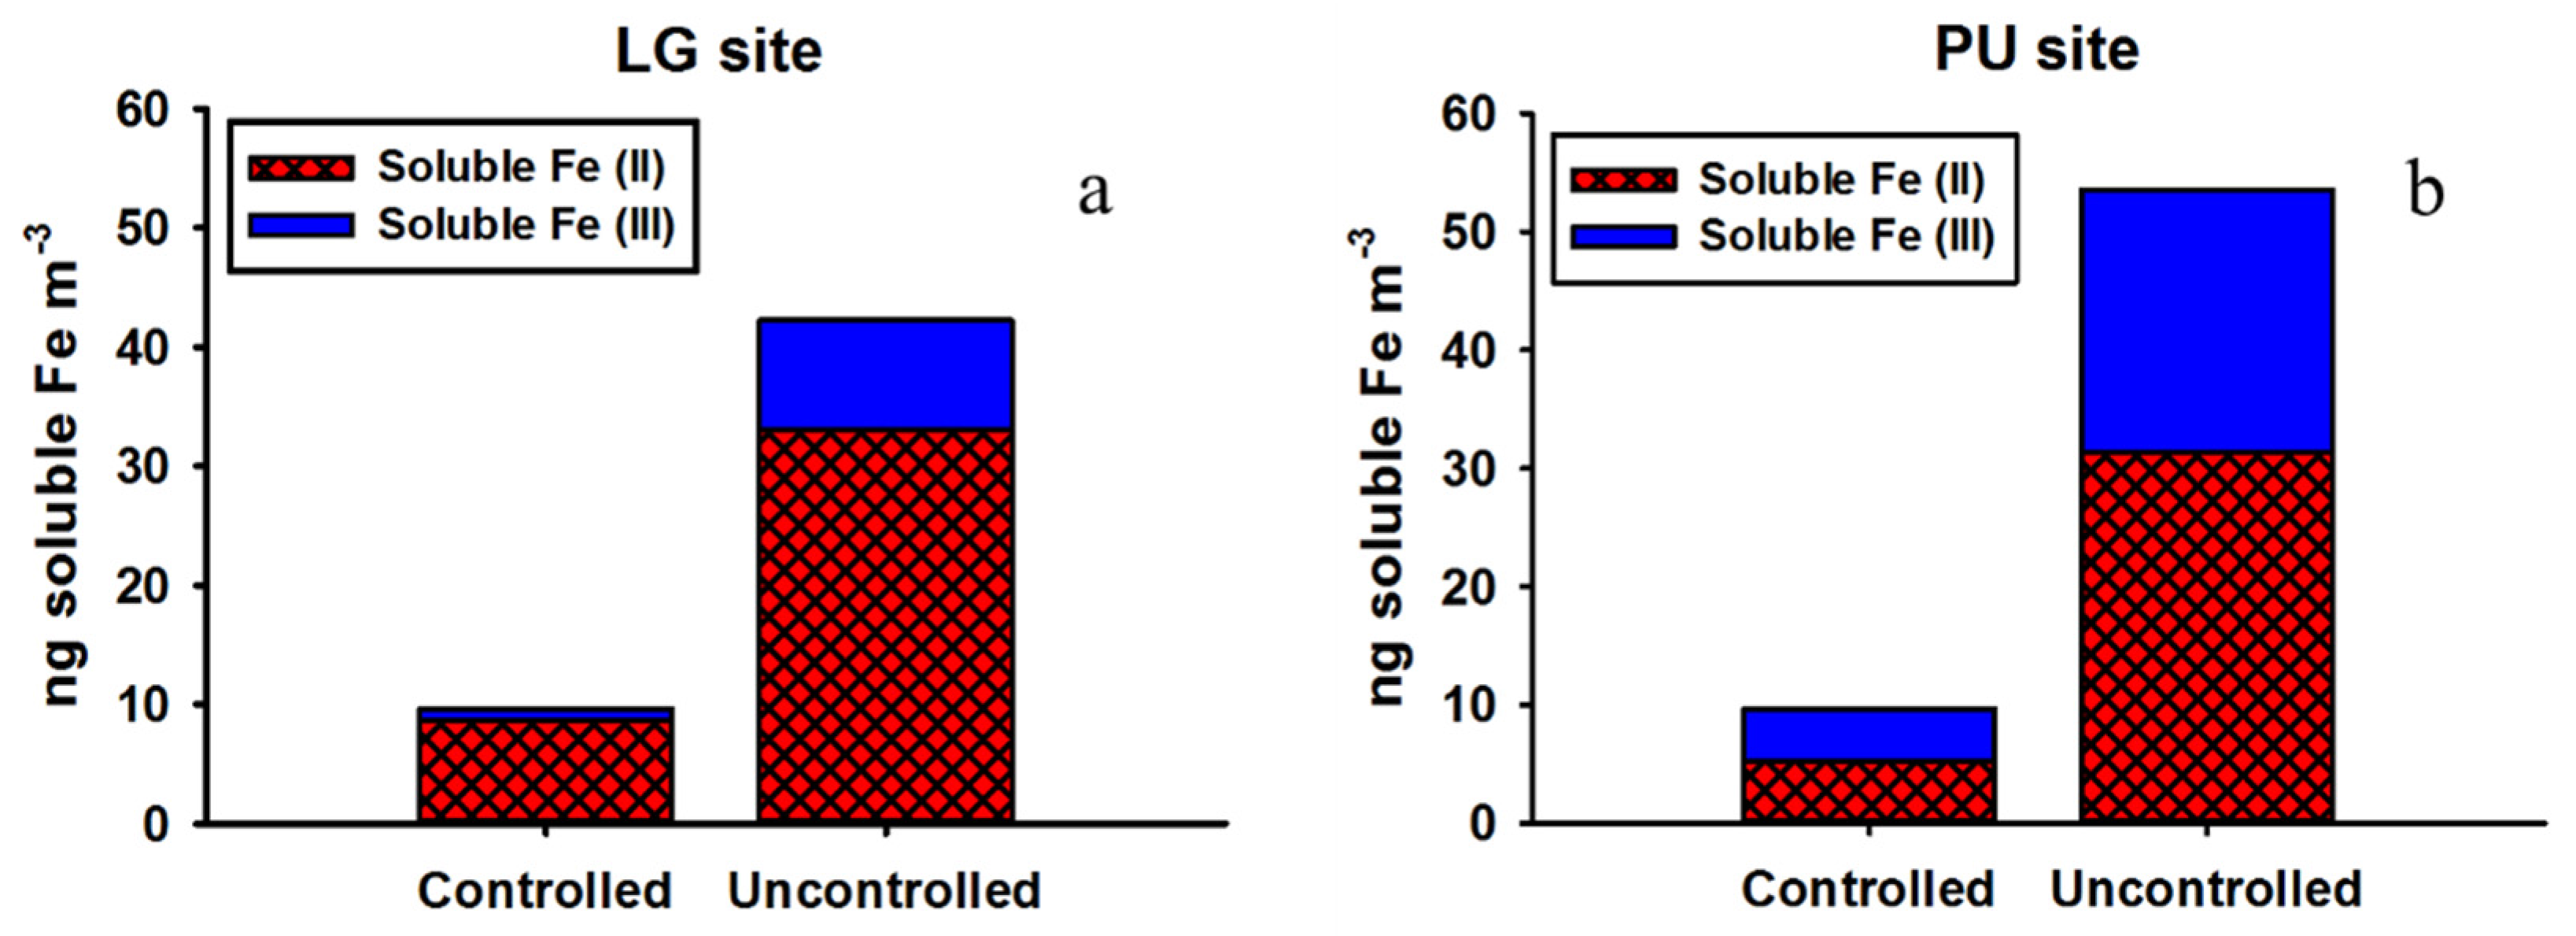
3.3. Soluble Fe Oxidation State Analysis

As most atmospheric Fe is crustally-derived, Fe(III) dominates the major part of total iron in the PM but its relative importance also depends on local sources and the size fraction [46]. For example, crustal Fe is primarily in the Fe(III) oxidation state and shows a solubility of <1% [47], while ambient urban Fe shows solubility ~10%–20%, with a mixture of Fe(II) and Fe(III) [46], and Fe emitted directly from vehicles has been shown to be up to 70% water-soluble, being mostly Fe(II) sulfate [48]. Consequently, different locations exhibit different Fe solubility, depending on the dominant sources [46]. Our study shows Fe solubility of 7% and 15% during the controlled and uncontrolled periods, consistent with other urban sources. The oxidation state of the soluble Fe is shown in Figure 5. The majority of the soluble fraction was comprised of Fe(II) at the two sites both during controlled and uncontrolled periods. As Fe(III) is the dominant form of soluble Fe under oxidizing conditions [49], this implies that the PM contained other compounds which allowed the Fe to be stabilized in the reduced state. Possibilities include small chain organic acids, or even polycyclic aromatic hydrocarbons [50,51,52].
At the LG site, the percent soluble Fe(II) of total iron collected on the filter was 5.9% during controlled periods and 12.2% during uncontrolled periods. Similarly, at the PU site, the percent soluble Fe(II) of total iron collected on the filter was 5.4% during controlled periods and 12.6% during uncontrolled periods. Of the soluble Fe, Fe(II) was 82% during controlled periods and 86% during uncontrolled periods at the LG site. Similarly, at the PU site, Fe(II) was 56% of the total soluble, during controlled periods and 61% during uncontrolled periods. Significant differences in relative Fe(II)/Fe(III) solubility between the PU and LG site indicates different sources between sites. However, similarities in Fe(II)/Fe(III) solubility at each site suggest that the sources are similar during the controlled and uncontrolled periods.

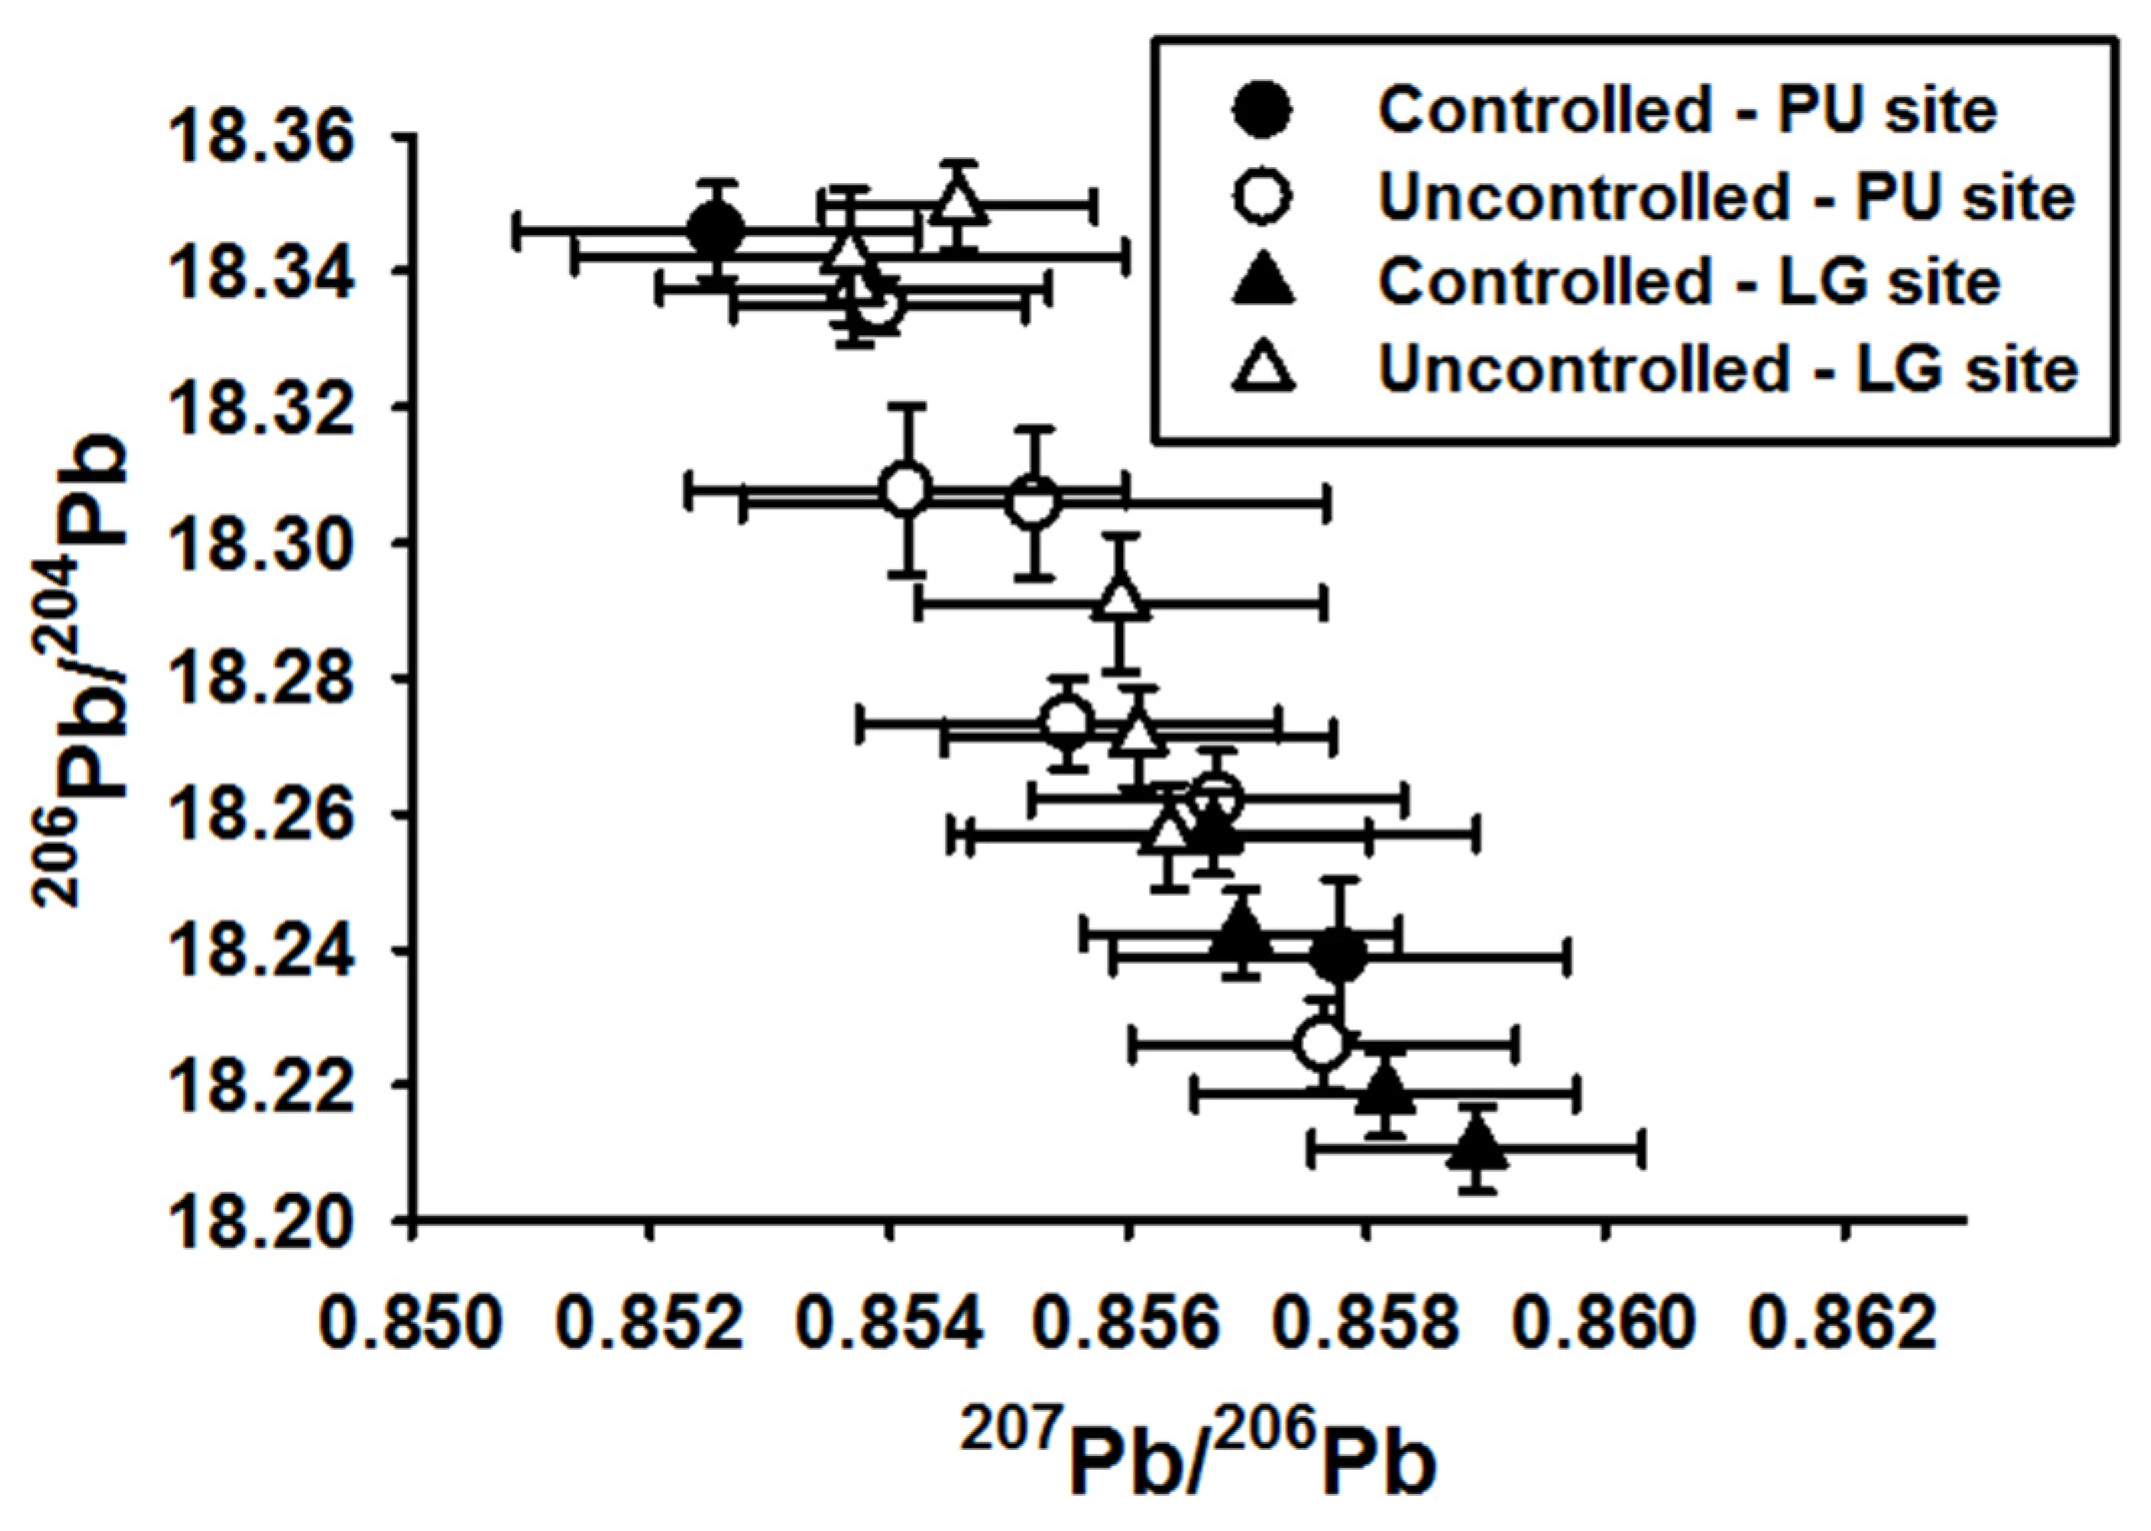
3.4. Stable Pb Isotope Ratios

Anthropogenic activities like mining, industry, and utilization of fossil fuels and tetraethyl lead in gasoline significantly affect the Pb levels in the environment to varying degrees. In this study, the greatest differences in elemental concentrations were Pb (Figure 2). Thus, we focus on Pb isotope ratios to help determine if its origin was different during controlled and uncontrolled periods. Pb has four stable isotopes; 204Pb, 206Pb, 207Pb, and 208Pb with the radioactive decay of 238U, 235U, and 232Th eventually producing 206Pb, 207Pb, and 208Pb, respectively. Depending on the geological history, different sources of Pb possess specific Pb isotopic signatures and these ratios do not fractionate during any chemical, physical, or biological process [53]. Therefore, Pb isotopic ratios are useful in distinguishing natural Pb from anthropogenic Pb and its origin in different ecosystems [53,54]. Stable Pb isotope ratios (207Pb/206Pb) in the range 0.7952–0.8405 can be used as a tracer species to identify natural sources of PM whereas, 207Pb/206Pb ratio in the range of 0.8504–0.9651 can be used to identify anthropogenic sources contributing to airborne PM [55,56].
Ratios of 207Pb/206Pb versus 206Pb/204Pb are presented in Figure 6 for the airborne PM2.5 collected at the PU and LG sites during controlled and uncontrolled periods, with these ratios depending on local geology, rainfall, wind direction, and traffic [57,58]. The average 207Pb/206Pb ratios of the PM2.5 collected at the LG site during the controlled and uncontrolled periods are 0.8599 (range, 0.8567–0.8590) and 0.8550 (range, 0.8536–0.8563), respectively. Similarly, at the PU site, the average 207Pb/206Pb ratios during the controlled and uncontrolled periods are 0.8564 (range, 0.8525–0.8591) and 0.8567 (range, 0.8539–0.8576), respectively. These ratios suggest that PM2.5 has an anthropogenic Pb source [55], which is also in agreement with the high UCC EF. The 206Pb/204Pb ratios at the PU and the LG sites during the controlled and uncontrolled periods were similar (t-test, p < 0.05), indicating similar Pb sources. The 206Pb/204Pb ratios between the two sites during the controlled and uncontrolled periods were also similar (t-test, p < 0.05).
Industry emissions, coal combustion, and vehicle exhaust are considered to be the three main sources of Pb pollution in China [59,60]. Previous studies have determined the 207Pb/206Pb ratios ranging from 0.850 to 0.872 for wide varieties of Chinese coal [61]. Leaded gasoline, which was phased out in the early 1990s [62], showed an average 207Pb/206Pb ratio of 0.901, whereas unleaded exhaust showed the ratio of 0.872 in the PRD region [63]. The average ratio of 206Pb/204Pb observed for coal combustion and cement factories in Beijing ware 18.09 (range, 17.873–18.326) and 18.05 (range, 17.729–18.365), respectively [62]. There are about 26 coal power plants located in Guangdong Province, China [37]. Shenzhen is a major city in the Guangdong Province. These power plants are within 97 km of the sampling sites. A map of these power plants relative to the sampling sites is shown in Figure S1. Overall, the PM2.5 Pb ratios are similar to the Pb ratios observed for coal varieties, which implies that coal combustion may be the primary Pb source(s) between the sampling sites in this study and the previous study [61]. In addition, the Pb isotope ratios were significantly similar at each site during both controlled and uncontrolled periods. This suggests that local and regional sources affect these two sites in a similar manner.

3.5. Source Identification Using Principal Component Analysis

PCA was used to identify major sources of PM2.5. The results of the PCA for the combination of the two sites during controlled periods and uncontrolled periods are presented in the supplemental information (Tables S1 and S2). There were three factors contributing to the PM2.5 in Shenzhen during controlled periods whereas five factors were present during uncontrolled periods at the two sites. The difference in reported factors between two periods is determined on the basis of inflection point in the scree plots and, we have selected the interpretable factors.
At the two sampling sites, during controlled periods, the first principal component has elevated loadings of Pb, Zn, K+, Al, Na+, Se, and OC, as shown in Table S1. The major sources of PM2.5 are categorized in several groups and these are: coal combustion (Se and Pb), biomass burning (K+ and OC), and vehicular abrasion (Zn and Sb) [3,23,64]. Therefore, we associate this factor with a mixture of combustion sources. We also note a potentially confounding correlation between Al and Se (r2 = 0.858), which is present at both sites and during both the controlled and uncontrolled periods. For the second factor, characteristic values for V and Ni are the highest, which are tracers of heavy oil combustion [65]. Apart from oil-fired power plants and industries, ship emissions may be a prominent source of such combustion in Shenzhen [66]. Also, the second factor has prominent values for NH4+ and SO42−, indicating the presence of secondary inorganic aerosols [67]. Sulfur dioxide would be emitted along with Ni and V during oil combustion. The third factor has high loadings of Mg2+, Na+, NH4+ SO42−, and Cl, signifying this source was chiefly associated with partially aged sea salt [23], which is consistent with the fact that Shenzhen is a coastal city.
Table S2 represents the sources during the uncontrolled periods at the PU and LG sites. The first principal component shows high loadings of NH4+, SO42−, and Sb, which are associated with secondary inorganic aerosols and potentially brake wear [68]. The second factor has elevated Al, Se, and K+. Al is marker of crustal emissions and Se and K+ are associated with coal combustion and biomass burning, respectively. Therefore, second factor is undetermined. High values of Na+, Mg2+, and Cl are associated with sea salt spray for the third factor indicating that sea spray is a contributing factor to PM2.5 in Shenzhen regardless of wind direction. The fourth factor shows high values of V and Ni, which are tracers of heavy oil combustion emissions. The fifth factor has high values of Pb and OC, which is associated with combustion emission sources containing Pb. This is consistent with the Pb isotope data that the source of Pb is similar at the two sites during controlled and uncontrolled periods.

4. Conclusions

The results of this study provide insights into the effects of pollution restrictions in Shenzhen, China. The average PM2.5 concentrations at the PU and LG sites during controlled periods were lower than 24-h mean ambient air quality standard of People’s Republic of China of 75 µg·m−3 [25]. Surprisingly, both Ni and V, markers for the residual oil combustion, had lower concentrations relative to other trace elements during uncontrolled periods at the two sampling sites, suggesting that oil combustion emissions were not controlled at all by the restrictions imposed during the Universiade event.
While it is possible that the soluble Fe(II)/Fe(III) ratio depends, to some extent, on the original Fe phases present in the PM, the equilibrium speciation in solution is primarily dependent on the immediate redox environment in the extract solution [49]. Thus, the presence of source-specific organic compounds [50] and ions [69] are the major determinants of Fe speciation and solubility. While this is the first study to measure Fe speciation and solubility in airborne PM2.5 in Shenzhen, China, it possesses similarities to previous Fe speciation studies. For instance, at the PU site, soluble Fe(II) and soluble Fe(III) were approximately equal, which was similar to the percentage of soluble Fe(II) at Waukesha, WI, USA [46]. Similarly, at the LG site, soluble Fe(II) was far greater than soluble Fe(III), which was similar to the results reported for Los Angeles, CA, USA [46] and Denver, CO, USA [70].
The 206Pb/204Pb ratios measured at the two sites during the controlled and uncontrolled periods, and between the two sites during the controlled and uncontrolled periods, were similar (t-test, p < 0.05), representing a common anthropogenic Pb source. This suggests that airborne PM2.5 is dominated by local or regional combustion sources (as evidenced by the high EF), which was in agreement with the principal component analysis.
Previous studies have presented elemental and water-soluble ion concentrations for airborne PM2.5 in southwest China [1,3]. The source apportionment based on positive matrix factorization (PMF) and chemical mass balances (CMB) revealed that coal combustion, secondary inorganic aerosols, biomass burning, metal industries, crustal dust, and sea spray were common sources in southwest China. The impact of control measures implemented before and during 2008 Olympics in Beijing showed 33% reduction in BC emissions [27] and controls implemented during the Universiade showed 30% reduction in traffic [71,72] and 50% reduction in PM2.5 [26]. Although the relative importance of each component varied, the major sources at the two sites during controlled and uncontrolled periods were identified as residual oil combustion, secondary inorganic aerosols, combustion, and sea spray which is also in agreement with the previous studies.
In our study, however, every metric was consistent (e.g., Pb isotopes, PM mass trends, EC/OC trends, and individual element trends) between sites. The PM2.5 levels in Shenzhen were mainly dominated by anthropogenic emissions. Reductions in emissions from point sources were observed, but it is unclear if this was due to the restrictions or from changes in meteorological conditions.

Supplementary Materials

The following are available online at https://www.mdpi.com/2073-4433/7/4/57/s1, Figure S1: Map showing the location of the PU and LG sampling sites (shown as red stars) relative to the location of power plants in Guangdong Province; Table S1: Principal component loadings of selected elements and ions for PU and LG sites during controlled periods; Table S2: Principal component loadings of selected elements and ions for PU and LG sites during uncontrolled periods.

Acknowledgments

The authors thank Elizabeth Stone and Ibrahim Al-Naghemah for their help and guidance in water soluble ion measurements. We also thank Kate Smith at the Wisconsin State Lab of Hygiene for her assistance with the Pb isotopic ratios measurement. This study was supported by the National Natural Science Foundation of China (Grant No. 41375131 and 21307129) and the Key Research Program of Chinese Academy of Sciences (Grant No. KJZD-EW-TZ-G06-01-0). We thank the anonymous reviewers for their helpful input to improve the paper.

Author Contributions

For research articles with several authors, a short paragraph specifying their individual contributions must be provided. All authors conceived and designed the experiments; all authors performed the experiments; Nitika Dewan and Brian J. Majestic analyzed the data; all authors contributed reagents/materials/analysis tools; Nitika Dewan and Brian J. Majestic wrote the paper.” Authorship must be limited to those who have contributed substantially to the work reported.

Conflicts of Interest

The authors declare no conflict of interest.

References

  1. Hagler, G.S.; Bergin, M.H.; Salmon, L.G.; Yu, J.Z.; Wan, E.C.H.; Zheng, M.; Zeng, L.M.; Kiang, C.S.; Zhang, Y.H.; Lau, A.K.H.; et al. Source areas and chemical composition of fine particulate matter in the Pearl River Delta region of China. Atmos. Environ. 2006, 40, 3802–3815. [Google Scholar] [CrossRef]
  2. Yang, F.; Tan, J.; Zhao, Q.; Du, Z.; He, K.; Ma, Y.; Duan, F.; Chen, G.; Zhao, Q. Characteristics of PM2.5 speciation in representative megacities and across China. Atmos. Chem. Phys. 2011, 11, 5207–5219. [Google Scholar] [CrossRef]
  3. Tao, J.; Gao, J.; Zhang, L.; Zhang, R.; Che, H.; Zhang, Z.; Lin, Z.; Jing, J.; Cao, J.; Hsu, S.C. PM2.5 pollution in a megacity of southwest China: Source apportionment and implication. Atmos. Chem. Phys. 2014, 14, 8679–8699. [Google Scholar] [CrossRef]
  4. Dockery, D.W.; Pope, C.A.; Xu, X.; Spengler, J.D.; Ware, J.H.; Fay, M.E.; Ferris, B.G., Jr.; Speizer, F.E. An association between air pollution and mortality in six U.S. cities. N. Engl. J. Med. 1993, 329, 1753–1759. [Google Scholar] [CrossRef] [PubMed]
  5. Englert, N. Fine particles and human health—A review of epidemiological studies. Toxicol Lett. 2004, 149, 235–242. [Google Scholar] [CrossRef] [PubMed]
  6. Davidson, C.I.; Phalen, R.F.; Solomon, P.A. Airborne particulate matter and human health: A review. Aerosol. Sci. Tech. 2005, 39, 737–749. [Google Scholar] [CrossRef]
  7. Charlson, R.J.; Schwartz, S.E.; Hales, J.M.; Cess, R.D.; Coakley, J.A., Jr.; Hansen, J.E.; Hofmann, D.J. Climate forcing by anthropogenic aerosols. Science 1992, 255, 423–430. [Google Scholar] [CrossRef] [PubMed]
  8. Lee, Y.L.; Sequeira, R. Water-soluble aerosol and visibility degradation in Hong Kong during autumn and early winter, 1998. Environ. Pollut. 2002, 116, 225–233. [Google Scholar] [CrossRef]
  9. Deng, X.J.; Tie, X.X.; Wu, D.; Zhou, X.J.; Bi, X.Y.; Tan, H.B.; Li, F.; Hang, C.L. Long-term trend of visibility and its characterizations in the Pearl River Delta (PRD) region, China. Atmos. Environ. 2008, 42, 1424–1435. [Google Scholar] [CrossRef]
  10. Chameides, W.L.; Yu, H.; Liu, S.C.; Bergin, M.; Zhou, X.; Mearns, L.; Wang, G.; Kiang, C.S.; Saylor, R.D.; Luo, C.; et al. Case study of the effects of atmospheric aerosols and regional haze on agriculture: an opportunity to enhance crop yields in China through emission controls? Proc. Natl. Acad. Sci. 1999, 96, 13626–13633. [Google Scholar] [CrossRef] [PubMed]
  11. Tsai, F.C.; Apte, M.G.; Daisey, J.M. An exploratory analysis of the relationship between mortality and the chemical composition of airborne particulate matter. Inhal. Toxicol. 2000, 12, 121–135. [Google Scholar] [CrossRef] [PubMed]
  12. Verma, V.; Polidori, A.; Schauer, J.J.; Shafer, M.M.; Cassee, F.R.; Sioutas, C. Physicochemical and toxicological profiles of particulate matter in Los Angeles during the October 2007 Southern California wildfires. Environ. Sci. Technol. 2009, 43, 954–960. [Google Scholar] [CrossRef] [PubMed]
  13. Valavanidis, A.; Fiotakis, K.; Bakeas, E.; Vlahogianni, T. Electron paramagnetic resonance study of the generation of reactive oxygen species catalysed by transition metals and quinoid redox cycling by inhalable ambient particulate matter. Redox Rep. 2005, 10, 37–51. [Google Scholar] [CrossRef] [PubMed]
  14. Shi, T.M.; Schins, R.P.F.; Knaapen, A.M.; Kuhlbusch, T.; Pitz, M.; Heinrich, J.; Borm, P.J.A. Hydroxyl radical generation by electron paramagnetic resonance as a new method to monitor ambient particulate matter composition. J. Environ. Monitor. 2003, 5, 550–556. [Google Scholar] [CrossRef]
  15. Prahalad, A.K.; Soukup, J.M.; Inmon, J.; Willis, R.; Ghio, A.J.; Becker, S.; Gallagher, J.E. Ambient air particles: Effects on cellular oxidant radical generation in relation to particulate elemental chemistry. Toxicol. Appl. Pharm. 1999, 158, 81–91. [Google Scholar] [CrossRef] [PubMed]
  16. Alloway, B.J. Heavy Metals in Soils; Blackie Academic & Professional: Glasgow, UK, 1990. [Google Scholar]
  17. Lee, C.S.; Li, X.D.; Shi, W.Z.; Cheung, S.C.; Thornton, I. Metal contamination in urban, suburban, and country park soils of Hong Kong: A study based on GIS and multivariate statistics. Sci. Total Environ. 2006, 356, 45–61. [Google Scholar] [CrossRef] [PubMed]
  18. Nriagu, J.O. A silent epidemic of environmental metal poisoning. Environ. Pollut. 1988, 50, 139–161. [Google Scholar] [CrossRef]
  19. Thompson, C.M.; Markesbery, W.R.; Ehmann, W.D.; Mao, Y.X.; Vance, D.E. Regional Brain Trace-Element Studies in Alzheimers-Disease. Neurotoxicology 1988, 9, 1–8. [Google Scholar] [PubMed]
  20. Bocca, B.; Alimonti, A.; Petrucci, F.; Violante, N.; Sancesario, G.; Forte, G.; Senofonte, O. Quantification of trace elements by sector field inductively coupled plasma mass spectrometry in urine, serum, blood and cerebrospinal fluid of patients with Parkinson's disease. Spectrochim Acta Part B At. Spectrosc. 2004, 59, 559–566. [Google Scholar] [CrossRef]
  21. Cao, J.J.; Lee, S.C.; Ho, K.F.; Zhang, X.Y.; Zou, S.C.; Fung, K.; Chow, J.C.; Watson, J.G. Characteristics of carbonaceous aerosol in Pearl River Delta Region, China during 2001 winter period. Atmos. Environ. 2003, 37, 1451–1460. [Google Scholar] [CrossRef]
  22. Cao, J.J.; Lee, S.C.; Ho, K.F.; Zou, S.C.; Fung, K.; Li, Y.; Watson, J.G.; Chow, J.C. Spatial and seasonal variations of atmospheric organic carbon and elemental carbon in Pearl River Delta Region, China. Atmos. Environ. 2004, 38, 4447–4456. [Google Scholar] [CrossRef]
  23. Dai, W.; Gao, J.; Cao, G.; Ouyang, F. Chemical composition and source identification of PM2.5 in the suburb of Shenzhen, China. Atmos. Res. 2013, 122, 391–400. [Google Scholar] [CrossRef]
  24. Air quality Guidelines for Particulate Matter, Ozone, Nitrogen Dioxide and Sulfur Dioxide. Available online: http://apps.who.int/iris/bitstream/10665/69477/1/WHO_SDE_PHE_OEH_06.02_eng.pdf (accessed on 10 February 2016).
  25. HORIBA Technical Reports—The Trends in Environmental Regulations in China. Available online: http://www.horiba.com/uploads/media/R41E_05_010_01.pdf (accessed on 10 February 2016).
  26. Wang, Y.Q.; Zhang, Y.X.; Zhang, Y.; Li, Z.Q.; He, L.Y.; Huang, X.F. Characterization of carbonaceous aerosols during and post-Shenzhen UNIVERSIADE period. China Environ. Sci. 2014, 34, 1622–1632. (In Chinese) [Google Scholar]
  27. Wang, X.; Westerdahl, D.; Chen, L.C.; Wu, Y.; Hao, J.M.; Pan, X.C.; Guo, X.B.; Zhang, K.M. Evaluating the air quality impacts of the 2008 Beijing Olympic Games: On-road emission factors and black carbon profiles. Atmos. Environ. 2009, 43, 4535–4543. [Google Scholar] [CrossRef]
  28. China. Available online: https://en.wikipedia.org/wiki/China (accessed on 13 April 2016).
  29. Zhang, Y.; Zhang, Y.; Liu, H.; Wang, Y.; Deng, J. Design and application of a novel atmospheric particle sampler. Environ. Monit. China 2014, 30, 176–180. [Google Scholar]
  30. NIOSH Manual of Analytical Methods. Available online: http://www.cdc.gov/niosh/docs/2003-154/pdfs/5040.pdf (accessed on 2 February 2016).
  31. Rolph, G.D. Real-Time Environmental Applications and Display System (READY); NOAA Air Resources Laboratory: Silver Spring, MD, USA, 2003. [Google Scholar]
  32. Jayarathne, T.; Stockwell, C.E.; Yokelson, R.J.; Nakao, S.; Stone, E.A. Emissions of fine particle fluoride from biomass burning. Environ. Sci. Technol. 2014, 48, 12636–12644. [Google Scholar] [CrossRef] [PubMed]
  33. Stookey, L.L. Ferrozine—A new spectrophotometric reagent for iron. Anal. Chem 1970, 42, 779–781. [Google Scholar] [CrossRef]
  34. Majestic, B.J.; Schauer, J.J.; Shafer, M.M.; Turner, J.R.; Fine, P.M.; Singh, M.; Sioutas, C. Development of a wet-chemical method for the speciation of iron in atmospheric aerosols. Environ. Sci. Technol. 2006, 40, 2346–2351. [Google Scholar] [CrossRef] [PubMed]
  35. Schaug, J.; Rambaek, J.P.; Steinnes, E.; Henry, R.C. Multivariate-analysis of trace-element data from moss samples used to monitor atmospheric deposition. Atmos. Environ. Part A Gen. Top. 1990, 24, 2625–2631. [Google Scholar] [CrossRef]
  36. Elliott, A.C.; Woodward, W.A. IBM SPSS by Example: A Practical Guide to Statistical Data Analysis; SAGE Publications: Thousand Oaks, CA, USA, 2015. [Google Scholar]
  37. List of major power stations in Guangdong. Available online: https://en.wikipedia.org/wiki/List_of_major_power_stations_in_Guangdong (accessed on 1 March 2016).
  38. Arimoto, R.; Duce, R.A.; Savoie, D.L.; Prospero, J.M.; Talbot, R.; Cullen, J.D.; Tomza, U.; Lewis, N.F.; Ray, B.J. Relationships among aerosols constituents from Asia and the North Pacific during PEM-West A. J. Geophys. Res. 1996, 101, 2011–2023. [Google Scholar] [CrossRef]
  39. Yao, X.; Chan, C.K.; Fang, M.; Cadle, S.; Chan, T.; Mulawa, P.; He, K.; Ye, B. The water-soluble ionic composition of PM2.5 in Shanghai and Beijing, China. Atmos. Environ. 2002, 36, 4223–4234. [Google Scholar] [CrossRef]
  40. Reimann, C.; Caritat, P.D. Intrinsic flaws of element Enrichment Factors (EFs) in environmental geochemistry. Environ. Sci. Technol. 2000, 34, 5084–5091. [Google Scholar] [CrossRef]
  41. Buat-Menard, P.; Chesselet, R. Variable influence of the atmospheric flux on the trace metal chemistry of oceanic suspended matter. Earth Planet. Sci. Lett. 1979, 42, 399–411. [Google Scholar] [CrossRef]
  42. Taylor, S.R.; Mclennan, S.M. The geochemical evolution of the continental-crust. Rev. Geophys. 1995, 33, 241–265. [Google Scholar] [CrossRef]
  43. Cheung, K.; Daher, N.; Kam, W.; Shafer, M.M.; Ning, Z.; Schauer, J.J.; Sioutas, C. Spatial and temporal variation of chemical composition and mass closure of ambient coarse particulate matter (PM10–2.5) in the Los Angeles area. Atmos. Environ. 2011, 45, 2651–2662. [Google Scholar] [CrossRef]
  44. Clements, N.; Eav, J.; Xie, M.J.; Hannigan, M.P.; Miller, S.L.; Navidi, W.; Peel, J.L.; Schauer, J.J.; Shafer, M.M.; Milford, J.B. Concentrations and source insights for trace elements in fine and coarse particulate matter. Atmos. Environ. 2014, 89, 373–381. [Google Scholar] [CrossRef]
  45. Jiang, S.Y.N.; Yang, F.; Chan, K.L.; Ning, Z. Water solubility of metals in coarse PM and PM2.5 in typical urban environment in Hong Kong. Atmos. Pollut. Res. 2014, 5, 236–244. [Google Scholar] [CrossRef]
  46. Majestic, B.J.; Schauer, J.J.; Shafer, M.M. Application of synchrotron radiation for measurement of iron red-ox speciation in atmospherically processed aerosols. Atmos. Chem. Phys. 2007, 7, 2475–2487. [Google Scholar] [CrossRef]
  47. Cartledge, B.T.; Marcotte, A.R.; Herckes, P.; Anbar, A.D.; Majestic, B.J. The impact of particle size, relative humidity, and sulfur dioxide on iron solubility in simulated atmospheric marine aerosols. Environ. Sci. Technol. 2015, 49, 7179–7187. [Google Scholar] [CrossRef] [PubMed]
  48. Oakes, M.; Ingall, E.D.; Lai, B.; Shafer, M.M.; Hays, M.D.; Liu, Z.G.; Russell, A.G.; Weber, R.J. Iron solubility related to particle sulfur content in source emission and ambient fine particles. Environ. Sci Technol 2012, 46, 6637–6644. [Google Scholar] [CrossRef] [PubMed]
  49. Stumm, W.; Morgan, J.J. Aquatic Chemistry: An Introduction Emphasizing Chemical Equilibria in Natural Waters, 2nd ed.; Wiley: New York, NY, USA, 1981. [Google Scholar]
  50. Pehkonen, S.O.; Siefert, R.; Erel, Y.; Webb, S.; Hoffman, M.R. Photoreduction of iron oxyhydroxides in the presence of important atmospheric organic compounds. Environ. Sci Technol 1993, 27, 2056–2062. [Google Scholar] [CrossRef]
  51. Barbas, J.T.; Sigman, M.E.; Buchanan, A.C.; Chevis, E.A. Photolysis of substituted naphthalenes on SiO2 and Al2O3. Photochem. Photobiol. 1993, 58, 155–158. [Google Scholar] [CrossRef]
  52. Paris, R.; Desboeufs, K.V. Effect of atmospheric organic complexation on iron-bearing dust solubility. Atmos. Chem. Phys. 2013, 13, 4895–4905. [Google Scholar] [CrossRef] [Green Version]
  53. Dickin, A.P. Radiogenic Isotope Geology, 2nd ed.; Cambridge University Press: Cambridge, UK, 2005. [Google Scholar]
  54. Kendall, C.; McDonnell, J.J. Isotope Tracers in Catchment Hydrology, 1st ed.; Elsevier B.V.: Philadelphia, PA, USA, 1998; pp. 51–86. [Google Scholar]
  55. Komerek, M.; Ettler, V.; Chrastny, V.; Mihailovic, M. Lead isotopes in environmental sciences: A review. Environ. Int. 2008, 34, 562–577. [Google Scholar] [CrossRef] [PubMed]
  56. Dewan, N.; Majestic, B.J.; Ketterer, M.E.; Miller-Schulze, J.P.; Shafer, M.M.; Schauer, J.J.; Solomon, P.A.; Artamonova, M.; Chen, B.B.; Imashev, S.A.; et al. Stable isotopes of lead and strontium as tracers of sources of airborne particulate matter in Kyrgyzstan. Atmos. Environ. 2015, 120, 438–446. [Google Scholar] [CrossRef]
  57. Monna, F.; Lancelot, J.; Croudace, I.W.; Cundy, A.B.; Lewis, J.T. Pb isotopic composition of airborne particulate material from France and the southern United Kingdom: Implications for Pb pollution sources in urban areas. Environ. Sci. Technol. 1997, 31, 2277–2286. [Google Scholar] [CrossRef]
  58. Simonetti, A.; Gariepy, C.; Carignan, J. Pb and Sr isotopic compositions of snowpack from Quebec, Canada: Inferences on the sources and deposition budgets of atmospheric heavy metals. Geochim. Cosmochim. Acta 2000, 64, 5–20. [Google Scholar] [CrossRef]
  59. Chen, J.M.; Tan, M.G.; Li, Y.L.; Zhang, Y.M.; Lu, W.W.; Tong, Y.P.; Zhang, G.L.; Li, Y. A lead isotope record of shanghai atmospheric lead emissions in total suspended particles during the period of phasing out of leaded gasoline. Atmos. Environ. 2005, 39, 1245–1253. [Google Scholar] [CrossRef]
  60. Lee, C.S.L.; Li, X.D.; Zhang, G.; Li, J.; Ding, A.J.; Wang, T. Heavy metals and Pb isotopic composition of aerosols in urban and suburban areas of Hong Kong and Guangzhou, South China—Evidence of the long-range transport of air contaminants. Atmos. Environ. 2007, 41, 432–447. [Google Scholar] [CrossRef]
  61. Bollhofer, A.; Rosman, K.J.R. Isotopic source signatures for atmospheric lead: The Northern Hemisphere. Geochim. Cosmochim. Acta 2001, 65, 1727–1740. [Google Scholar] [CrossRef]
  62. Widory, D.; Liu, X.D.; Dong, S.P. Isotopes as tracers of sources of lead and strontium in aerosols (TSP & PM2.5) in Beijing. Atmos. Environ. 2010, 44, 3679–3687. [Google Scholar]
  63. Zhu, L.M.; Tang, J.W.; Lee, B.; Zhang, Y.; Zhang, F.F. Lead concentrations and isotopes in aerosols from Xiamen, China. Mar. Pollut. Bull. 2010, 60, 1946–1955. [Google Scholar] [CrossRef] [PubMed]
  64. Thurston, G.D.; Ito, K.; Lall, R. A source apportionment of U.S. fine particulate matter air pollution. Atmos. Environ. 2011, 45, 3924–3936. [Google Scholar] [CrossRef] [PubMed]
  65. Clayton, J.L.; Koncz, I. Petroleum Geochemistry of the Zala Basin, Hungary. Aapg. Bull. 1994, 78, 1–22. [Google Scholar]
  66. Mueller, D.; Uibel, S.; Takemura, M.; Klingelhoefer, D.; Groneberg, D.A. Ships, ports and particulate air pollution—An analysis of recent studies. J. Occup. Med. Toxicol. 2011, 6, 1–6. [Google Scholar] [CrossRef] [PubMed]
  67. Zhang, R.; Jing, J.; Tao, J.; Hsu, S.C.; Wang, G.; Cao, J.; Lee, C.S.L.; Zhu, L.; Chen, Z.; Zhao, Y.; et al. Chemical characterization and source apportionment of PM2.5 in Beijing: Seasonal perspective. Atmos. Chem. Phys. 2013, 13, 7053–7074. [Google Scholar] [CrossRef]
  68. Garg, B.D.; Cadle, S.H.; Mulawa, P.A.; Groblicki, P.J. Brake wear particulate matter emissions. Environ. Sci. Technol. 2000, 34, 4463–4469. [Google Scholar] [CrossRef]
  69. Oakes, M.; Weber, R.J.; Lai, B.; Russell, A.; Ingall, E.D. Characterization of iron speciation in urban and rural single particles using XANES spectroscopy and micro X-ray fluorescence measurements: investigating the relationship between speciation and fractional iron solubility. Atmos. Chem. Phys. 2012, 12, 745–756. [Google Scholar] [CrossRef] [Green Version]
  70. Cartledge, B.T.; Majestic, B.J. Metal concentrations and soluble iron speciation in fine particulate matter from light rail activity in the Denver-Metropolitan area. Atmos. Pollut. Res. 2015, 6, 495–502. [Google Scholar] [CrossRef]
  71. SZ News. Available online: http://sztqb.sznews.com/html/2011-08/08/content_1694922.htm (accessed on 8 February 2016). (In Chinese)
  72. GD.Xinhuanet. Available online: http://www.gd.xinhuanet.com/newscenter/2011-06/01/content_22914683.htm (accessed on 8 February 2016). (In Chinese)
Figure 1. Map showing the geographical location of the PU and LG sampling sites (shown as stars) relative to the Universiade center in Shenzhen. The red dots in the map represent the stadiums where the events were held [28].
Atmosphere 07 00057 g001
Figure 2. Average (ng·m−3) abundant and trace elements observed in PM2.5 at the LG site (a,b) and PU site (c,d) during controlled and uncontrolled periods.
Atmosphere 07 00057 g002
Figure 3. Average (µg·m−3) water-soluble ions observed in PM2.5 at the LG site (a) and PU site (b) during controlled and uncontrolled periods.
Atmosphere 07 00057 g003
Figure 4. Enrichment factor (EF) for PM2.5 collected at: (a) LG site during controlled and uncontrolled periods; and (b) PU site during controlled and uncontrolled periods. The error bar represents the standard deviation of the samples.
Atmosphere 07 00057 g004
Figure 5. Soluble fractions of Fe(II) and Fe(III) at: (a) LG site; and (b) PU site.
Atmosphere 07 00057 g005
Figure 6. Isotopic composition of the PM2.5 collected at LG and PU sites during controlled and uncontrolled periods. The error bars represent the standard deviation of the Pb isotopic ratios for all samples.
Atmosphere 07 00057 g006

