Article

Assessment of Air Quality Status in Wuhan, China

College of Resources and Environment, Huazhong Agricultural University, Wuhan 430070, China
*
Author to whom correspondence should be addressed.
Atmosphere 2016, 7(4), 56; https://doi.org/10.3390/atmos7040056
Submission received: 18 February 2016 / Revised: 21 March 2016 / Accepted: 28 March 2016 / Published: 13 April 2016

Abstract

:
In this study, air quality characteristics in Wuhan were assessed through descriptive statistics and Hierarchical Cluster Analysis (HCA). Results show that air quality has slightly improved over the recent years. While the NO2 concentration is still increasing, the PM10 concentration shows a clearly downward trend with some small fluctuations. In addition, the SO2 concentration has steadily decreased since 2008. Nevertheless, the current level of air pollutants is still quite high, with the PM10 and NO2 levels exceeding the air quality standard. Seasonal variation exists consistently for all the pollutants, with the highest concentration in winter and the lowest in summer. Cluster analysis evidenced that nine urban monitoring sites could be classified into three clusters. Cluster I consists of only the LY site, which is located in the famous East Lake scenic area with the best air quality. Cluster II corresponds to three monitoring sites with heavily trafficked roads nearby, where relatively severe NO2 pollution occurred. Cluster III is comprised of the remaining five sites, characterized by PM10 and SO2 pollution.

Graphical Abstract

1. Introduction

Air pollution impacts human health, wellbeing and the environment. In March 2014, the WHO issued new information estimating that outdoor air pollution in both cities and rural areas was responsible for the deaths of some 3.7 million people worldwide under the age of 60 in 2012. In addition, around seven million people died—one in eight of total global deaths—as a result of the joint effects of household and ambient air pollution in 2012. This finding more than doubles previous estimates and confirms that air pollution is now the world’s largest single environmental health risk [1].
China is now facing probably the worst air pollution problem in the world [2]. According to the 2013 Report on the State of Environment in China, although 74 cities in China adopted the new strict air quality standards in 2013, only three out of 74 cities’ air quality met the national standard for good air quality [3]. Matus et al. evaluated air pollution–related health impacts on the Chinese economy by using an expanded version of the Emissions Prediction and Policy Analysis model. Results estimated that the marginal welfare impact of ozone and particulate matter concentrations above background levels to the Chinese economy increased from 1997 US$22 billion in 1975 to 1997 US$112 billion in 2005, despite improvements in overall air quality [4]. As a matter of fact, air quality in China has recently become an issue associated with increasing social unrest.
As the capital of Hubei province, Wuhan is one of the areas with high industrial development in the country, with high coal consumption, intensive steel manufacturing and smelting activities, accounting for high emissions of PM and gaseous precursors [5,6,7]. In comparison with the newly revised national ambient air quality standard of China (GB3096-2012), the annual average of PM2.5 (particulate matter less than 2.5 µm in size), PM10 (particulate matter less than 10 µm in size), and nitrogen dioxide exceeded the limited value in 2013. Therefore, a better scientific understanding of the air quality conditions in Wuhan is necessary.
Air pollutants including NO2, SO2, CO, PM10, and O3 have been routinely monitored for many years. Starting in 2013, PM2.5 has also been monitored. Therefore, a massive data set of air pollutants has already been accumulated. Much of the information, including spatiotemporal patterns of air pollution, association among individual pollutants, and correlation with meteorological variables, can possibly be assessed from the data set. Unfortunately, exploitation of the data for these purposes is scarce. Feng et al. analyzed the variations of PM10 concentrations during 2006–2008 in Wuhan [8]. However, only descriptive statistics for PM10 were addressed. In another study, the spatial distribution of PM10 over 86 Chinese cities was reconstructed from publicly available Air Pollution Index (API) records for summer 2000 to winter 2006 and 14 groups of cities were defined by using a fuzzy clustering procedure. Wuhan was found to be one of the cities with a high PM10 level in the middle zone. Although latitudinal and longitudinal gradients and inter-annual variations in PM10 concentrations were discussed, no efforts were made to elucidate the relationship with other criteria air pollutants [9]. Therefore, in-depth analysis of the air quality data set in Wuhan is of great significance. In this study, multivariate statistical methods, including Cluster Analysis (CA) and the non-parametric Mann-Kendall’s test, were employed to characterize the air pollution in urban Wuhan.

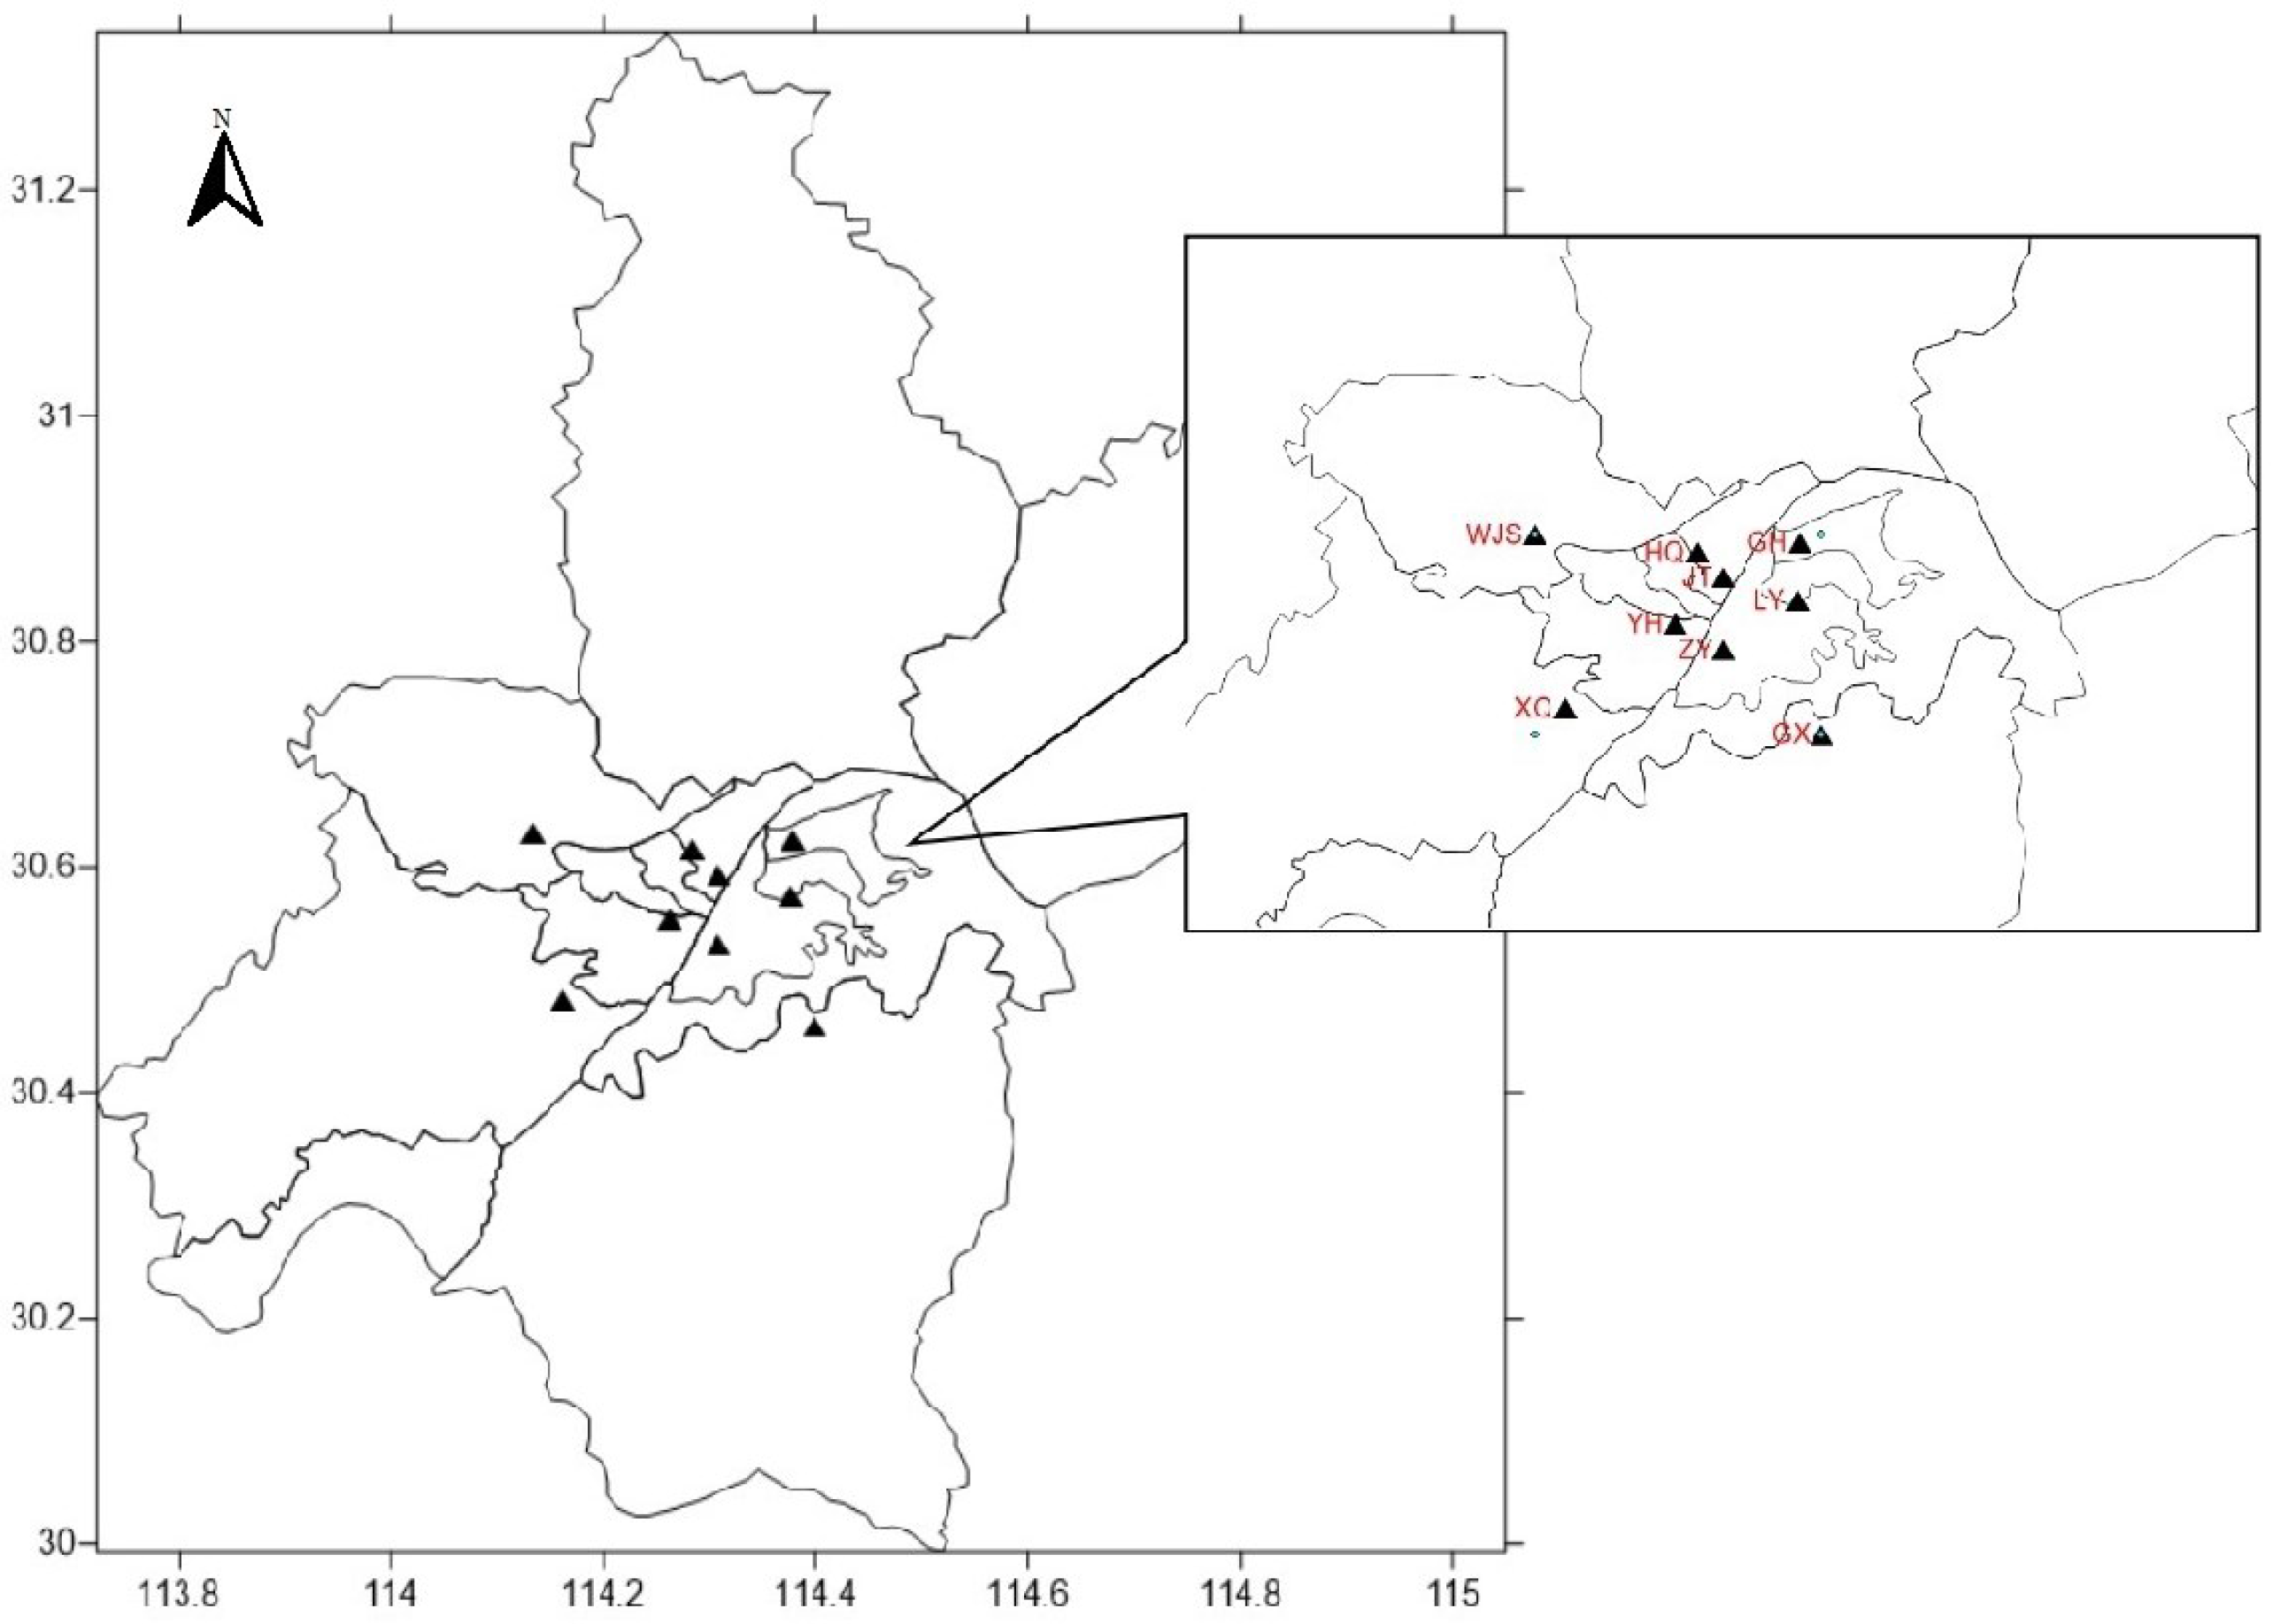
2. Materials and Methods

The study area is Wuhan (Longitude 113°41’E–115°05′E, Latitude 29°58′N–31°22′N), the capital city of Hubei province. It is situated on the east of the Jiang-Han plain, a vast area in the valley of the Yangtze River. Wuhan covers an area of around 8494 km2 and has a subtropical moist monsoon climate with four distinct seasons. Currently, there are nine air quality monitoring stations in operation in urban Wuhan (Figure 1), with concentrations of criteria pollutants such as PM2.5, PM10, NO2, O3, CO, and SO2 being routinely recorded. However, PM2.5 has been monitored only since 2013.
Based on the monitoring data, the daily air quality is reported using the Air Pollution Index (API). The API is calculated from the concentrations of individual pollutants by certain weighting systems, and ranges from 0 to 500. Initially, only PM10, NO2, and SO2 were included for calculating API. CO and O3 were taken into account after 2004 and PM2.5 was involved only at the end of 2012. In this study, API data for PM10, NO2, and SO2 were collected from the air quality publishing platform supported by the Wuhan Environmental Protection Agency (WHEPA) for the period 2001–2011. In order to examine the long-term trend of air pollution, the average concentrations of air pollutants before 2001 were gathered from the annual report on environmental quality issued by WHEPA. In addition, emissions of air pollutants were obtained from the statistical yearbook.
The information provided by API data sets is limited. Therefore, the API data were converted to mass concentration using the following formula:
C = C l o w + [ ( I I l o w ) / ( I h i g h I l o w ) ] × ( C h i g h C l o w )
where C is the mass concentration and I is the API value. Ihigh and Ilow are the two values closest to value I in the API grading limited value table, standing for the values larger and lower than I, respectively; Chigh and Clow represent the concentrations corresponding to Ihigh and Ilow, respectively.
Simple descriptive statistics were performed to obtain the annual average and the monthly average data. Subsequently, data were compared with the National Ambient Air Quality Standard (Table 1) to evaluate the overall pollution status in Wuhan. The annual trends in air pollutants’ time series were investigated with the non-parametric Mann-Kendall’s test and Sen’s method using the MAKESENS software [10]. Sen’s method uses a linear model to estimate the slope of the trend and the variance of the residuals should be constant in time.
Multivariate analysis provides a broad range of methods for association, interpretation, modeling and forecasting from large datasets from environmental monitoring programs [11]. Among them, Cluster Analysis (CA) is a useful procedure for simplifying and classifying the behavior of environmental pollutants in a specific region [12]. In order to examine the spatial pattern of air pollution in urban Wuhan, nine monitoring stations were grouped using Hierarchical Agglomerative Cluster Analysis (HACA), a distribution-free ordination technique to group sites with similar characteristics by considering an original group of variables. For measuring the similarity between individual sites, the Euclidean distance has been used [13].

3. Results and Discussions

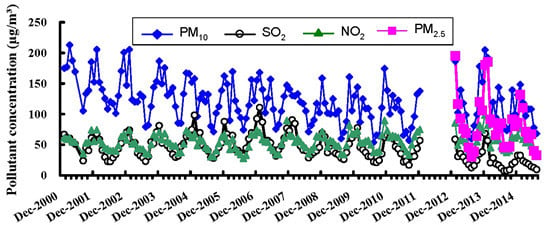
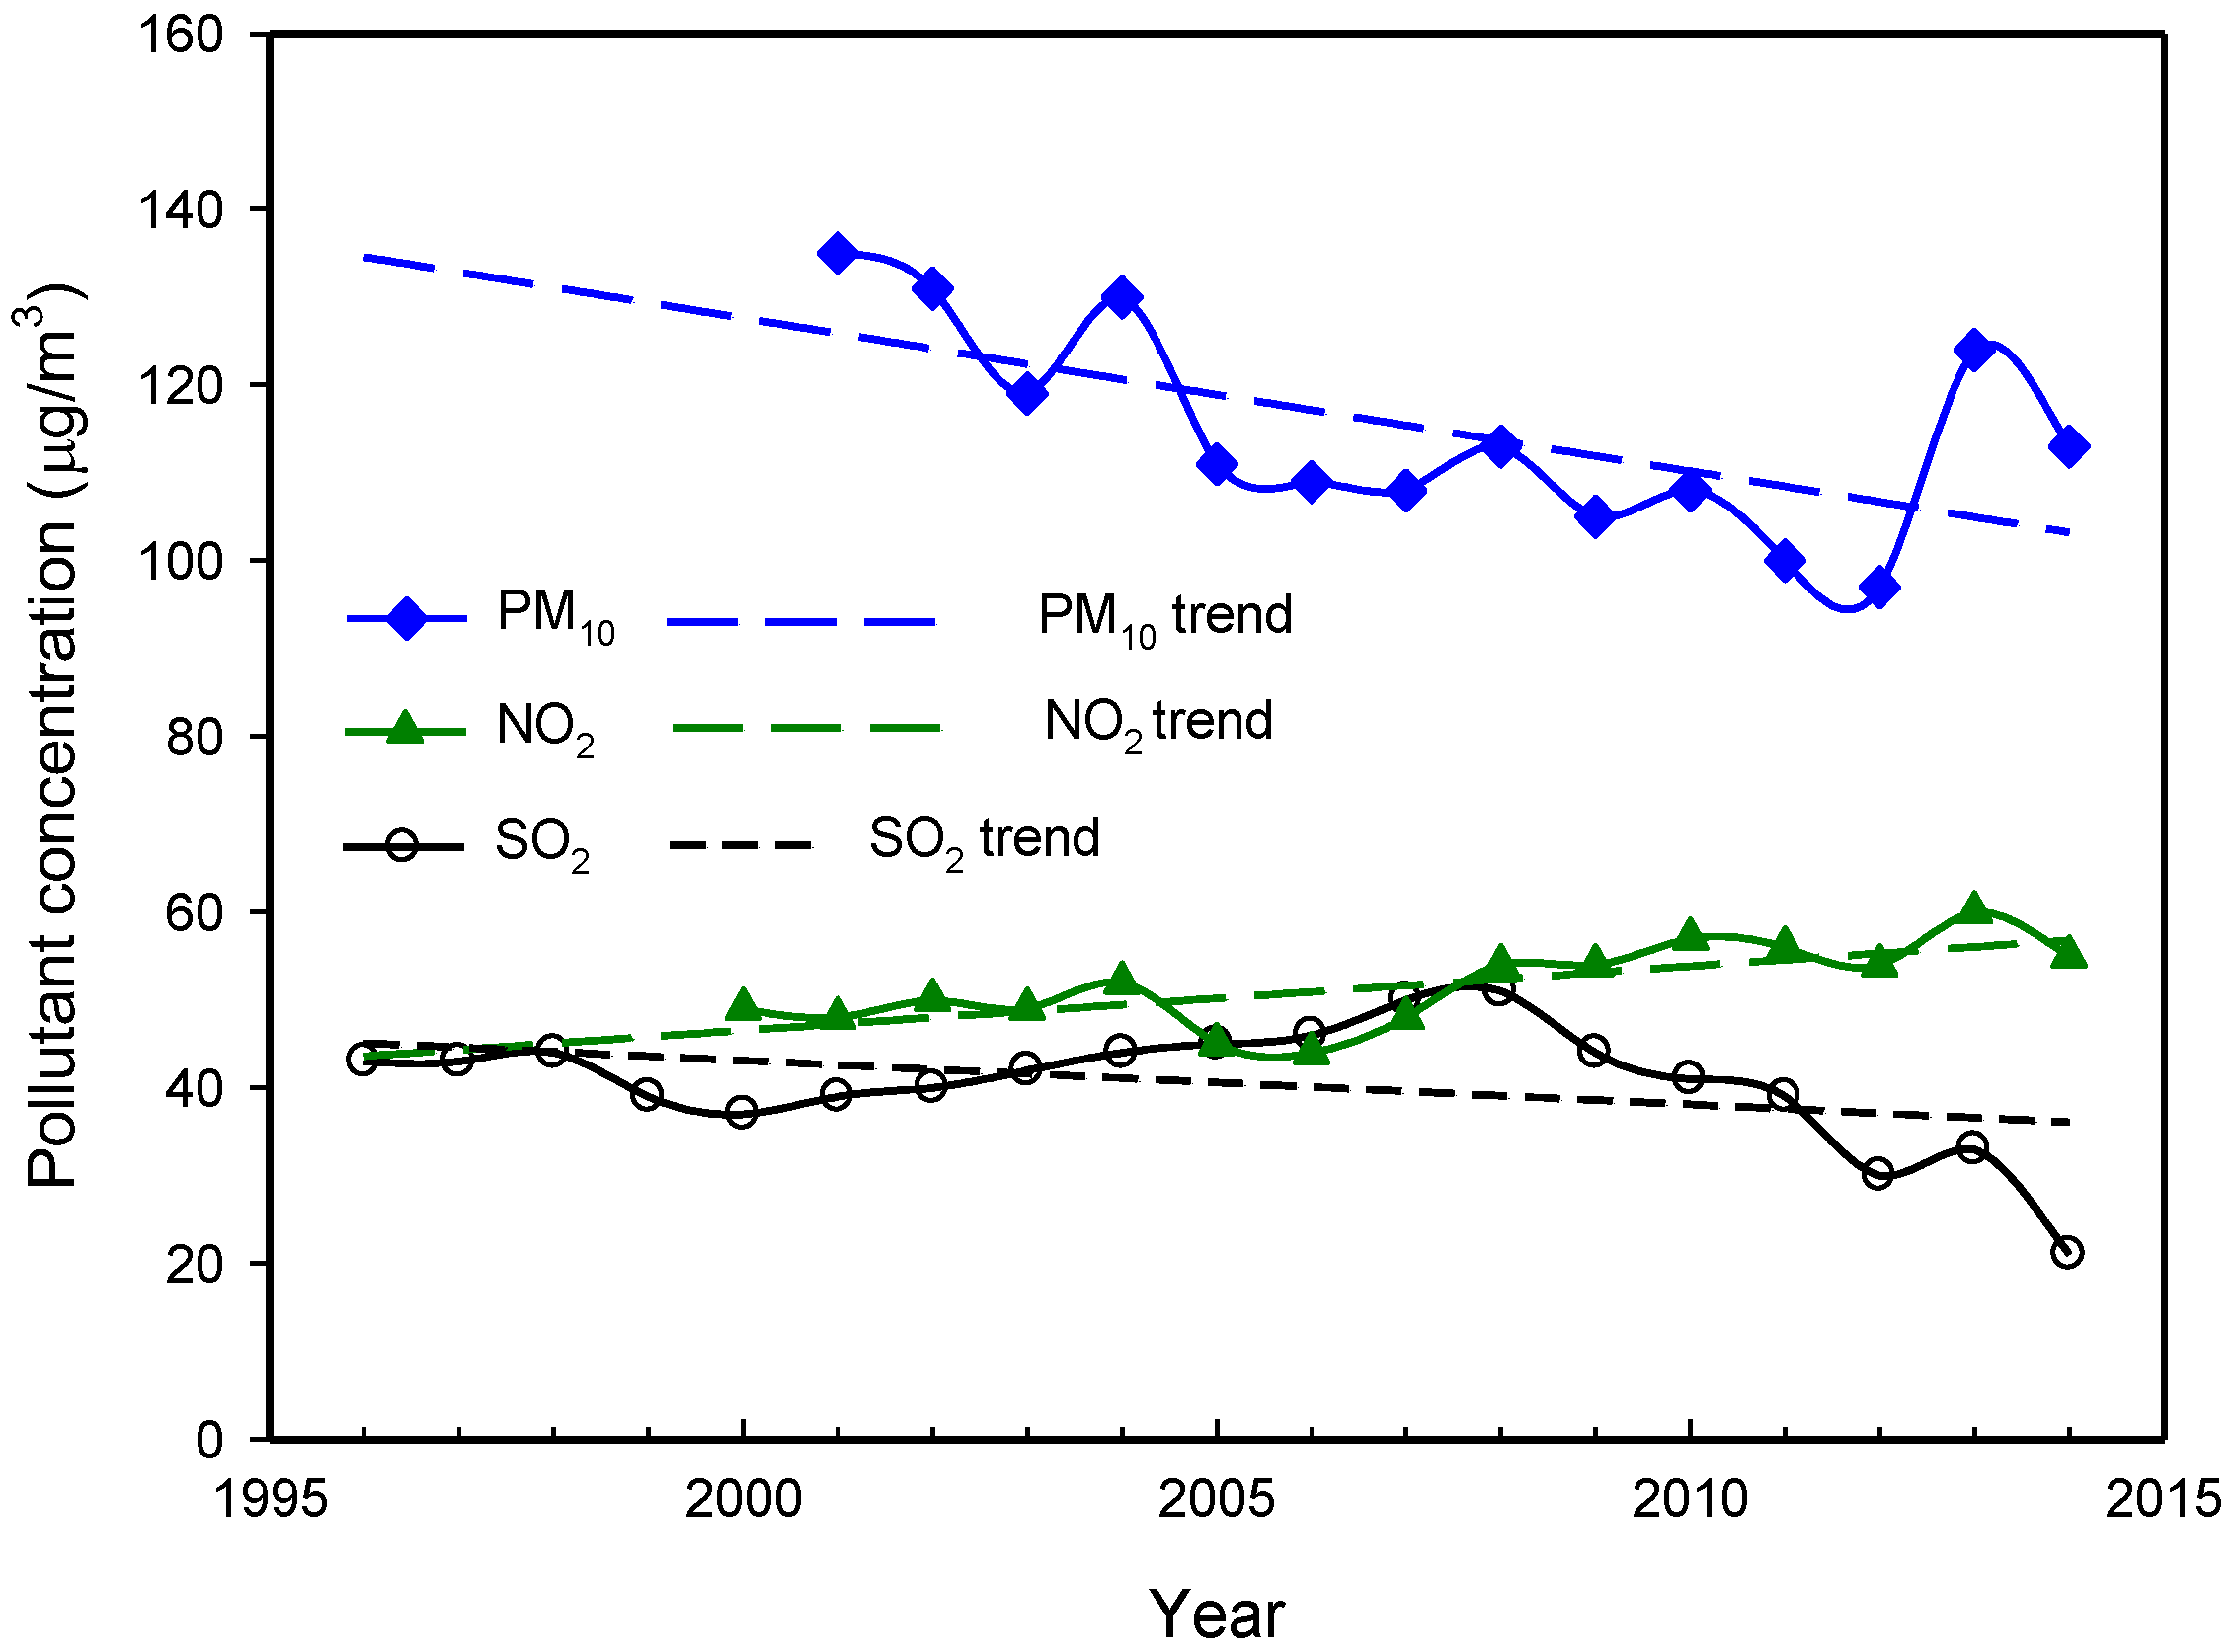
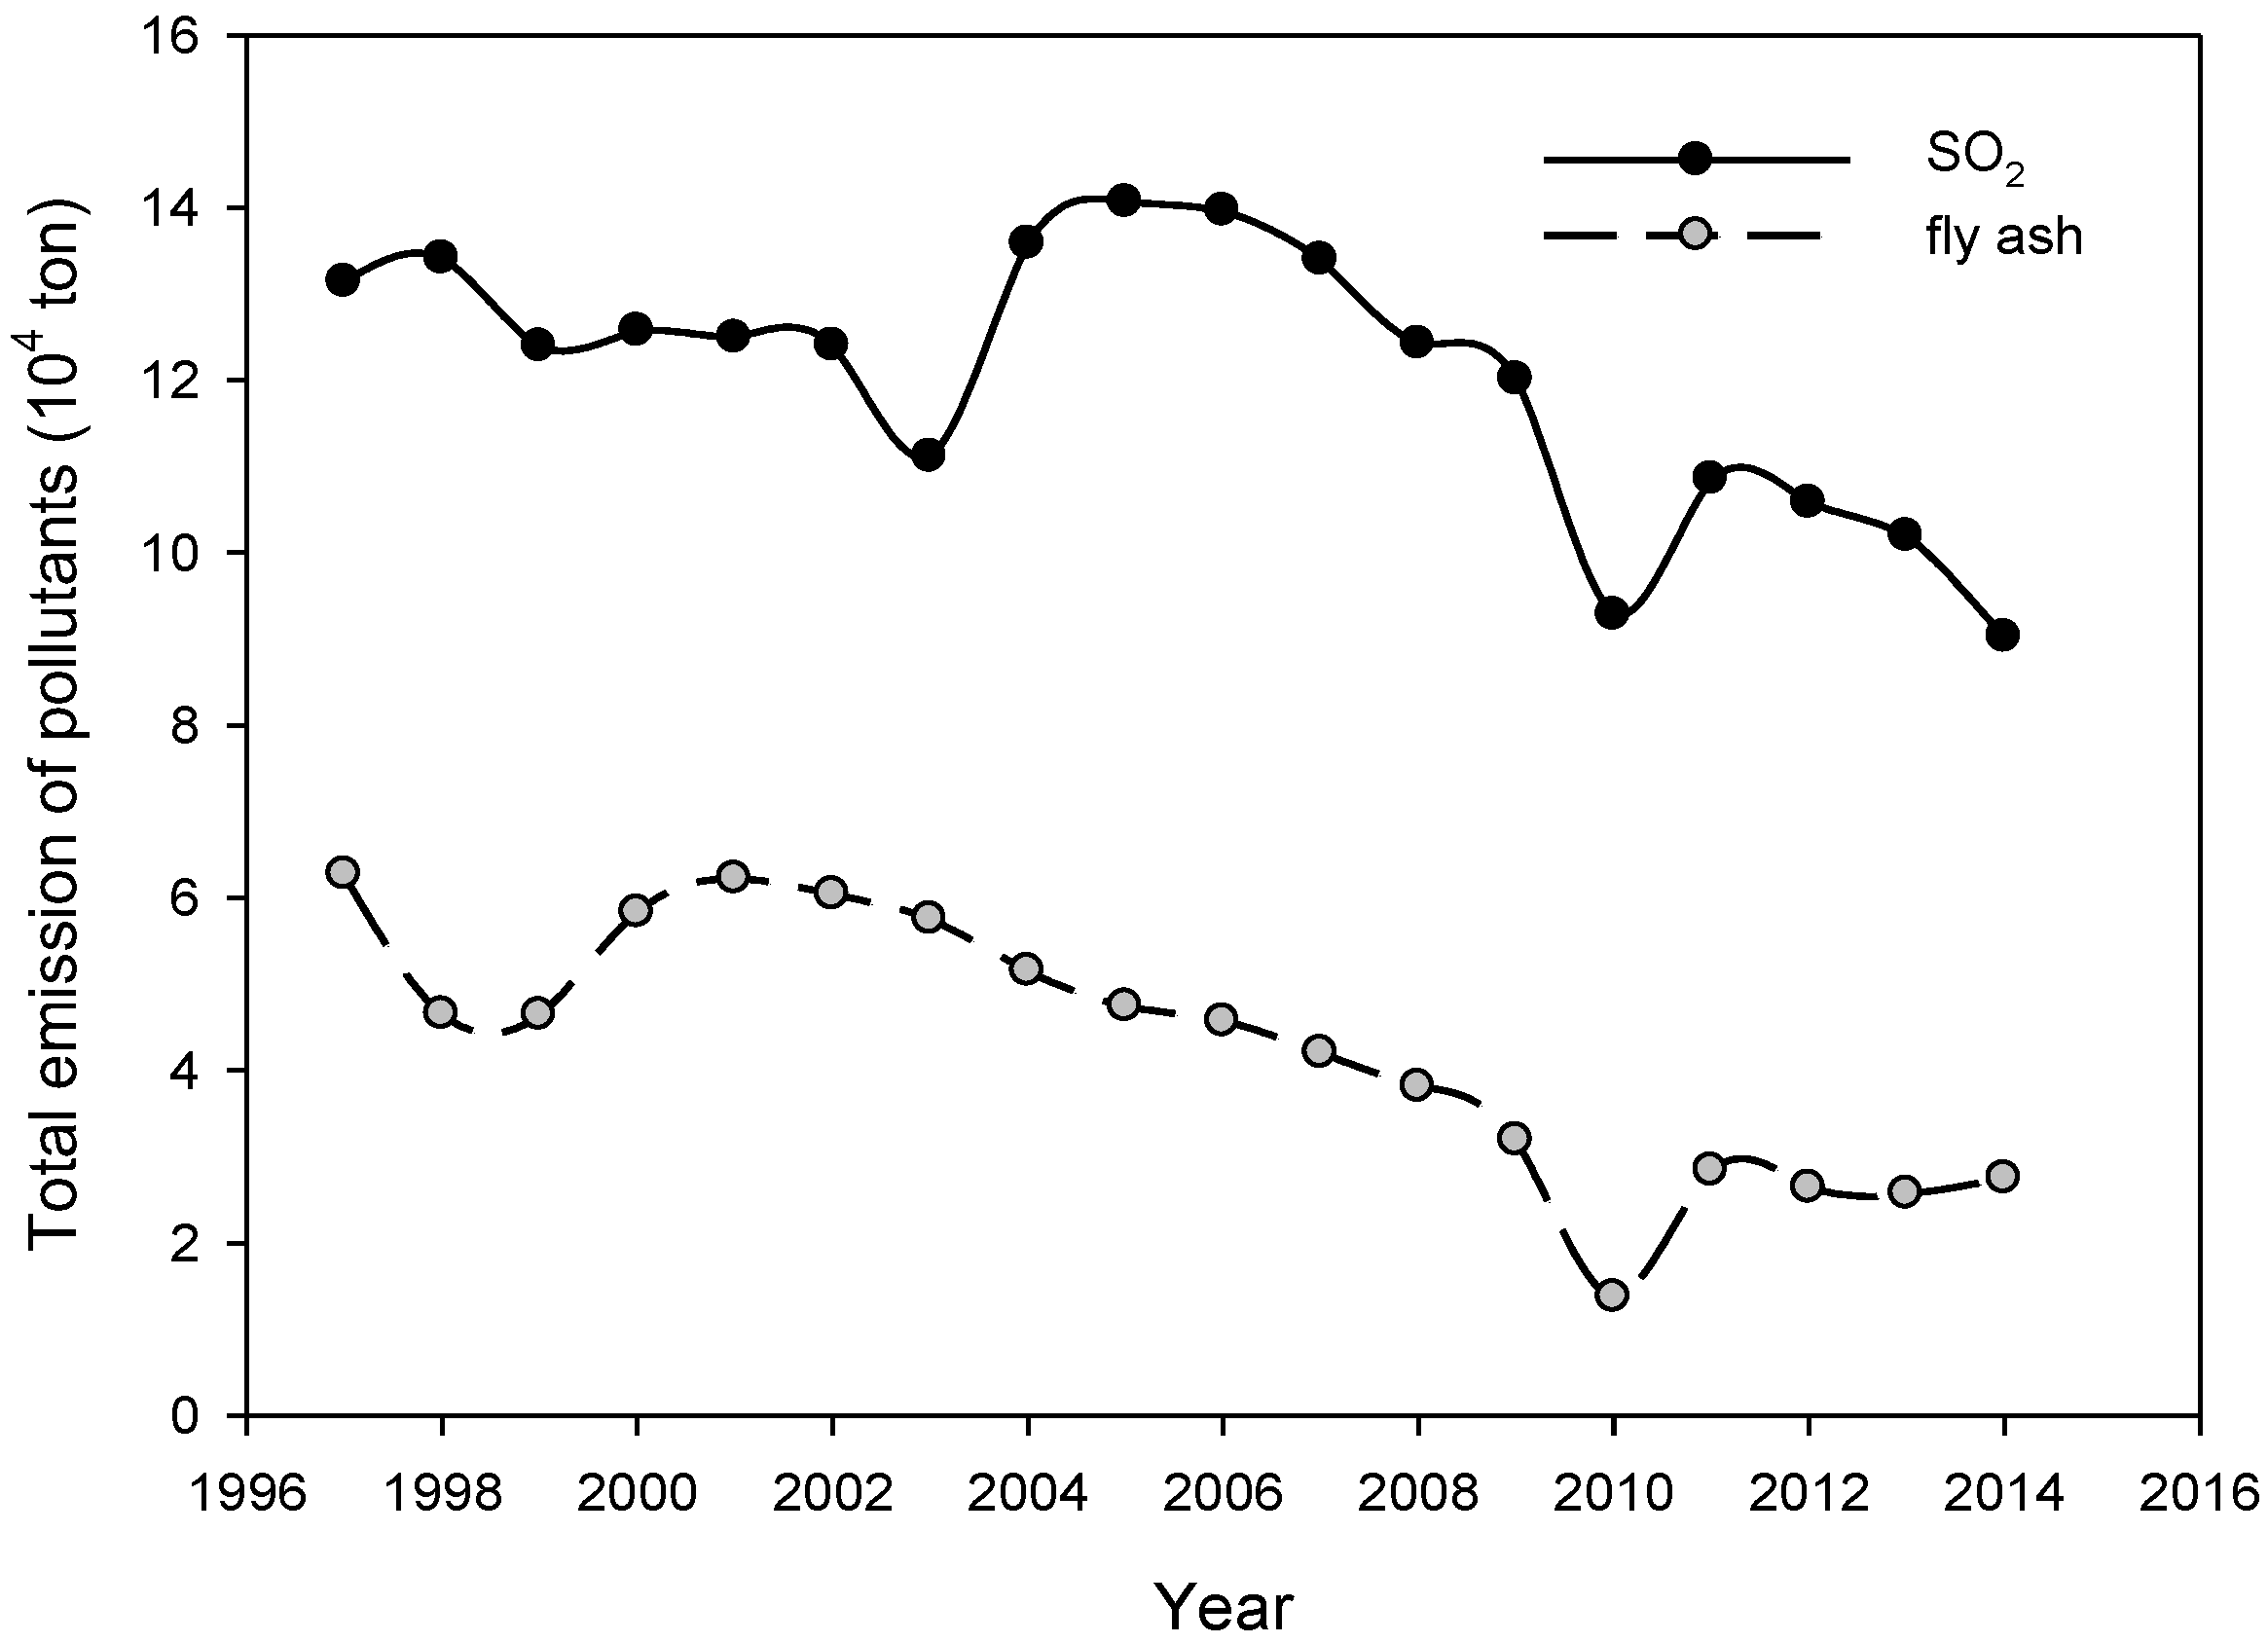
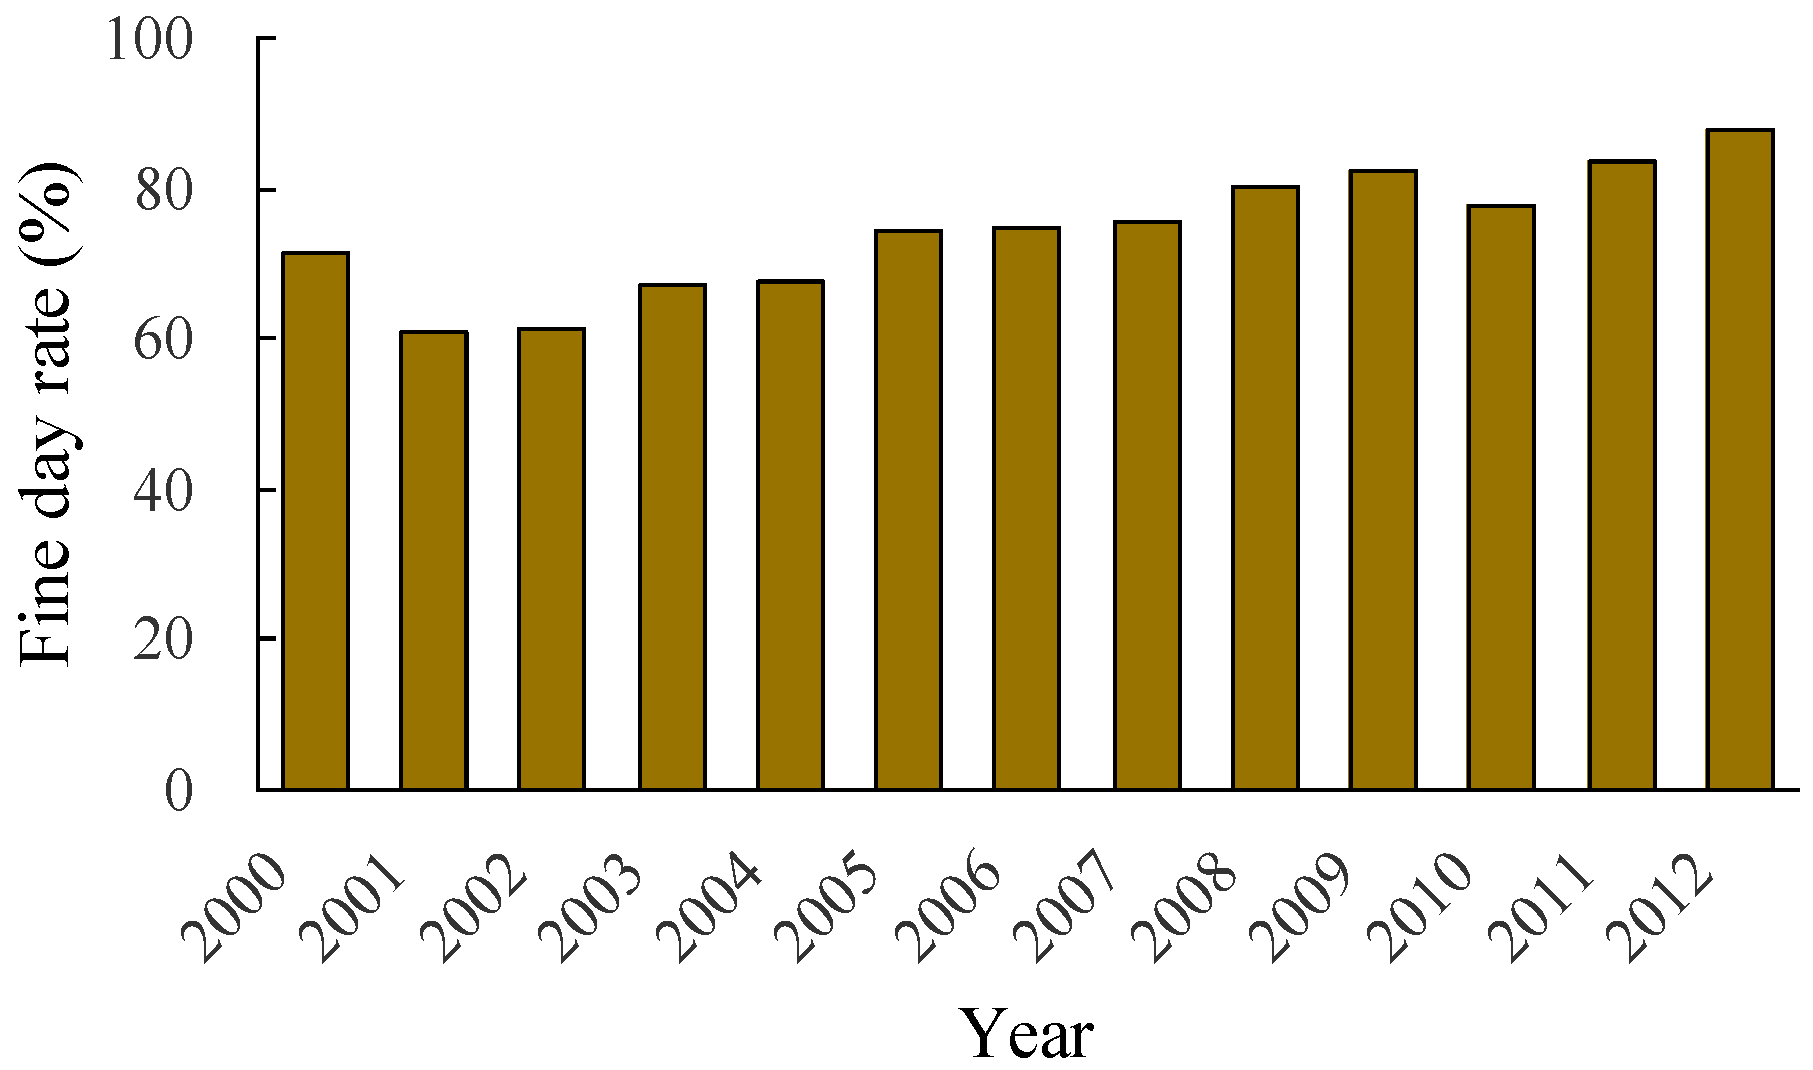
3.1. Overview of Air Pollution in Urban Wuhan

Figure 2 shows the annual average concentrations of PM10, NO2, and SO2 for the period 2001–2014 and the SO2 concentration for the period 1996–2000. It can be seen that the average concentration of SO2 remained almost constant during the 1996–1998 period, but dropped clearly in 1999 and 2000. After that, a continuous increasing trend was witnessed and the SO2 concentration peaked in 2008. Over the period 2009–2014, significant decline in the SO2 concentration occurred steadily. Fortunately, all the SO2 concentrations were below the limit value of 60µg/m3 as set in the Chinese national ambient air quality standard (CNAAQS). Although the linear regression of annual averages in Figure 2 demonstrates an overall descending trend in SO2 concentration, the Mann-Kendall test indicates that the trend was not statistically significant. The annual amount of SO2 emission in Wuhan was plotted in Figure 3. Generally, the annual variation of SO2 concentration is in line with the emission of SO2. In 1998, the State Environmental Protection Administration (SEPA) established Acid Rain and SO2 Pollution Control Zones to halt the increasing trend of SO2 emissions and worsening acid rain. Therefore, both the SO2 emission and ambient concentration decreased in 1998. On the other hand, due to rapid economic development and surging energy consumption, the SO2 pollution became worse again during China’s 10th Five-Year Plan (FYP) (2001–2005). In recognition of this challenge, more stringent prevention and control plans were developed and various mitigation measures were adopted to curtail the SO2 emissions during the 11th (2006–2010) and 12th FYP (2011–2015). As expected, the emissions and ambient concentration of SO2 dropped significantly in the past few years. Actually, this trend has been reported in other Chinese cities [14,15].
Linear regression of annual PM10 concentrations from 2001 to 2014 indicates that PM10 pollution was actually alleviated to some extent (Figure 2). The calculated Sen’s slope of the trend was found to be −2.0 µg/m3 per year at the 95% confidence level. Similar trends have been reported for other Chinese cities [16]. Owing to the various control measures and the advances achieved in manufacturing technology, emissions of fly ash in Wuhan in the last decade exhibited a significant downward trend as shown in Figure 3. Due to the moderately positive correlation between the annual PM10 concentration and fly ash emissions (r = 0.67, p < 0.01), the reduction in fly ash emissions probably contributed in part to the downward trend in the PM10 concentration. However, it is worth mentioning that the PM10 concentrations were still well above the annual standard of 70 µg/m3. In addition, small fluctuations can be observed in Figure 2. In particular, there was a sudden rise in 2013, implying that particulate matter control is really challenging.
The annual variation for the NO2 concentration is not as significant as PM10 and SO2 (Figure 2). However, the Mann-Kendall test indicates a strong increasing trend at the 0.01 significance level and Sen’s method gives a positive slope of 0.67 µg/m3 per year. Further, the NO2 concentrations exceeded the class II standard in CNAAQS, which requires the annual mean to be below 40µg/m3. In China, not much effort was put into NO2 emission control before the 12thFYP (2011–2015). As a matter of fact, no emission data for NO2 was recorded in the statistical yearbook. That is the reason why Figure 3 only plotted the fly ash and SO2 emissions. Fortunately, control of the NO2 emission became the mandatory target in the 12th FYP, when the PM2.5 pollution attracted worldwide attention and the important role of NO2 in secondary PM2.5 formation was understood. A downward trend in the NO2 level is hopefully expected in the following years.
Figure 4 summarizes the percentage of days when the 24h mean concentrations of all criteria pollutants satisfied the national air quality standard. It is clear that the percentage increased slightly over the years until 2012. However, it should be kept in mind that the PM2.5 concentration was not considered before 2012. Immediately after the new air quality standard (GB3096-2012) was put into effect in 2013 and PM2.5 was included in air quality assessment, the percentage of days with good air quality declined abruptly. Although the air quality in Wuhan improved to a certain degree in the last decade in terms of PM10 and SO2, the air pollution problem is still very serious.

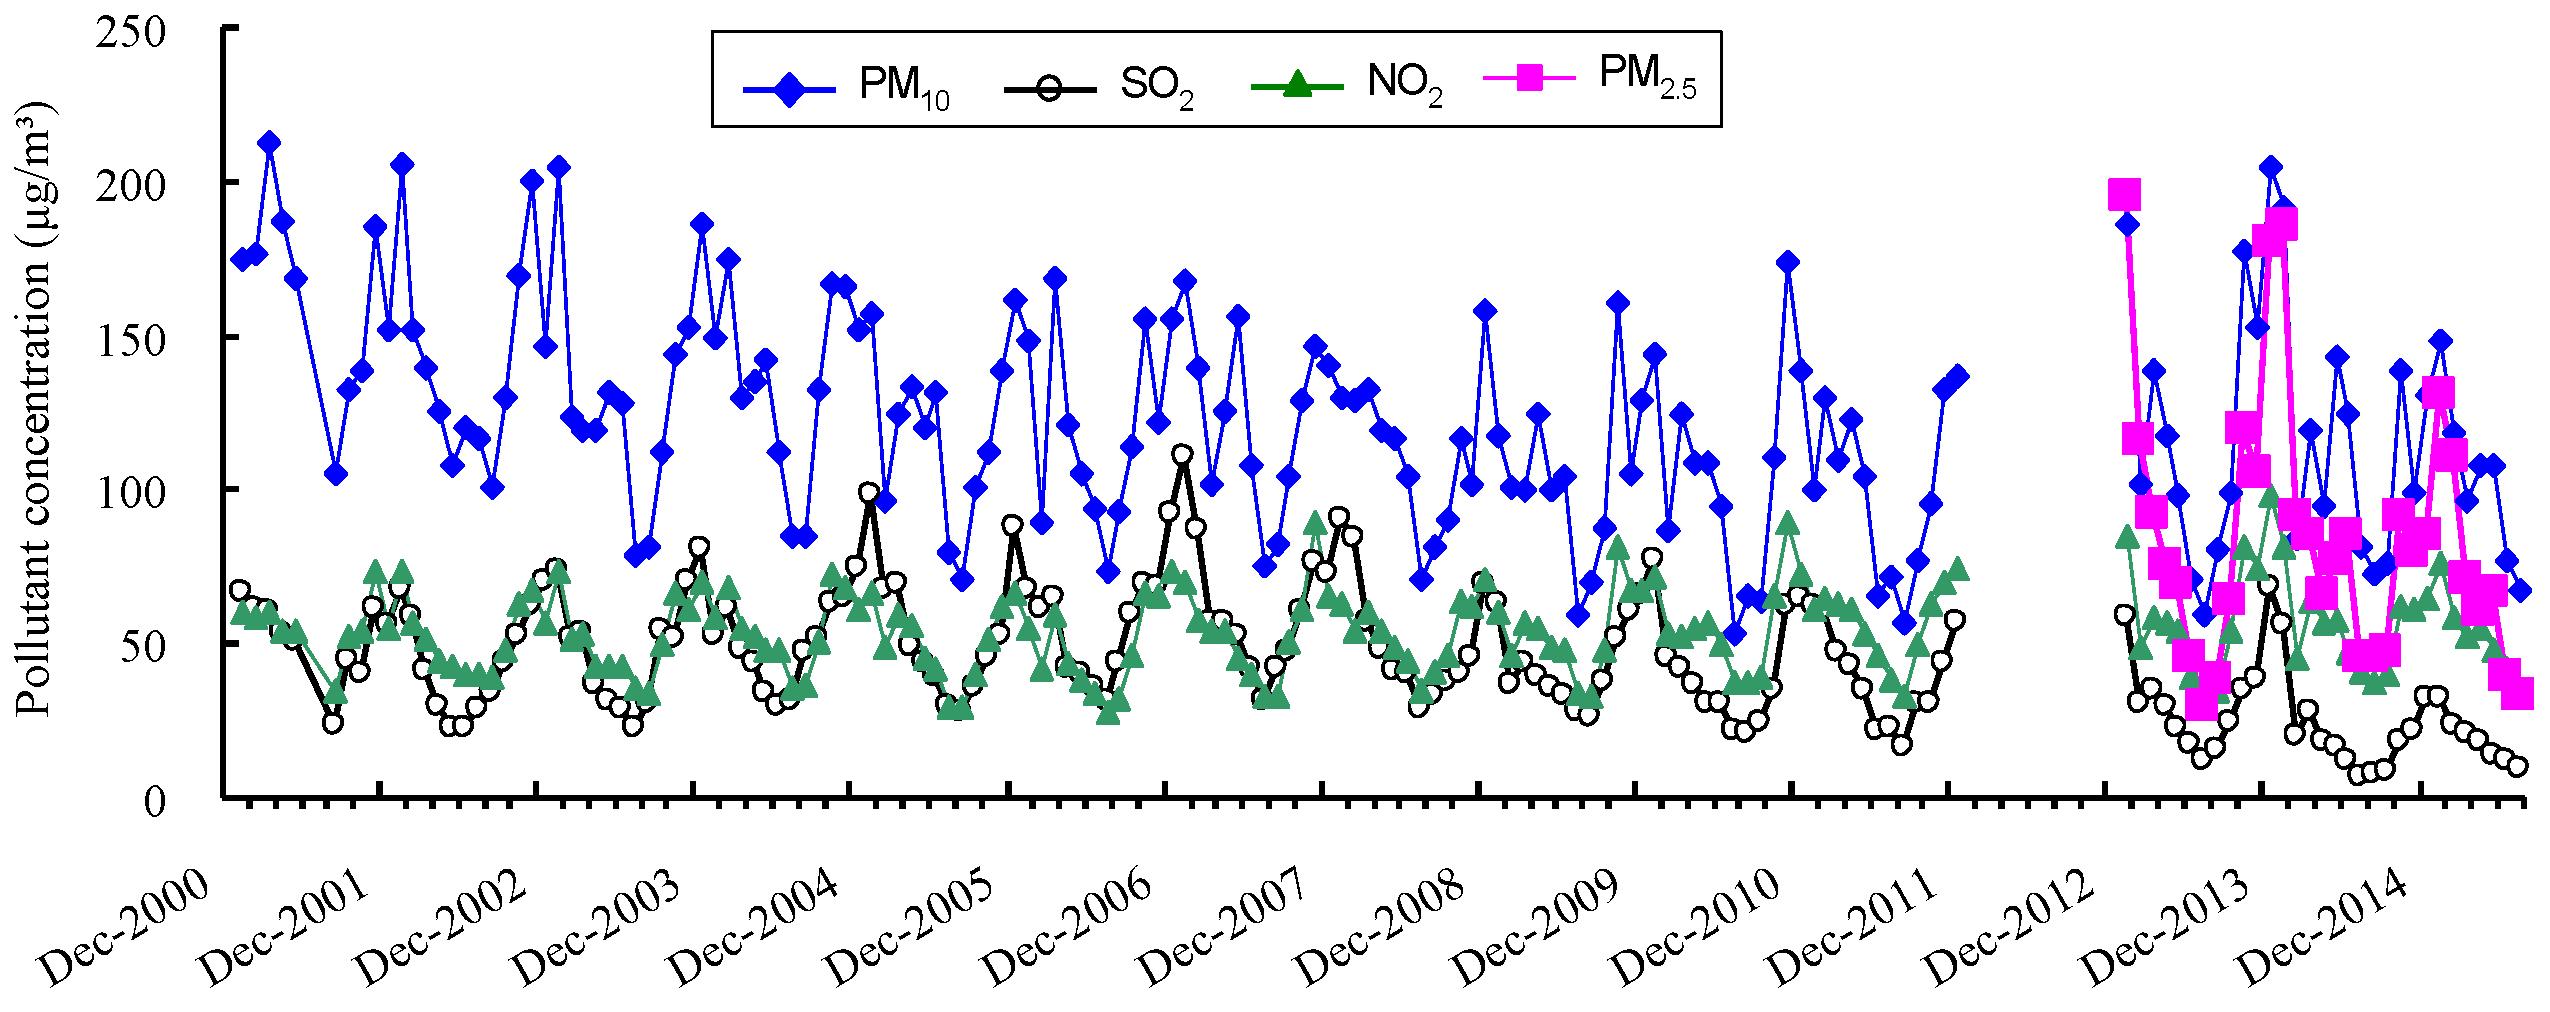
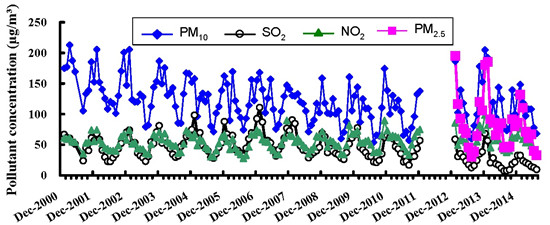
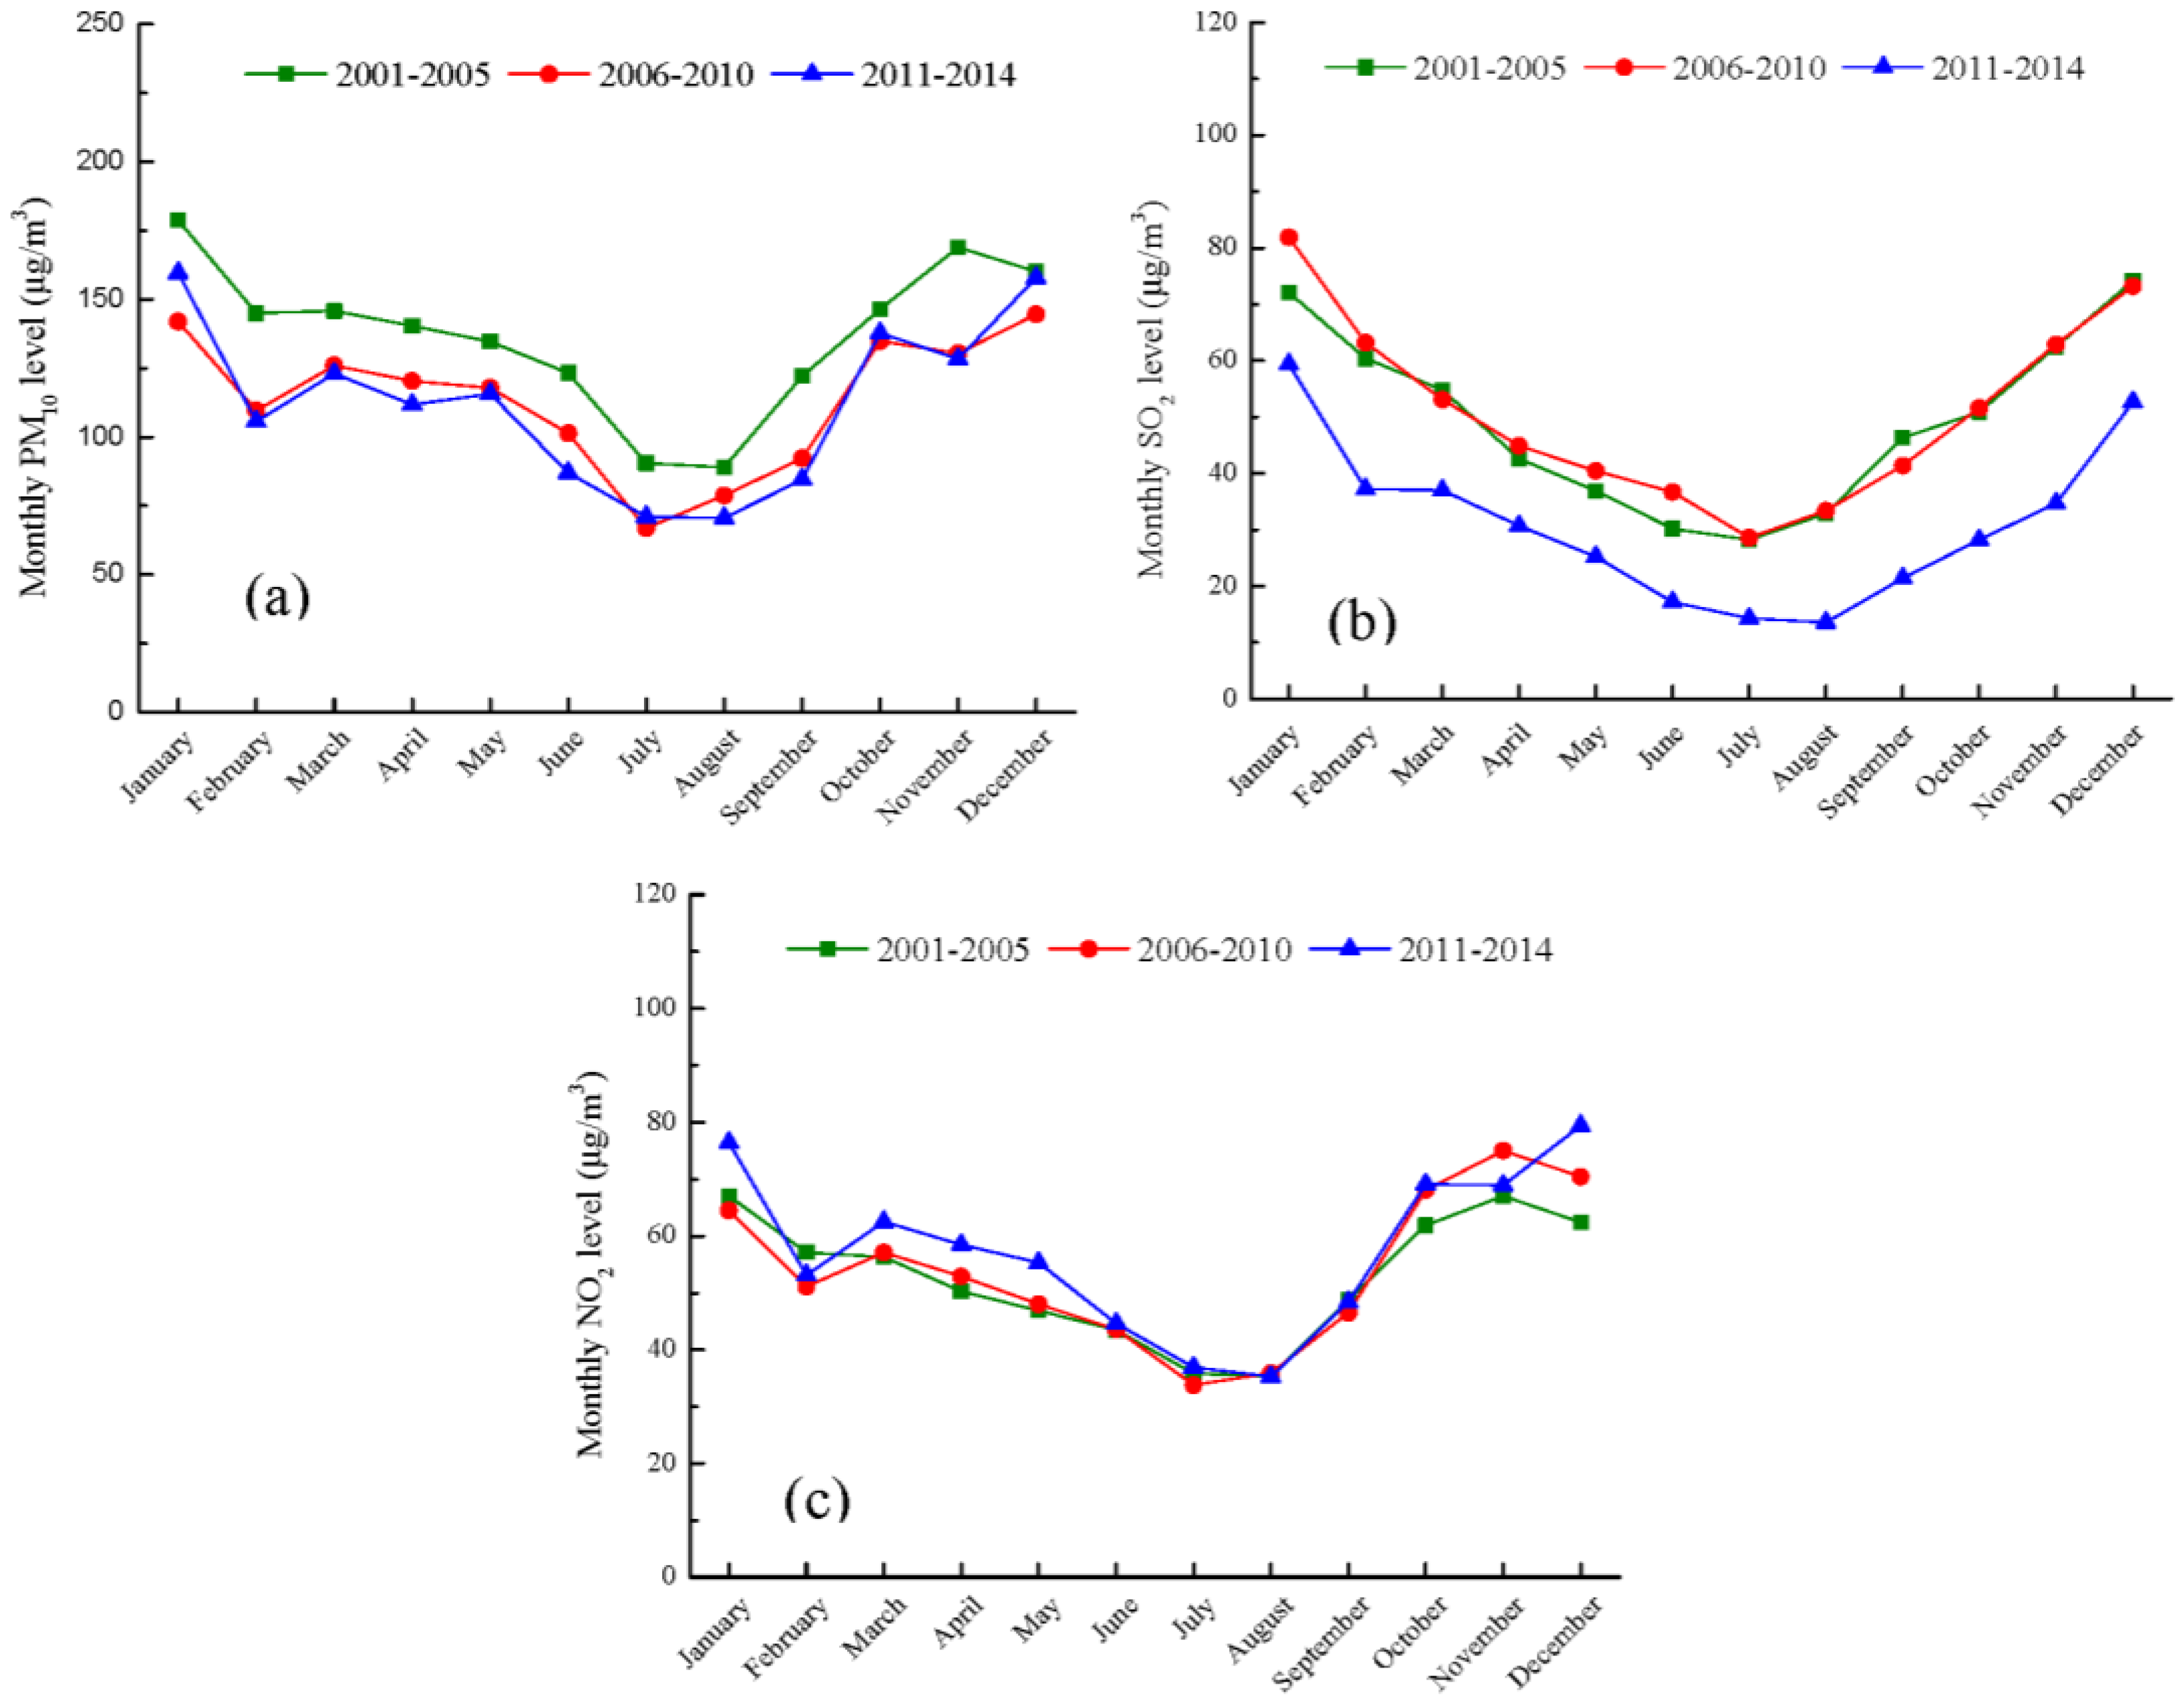
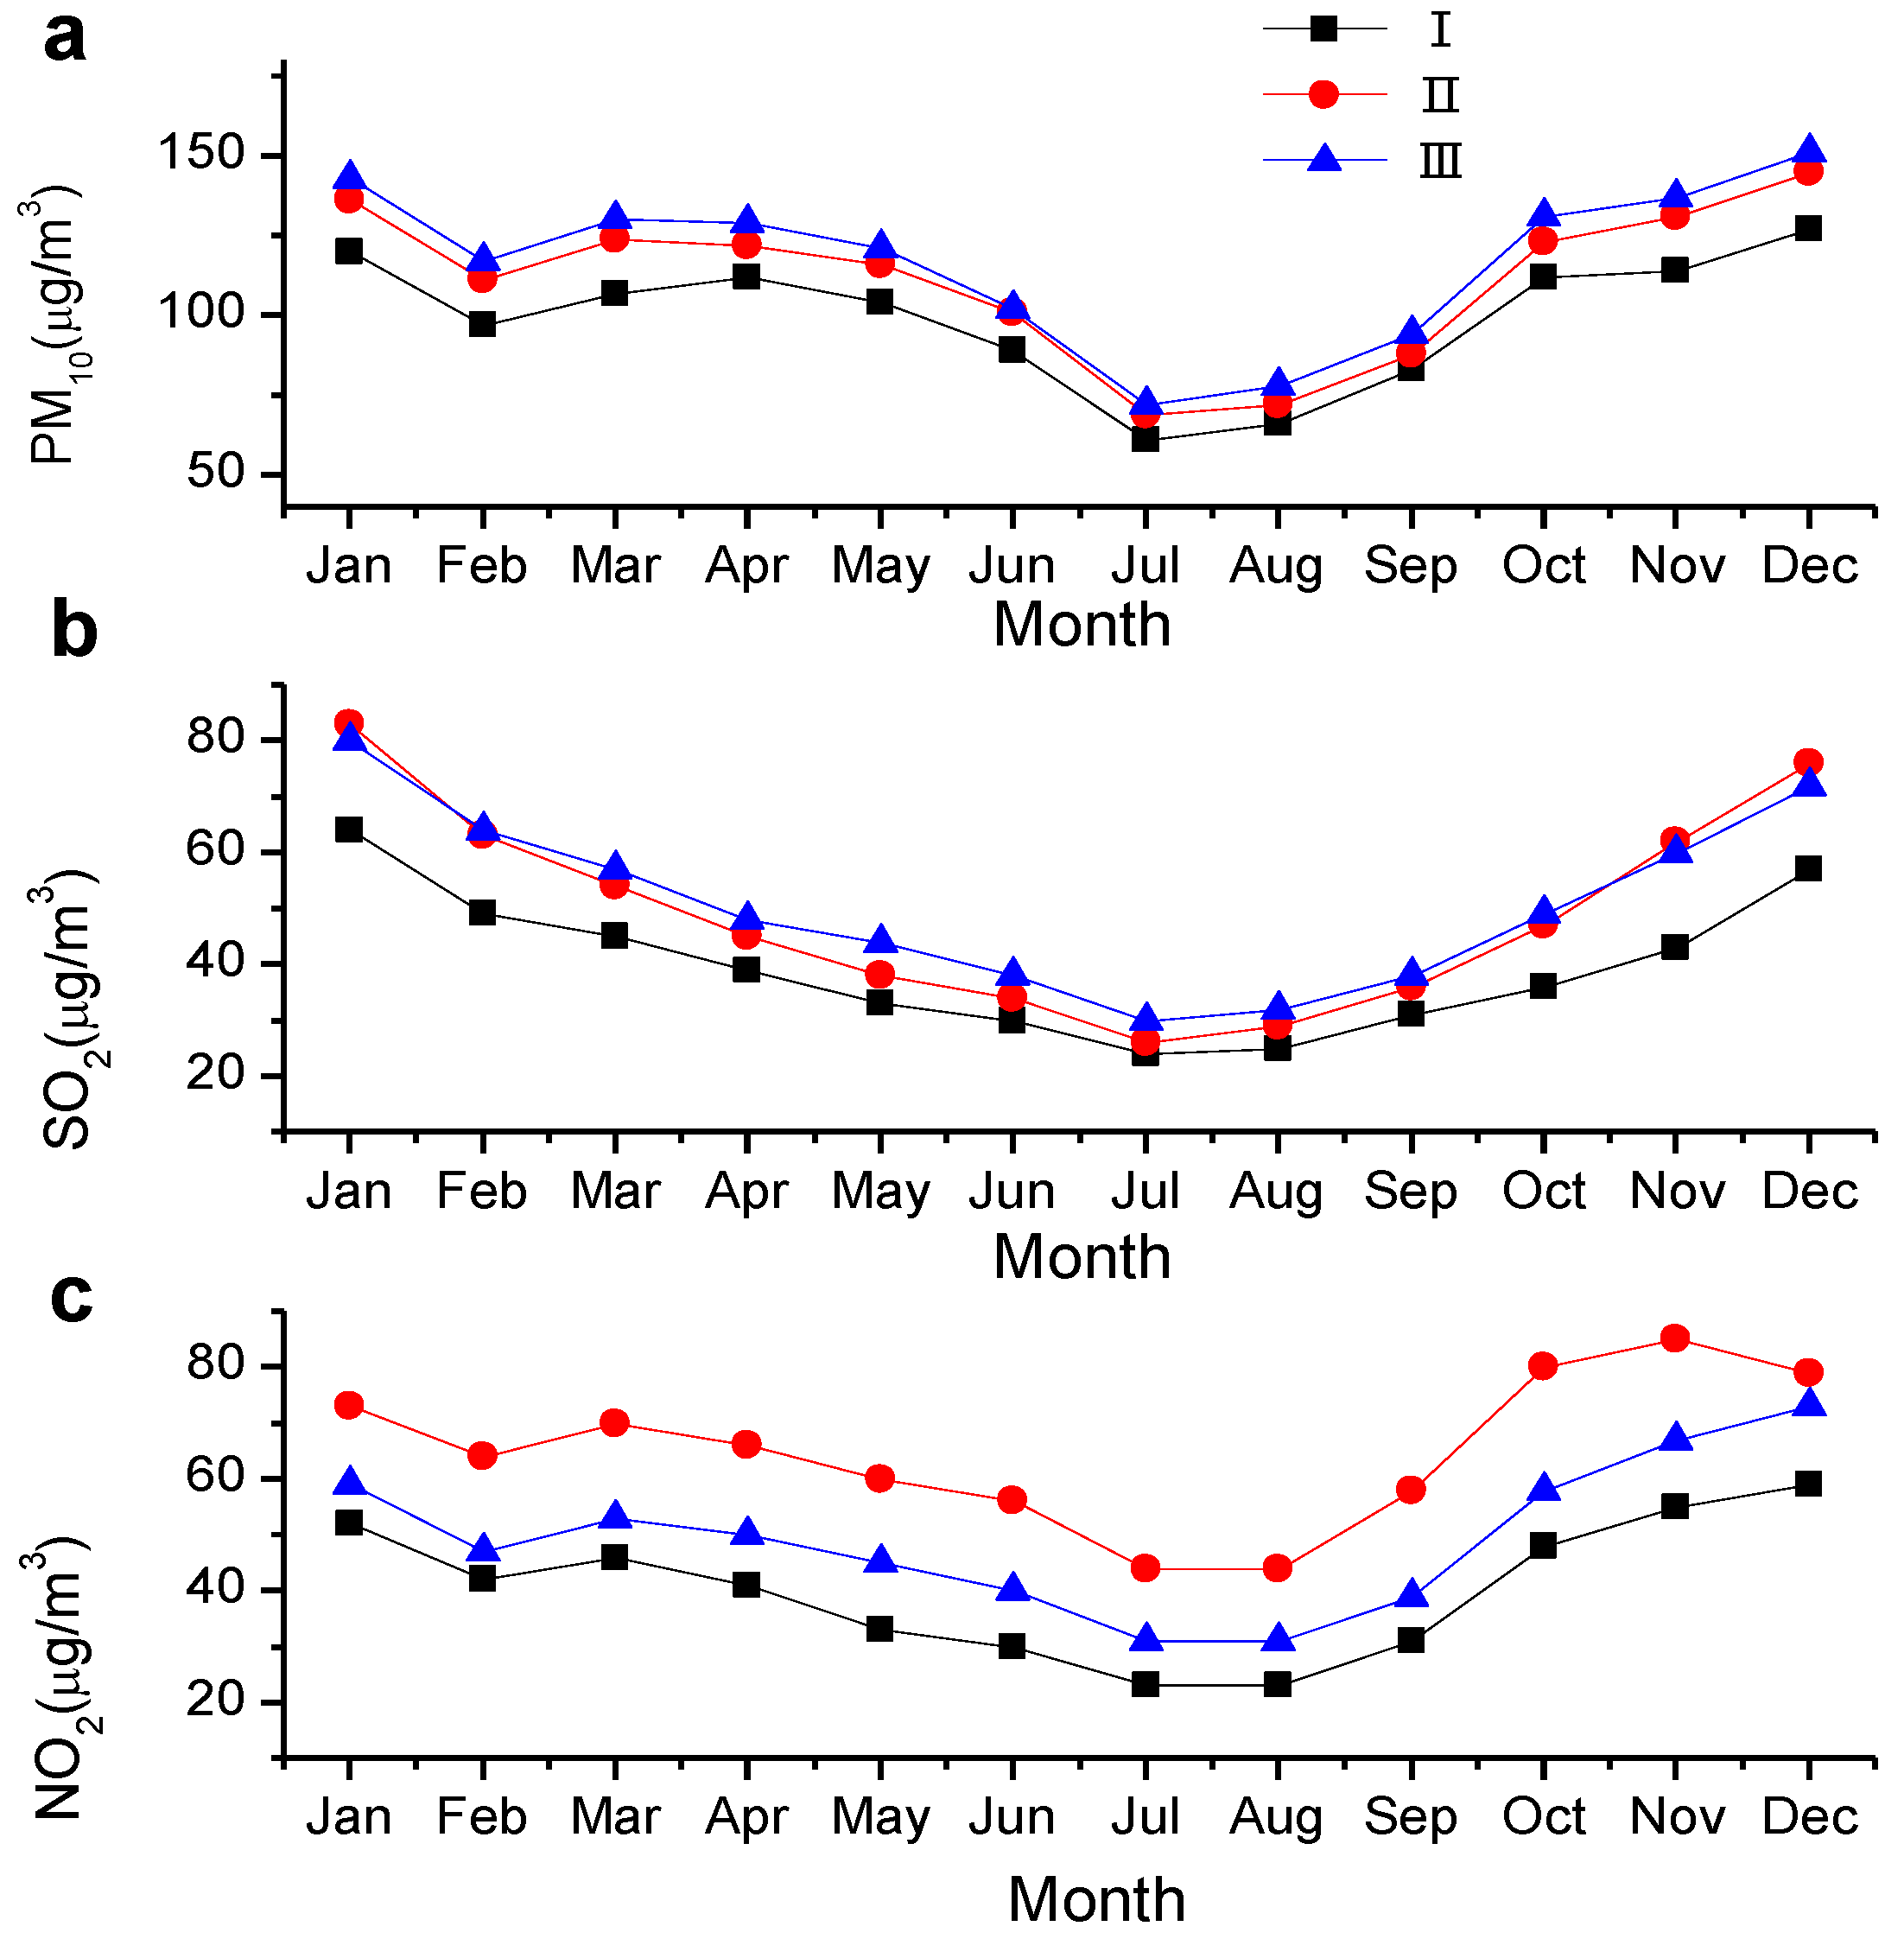
3.2. Monthly Variation of Air Pollution

Figure 5 presents the average monthly variations of SO2, NO2, and PM10 during the period of 2001–2014 except for the year 2012. In addition, PM2.5 data from 2013 to 2014 were included. It is observed that the monthly variations of pollutants demonstrated “V”-shape curves, which indicate the low pollution levels in summer and high levels on both sides. The varying patterns of concentrations are almost identical during the same period in each year, i.e., low levels during summer (June, July and August) and high levels in other months. It should be mentioned that the concentrations in September were as low as those in the summer months. September in Wuhan might be regarded as a summer month in terms of the air quality level.
In order to look at more closely the monthly variation, average monthly concentrations were taken over the 10th FYP (2001–2005), 11th FYP (2006–2010) and the first four years of the 12th FYP (2011–2014), respectively. Figure 6 compares the monthly average concentrations of individual pollutants during each FYP period. The monthly SO2 levels during the 12th FYP were generally lower than those in other two FYP periods, which indicates again the effectiveness of the SO2 control measures implemented. The PM10 levels during 2001–2015 were obviously higher than those during the 11th and 12th FYP periods and the trend was consistent for each month. On the other hand, the concentration variations of NO2 appeared randomly over the three FYP periods, implying great efforts should be made to achieve a descending trend. Further, the SO2 concentrations in summer (June, July, August, September) were consistently lower than those in spring (March, April, May) and autumn (October, November). The highest SO2 level was observed in winter (December, January, February). A similar trend is applied to PM10 and NO2, but with some small fluctuations.

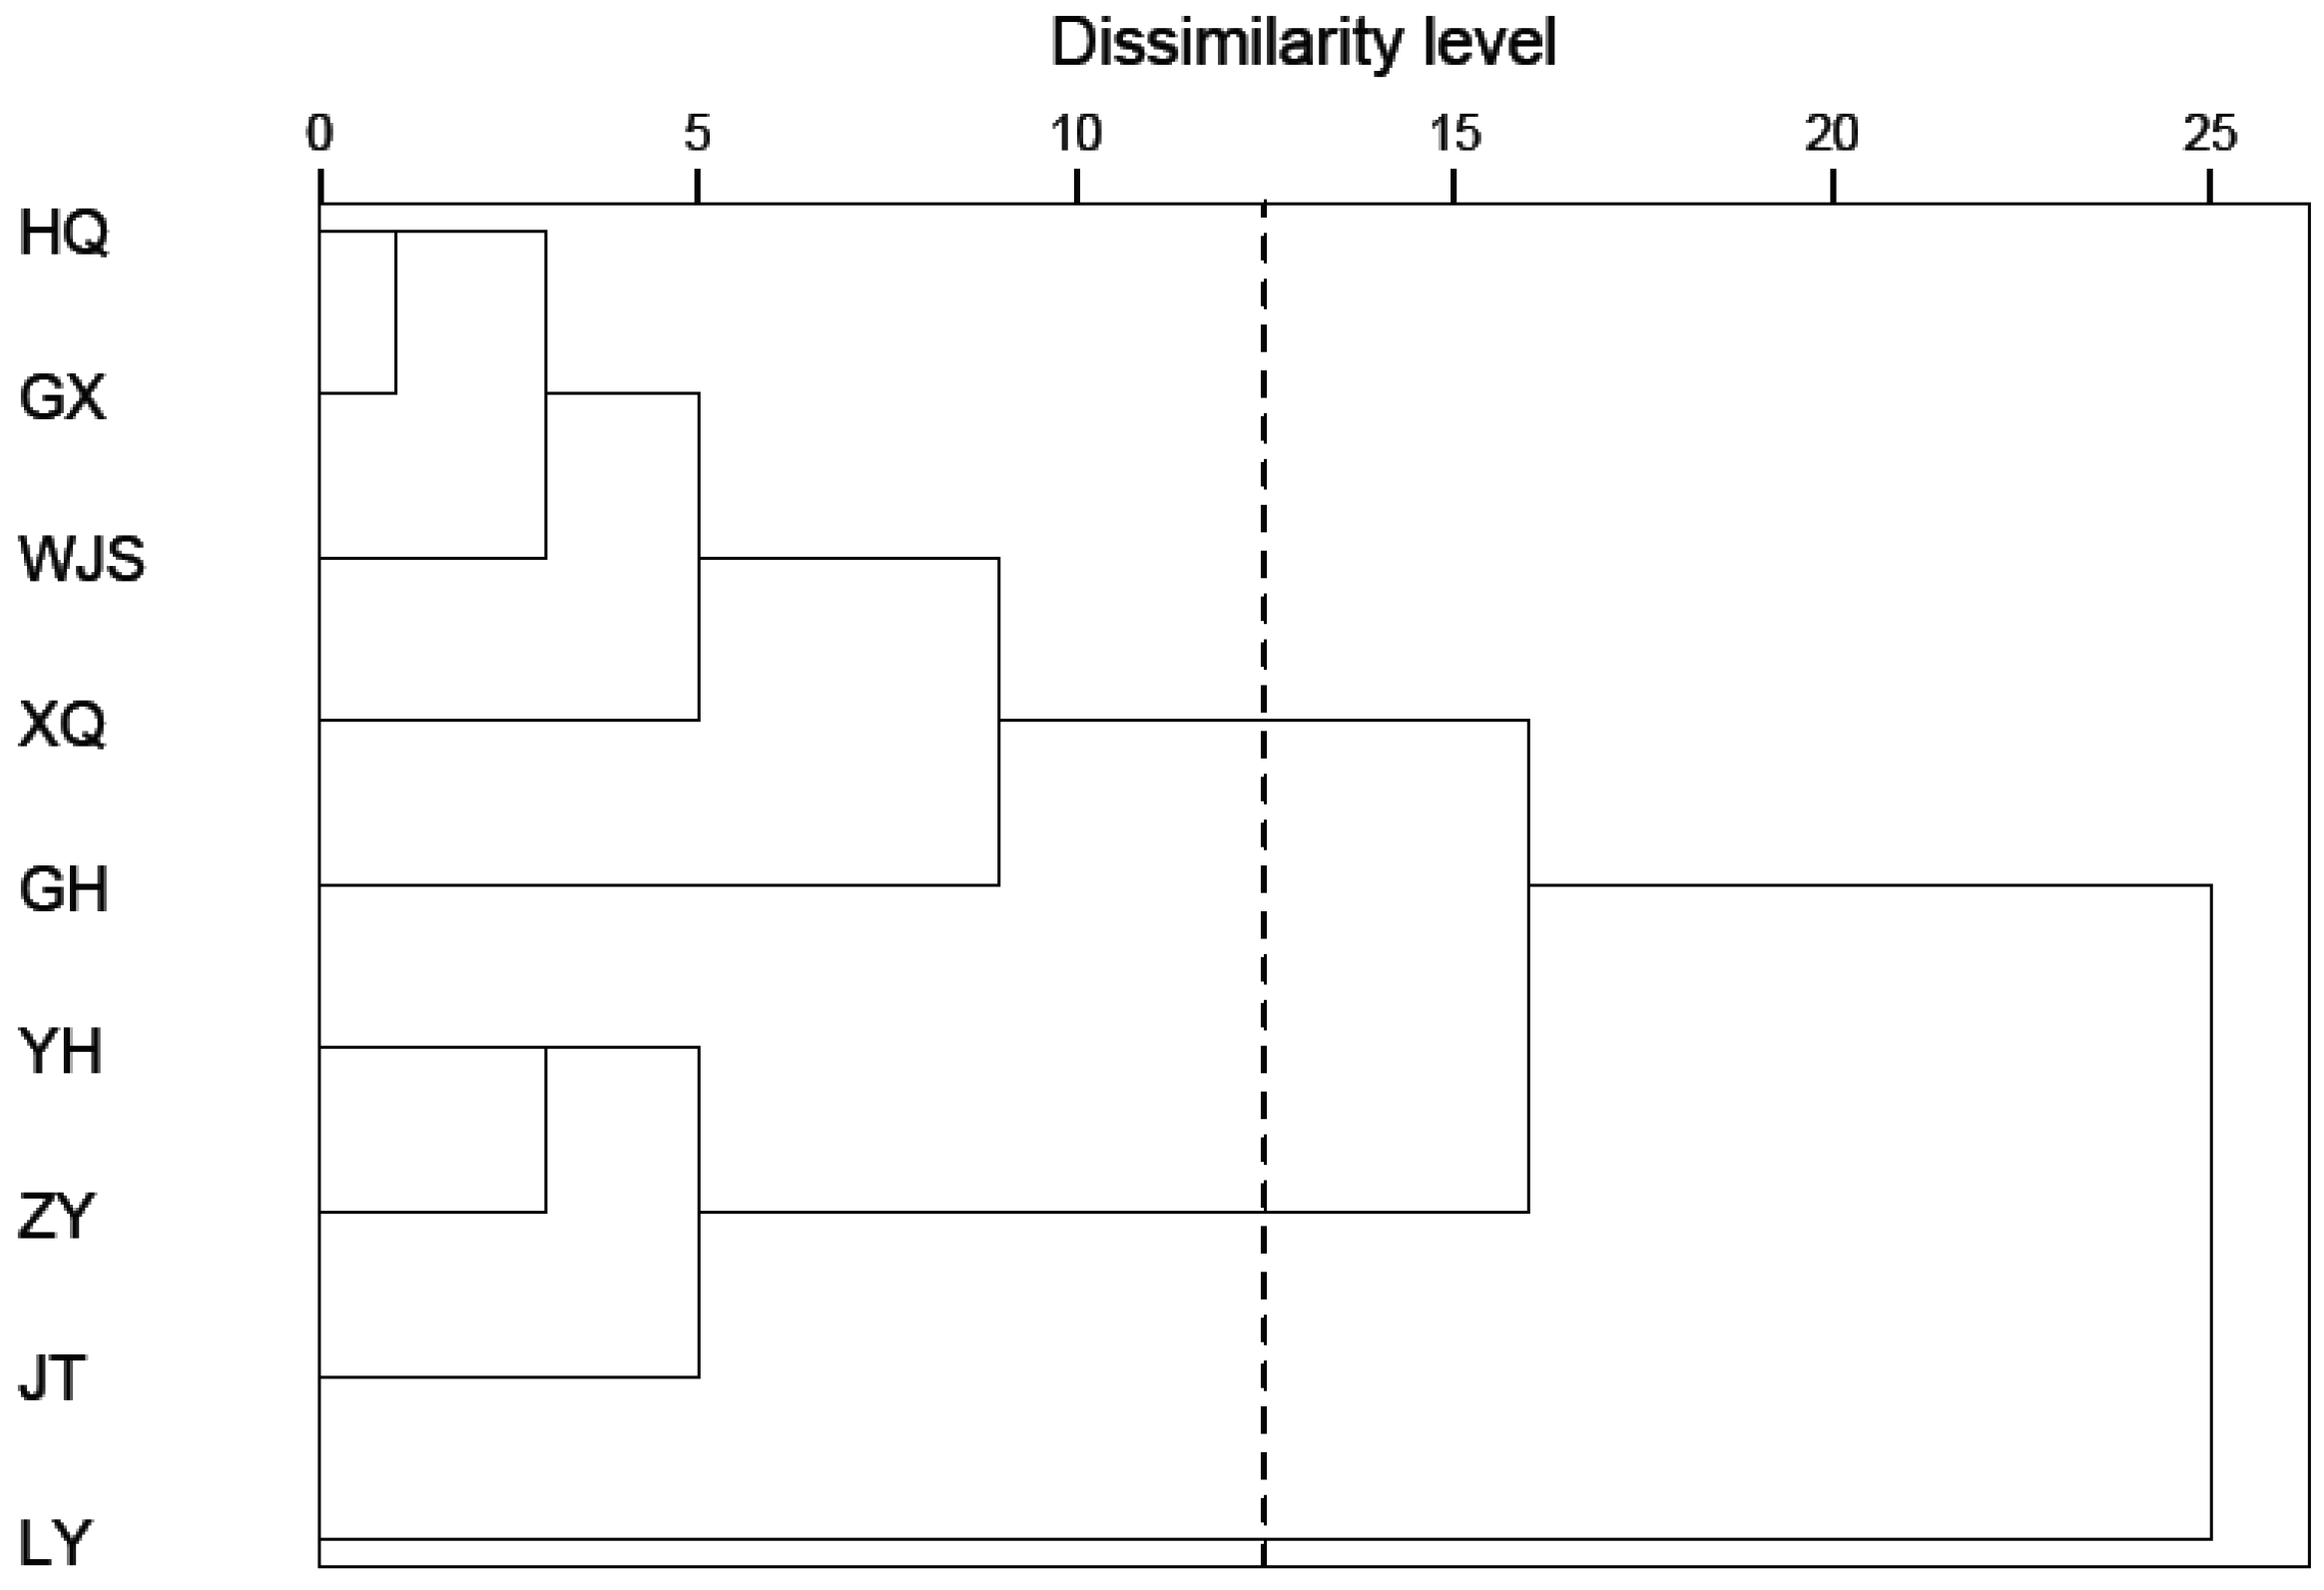
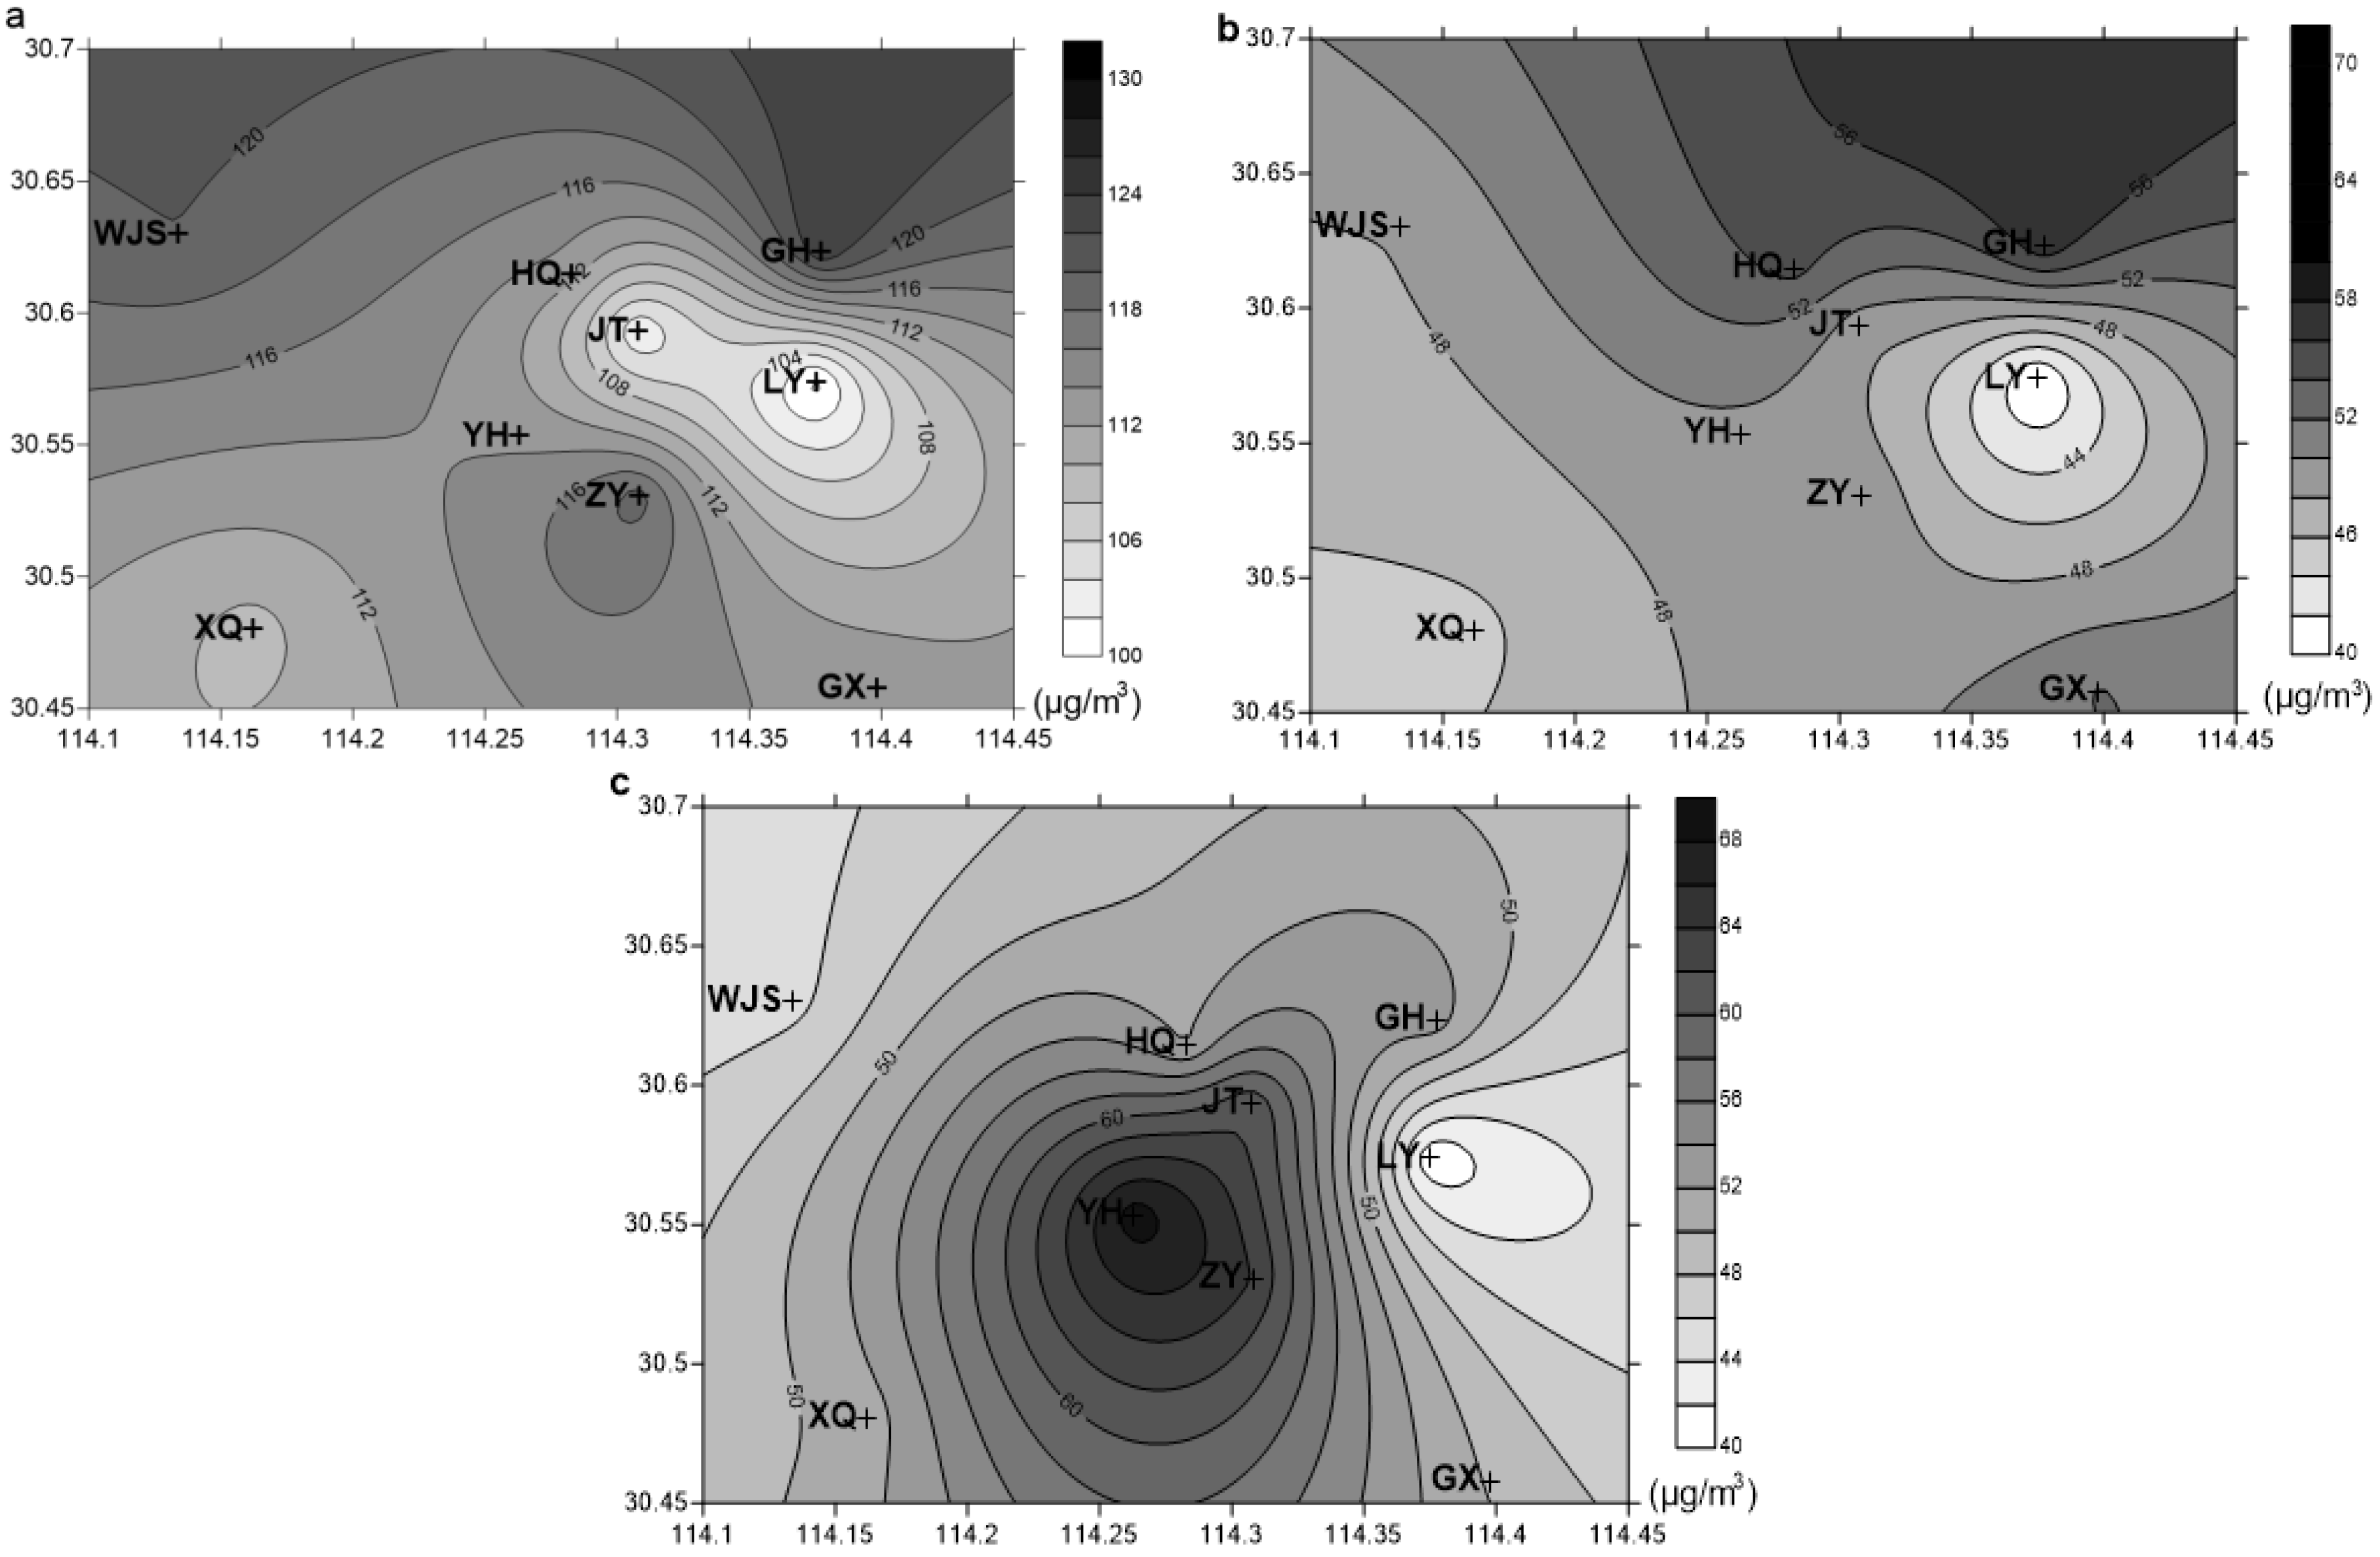
3.3. Spatial Distribution of Air Pollutants

Hierarchical Agglomerative Cluster Analysis (HACA) was carried out on concentration data set of PM10, SO2, and NO2 to identify the spatial variation of nine monitoring stations based on their similarity levels. The dendrograms from the cluster analysis are given in Figure 7. It can be seen that the nine stations were classified into three clusters. Cluster I accommodated only the LY site. Cluster II was formed with the three stations of YH, ZY, and JT, while Cluster III took the remaining five stations of HQ, GX, XQ, WJS, and GH. To further explore the pollution characteristics in each cluster, contours of pollutant concentrations were plotted in Figure 8. It is obvious that the air quality in Cluster I is relatively the best with the lowest PM10, NO2, and SO2 levels. LY station within Cluster I is located in the famous East Lake scenic area, where industrial activity and construction of high-rise buildings are forbidden. The local pollutant sources are scarce and the geometrical layout is favorable for pollutant dispersion.
As can be seen from Figure 1, stations of Cluster II are located right in the city centers, which are characterized by high concentrations of commercial activities and the heaviest traffic loadings almost entirely around the clock. Consequently, the highest NO2 concentrations were observed in this cluster (Figure 8c). On the other hand, PM10 and SO2 levels were lower than those in Cluster 3. Stations in Cluster 3 are in the outskirts of the city, where various industrial activities take place. For example, one of the biggest steel companies is located near the GH station, and the region of the XQ station is famous for motor vehicle manufacturing. Therefore, Cluster III features severe PM10 and SO2 pollution (Figure 8a,b).
Figure 9 shows the monthly concentrations averaged over those monitoring sites belonging to the same cluster. As expected, Cluster I had the lowest concentrations each month for all three pollutants. The NO2 concentration in Cluster II was the highest, and the highest levels of PM10 and SO2 appeared in Cluster III. The trend is exactly the same as demonstrated in Figure 8, confirming the correctness of the clustering result.

4. Conclusions

In this study, air pollution indexes for SO2, PM10, and NO2 were gathered from the Wuhan Environmental Protection Bureau and converted to mass concentrations. Using these data, status and variation trends of urban air quality in Wuhan were assessed through descriptive statistics. Furthermore, hierarchical cluster analysis (HCA) was performed on the concentration data set from nine monitoring stations to identify the spatial pattern of air quality in urban Wuhan.
Thanks to the environmental regulations and pollution control measures, air quality has slightly improved over the recent years. The PM10 concentration showed a clearly downward trend before rising in 2013. In addition, the SO2 concentration has steadily decreased since 2008, due to the strict implementation of flue gas desulphurization in coal-fired power plants. A notable advance was that the number of days with good air quality increased continuously until 2012. However, it dropped abruptly in 2013 due to the implementation of new CNAAQS (GB3095-2012), in which PM2.5 is taken into account. The variation in annual NO2 concentration was negligible before an increasing trend appeared in 2007, because of the lag in emission control legislations and the increase in fuel consumption by power plants and vehicles. Nevertheless, it is evident that current level of air pollutants, especially PM10 and PM2.5, is still quite high. Seasonal variation exists consistently for all the pollutants, with the highest concentrations in winter and the lowest in summer when the meteorological condition favors pollutant dispersion.
Based on the concentrations of PM10, SO2, and NO2 over the years, nine urban monitoring sites were classified into three groups. Group I consists of only the LY site, which is located in the famous East Lake scenic area with the best air quality. Group II corresponds to three monitoring sites with heavily trafficked roads nearby, where relatively severe NO2 pollution occurs. Group III is comprised of the remaining five sites, characterized by PM10 and SO2 pollution.

Acknowledgments

This study was financially supported by the National Science Foundation of China (No. 41275164) and by the Ministry of Science and Technology in South Korea through the Institute of Science and Technology for Sustainability (United Nations University & Gwangju Institute of Science and Technology Joint Programme) in 2015.

Author Contributions

All authors contributed immensely. Rongbiao Xiang designed the study and modified the paper; Jiabei Song performed the cluster analysis and drafted the paper. Wu Guang and Linjun Li collected and analyzed the data.

Conflicts of Interest

The authors declare no conflict of interest.

References

  1. WHO. Burden of Disease from the Joint Effects of Household and Ambient Air Pollution for 2012; World Health Organization: Geneva, Switzerland, 2014. [Google Scholar]
  2. Kan, H.; Chen, B.; Hong, C. Health impact of outdoor air pollution in China: Current knowledge and future research needs. Environ. Health Perspect. 2009, 117. [Google Scholar] [CrossRef]
  3. Chinese Ministry of Environmental Protection (CMEP). Report on the State of Environment in China in 2013; CMEP: Beijing, China, 2014. (In Chinese) [Google Scholar]
  4. Matus, K.; Nam, K.M.; Selin, N.E.; Lamsal, L.N.; Reilly, J.M.; Paltsev, S. Health damages from air pollution in China. Glob. Environ. Chang. 2012, 22, 55–66. [Google Scholar] [CrossRef]
  5. Wei, F.; Teng, E.; Wu, G.; Hu, W.; Wilson, W.E.; Chapman, R.S.; Pau, J.C.; Zhang, J. Ambient concentrations and elemental compositions of PM10 and PM2.5 in four Chinese cities. Environ. Sci. Technol. 1999, 33, 4188–4193. [Google Scholar] [CrossRef]
  6. Querol, X.; Zhuang, X.G.; Alastuey, A.; Viana, M.; Lv, W.W.; Wang, Y.X.; Lopez, A.; Zhu, Z.C.; Wei, H.M.; Xu, S.Q. Speciation and sources of atmospheric aerosols in a highly industrialized emerging mega-city in Central China. J. Environ. Monit. 2006, 8, 1049–1059. [Google Scholar] [CrossRef] [PubMed]
  7. Cheng, H.R.; Gong, W.; Wang, Z.W.; Zhang, F.; Wang, X.M.; Lv, X.P.; Liu, J.; Fu, X.X.; Zhang, G. Ionic composition of submicron particles (PM1.0) during the long-lasting haze period in January 2013 in Wuhan, central China. J. Environ. Sci. 2014, 26, 810–817. [Google Scholar]
  8. Feng, Q.; Wu, S.; Du, Y.; Li, X.D.; Ling, F.; Xue, H.P.; Cai, S.M. Variations of PM10 concentrations in Wuhan, China. Environ. Monit. Assess. 2011, 176, 259–271. [Google Scholar] [CrossRef] [PubMed]
  9. Qu, W.J.; Arimoto, R.; Zhang, X.Y.; Zhao, C.H.; Wang, Y.Q.; Sheng, L.F.; Fu, G. Spatial distribution and interannual variation of surface PM10 concentrations over eighty-six Chinese cities. Atmos. Chem. Phys. 2010, 10, 5641–5662. [Google Scholar] [CrossRef]
  10. Salmi, T.; Määttä, A.; Anttila, P.; Ruoho-Airola, T.; Amnell, T. Detecting Trends of Annual Values of Atmospheric Pollutants by the Mann-Kendall Test and Sen’s Slope Estimates—The Excel Template Application MAKESENS; Report Code FMI-AQ-31; Finnish Meteorological Institute: Helsinki, Finland, 2002. [Google Scholar]
  11. Pavón-Domínguez, P.; Jiménez-Hornero, F.J.; Gutiérrez de Ravé, E. Proposal for estimating ground-level ozone concentrations at urban areas based on multivariate statistical methods. Atmos. Environ. 2014, 90, 59–70. [Google Scholar] [CrossRef]
  12. Dominick, D.; Juahir, H.; Latif, M.T.; Zain, S.M.; Aris, A.Z. Spatial assessment of air quality patterns in Malaysia using multivariate analysis. Atmos. Environ. 2012, 60, 172–181. [Google Scholar] [CrossRef]
  13. Zema, D.A.; Nicotra, A.; Tamburino, V.; Zimbone, S.M. Performance assessment of collective irrigation in Water Users’ Associations of Calabria (Southern Italy). Irrig. Drain. 2015, 64, 314–325. [Google Scholar] [CrossRef]
  14. Wang, Y.; Zhang, Q.Q.; He, K.; Zhang, Q.; Chai, L. Sulfate-nitrate-ammonium aerosols over China: Response to 2000–2015 emission changes of sulfur dioxide, nitrogen oxides, and ammonia. Atmos. Chem. Phys. 2013, 13, 2635–2652. [Google Scholar] [CrossRef]
  15. Wang, L.T.; Zhang, P.; Tan, S.B.; Zhao, X.J.; Cheng, D.D.; Wei, W.; Su, J.; Pan, X.M. Assessment of urban air quality in China using Air Pollution Indices (APIs). J. Air Waste Manag. 2013, 63, 170–178. [Google Scholar] [CrossRef]
  16. Jiang, J.K.; Zhou, W.; Cheng, Z.; Wang, S.X.; He, K.B.; Hao, J.M. Particulate matter distributions in China during a Winter Period with Frequent Pollution Episodes (January 2013). Aerosol Air Qual. Res. 2015, 15, 494–503. [Google Scholar] [CrossRef]
Figure 1. Location of the nine monitoring stations in urban Wuhan.
Atmosphere 07 00056 g001
Figure 2. Annual mean concentrations of air pollutants in urban Wuhan.
Atmosphere 07 00056 g002
Figure 3. SO2 and fly ash emissions in urban Wuhan.
Atmosphere 07 00056 g003
Figure 4. Percentage of days with good air quality in each year.
Atmosphere 07 00056 g004
Figure 5. Monthly average concentrations of pollutants during 2001–2014.
Atmosphere 07 00056 g005
Figure 6. Monthly variation of air pollutant levels of (a) PM10; (b) SO2; (c) NO2.
Atmosphere 07 00056 g006
Figure 7. Dendrogram of different clusters of air quality monitoring stations (y-axis reports the level of dissimilarity, while the dotted line is the clustering level).
Atmosphere 07 00056 g007
Figure 8. Spatial distribution of annual mean concentration of (a) PM10; (b) SO2; (c) NO2.
Atmosphere 07 00056 g008
Figure 9. Monthly concentration averaged over monitoring sites within the same cluster. (a) PM10; (b) SO2; (c) NO2.
Atmosphere 07 00056 g009
Table 1. Annual average concentration limits (Class II) as regulated in the standard.
PollutantOld Standard (µg/m3)New Standard (µg/m3)
SO26060
NO24040
PM1010070
PM2.5--35

