Article

Changing Trends and Abrupt Features of Extreme Temperature in Mainland China from 1960 to 2010

1
Institute of Eco-environment and Agrometeorology, Chinese Academy of Meteorological Sciences, No. 46 Zhongguancun South Street, Beijing 100081, China
2
Collaborative Innovation Centre on Forecast Meteorological Disaster Warning and Assessment, Nanjing University of Information Science & Technology, Nanjing 210044, China
3
Gansu Key Laboratory of Arid Climatic Change and Reducing Disaster/Key Laboratory of Arid Climatic Change and Disaster Reduction of CMA/Institute of Arid Meteorology, China Meteorological Administration, Lanzhou 730020, China
4
National Meteorological Information Centre, China Meteorological Administration, Beijing 100081, China
*
Author to whom correspondence should be addressed.
These authors contributed equally to this work.
Atmosphere 2016, 7(2), 22; https://doi.org/10.3390/atmos7020022
Submission received: 10 November 2015 / Revised: 17 January 2016 / Accepted: 18 January 2016 / Published: 2 February 2016
(This article belongs to the Special Issue Climate Variable Forecasting)

Abstract

:
Studies based on the 10th (90th) percentiles as thresholds have been presented to assess moderate extremes in China and globally. However, there has been notably little research on the occurrences of high extremes of warm days and hot days (TX95p and TX99p) and cold nights and very cold nights (TN05p and TN01p), based on the 95th and 99th (5th and 1st) percentiles of the daily maximum (minimum) temperature data at a certain station in the period 1971–2000, which have more direct impacts on society and the ecosystem. The trends analyses of cool nights or warm days are based upon the hypothesis that expects a linear trend and no abrupt change. However, abrupt changes in the climate, especially in extreme temperatures, have been pointed to as a major threat to ecosystem services. This study demonstrates that (1) the mean frequencies of TX95p and TX99p increased by 1.80 day/10 year and 0.62 day/10 year, respectively, and that those of TN05p and TN01p decreased by 3.18 day/10 year and 1.01 day/10 year, respectively, in mainland China. Additionally, the TX95p and TX99p increased significantly by 50.42% and 58.21%, respectively, while the TN05p and TN01p of all of the stations decreased significantly by 83.76% and 76.48%, respectively. Finally, (2) the TX95p and TX99p trends underwent abrupt changes in the 1990s or 2000s, but the trends of TN05p and TN01p experienced abrupt changes in the late 1970s and early 1980s. After the abrupt change points, the trend of warm and hot days increased more rapidly than before in most regions, but the trend of cold days and very cold days decreased more slowly than before in most regions, which indicates a greater risk of heat waves in the future.

1. Introduction

An increase in the average global temperature since the mid-20th century has been observed, and the warming of the climate is unequivocal [1]. Global warming may have increased the frequency and intensity of extreme weather and climate events [2,3,4]. Compared to the mean temperature increase, changes in regional temperature extremes have more direct impacts on society and the ecosystem [5]. Extremely hot summers can drastically reduce agricultural production [6,7,8], increase energy consumption [9], and lead to hazardous health conditions [10,11,12]. Thus, understanding and predicting the spatial and temporal variability and trends of extreme weather events is crucial for the protection of socio-economic well-being and for understanding extreme weather events for mitigation of their regional impact.
To analyse the variations in extreme climate, the Expert Team on Climate Change Detection and Indices (ETCCDI) defined 27 extreme temperature and precipitation indices [13]. Two main types of extreme indices were developed: the number of days in a year exceeding specific thresholds that have fixed values (absolute thresholds) and thresholds that are relative (percentile thresholds) to a base period climate [14]. Indices of the number of days above or below percentile thresholds are more suitable for spatial comparisons of extremes than those based on absolute thresholds [13]. Thus, extreme temperature indices that are based on minimum temperatures below the long-term 10th percentile and/or maximum temperatures above the long-term 90th percentile have been widely used in published studies in North America, South America, Europe, Asia, Australia, and on the global scale [2,15,16,17,18,19,20,21,22]. The more extreme an event, the more likely it is to cause societal or environmental damage. However, most of the studies based on the 10th (90th) percentiles as thresholds are set to assess moderate extremes that, on average, occur 36.5 times every year (10 per cent of 365 days) rather than high-impact weather events that occur once or twice per year. Compared to the moderate extremes, the high extreme temperatures that are based on 5th and 1st (95th and 99th) percentiles, which occur on average 18.25 times and 3.65 times, respectively, every year (5 per cent and 1 per cent of 365 days), have higher potential risks on people’s health and lifestyles, the economy, society, and the environment. However, there has been very little research on the occurrences of high extreme warm days and cold nights according to the 5th or 1st (95th or 99th) percentiles.
More than 70% of the Earth’s land area has experienced a significant reduction in the number of cool nights but an insignificant increase in warm days [2]. In China however, regional analyses have reported that a significant reduction in cool nights and a significant increase in warm days have occurred [23,24,25,26]. Along with these regional analyses in China, the changes are much less spatially coherent, even though significant trends are found in more than half of the stations in the entire China mainland. More updated studies are needed to explain the spatial heterogeneity of the temporal trends of temperature extremes in the different climate regions in China.
Analyses of the increasing or decreasing trends in cool nights or warm days are based on the hypothesis that predicts linear, rather than abrupt, changes. Abrupt changes in climate factors, especially abrupt changes in extreme temperatures, have been pointed out as a major threat to ecosystems [27,28], because extreme temperature is an important physical restriction for some plants [29,30]. Several researchers investigated abrupt changes in the trends in temperature extremes in the northern hemisphere, North America, the northwest of China and mainland China [31,32,33,34,35]; for example, an abrupt change in both temperature and precipitation extremes in Northwest China occurred in around 1986 [34], but studies of the abrupt changes in temperature extremes in mainland China used the moderate extremes temperature indices based on the 10th (90th) percentiles. The abrupt changes of high extreme warm days and cold nights according to the 5th or 1st (95th or 99th) percentiles are studied less frequently.
In this paper, two questions are addressed with respect to temperature extremes: how the extreme temperature trends are spatially distributed in different regions in mainland China and when the extreme temperature trends’ abrupt changes occurred during 1960-2010. In this study, the 5th (95th) and 1st (99th) percentiles were individually considered to determine the thresholds of four indices (TX95p, TX99p, TN05p, TN01p) based on the 95th and 99th percentiles of daily Tmax and the 5th and 1st percentiles of daily Tmin, respectively. The spatial heterogeneity and abrupt features of the temporal trends of the four indices were considered across nine climate regions in mainland China from 1960 to 2010.

2. Data and Methods

2.1. Data Source and Quality Control

The National Meteorological Information Centre (NMIC) of the China Meteorological Administration (CMA) developed the first national homogenized temperature data set [36] and its more recent updated version [37]. To avoid inconsistency in percentile-based indices of temperature extremes, the newly homogenized data sets of daily maximum and minimum temperatures over the period from 1951 to 2010 at 825 stations were chosen for this study. Due to the fact that much daily data was missing at some stations, especially in the years prior to 1960, we chose a time series from 1960 to 2010. Further, according to the criteria that the series length should be no less than 51 years and that the missing data should be no more than 2% of the data points in every year at a station, the data of 591 stations over the period from 1960 to 2010 were ultimately selected for analysis. In the data sets of these 591 stations, a total of 34,776 missing daily data, accounting for 0.316% of the total data, were found at 95 of the 591 stations in the period from 1960 to 2010. The largest numbers of missing data were less than 2% in every year for all stations, so the missing values were ignored in the following analyses. The 591 stations that had good-quality data were chosen for the analysis (Figure 1).
Figure 1. Distribution of the weather stations and climate zones. The upper curved purple line is the Yellow River and lower curved purple line is the Yangtze River. The blue line is used to separate the different climate zones. See text for climate zone definitions.
Atmosphere 07 00022 g001

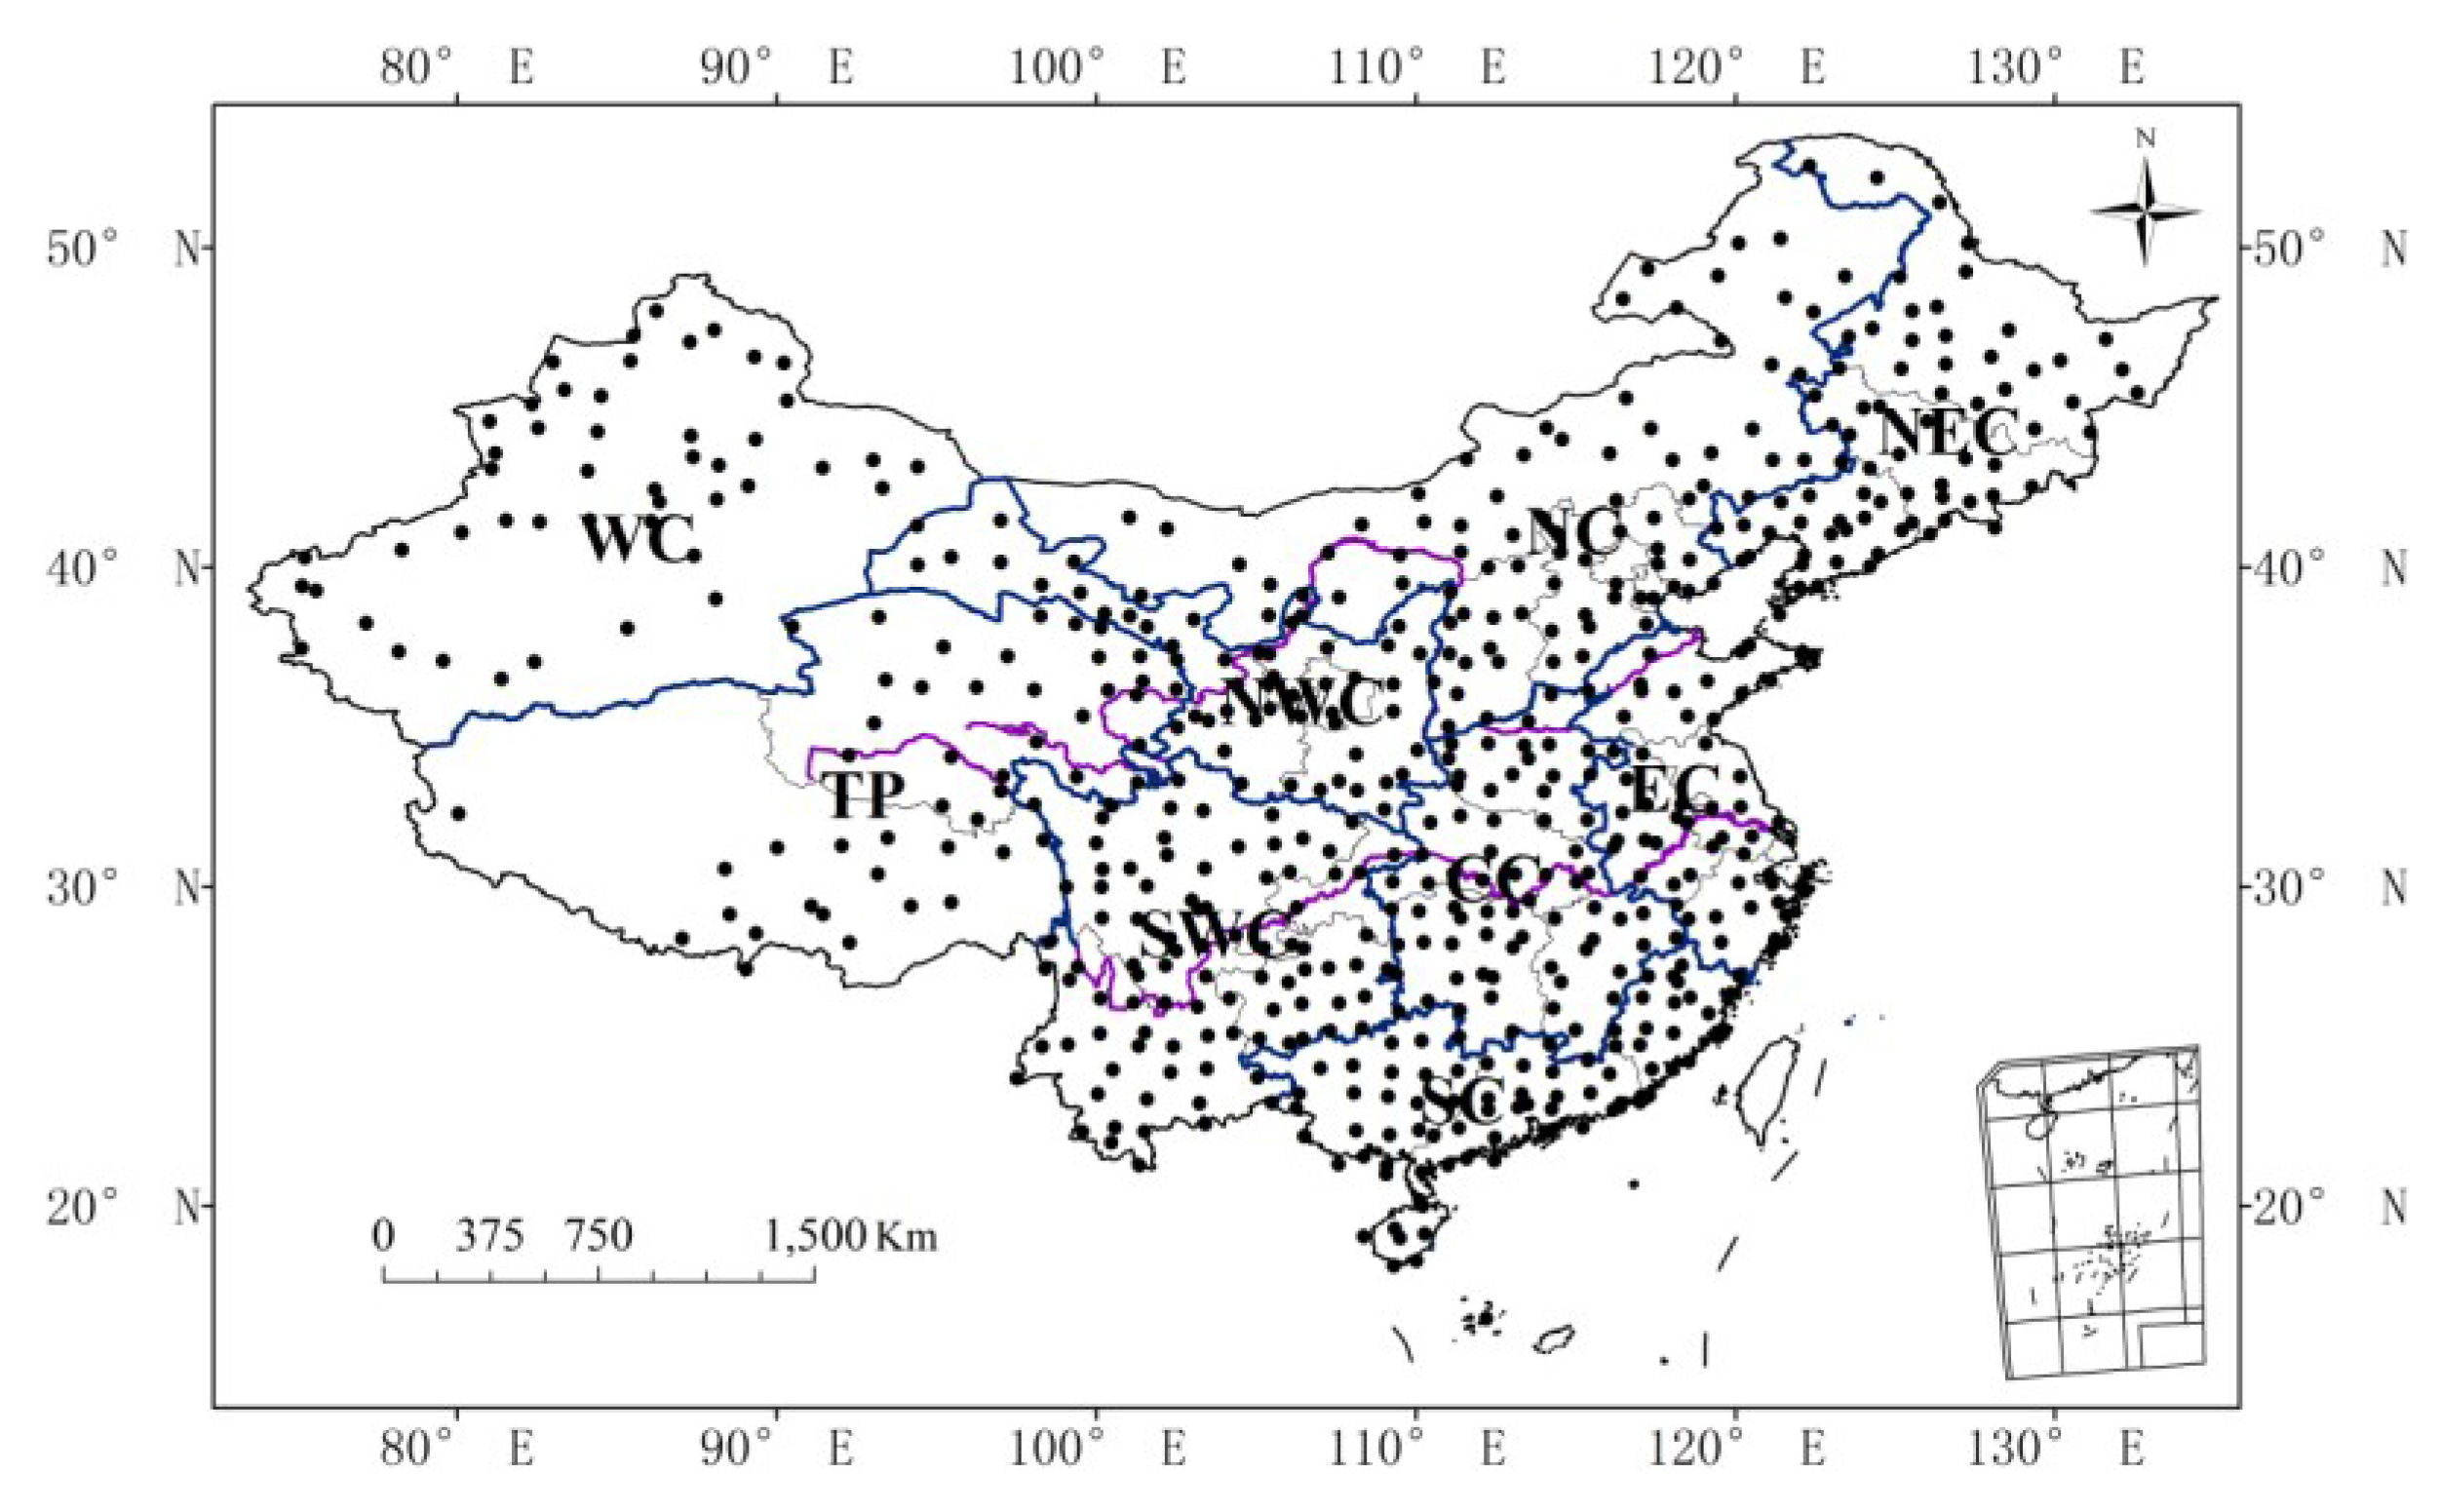
2.2. Climate Zones in China

The spatial heterogeneity of the temporal trends requires the definition of climate zones in China. Based on the monthly temperature and precipitation data, and considering the coincidence with the administrative divisions of provinces, mainland China was divided into nine climate zones (Figure 1) [38]: Northeast China (NEC: Liaoning, Jilin, Heilongjiang), North China (NC: Beijing, Tianjin, Hebei, Shaanxi, Inner Mongolia), Northwest China (NWC: Shanxi, Gansu, Ningxia), East China (EC: Shanghai, Jiangsu, Zhejiang, Anhui, Shandong), West China (WC: Xinjiang), Southwest China (SWC: Chongqing, Sichuan, Guizhou, Yunnan), South China (SC: Guangdong, Guangxi, Hainan, Fujian), Central China (CC: Jiangxi, Henan, Hunan, Hubei) and Tibetan Plateau (TP: Xizang, Qinghai).

2.3. Extreme Temperature Indices

We used the 95th (5th) and 99th (1st) percentiles individually to obtain the thresholds of the four indices (Table 1). The indices are different from those recommended by the Expert Team on Climate Change Detection and Indices (ETCCDI), which used the 10th percentile to define the occurrences of cold nights (days) and warm days (nights). The thresholds for the temperature extremes at each station are set to the 95th and 99th percentiles of daily Tmax and to the 5th and 1st percentiles of daily Tmin. We calculated the percentile values and defined the thresholds with respect to the period of 1971–2000 [18,39,40]. In the calculation of these indices, the 95th (5th) and 99th (1st) percentiles of the daily maximum (minimum) temperature data at a certain station in the period 1971–2000 were taken as the upper (lower) threshold. In calculation of percentile indices, a bootstrap procedure is used to avoid a bias between the percentiles within the base period and those outside [39]. If a daily maximum temperature was greater (less) than the upper (lower) threshold, then it was considered a warm (cool) day (night) event. The amount of missing data was less than 2% at all the stations, so the missing values were ignored when the percentile thresholds were estimated. According to the percentile thresholds, the temperature indices are classified as cold-related indices TN05p (cold nights) & TN01p (very cold nights) and warm-related indices TX95p (warm days) & TX99p (hot days).
Table 1. Definition of four temperature indices in China.
NameIndexDefinition
Warm daysTX95pCount of days where maximum temperature TX > 95th percentile
Hot daysTX99pCount of days where maximum temperature TX > 99th percentile
Cold nightsTN05pCount of days where minimum temperature TN < 5th percentile
Very Cold nightsTN01pCount of days where minimum temperature TN < 1st percentile

2.4. Trend Analysis, Significance Test, and Abrupt Change Detection

The annual time-series of the indices were calculated for each station. The trends in the annual indices were calculated using linear trends estimated by linear least squares for each station from all available years from 1960 to 2010. The statistical significance of the trends was evaluated at the 5% level of significance against the null hypothesis.
The possible abrupt changes in the trends of the indices were examined using the Mann-Kendall method and the 5-year moving T-test (MTT) method [17,41,42,43]. For the emergence of multiple point mutations after using the Mann–Kendall method, the 5-year moving T-test method was used to verify the authenticity of the mutation point to enhance the credibility of the results [17,41]. The Mann–Kendall statistical test has been frequently used to quantify the significance of trends in meteorological time series [44,45,46,47,48]. The Mann–Kendall is calculated as [42,43]:
S = i = 1 n 1 j = i + 1 n sgn ( x j x i )
where n is the number of data points, x i and x j are the data values in the time series i and j (j > i), respectively, and sgn(xj − xi) is the sign function as:
sgn ( x j x i ) = { + 1 i f x i x j > 0 0 i f x i x j = 0 1 i f x i x j = 0
The variance is computed as:
Var ( S ) = n ( n 1 ) ( 2 n + 5 ) i = 1 p t i ( t i 1 ) ( 2 t i + 5 ) 18
where n is the number of data points, P is the number of tied groups, the summary sign (Σ) indicates the summation over all tied groups, and ti is the number of data values in the Pth group. If there are not tied groups, this summary process can be ignored [49]. A tied group is a set of sample data having the same value. In cases where the sample size n > 30, the standard normal test statistic ZS is computed using Equation (4):
Z s = { S 1 V ar ( S ) , i f S > 0 0 i f S = 0 S + 1 V a r ( S ) , i f S < 0
Positive values of ZS indicate increasing trends while negative ZS values show decreasing trends. Testing trends is done at the specific α significance level. When |ZS| > |Z1-α/2|, the null hypothesis is rejected and a significant trend exists in the time series. Z1-α/2 is obtained from the standard normal distribution table. In this study, α = 0.05 was used. At the 5% significance level, the null hypothesis of no trend is rejected if |ZS| > 1.96.

3. Results

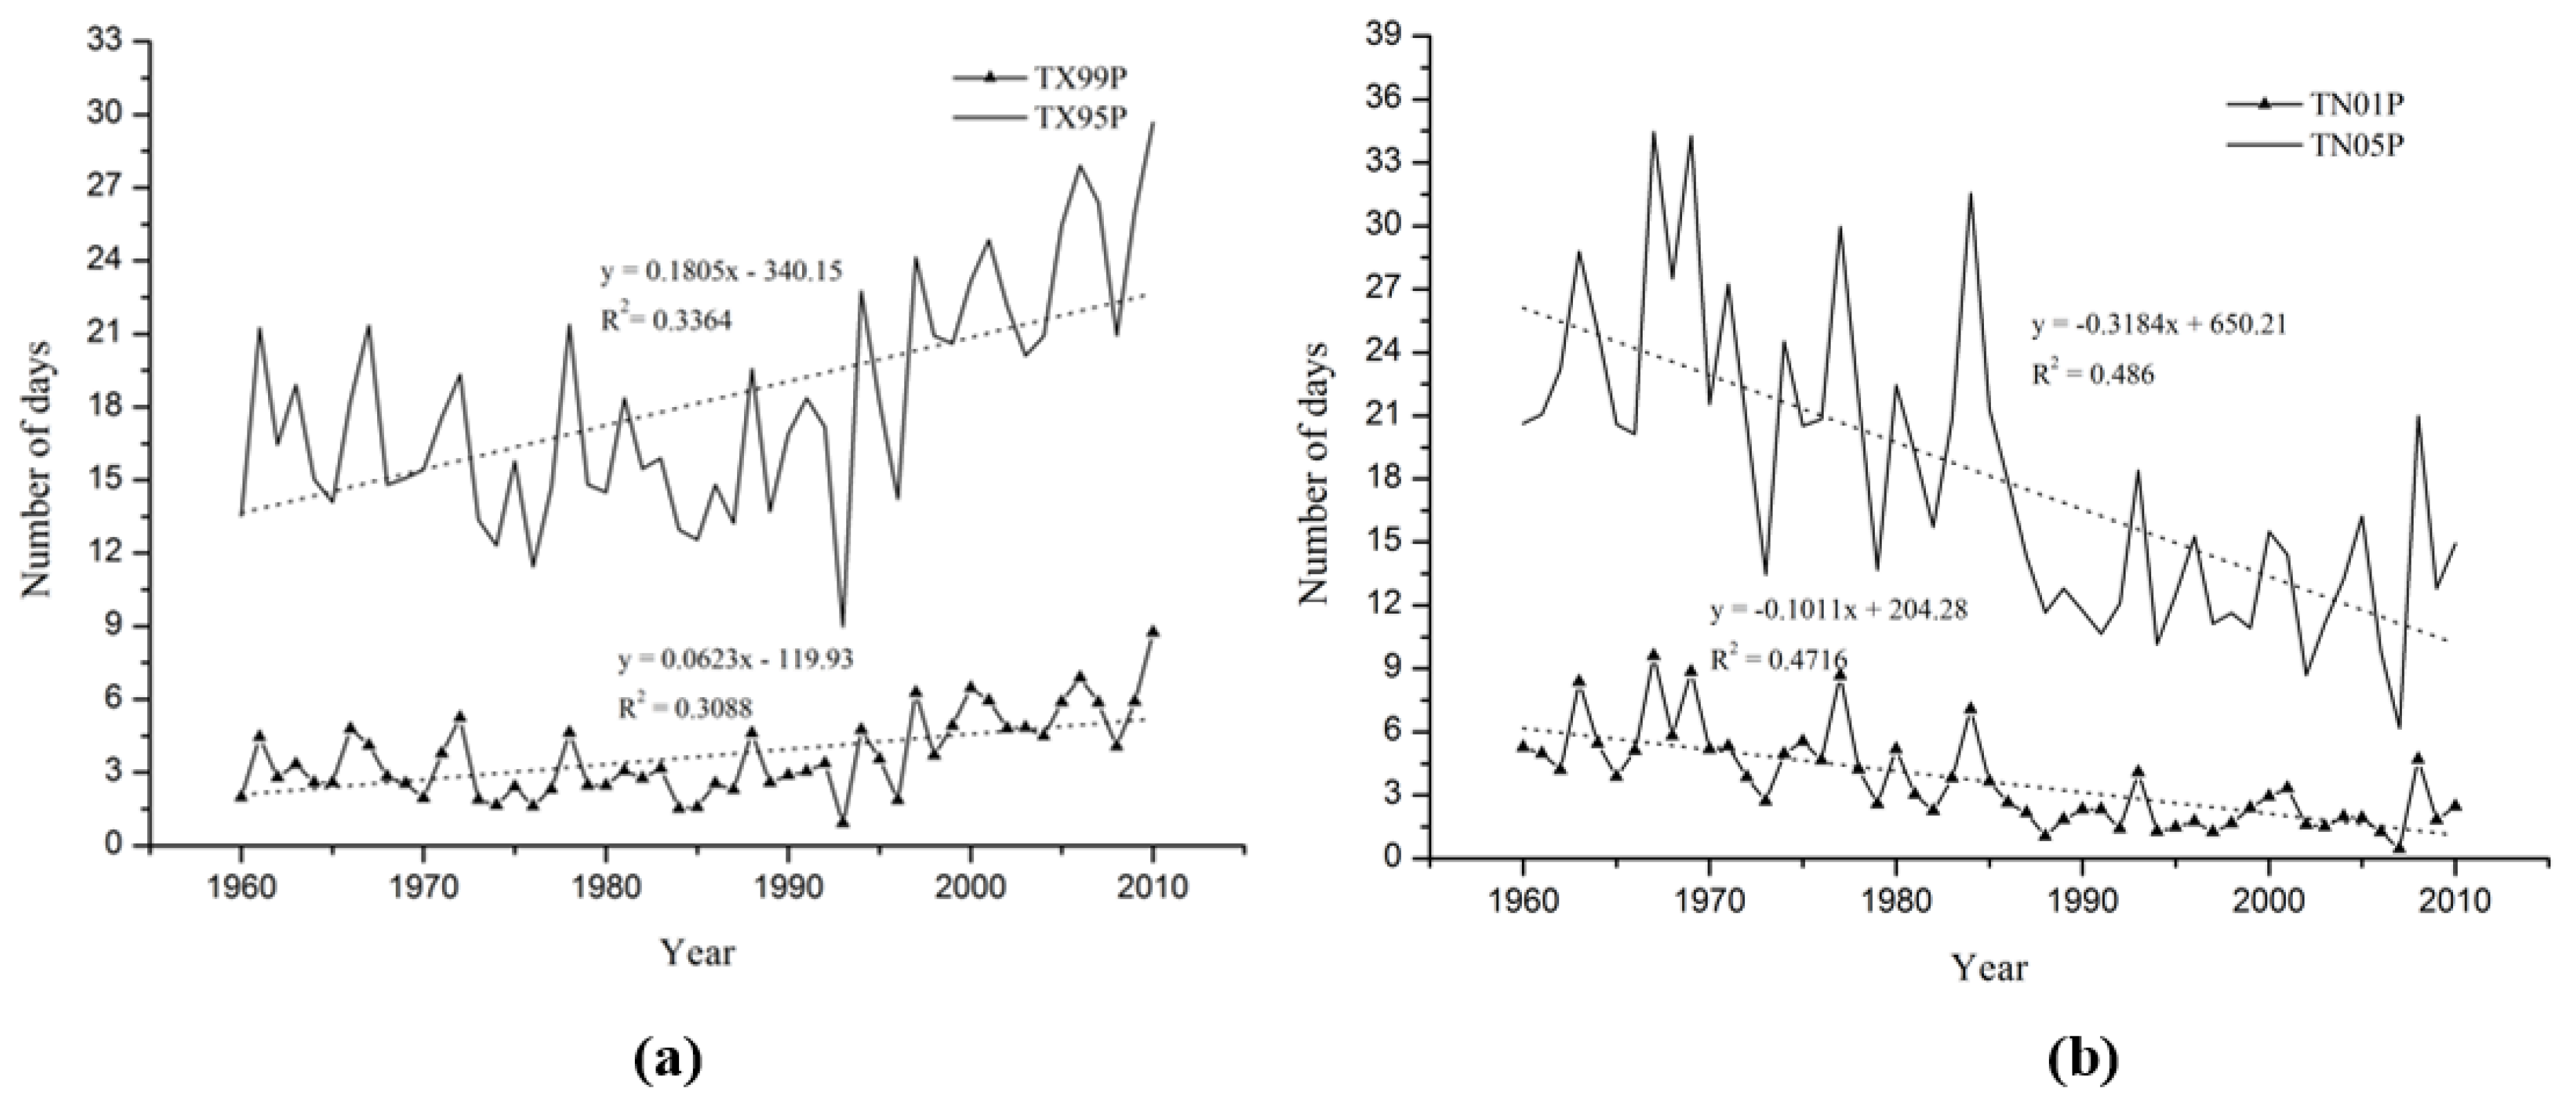
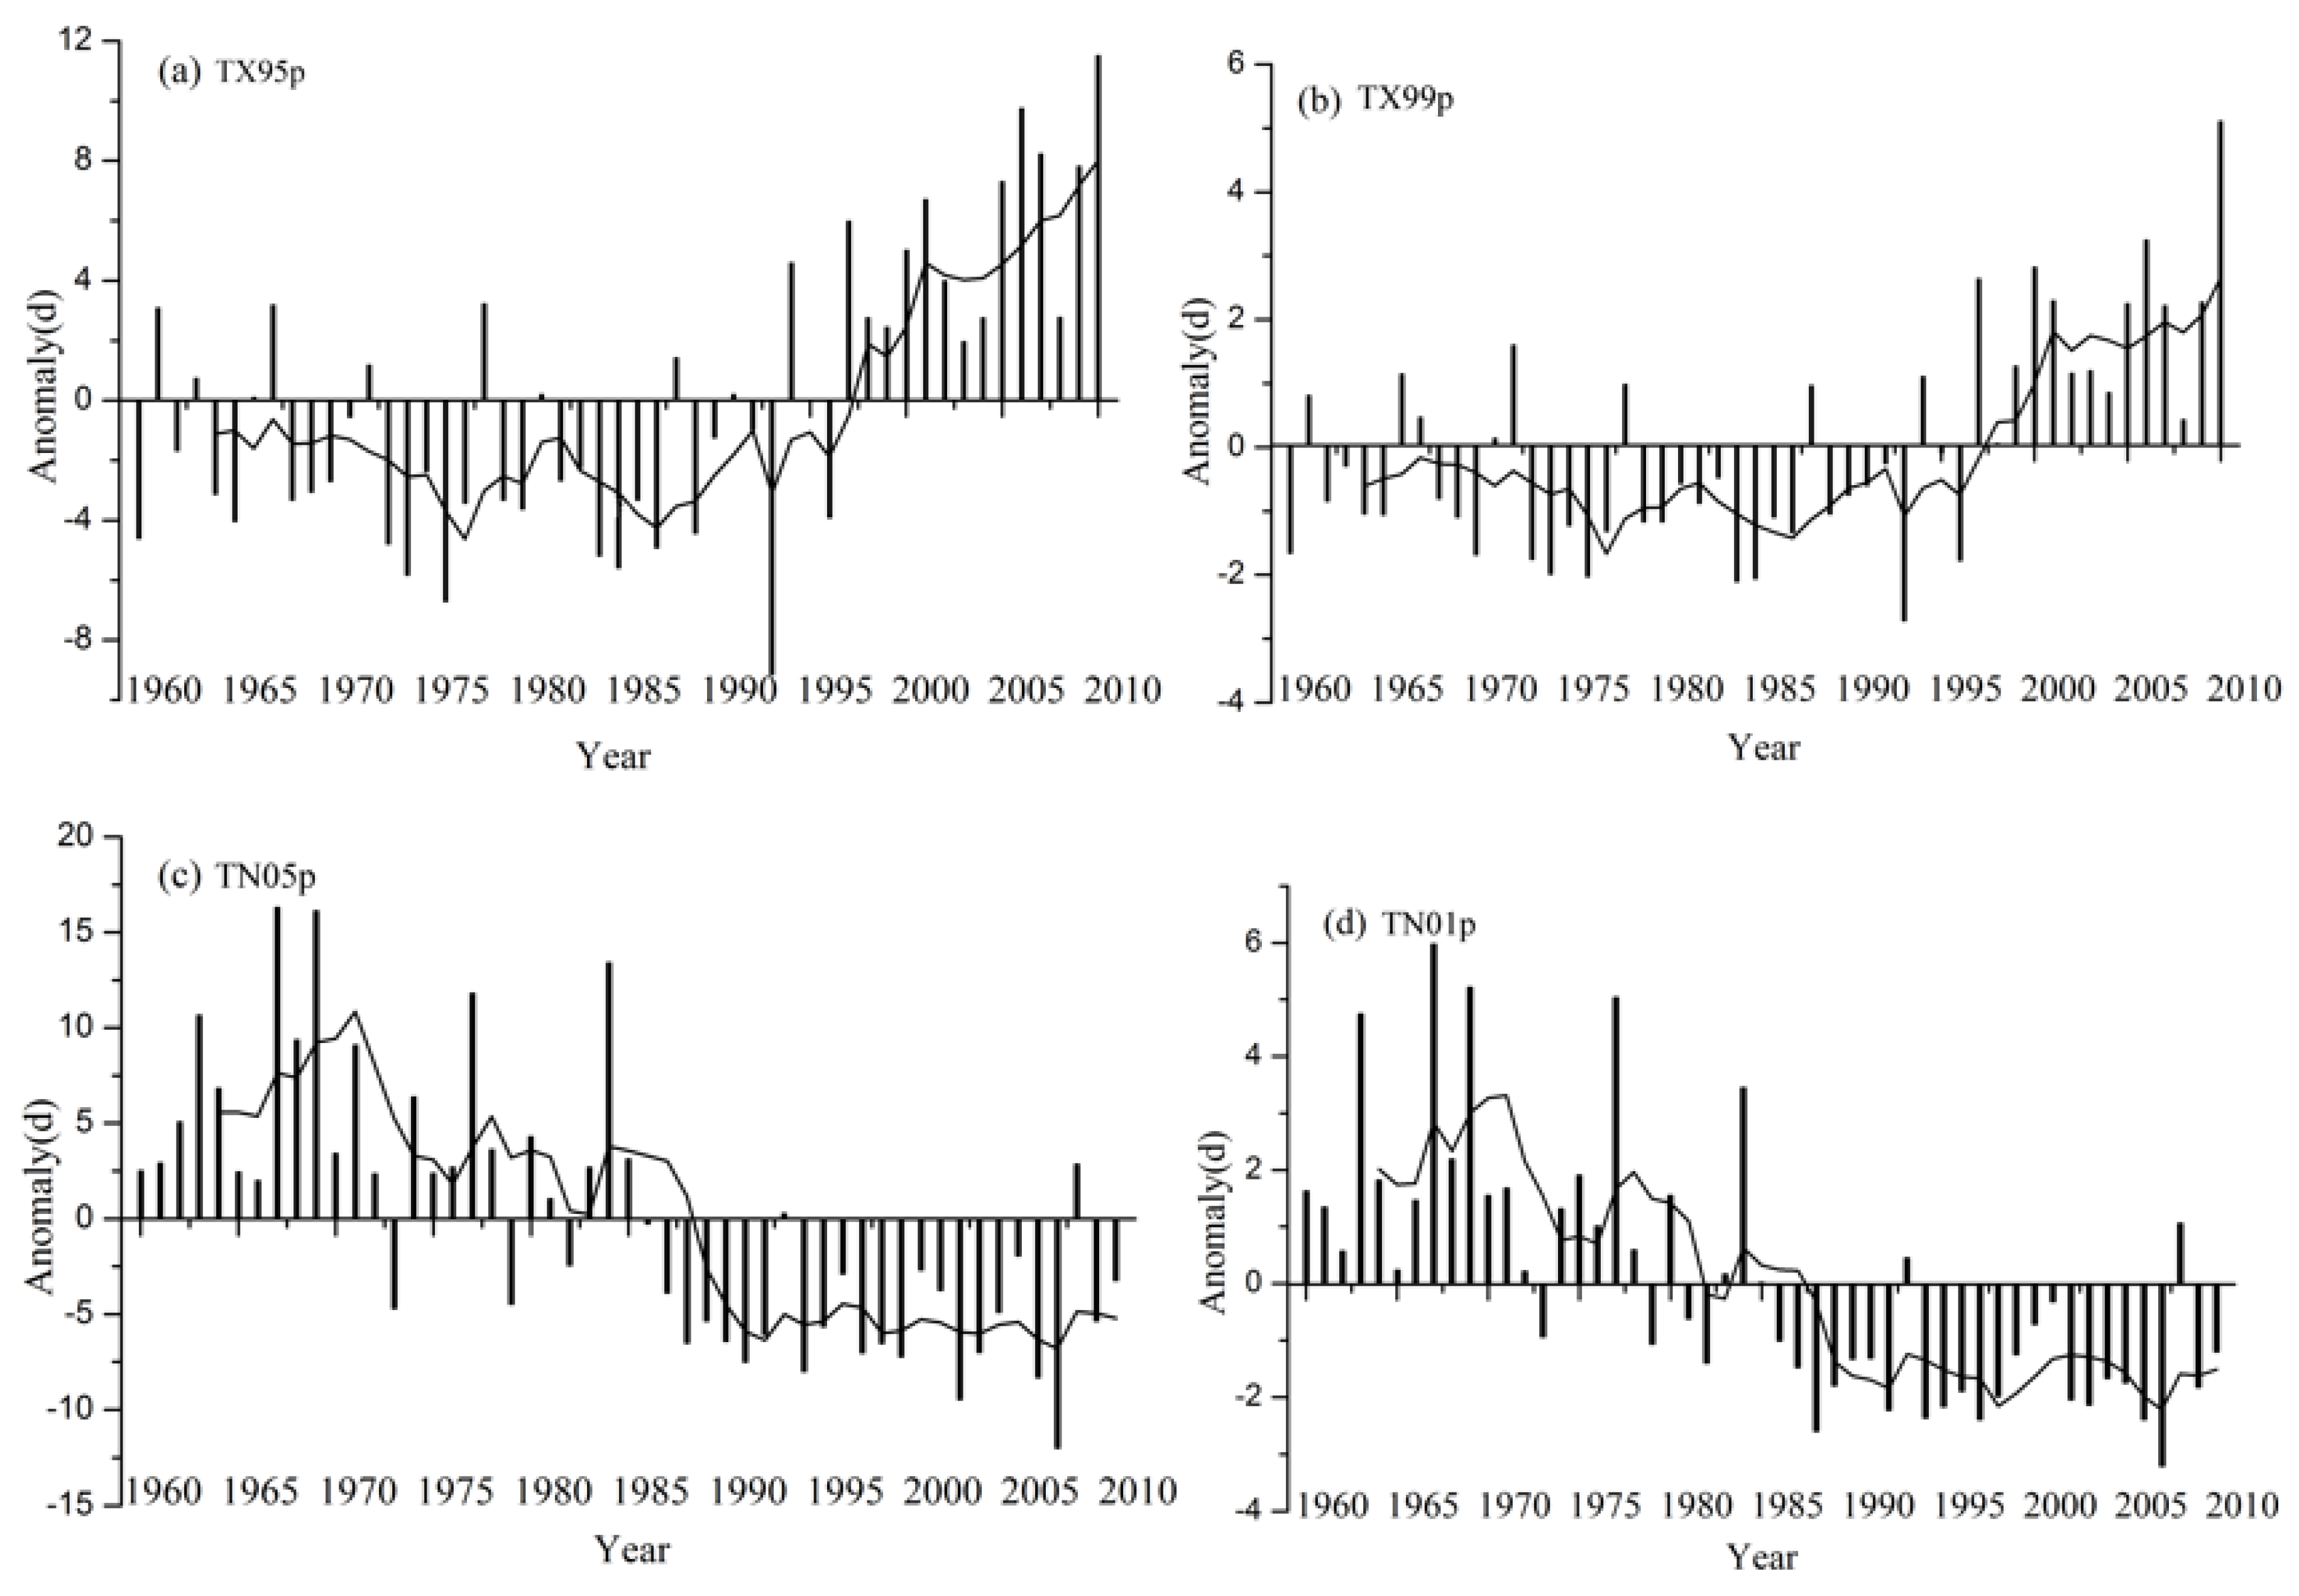
3.1. Trends of Temperature Extremes

This section gives an overview of the time series for the four temperature extreme indices averaged over all the stations in mainland China (Figure 2). Figure 2 summarizes the anomalies in the annual temperature extreme indices, averaged over all the stations in mainland China. The warm days (TX95p) and hot days (TX99p) showed increasing trends over the last 51 years, with linear trends of +1.80 day/10 year and +0.62 day/10 year, respectively (Figure 2a), which is much less than the trend of TX90p, +5.22 day/10 year [18]. The cold nights (TN05p) and very cold nights (TN01p) showed linear trends of −3.18 day/10 year and −1.01 day/10 year, respectively (Figure 2b), which is also much less than the trend of TN10p, –8.23 day/10 year [18]. Both the warm days and hot days showed rapidly increasing trends after the mid-1980s, although slight decreasing tendencies appeared before this time. Additionally, cold nights and very cold nights generally followed downward trends (Figure 2 and Figure 3).
Figure 2. Time series of annual occurrences of warm days (TX95p), hot days (TX99p), cold nights (TN05p), and very cold nights (TN01p) in mainland China during 1960–2010. (a) Warm days (TX95p) are the upper lines and hot days (TX99p) are the lower lines; (b) cold nights (TN05p) are the upper lines and very cold nights (TN01p) are the lower lines. The dashed lines are linear trends that are statistically significant at p-value < 0.05.
Atmosphere 07 00022 g002
Figure 3. Anomalies in annual (a) warm days (TX95p); (b) hot days (TX99p); (c) cold nights (TN05p) and (d) very cold nights (TN01p), averaged over all the stations in mainland China during 1960-2010. The anomalies are relative to the 1971–2000 mean values. The curve fitting used a 5-year moving average smoothing method.
Atmosphere 07 00022 g003

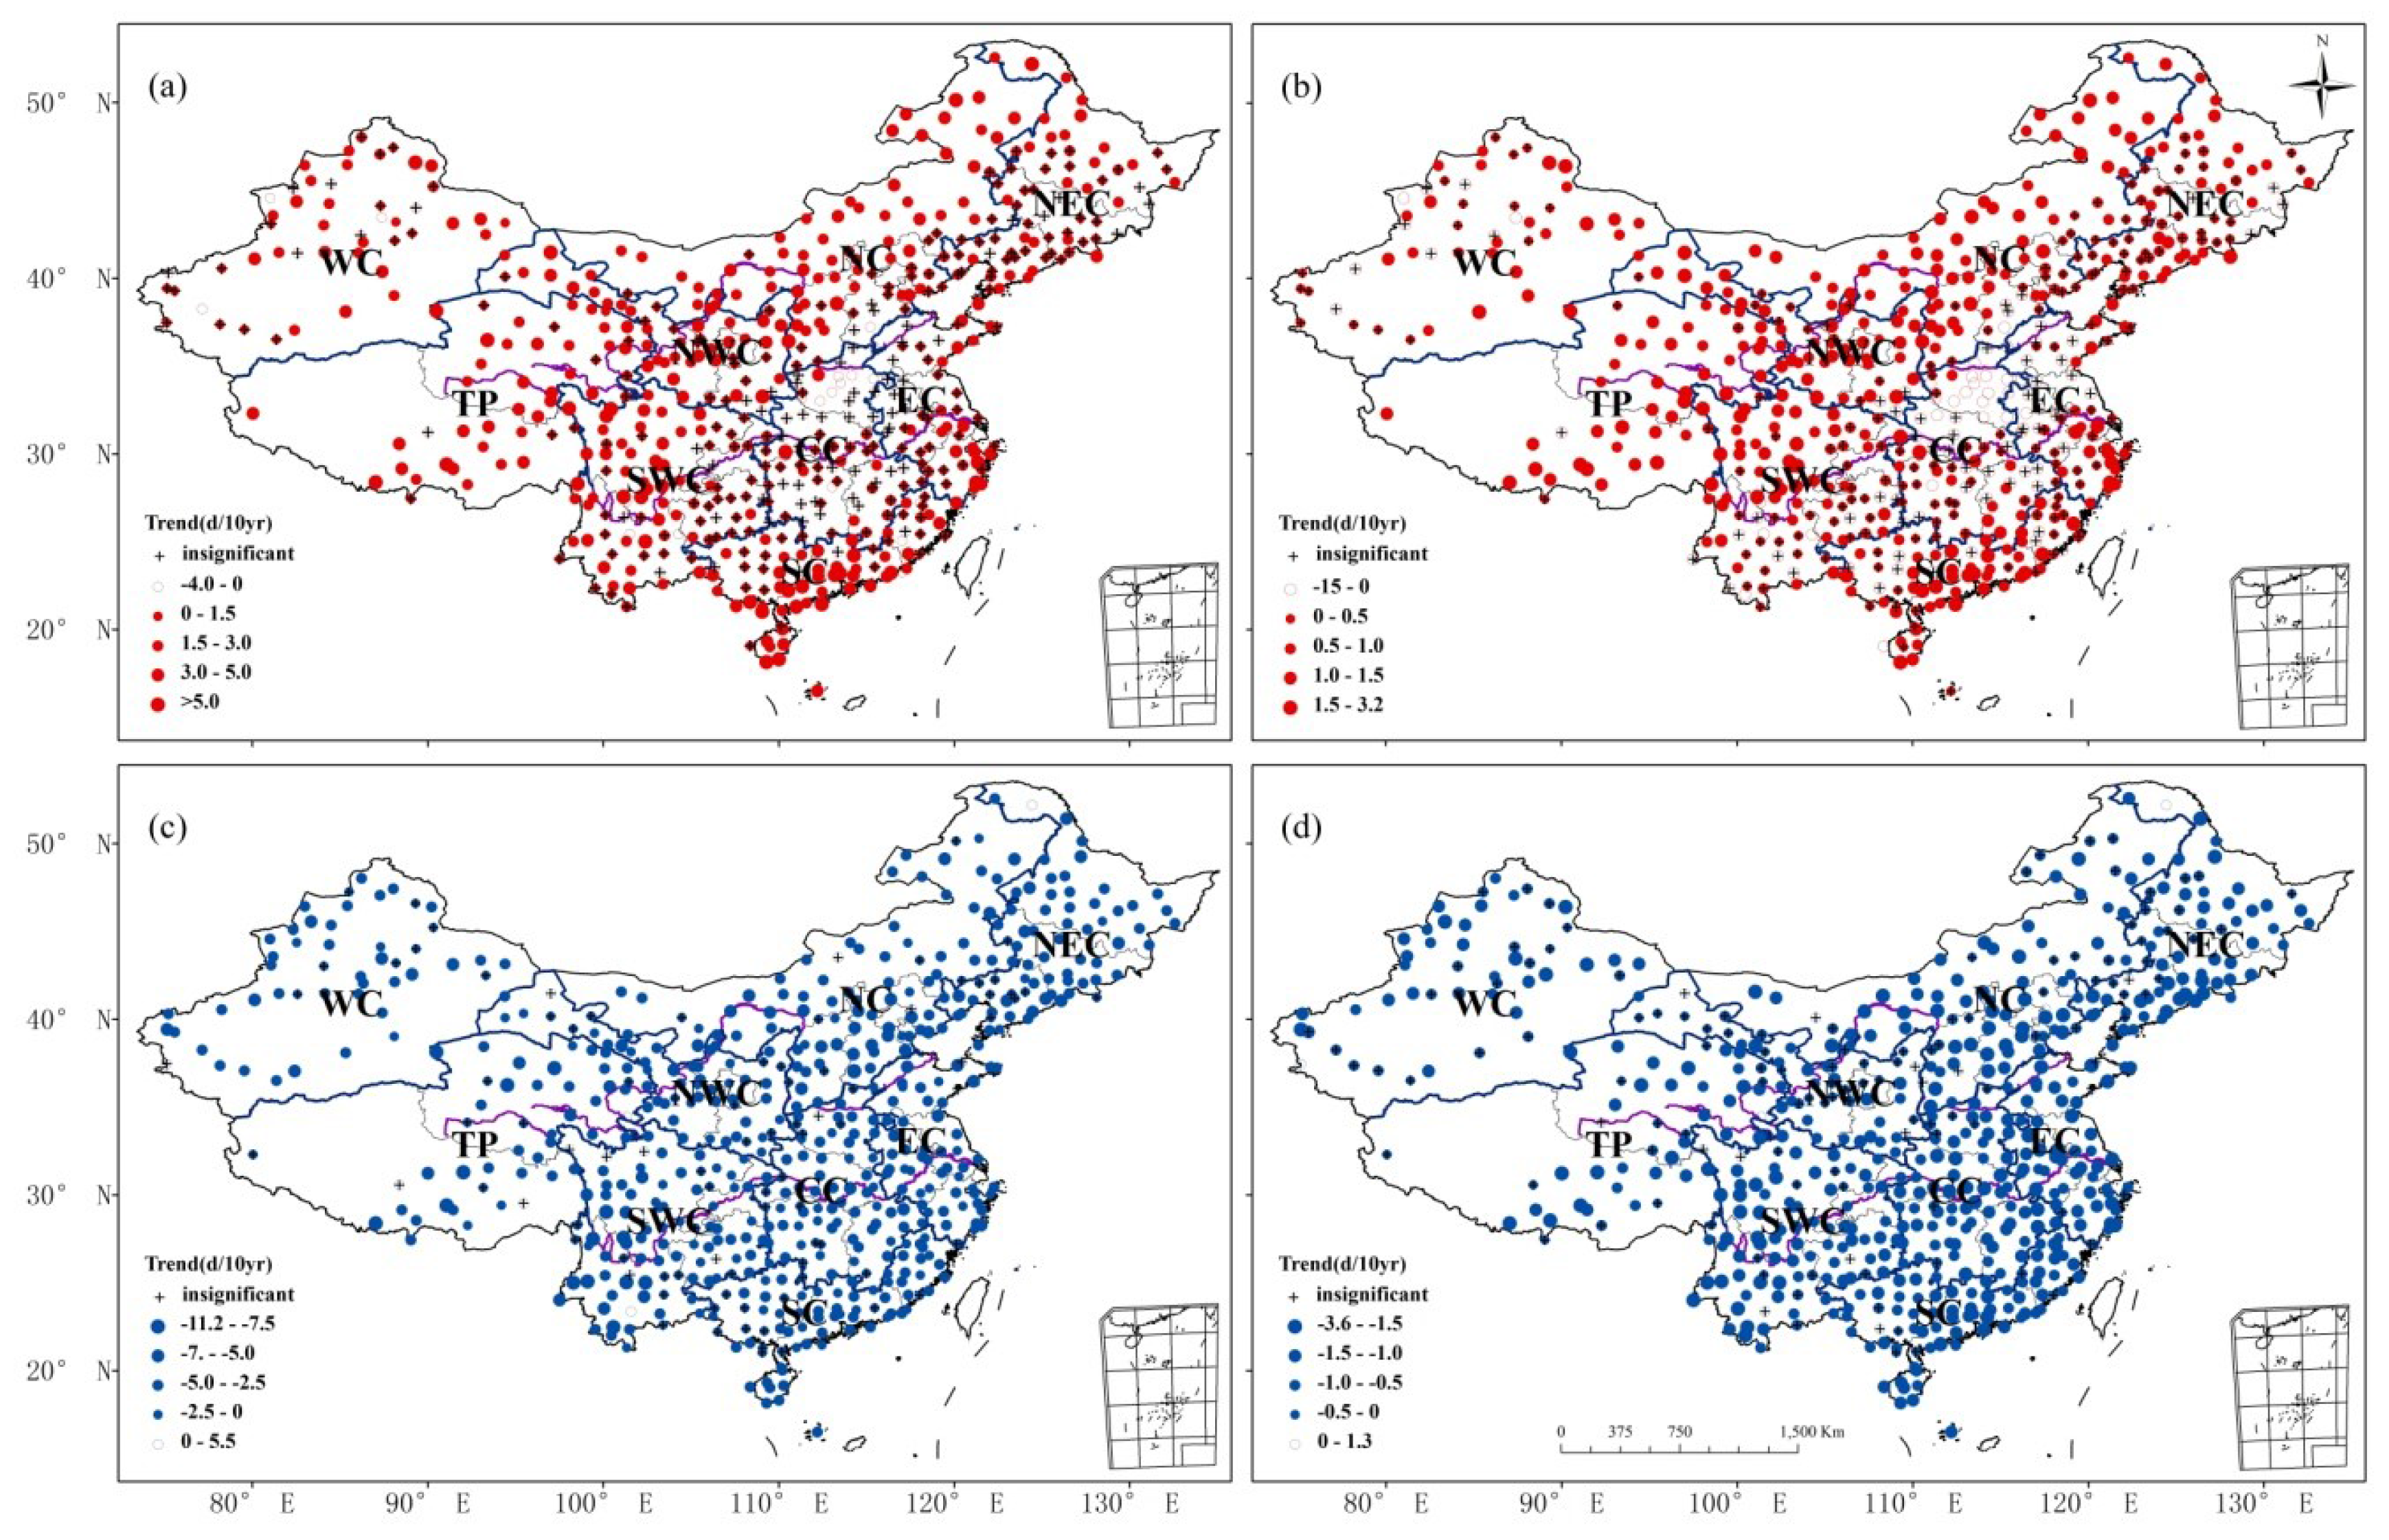
3.2. Spatial Variations of Trends in Extreme Temperature

This section shows the spatial variations of the trends in the four indices in mainland China (Figure 4) and the percentage of the stations that exhibited trends that passed the significance test (p < 0.05) among the 9 climate zones (Table 2).
Table 2. Percentages of stations that passed the significance test (p < 0.05) among the nine climate zones in mainland China. TX95p: warm days, TX99p: hot days, TN05p: cold nights, TN01p: very cold nights, NEC: Northeast China, NC: North China, NWC: Northwest China, EC: East China, WC: West China, SWC: Southwest China, SC: South China, CC: Central China, TP: Tibetan Plateau.
TX95pTX99pTN05pTN01p
Increase (%)Decrease (%)Increase (%)Decrease (%)Increase (%)Decrease (%)Increase (%)Decrease (%)
Mainland China50.423.3858.214.740.8583.761.1876.48
NEC37.50043.0601.3986.111.3937.5
NC68.671.2072.291.201.2087.951.2091.57
SWC48.893.3351.114.441.1180.000100
TP40.43044.6802.1339.36018.09
WC51.026.1248.984.08081.638.1691.84
SC65.334.0058.672.67082.670100
NWC66.671.9674.510080.39080.39
CC8.7011.5918.8436.23079.71078.26
EC32.731.8232.737.27096.361.8249.09
Figure 4. Spatial distributions of trends of extreme temperature indices in China during 1960–2010: (a) Trends of TX95p; (b) Trends of TX99p; (c) Trends of TN05p; (d) Trends of TN01p. The black symbol “+” shows the stations with trends that were insignificant at the confidence level of 0.05. The unfilled symbol “◦” represents increased frequency in TX95p and TX99p and decreased frequency in TN05p and TN01p.
Atmosphere 07 00022 g004
The trends of TX99p and TX95p have similar spatial patterns, although the trend values may be different, showing an increasing trend in all regions of the mainland except for Central China (CC) and its surrounding areas, which show decreasing or insignificant trends (Figure 4a,b). This is similar to the TX90p spatial trend distribution, which showed an increasing trend in nearly all the regions except for a few stations in the central region and the eastern part of Southwest China [18]. Except for the junction area of North and Northwest China (NC and NWC), the northwest of Southwest China (SWC), and a few sites in the northeast of East China (EC), most sites exhibited decreasing trends in TN05p and TN01p (Figure 4c,d) and nearly all the stations exhibited significant decreasing trends in TN10p, with a few exceptions in the eastern part of Southwest China [18]. Both the largest increases in the TX95p and TX99p frequency and the largest decreases in TN05p and TN01p are located in the same regions of NC, NWC, WC, TP, SWC, SC north of CC, and WC, especially in the upper reaches of the Yellow and Yangtze Rivers and the estuaries of the Yangtze River.
TX95p and TX99p increased significantly in more than half of the stations, and TN05p and TN01p decreased significantly in more than three-quarters of the stations (Table 2). In mainland China, more than half of the stations exhibited significantly increasing trends in TX95p and TX99p (50.42% and 58.21%, respectively), and 83.76% and 76.48% of the stations showed significant decreasing tendencies in TN05p and TN01p, respectively. The percentages of sites that exhibited a significantly decreasing trend in TX95p and TX99p were 3.38% and 4.74%, respectively, while those showing significantly increasing trends in TN05p and TN01p were 0.85% and 1.18%, respectively.
Except for CC, where only 8.7% of the stations for TX95p and 18.84% of the stations for TX99p significantly increased and 11.59% of the stations for TX95p and 36.23% of the stations for TX99p significantly decreased, 35% of stations had significantly increasing tendencies and less than 10% of the stations had significantly decreasing trends among the other eight climate zones (Table 2). More than 80% of the stations among the other eight climate zones showed significant decreases in TN05p except for TP, where only 39.36% of the stations show significant decreases in TN05p and more than 80% of the stations showed significant decreases in TN01p, excluding TP, NEC, and EC.

3.3. Characteristics of Abrupt Changes in TX95p and TX99p Trends

The abrupt changes in the TX95p and TX99p trends mainly occurred in the 1990s and 2000s (Table 3). The abrupt changes in the trends of TX95p occurred earliest (in the 1980s) in NEC and CC and latest (in the 2000s) in SWC, SC, and EC. Before abrupt changes in TX95p, the trends were negative except for NEC, SWC, TP, and SC, but after the abrupt changes, all the trends were positive. The TX99p abrupt changes occurred earliest in SC and CC in the mid-1980s and latest (in the 2000s) in NEC, SWC, and EC (Table 3). Before the abrupt change points in TX99p, the trends were negative in NC, SC, CC, and EC, but after the abrupt change points, the trends were negative only in NC, WC, and EC.
The trends in TX95p among the climate zones after the abrupt changes were larger than before the abrupt changes, but the trend values of TX99p in more than half of the climate zones (NEC, NC, WC, NWC, and EC) were larger before the abrupt changes (Table 3).
Table 3. Years of abrupt changes and trends before and after the abrupt changes in TX95p and TX99p among the climate zones.
Year of Abrupt ChangeTrends (day/10 year)
Before and After Abrupt Changes
TX95pTX99pTX95pTX99p
BeforeAfterBeforeAfter
NEC198120010.72.90.90.4
NC19951996−0.91.8−0.4−1.0
SWC200320010.4512.10.15.3
TP199219931.36.50.22.0
WC19941996−0.050.740.04−0.28
SC200019851.0810.2−0.51.7
NWC19951997−0.681.20.20.1
CC19871987−4.74.1−1.71.1
EC20002001−0.070.27−0.2−1.1

3.4. Characteristics of Abrupt Changes in TN05p and TN01p Trends

Except for TP, where the abrupt change in TN05p occurred in 2001, the other climate zones’ abrupt changes in TN05p and TN01p occurred in the 1980s and the late 1970s (Table 4). Before the abrupt change points in TN05p, the regional trends were negative except for WC and CC. Before the abrupt change points in TN01p, the regional trends were negative with the exception of WC. For both TN05p and TN01p, after the abrupt change points, the trends in all the regions were negative.
The decreasing trends of TN01p for all climate zones after abrupt changes were lower than before the abrupt changes, except for WC; decreasing trends in TN05p were observed in more than half of the climate zones (NC, TP, SC, NWC, and EC) (Table 4).
Table 4. Years of abrupt changes and trends before and after abrupt changes in TN05p and TN01p.
Year of Abrupt ChangeTrends (day/10 year)
Before and After Abrupt Changes
TN05pTN01pTN05pTN01p
BeforeAfterBeforeAfter
NEC19801976−0.9−1.7−2.5−1.2
NC19801981−2.6−2.1−1.0−0.1
SWC19851986−0.7−2.1−0.7−0.4
TP20011986−3.4−2.7−1.7−1.0
WC198019790.003−1.20.67−0.2
SC19791985−2.6−2.3−0.5−0.2
NWC19801981−1.8−1.1−0.40.2
CC198419800.23−0.07−0.5−0.3
EC19851983−0.59−0.05−1.0−0.6

4. Discussion

The present study shows that, in mainland China, the frequencies of TX95p and TX99p increased, on average, by 1.80 day/10 year and 0.62 day/10 year, respectively, and the frequencies of TN05p and TN01p decreased, on average, by 3.18 day/10 year and 1.01 day/10 year, respectively. Zhou and Ren [18] showed that a larger increasing trend of 5.22 day/10 year occurred for warm days (TX90p) and a higher decreasing trend of −8.23 day/10 year occurred for cool nights (TN10p) during 1961–2008. The increasing rates of warm days in the 90th, 95th, and 99th percentiles are much lower than the decreasing rates of cold nights in the 10th, 5th, and 1st percentiles, respectively. This seems to be associated with the asymmetric warming characteristic in which the rate of increase in the daily minimum temperature is significantly higher than that of the daily maximum temperature [50,51,52]. Increases in the number of warm days and decreases of cold nights were also detected in different seasons or subareas of China [23,53,54,55]. The increase (decrease) in the number of warm days (cold nights) in China, whether at the 90th (10th), 95th (5th), or 99th (1st) percentiles, are consistent with all other global or regional studies that show that the occurrence of warm days increased but that cold nights decreased [2,15,16,17]. The abrupt changes in the trends of TX95p and TX99p mainly occurred in the 1990s and 2000s. The abrupt changes in TN05p and TN01p occurred in the 1980s and the late 1970s. Zhou and Ren [18] showed negative anomalies in warm days (TX90p) for most years before 1987 and cool days (TN10p) primarily showed positive anomalies before the late 1980s. The changes of TX95p and TX99p may be related to the decadal change of the East Asian summer monsoon rainfall patterns in the 1990s and 2000s [56,57,58] and the changes in the TN05p and TN01p may be related to the decadal weakening of the East Asian winter monsoon in the late 1980s [59,60].
This study showed that the frequencies of warm and hot days exhibited increasing trends, while cold and very cold nights exhibited decreasing tendencies almost everywhere except for Central China and its surrounding areas where the warm and hot days tended to decrease. In Central China, Tmax or warm days in the summer showed a cooling trend, as was also found by Qi and Wang [61] and [23]. The abrupt changes in TX95p and TX99p trends were generally in the 1990s or 2000s, but the trends of TN05p and TN01p change abruptly in the early and mid-1980s. Similar dates of abrupt changes in temperature trends were detected by Qi and Wang [61], and the trends in East Asia were found to reverse after 1997 [62]. The research shows that after the abrupt change, the increasing rates of warm days and hot days are much greater than those before in most areas of China. The number of extreme warm days (with daily maximum temperature >35 °C) increased significantly in most of China during 1960–2007 [63]. An ensemble multi-model of eight state-of-the-art GCMs(General Circulation Models) from the CMIP5 project projected more extreme warm events and fewer cold events over China in the future under the RCP4.5 scenario (Representative Concentration Pathway 4.5 which named after a possible range of radiative forcingvalues in the year 2100 relative to pre-industrial values +4.5 W/m2) [64]. These indicate a greater potential risk of heat waves in the future, which can not only affect human health and disease but can also change the probability of agrometeorological disasters. Crop growth durations were shortened and the sowing date and phenology were shifted because of climate warming [65,66,67]. There is limited knowledge of crops’ responses to climate warming, and this topic deserves more attention in the future.

5. Conclusions

(1)
Warm days and hot days exhibited increasing trends over the last 51 years with a rapid increase after the mid-1980s. The cold and very cold nights exhibited decreasing trends in the last 51years with a rapid decrease from the 1960s to the 1990s.
(2)
The warm days (cold nights) and hot days (very cold nights) showed upward (downward) tendencies in most areas of China, but Central China and its surrounding areas showed decreasing tendencies in warm days and hot days.
(3)
The dates of observed abrupt changes in the trends of warm days and hot days were generally in the 1990s or 2000s, but the trends of cold nights and hot days changed in the early and mid-1980s. The increasing trends of warm days and hot days were greater after abrupt changes in most regions, which indicate a greater potential risk of heat waves in the future.

Acknowledgments

This work was supported by the National Natural Science Foundation of China (NSFC) (No. 41375117), the International Science and Technology Partnerships Program of China and Canada (2009DFA91900) and the National Basic Research Program of China funded by MOST China (2010CB951300).

Author Contributions

Shibo Fang and Guangsheng Zhou designed the research. Guojun Han and Yue Qi performed the research with significant contributions from Qingxiang Li, and Shibo Fang wrote the manuscript.

Conflicts of Interest

The authors declare no conflict of interest.

References

  1. Intergovernmental Panel on Climate Change. Summary for policymakers. In Climate Change 2013: The Physical Science Basis. Contribution of Working Group to the Fifth Assessment Report of the Intergovernmental Panel on Climate Change; Stocker, T.F., Qin, D., Plattner, G.-K., Tignor, M., Allen, S.K., Boschung, J., Nauels, A., Xia, Y., Bex, V., Midgley, P.M., Eds.; Cambridge University Press: Cambridge, UK; New York, NY, USA, 2013. [Google Scholar]
  2. Alexander, L.V.; Zhang, X.; Peterson, T.C.; Caesar, J.; Gleason, B.; Klein Tank, A.M.G.; Haylock, M.; Collins, D.; Trewin, B.; Rahimzadeh, F.; et al. Global observed changes in daily climate extremes of temperature and precipitation. J. Geophys Res. Atmos. 2006, 111, D05109. [Google Scholar] [CrossRef]
  3. Intergovernmental Panel on Climate Change. Managing the Risks of Extreme Events and Disasters to Advance Climate Change Adaptation; Cambridge University Press: Cambridge, UK, 2012. [Google Scholar]
  4. Habeeb, D.; Vargo, J.; Stone, B., Jr. Rising heat wave trends in large US cities. Nat. Hazard. 2015, 76, 1651–1665. [Google Scholar] [CrossRef]
  5. McGregor, G.R.; Ferro, C.A.T.; Stephenson, D.B. Projected Changes in Extreme Weather and Climate Events in Europe Extreme Weather Events and Public Health Responses; Springer: New York, NY, USA, 2005; pp. 13–23. [Google Scholar]
  6. Asseng, S.; Foster, I.A.N.; Turner, N.C. The impact of temperature variability on wheat yields. Glob. Chang. Biol. 2011, 17, 997–1012. [Google Scholar] [CrossRef]
  7. Farooq, M.; Bramley, H.; Palta, J.A.; Siddique, K.H.M. Heat stress in wheat during reproductive and grain-filling phases. Crit. Rev. Plant Sci. 2011, 30, 491–507. [Google Scholar] [CrossRef]
  8. Lalić, B.; Eitzinger, J.; Thaler, S.; Vučetić, V.; Nejedlik, P.; Eckersten, H.; Jaćimović, G.; Nikolić-Djorić, E. Can agrometeorological indices of adverse weather conditions help to improve yield prediction by crop models? Atmosphere 2014, 5, 1020–1041. [Google Scholar] [CrossRef]
  9. Hadley, S.W.; Erickson, D.J.; Hernandez, J.L.; Broniak, C.T.; Blasing, T.J. Responses of energy use to climate change: A climate modeling study. Geophys. Res. Lett. 2006, 33, L17703. [Google Scholar] [CrossRef]
  10. Dematte, J.E.; O’Mara, K.; Buescher, J.; Whitney, C.G.; Forsythe, S.; McNamee, T.; Adiga, R.B.; Ndukwu, I.M. Near-fatal heat stroke during the 1995 heat wave in Chicago. Ann. Intern. Med. 1998, 129, 173–181. [Google Scholar] [CrossRef] [PubMed]
  11. Pantavou, K.; Theoharatos, G.; Mavrakis, A.; Santamouris, M. Evaluating thermal comfort conditions and health responses during an extremely hot summer in Athens. Build. Environ. 2011, 46, 339–344. [Google Scholar] [CrossRef]
  12. Nitschke, M.; Hansen, A.; Bi, P.; Pisaniello, D.; Newbury, J.; Kitson, A.; Tucker, G.; Avery, J.; Dal Grande, E. Risk factors, health effects and behaviour in older people during extreme heat: A survey in south Australia. Int. J. Environ. Res. Public Health 2013, 10, 6721–6733. [Google Scholar] [CrossRef] [PubMed] [Green Version]
  13. Klein Tank, A.M.G.; Zwiers, F.W.; Zhang, X. Guidelines on Analysis of Extremes in a Changing Climate in Support of Informed Decisions for Adaptation; World Meteorological Organisation (WMO): Geneva, Switzerland, 2009.
  14. Chen, Q.; Li, Z.; Fan, G.; Zhu, K.; Zhang, W.; Zhu, H. Indications of stratospheric anomalies in the freezing rain and snow disaster in south China, 2008. Sci. China Earth Sci. 2011, 54, 1248–1256. [Google Scholar] [CrossRef]
  15. Bonsal, B.R.; Zhang, X.; Vincent, L.A.; Hogg, W.D. Characteristics of daily and extreme temperatures over Canada. J. Clim. 2001, 14, 1959–1976. [Google Scholar] [CrossRef]
  16. DeGaetano, A.T.; Allen, R.J. Trends in twentieth-century temperature extremes across the United States. J. Clim. 2002, 15, 3188–3205. [Google Scholar] [CrossRef]
  17. Klein Tank, A.M.G.; Können, G.P. Trends in indices of daily temperature and precipitation extremes in Europe, 1946–99. J. Clim. 2003, 16, 3665–3680. [Google Scholar] [CrossRef]
  18. Zhou, Y.; Ren, G. Change in extreme temperature event frequency over mainland China, 1961–2008. Clim. Res. 2011, 50, 125–139. [Google Scholar] [CrossRef]
  19. Kothawale, D.R.; Revadekar, J.V.; Kumar, K.R. Recent trends in pre-monsoon daily temperature extremes over India. J. Earth Syst. Sci. 2010, 119, 51–65. [Google Scholar] [CrossRef]
  20. Aguilar, E.; Peterson, T.C.; Obando, P.R.; Frutos, R.; Retana, J.A.; Solera, M.; Soley, J.; García, I.G.; Araujo, R.M.; Santos, A.R.; et al. Changes in precipitation and temperature extremes in central America and northern south America, 1961–2003. J. Geophys. Res. 2005, 110, D23107. [Google Scholar] [CrossRef]
  21. Rusticucci, M. Observed and simulated variability of extreme temperature events over south America. Atmos. Res. 2012, 106, 1–17. [Google Scholar] [CrossRef]
  22. Nemec, J.; Gruber, C.; Chimani, B.; Auer, I. Trends in extreme temperature indices in Austria based on a new homogenised dataset. Int. J. Climatol. 2013, 33, 1538–1550. [Google Scholar] [CrossRef]
  23. You, Q.; Ren, G.; Fraedrich, K.; Kang, S.; Ren, Y.; Wang, P. Winter temperature extremes in china and their possible causes. Int. J. Climatol. 2013, 33, 1444–1455. [Google Scholar] [CrossRef]
  24. Liang, K.; Bai, P.; Li, J.; Liu, C. Variability of temperature extremes in the yellow river basin during 1961–2011. Quat. Int. 2014, 336, 52–64. [Google Scholar] [CrossRef]
  25. Wang, B.; Zhang, M.; Wei, J.; Wang, S.; Li, S.; Ma, Q.; Li, X.; Pan, S. Changes in extreme events of temperature and precipitation over Xinjiang, northwest China, during 1960–2009. Quat. Int. 2013, 298, 141–151. [Google Scholar] [CrossRef]
  26. Yu, Z.; Li, X. Recent trends in daily temperature extremes over northeastern China (1960–2011). Quat. Int. 2015, 380–381, 35–48. [Google Scholar] [CrossRef]
  27. Wood, E.M.; Pidgeon, A.M. Extreme variations in spring temperature affect ecosystem regulating services provided by birds during migration. Ecosphere 2015, 6, art216. [Google Scholar] [CrossRef]
  28. Zhang, Y.; Voigt, M.; Liu, H. Contrasting responses of terrestrial ecosystem production to hot temperature extreme regimes between grassland and forest. Biogeosciences 2015, 11, 5997–6017. [Google Scholar] [CrossRef]
  29. Jeffree, E.P. Temperature-ranges and distributions of some vascular plants. Nature 1955, 484, 703–704. [Google Scholar] [CrossRef]
  30. Criddle, R.S.; Hopkin, M.S.; McArthur, E.D.; Hansen, L.D. Plant distribution and the temperature coefficient of metabolism. Plant Cell Environ. 1994, 17, 233–243. [Google Scholar] [CrossRef]
  31. Matyasovszky, I.; Ljungqvist, F. Abrupt temperature changes during the last 1500 years. Theor. Appl. Climatol. 2013, 112, 215–225. [Google Scholar] [CrossRef]
  32. Temnerud, J.; Weyhenmeyer, G.A. Abrupt changes in air temperature and precipitation: Do they matter for water chemistry. Glob. Biogeochem. Cycles 2008, 2008, 135–157. [Google Scholar] [CrossRef]
  33. Yonetani, T.; Mccabe, G.J. Abrupt changes in regional temperature in the conterminous United States, 1895–1989. Clim. Res. 1994, 4, 13–23. [Google Scholar] [CrossRef]
  34. Chen, Y.; Deng, H.; Li, B.; Li, Z.; Xu, C. Abrupt change of temperature and precipitation extremes in the arid region of northwest China. Quat. Int. 2014, 336, 35–43. [Google Scholar] [CrossRef]
  35. Liu, L.; Xu, Z.-X.; Huang, J.-X. Spatio-temporal variation and abrupt changes for major climate variables in the Taihu Basin, China. Stoch. Environ. Res. Risk Assess. 2012, 26, 777–791. [Google Scholar] [CrossRef]
  36. Li, Q.; Zhang, H.; Liu, X.; Chen, J.; Li, W.; Jones, P. A mainland china homogenized historical temperature dataset of 1951–2004. Bull. Am. Meteorol. Soc. 2009, 90, 1062–1065. [Google Scholar] [CrossRef]
  37. Xu, W.; Li, Q.; Wang, X.L.; Yang, S.; Cao, L.; Feng, Y. Homogenization of Chinese daily surface air temperatures and analysis of trends in the extreme temperature inices. J. Geophys. Res. Atmos. 2013, 118, 9708–9720. [Google Scholar] [CrossRef]
  38. Zhang, X.; Yan, X. Temporal change of climate zones in china in the context of climate warming. Theor. Appl. Climatol. 2013, 115, 167–175. [Google Scholar] [CrossRef]
  39. Zhang, X.; Hegerl, G.; Zwiers, F.W.; Kenyon, J. Avoiding inhomogeneity in percentile-based indices of temperature extremes. J. Clim. 2005, 18, 1641–1651. [Google Scholar] [CrossRef]
  40. Frich, P.; Alexander, L.V.; Della-Marta, P.; Gleason, B.; Haylock, M.; Klein Tank, A.M.G.; Peterson, T. Observed coherent changes in climatic extremes during the second half of the twentieth century. Clim. Res. 2002, 19, 193–212. [Google Scholar] [CrossRef]
  41. Wei, F. Modern Diagnosis and Prediction of Climate Statistics, 2nd ed.; Chinse Meteorological Press: Beijing, China, 2007. [Google Scholar]
  42. Kendall, M.G. Rank Correlation Methods, 4th ed.; Charles Griffin: London, UK, 1975. [Google Scholar]
  43. Mann, H.B. Non-parametric test against trend. Econometrica 1945, 13, 245–259. [Google Scholar] [CrossRef]
  44. Gocic, M.; Trajkovic, S. Analysis of changes in meteorological variables using mann-kendall and Sen’s slope estimator statistical tests in Serbia. Glob. Planet. Chang. 2013, 100, 172–182. [Google Scholar] [CrossRef]
  45. Kadioğlu, M. Trends in surface air temperature data over Turkey. Int. J. Climatol. 1997, 17, 511–520. [Google Scholar] [CrossRef]
  46. Pingale, S.M.; Khare, D.; Jat, M.K.; Adamowski, J. Spatial and temporal trends of mean and extreme rainfall and temperature for the 33 urban centers of the arid and semi-arid state of Rajasthan, India. Atmos. Res. 2014, 138, 73–90. [Google Scholar] [CrossRef]
  47. Sayemuzzaman, M.; Jha, M.K. Seasonal and annual precipitation time series trend analysis in north Carolina, United States. Atmos. Res. 2014, 137, 183–194. [Google Scholar] [CrossRef]
  48. Yue, S.; Pilon, P.; Cavadias, G. Power of the Mann–Kendall and Spearman’s rho tests for detecting monotonic trends in hydrological series. J. Hydrol. 2002, 259, 254–271. [Google Scholar] [CrossRef]
  49. Kisi, O.; Ay, M. Comparison of Mann-Kendall and innovative trend method for water quality parameters of the Kizilirmak river. J. Hydrol. 2014, 513, 362–375. [Google Scholar] [CrossRef]
  50. Easterling, D.R.; Horton, B.; Jones, P.D.; Peterson, T.C.; Karl, T.R.; Parker, D.E.; Salinger, M.J.; Razuvayev, V.; Plummer, N.; Jamason, P.; et al. Maximum and minimum temperature trends for the globe. Science 1997, 277, 364–367. [Google Scholar] [CrossRef]
  51. Karl, T.R.; Knight, R.W.; Gallo, K.P.; Peterson, T.C.; Jones, P.D.; Kukla, G.; Plummer, N.; Razuvayev, V.; Lindseay, J.; Charlson, R.J. A new perspective on recent global warming: Asymmetric trends of daily maximum and minimum temperature. Bull. Am. Meteorol. Soc. 1993, 74, 1007–1023. [Google Scholar] [CrossRef]
  52. Vose, R.S.; Easterling, D.R.; Gleason, B. Maximum and minimum temperature trends for the globe: An update through 2004. Geophys. Res. Lett. 2005, 32, L23822. [Google Scholar] [CrossRef]
  53. Li, Z.; Liu, W.; Zheng, F. Trends of extreme temperature events in Jinghe watershed during 1965–2005. Sci. Geogr. Sin. 2010, 30, 469–474. [Google Scholar]
  54. Zhai, P.; Pan, X. Change in extreme temperature and precipitation over northern China during the second half of the 20th century. Acta Geogr. Sin. 2003, 58, 1–8. [Google Scholar]
  55. Shi, J.; Cui, L. Characteristics of high impact weather and meteorological disaster in Shanghai, China. Nat. Hazards 2012, 60, 951–969. [Google Scholar] [CrossRef]
  56. Ding, Y.; Wang, Z.; Sun, Y. Inter-decadal variation of the summer precipitation in east China and its association with decreasing asian summer monsoon. Part I: Observed evidences. Int. J. Climatol. 2008, 28, 1139–1161. [Google Scholar] [CrossRef]
  57. Huang, R.; Chen, J.; Wang, L.; Lin, Z. Characteristics, processes, and causes of the spatio-temporal variabilities of the east Asian monsoon system. Adv. Atmos. Sci. 2012, 29, 910–942. [Google Scholar] [CrossRef]
  58. Zhang, R. Changes in east Asian summer monsoon and summer rainfall over eastern China during recent decades. Sci. Bull. 2015, 60, 1222–1224. [Google Scholar] [CrossRef]
  59. Wang, L.; Chen, W. How well do existing indices measure the strength of the east Asian winter monsoon? Adv. Atmos. Sci. 2010, 27, 855–870. [Google Scholar] [CrossRef]
  60. Wang, L.; Huang, R.; Gu, L.; Chen, W.; Kang, L. Interdecadal variations of the east Asian winter monsoon and their association with quasi-stationary planetary wave activity. J. Clim. 2009, 22, 4860–4872. [Google Scholar] [CrossRef]
  61. Qi, L.; Wang, Y. Changes in the observed trends in extreme temperatures over China around 1990. J. Clim. 2012, 25, 5208–5222. [Google Scholar] [CrossRef]
  62. Li, J.; Dong, W.; Yan, Z. Changes of climate extremes of temperature and precipitation in summer in eastern China associated with changes in atmospheric circulation in east Asia during 1960–2008. Chin. Sci. Bull. 2012, 57, 1856–1861. [Google Scholar] [CrossRef]
  63. Ding, T.; Qian, W.; Yan, Z. Changes in hot days and heat waves in china during 1961–2007. Int. J. Climatol. 2010, 30, 1452–1462. [Google Scholar] [CrossRef]
  64. Yao, Y.; Luo, Y.; Huang, J.-B. Evaluation and projection of temperature extremes over China based on CMIP5 model. Adv. Clim. Chang. Res. 2012, 3, 179–185. [Google Scholar] [CrossRef]
  65. Fang, S.B.; Cammarano, D.; Zhou, G.S.; Tan, K.Y.; Ren, S.X. Effects of increased day and night temperature with supplemental infrared heating on winter wheat growth in north China. Eur. J. Agron. 2015, 64, 67–77. [Google Scholar] [CrossRef]
  66. Fang, S.B.; Su, H.; Liu, W.; Tan, K.; Ren, S. Infrared warming reduced winter wheat yields and some physiological parameters, which were mitigated by irrigation and worsened by delayed sowing. PLoS ONE 2013, 8, E67518. [Google Scholar]
  67. Richardson, A.D.; Keenan, T.F.; Migliavacca, M.; Ryu, Y.; Sonnentag, O.; Toomey, M. Climate change, phenology, and phenological control of vegetation feedbacks to the climate system. Agric. For. Meteorol. 2013, 169, 156–173. [Google Scholar] [CrossRef]

