
Seasonality of Precipitation over Himalayan Watersheds in CORDEX South Asia and their Driving CMIP5 Experiments


Abstract
:1. Introduction
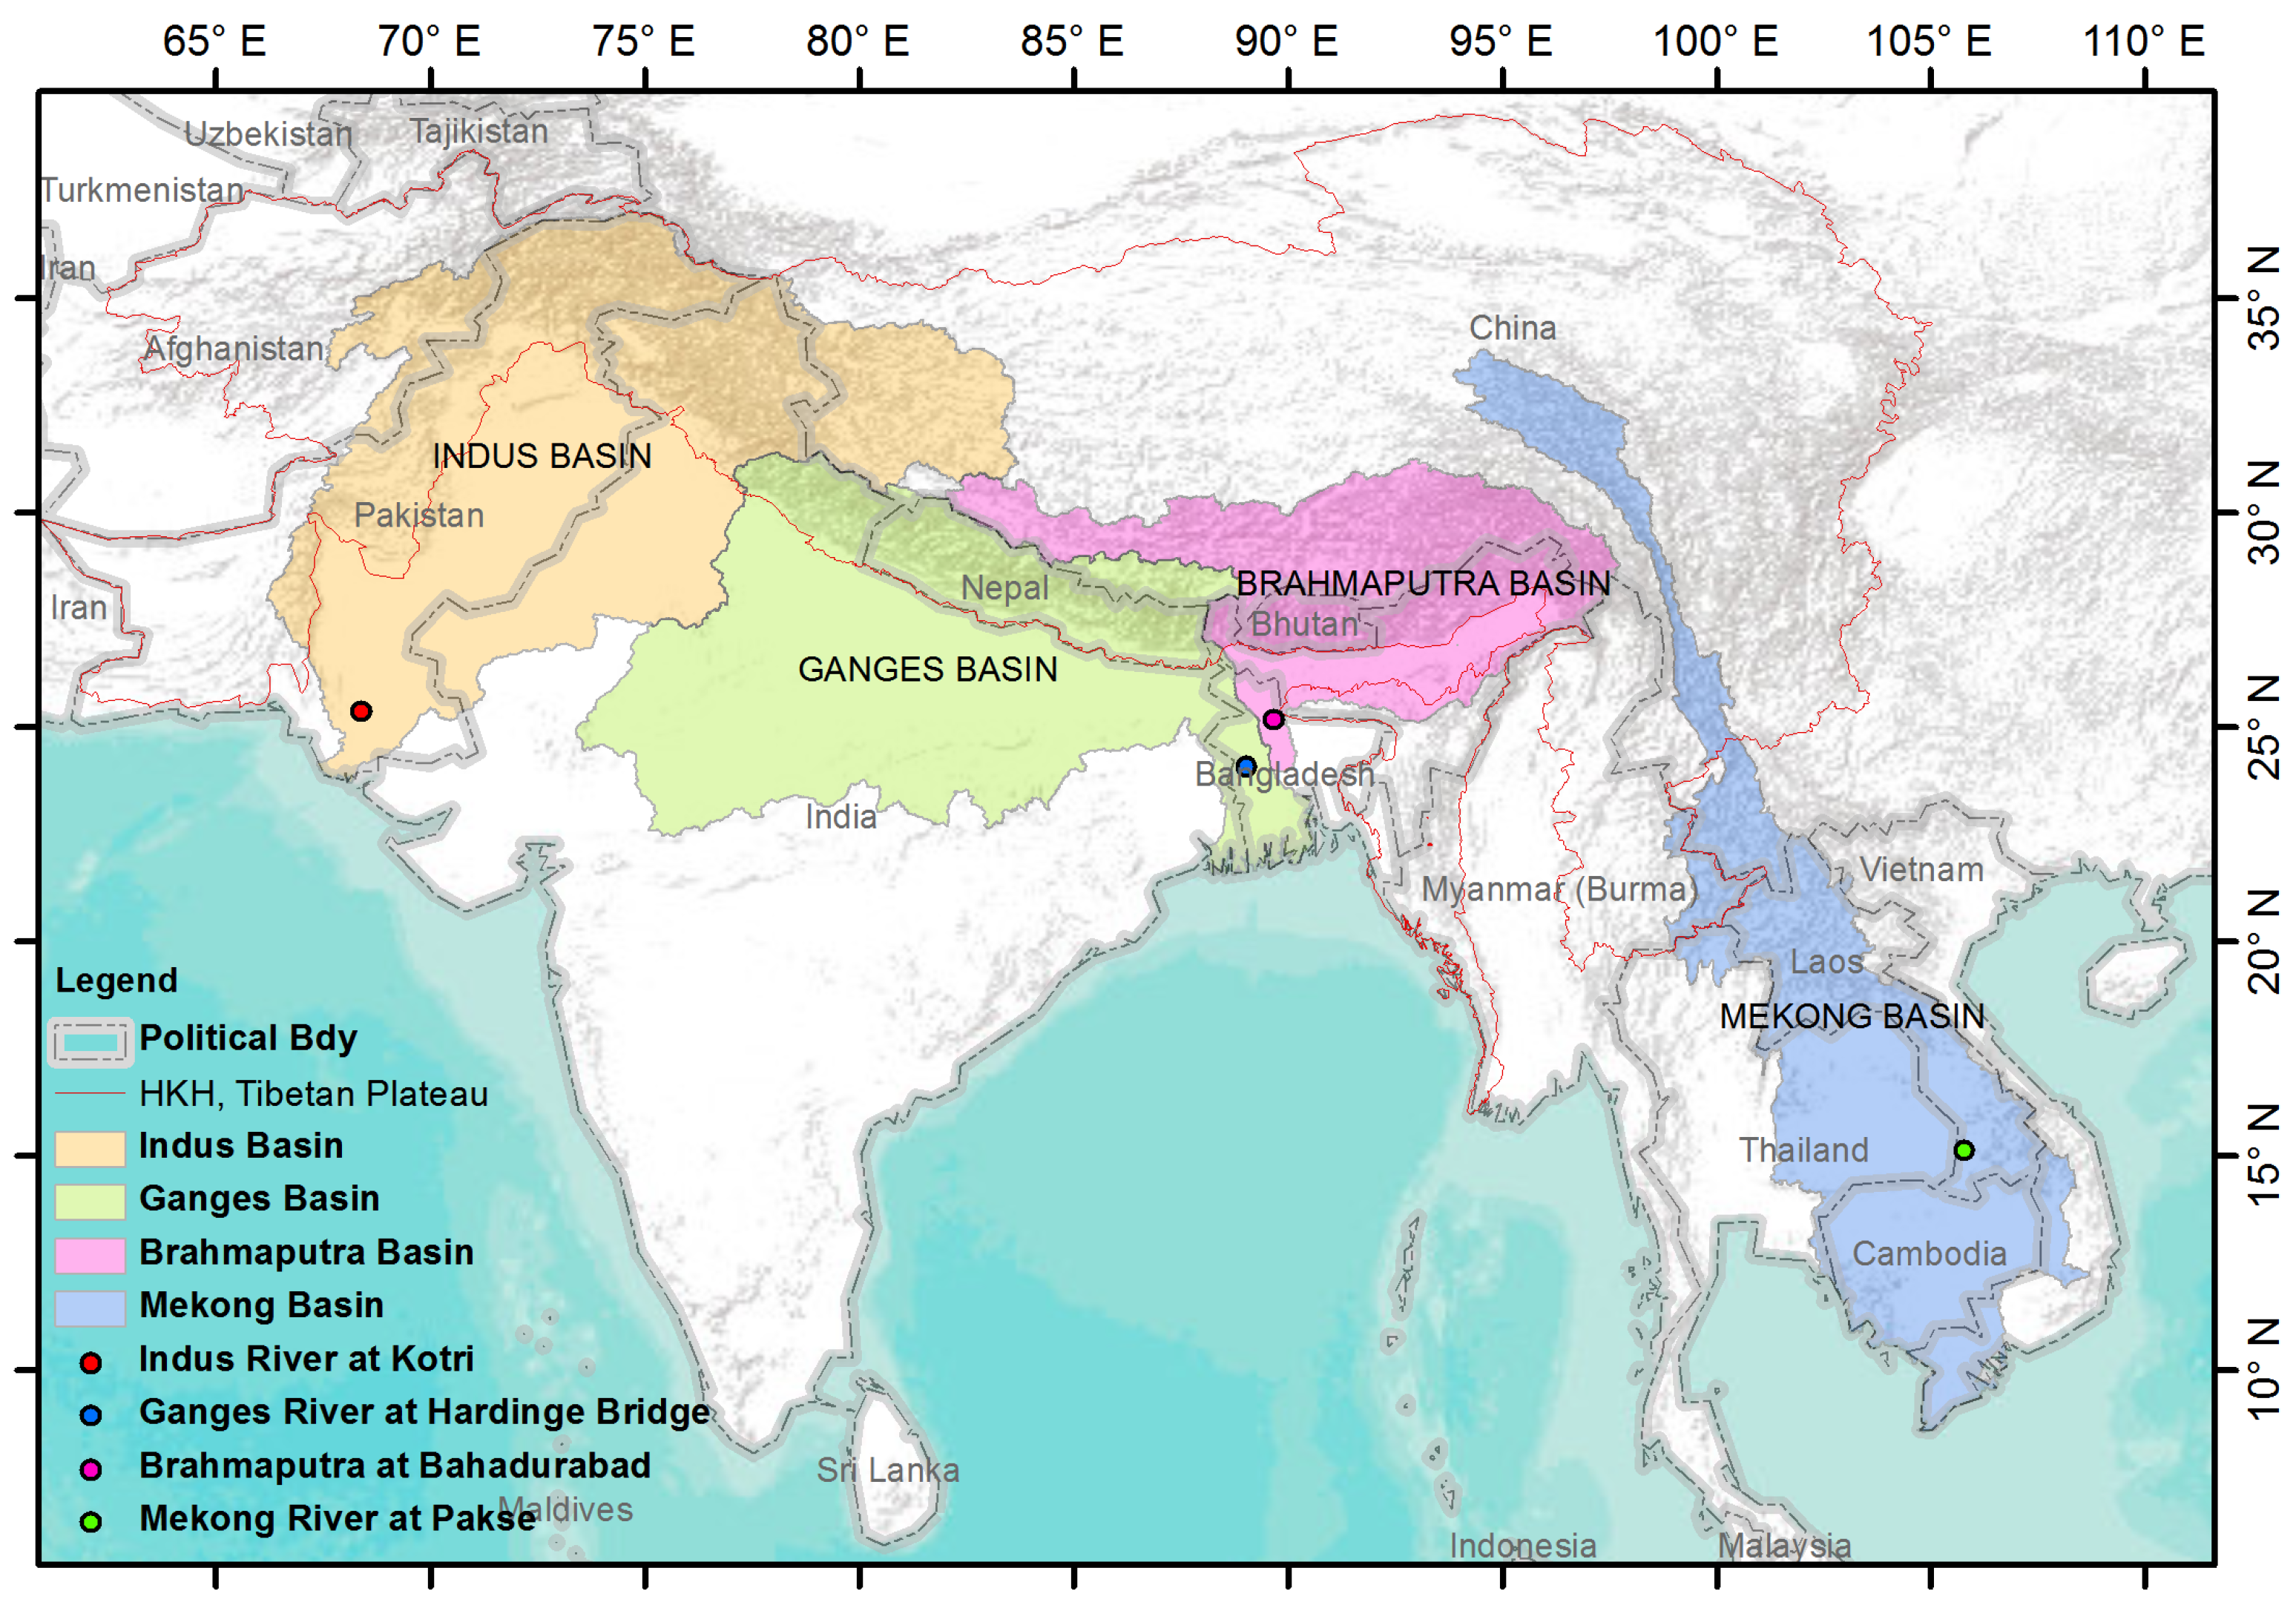
2. Study Area
3. Data Used
4. Methods
Skill Metrics
5. Results and Discussions
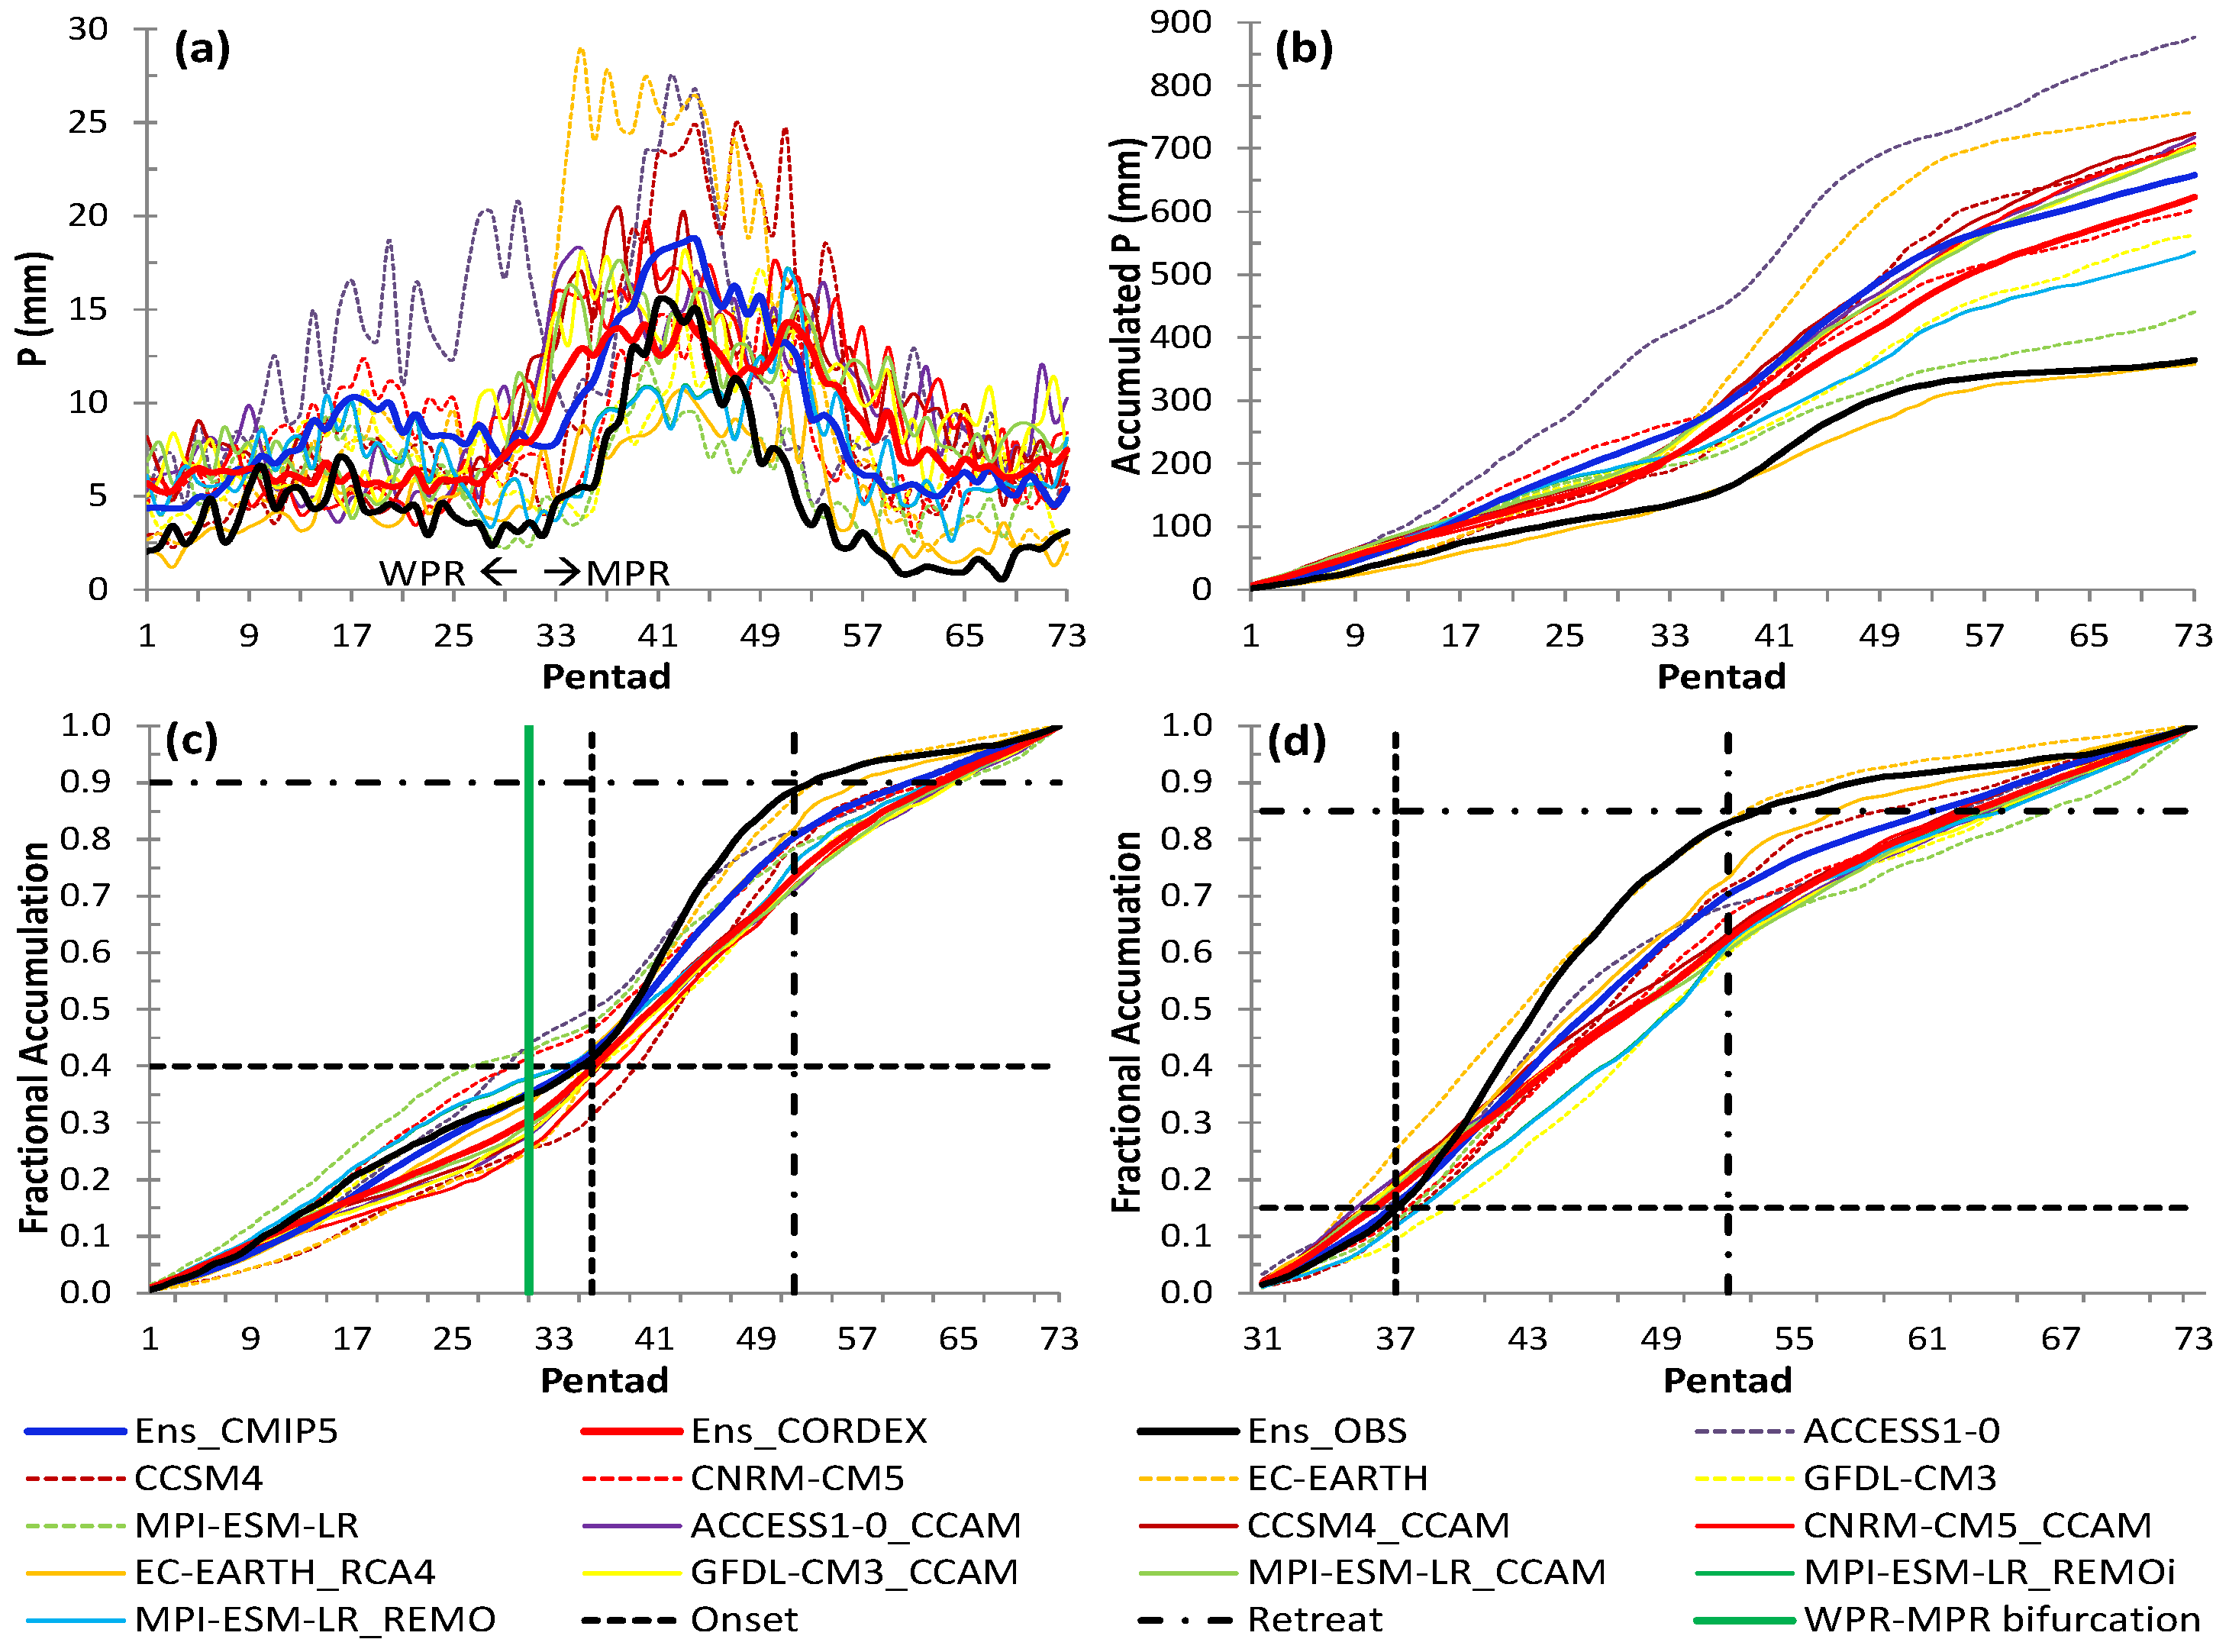
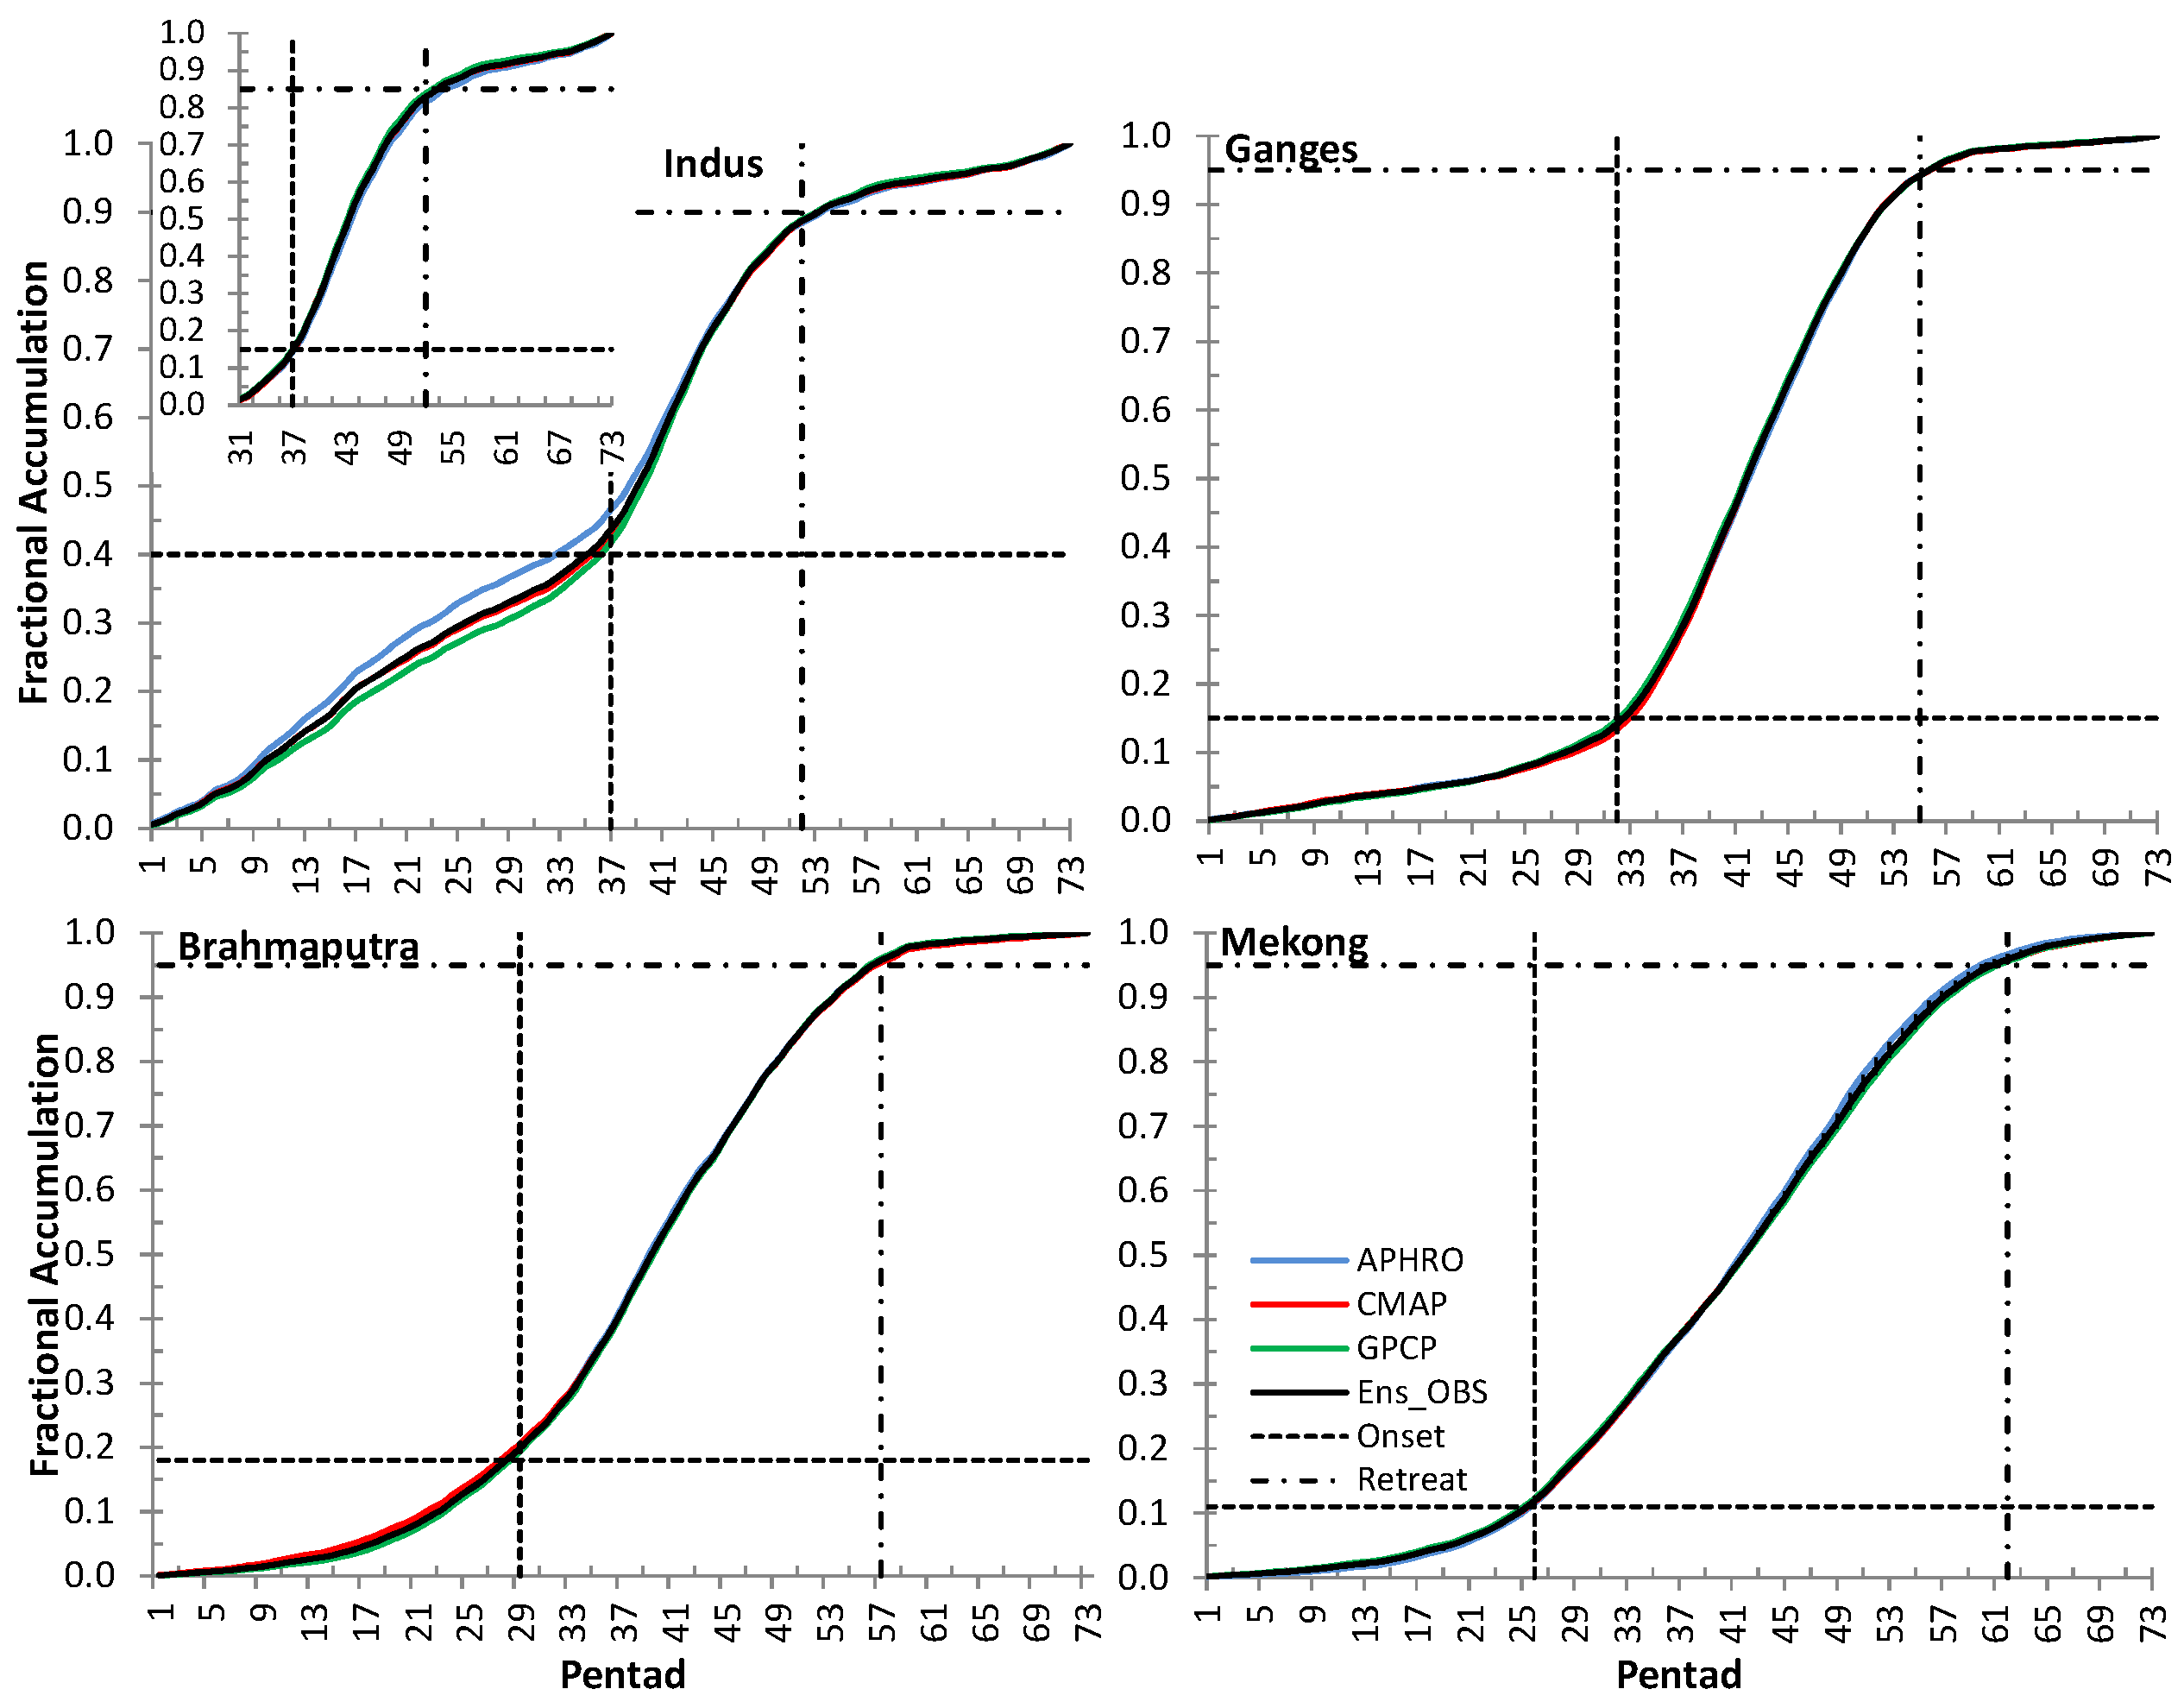
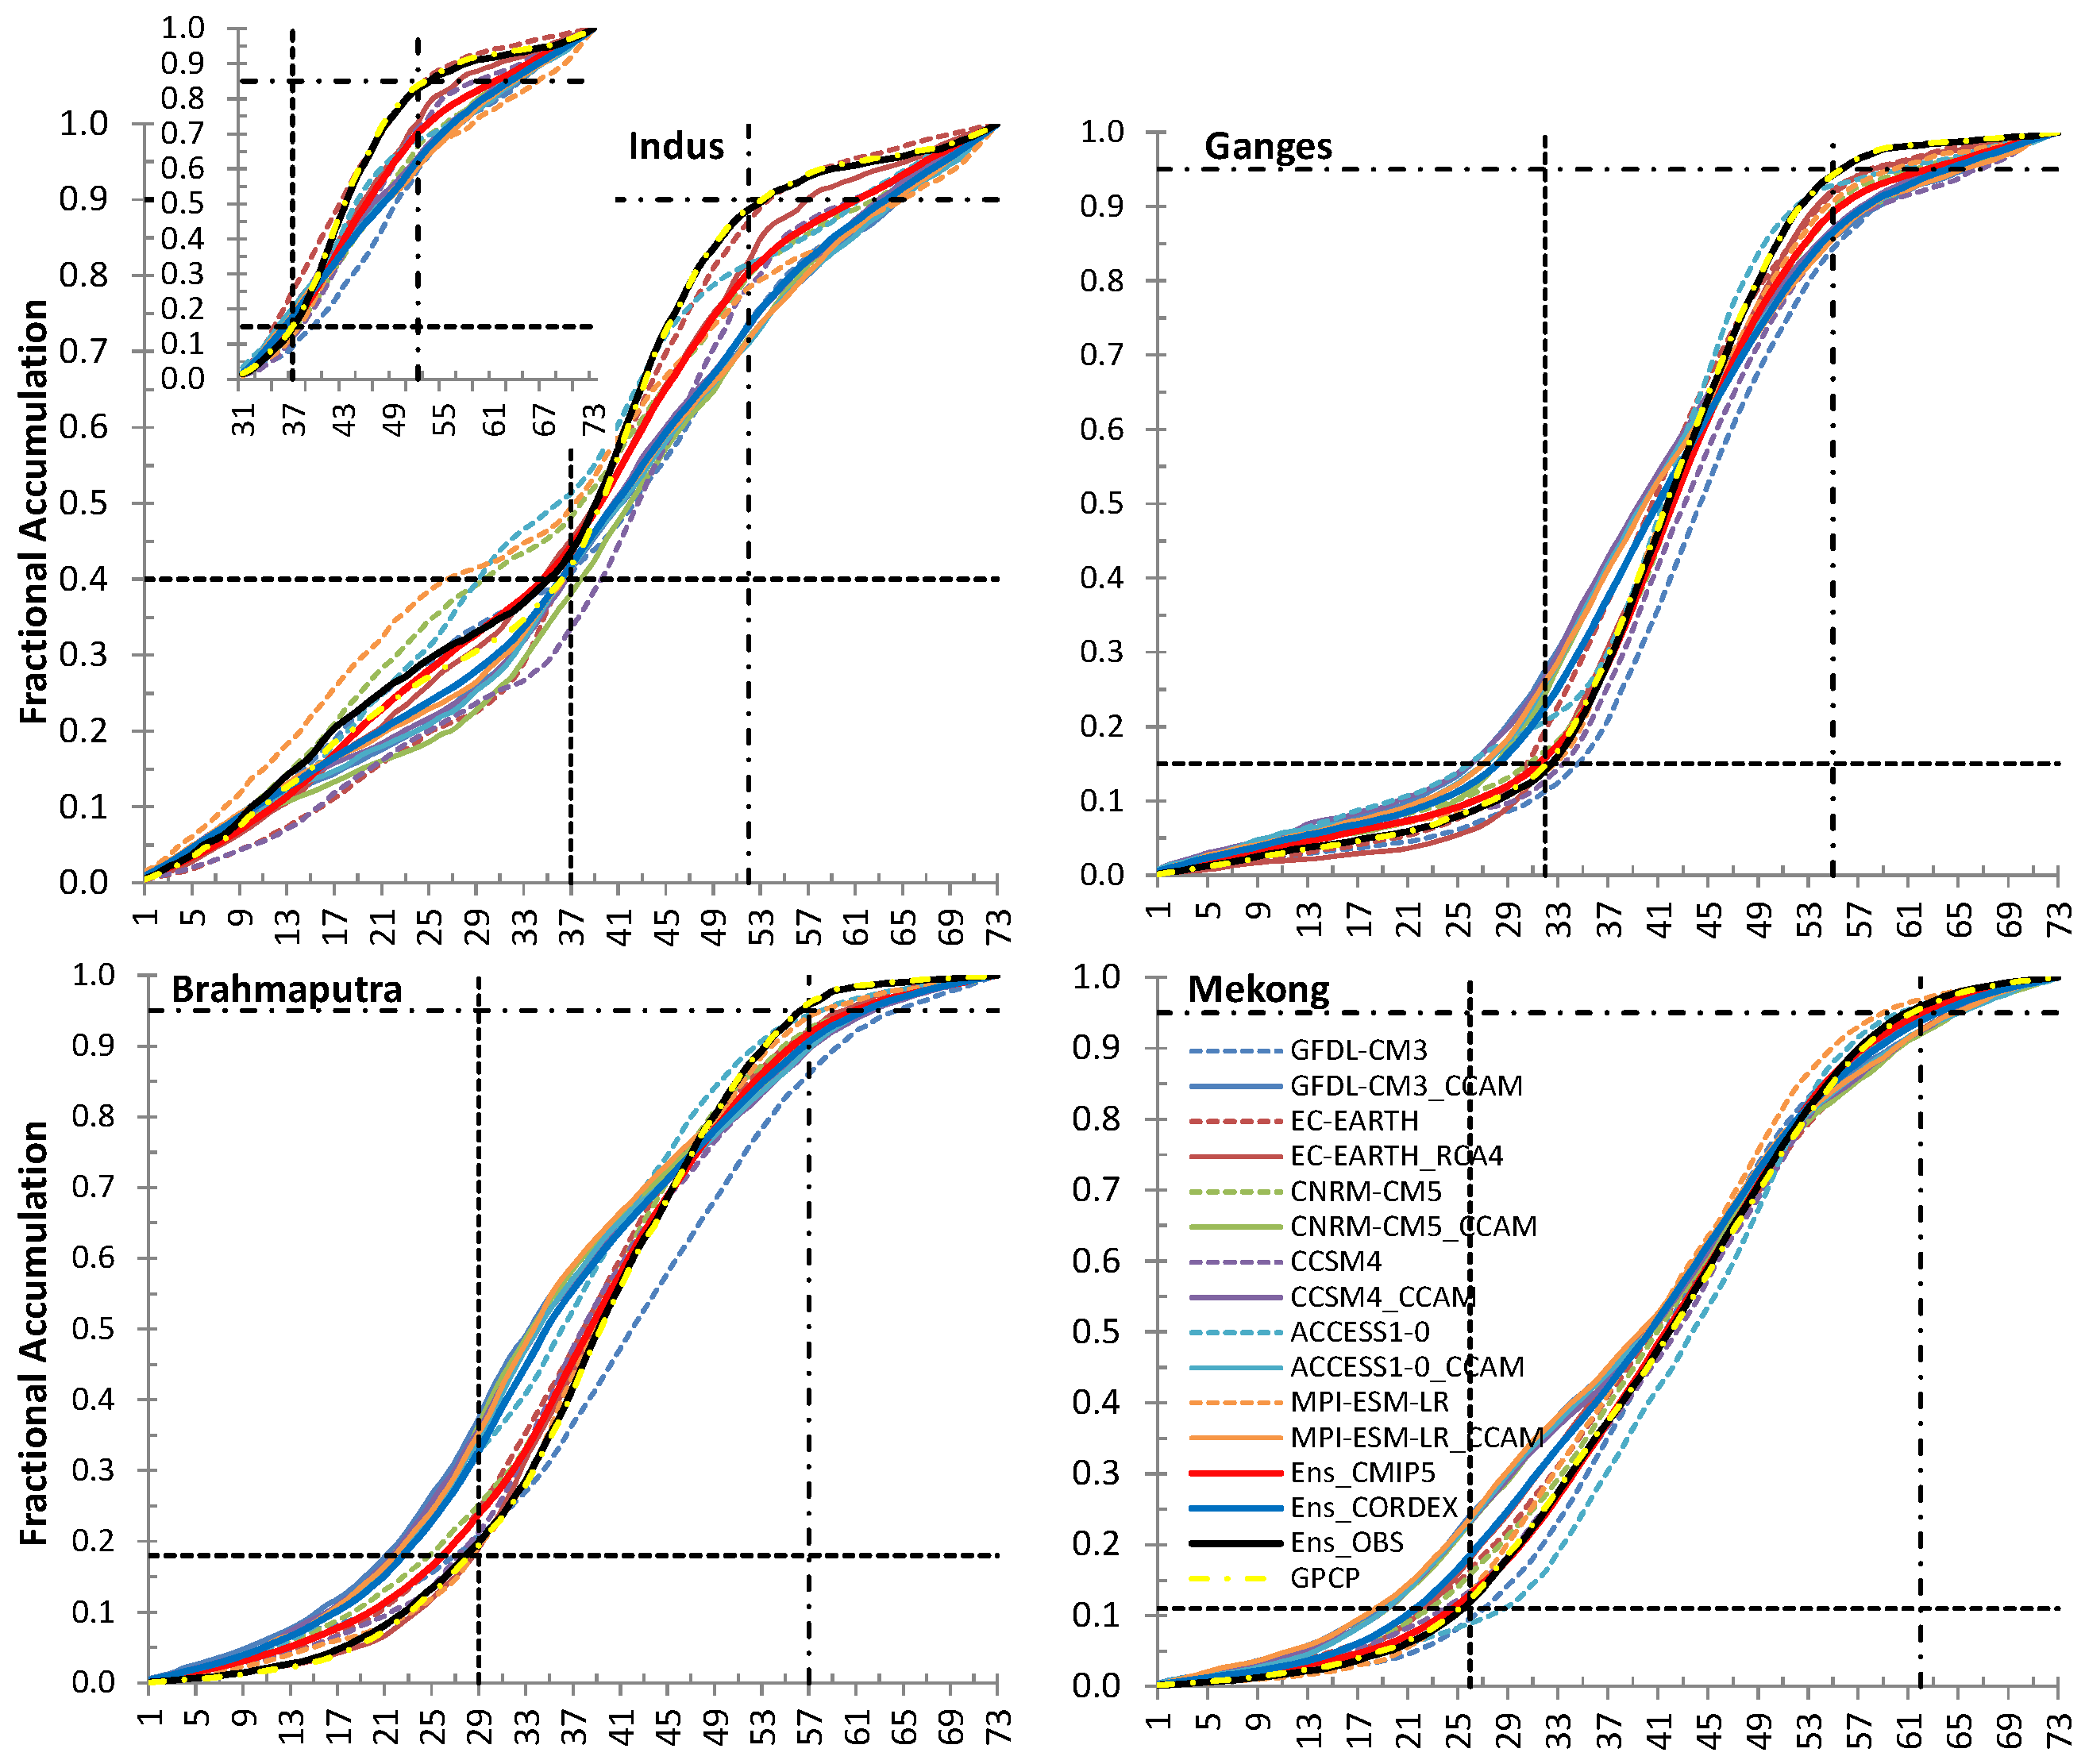
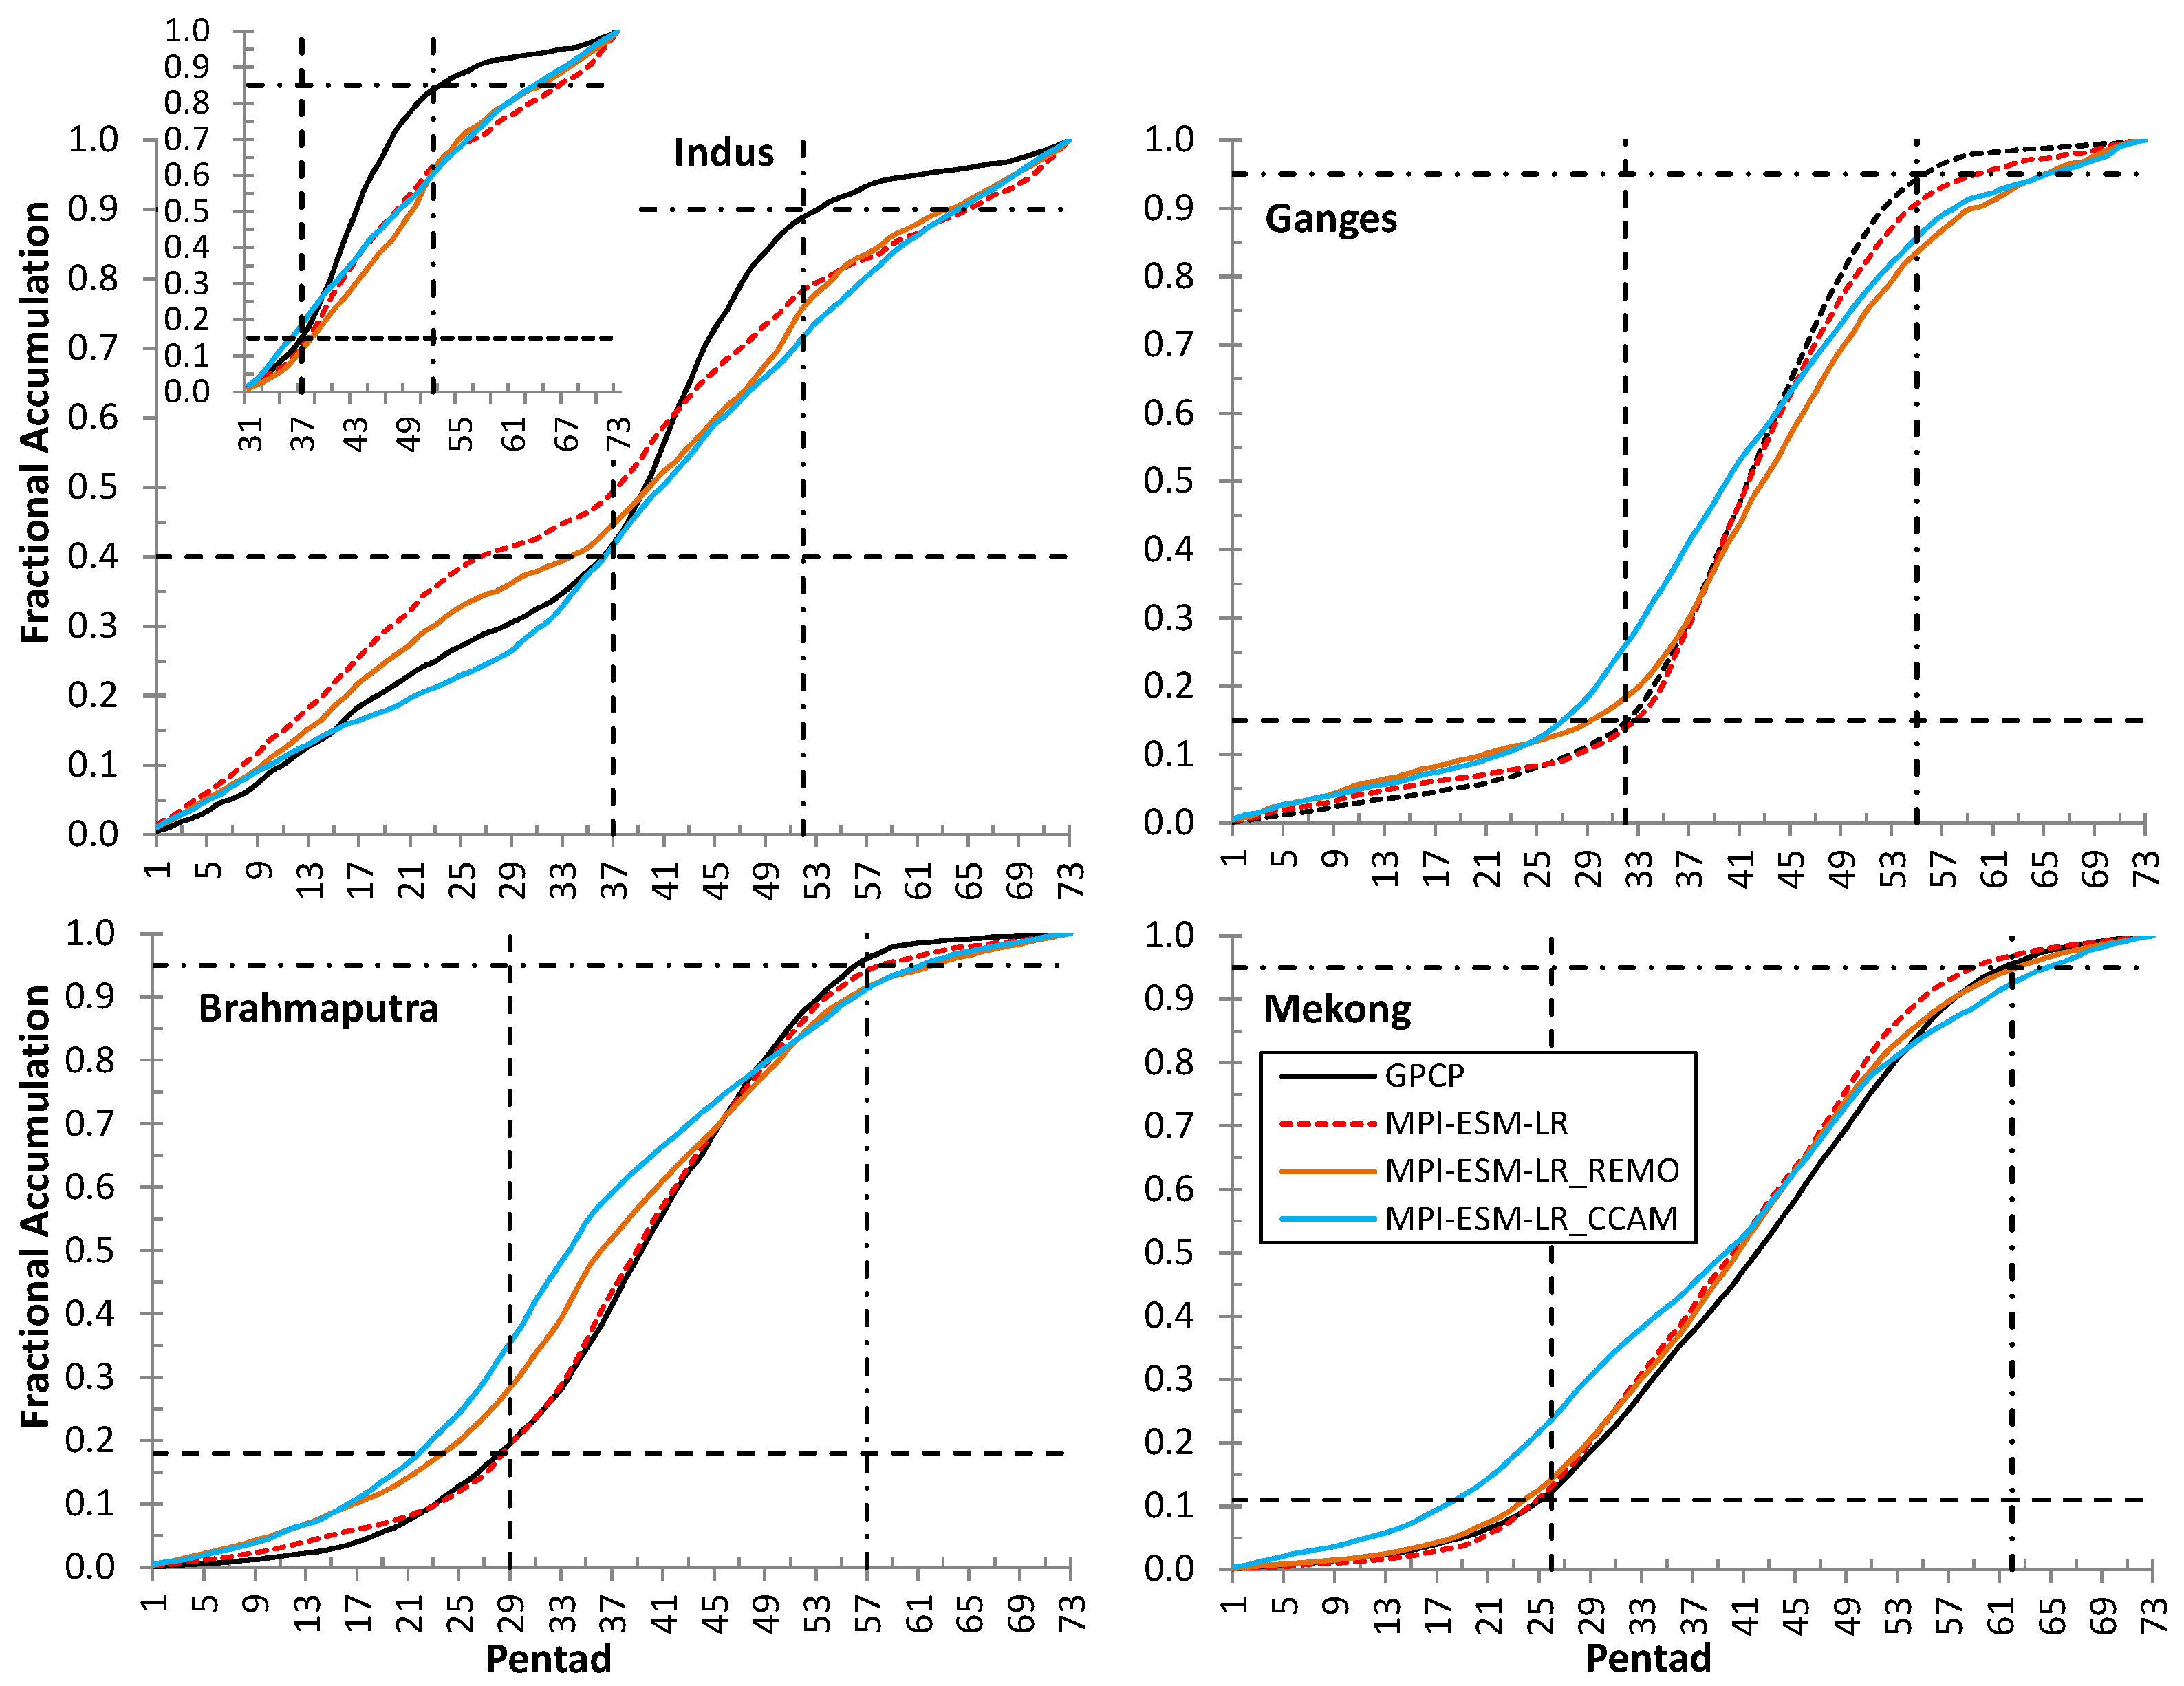
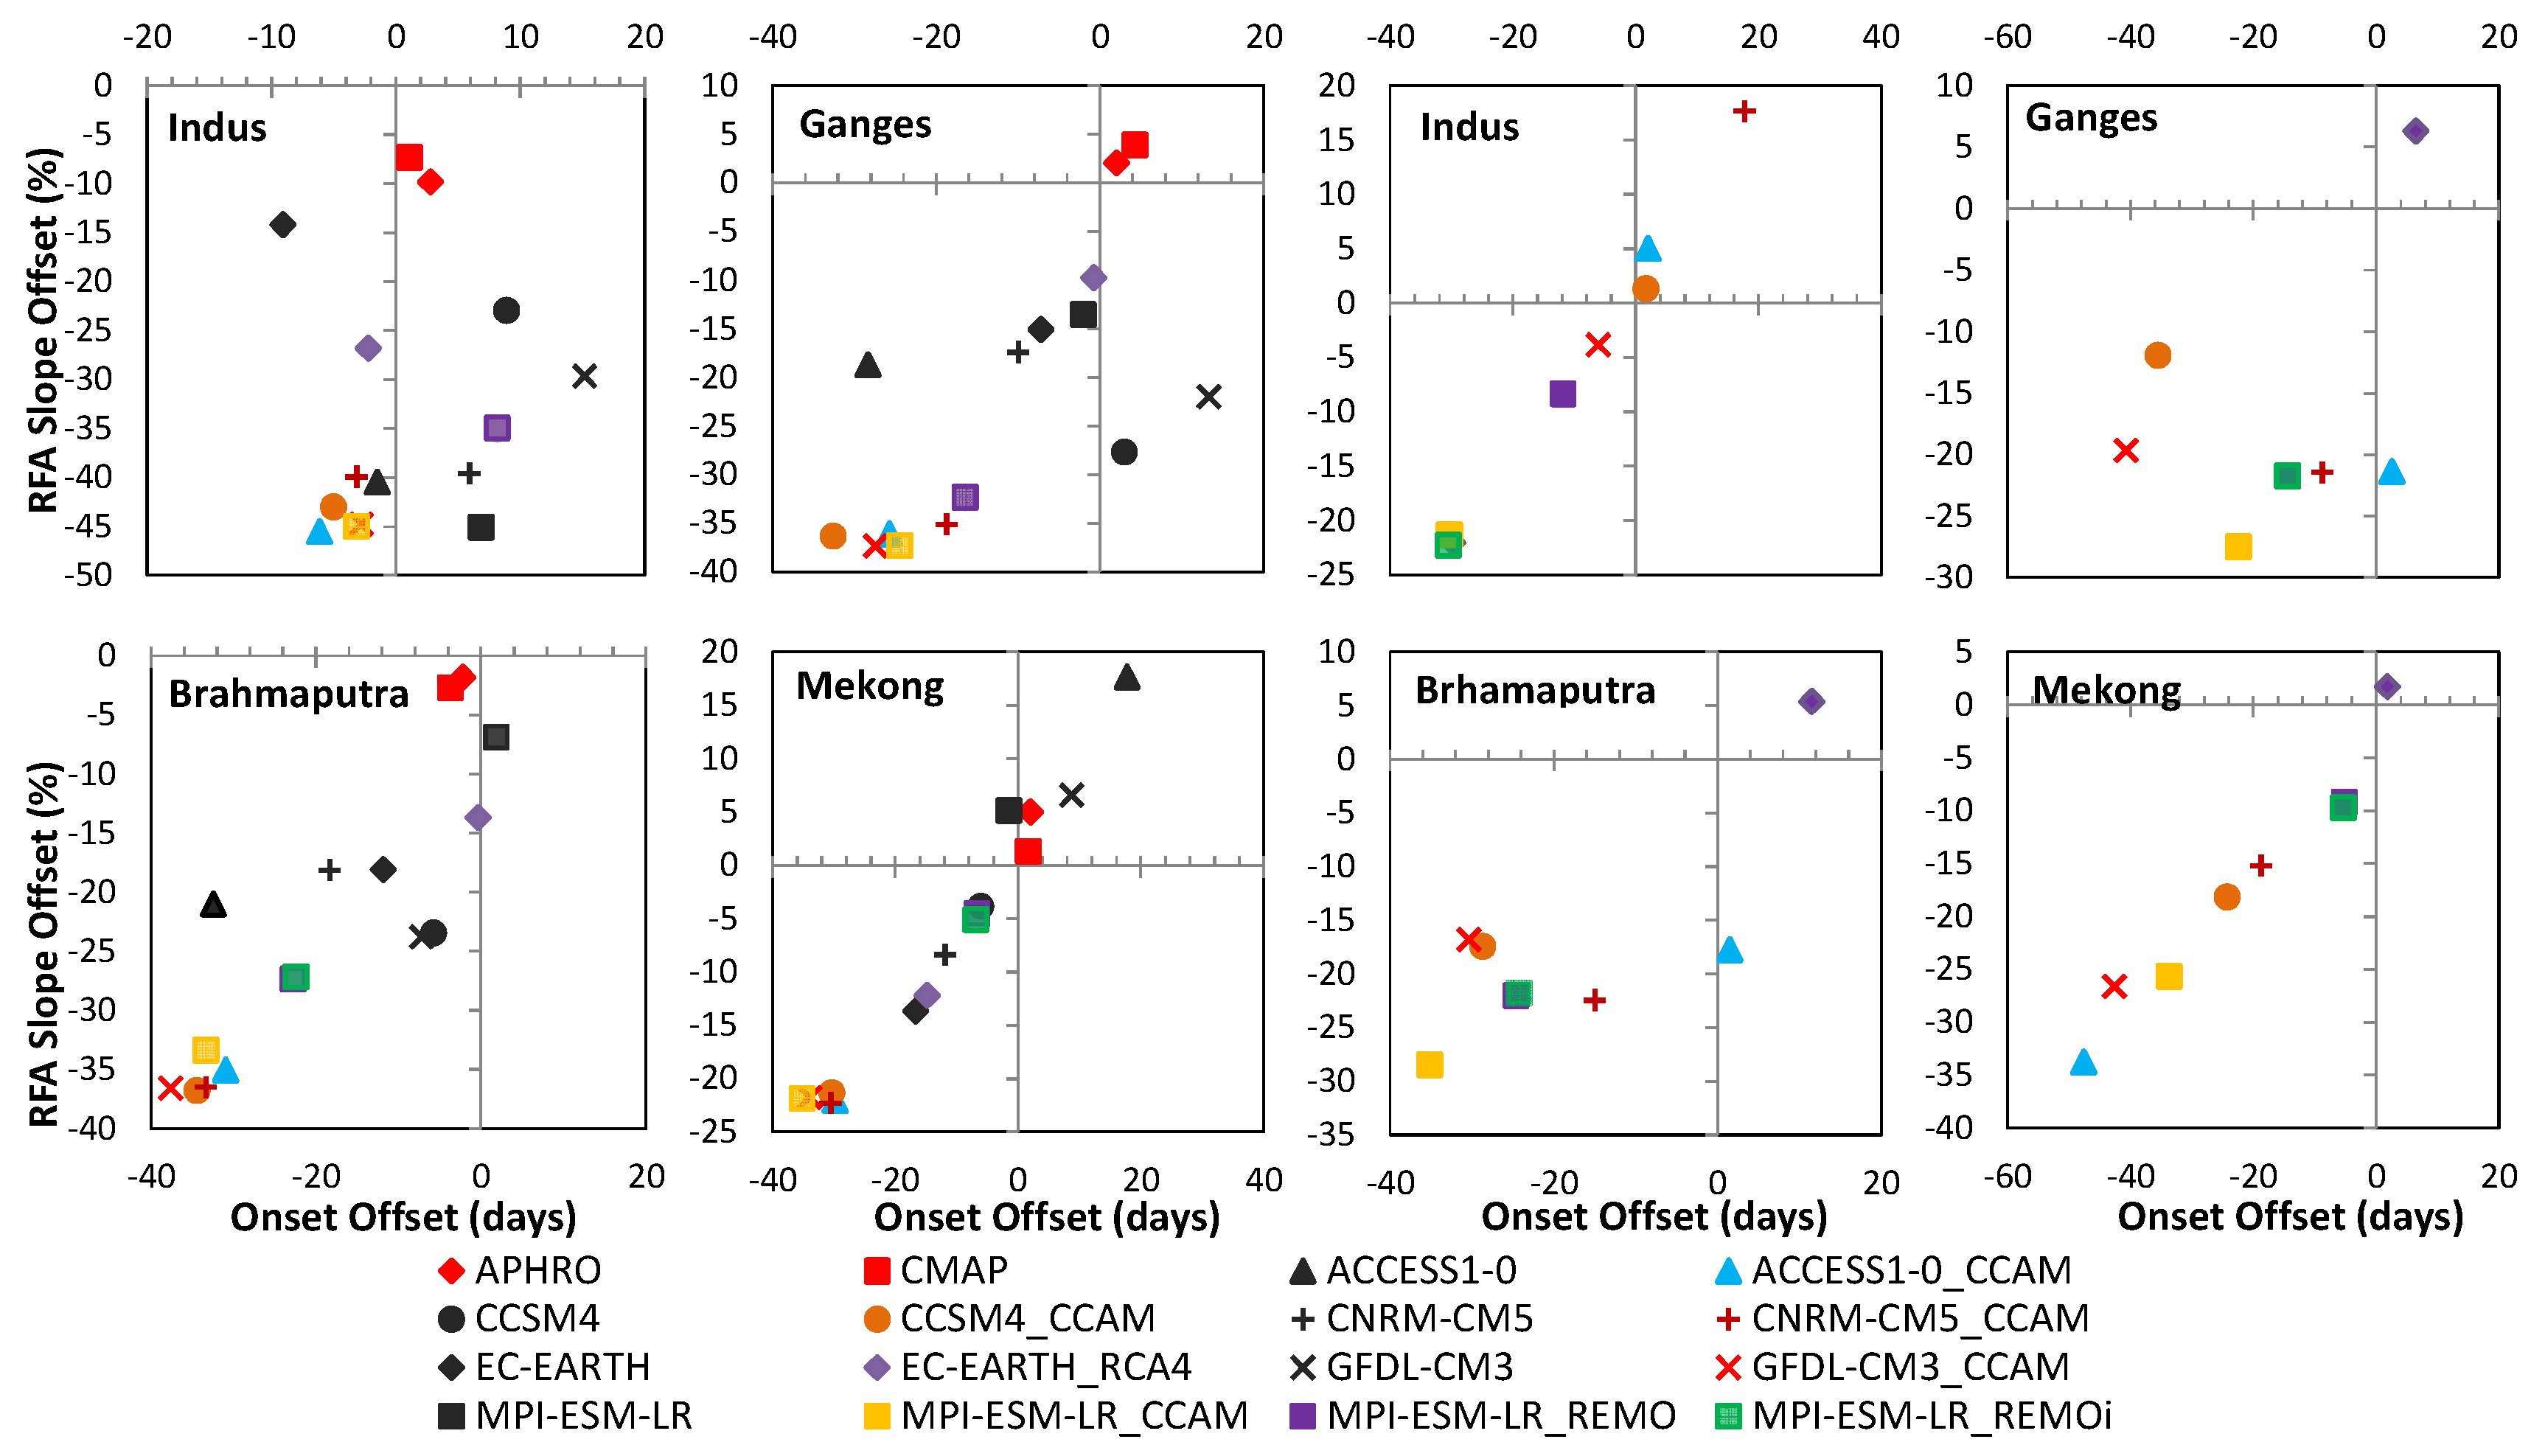
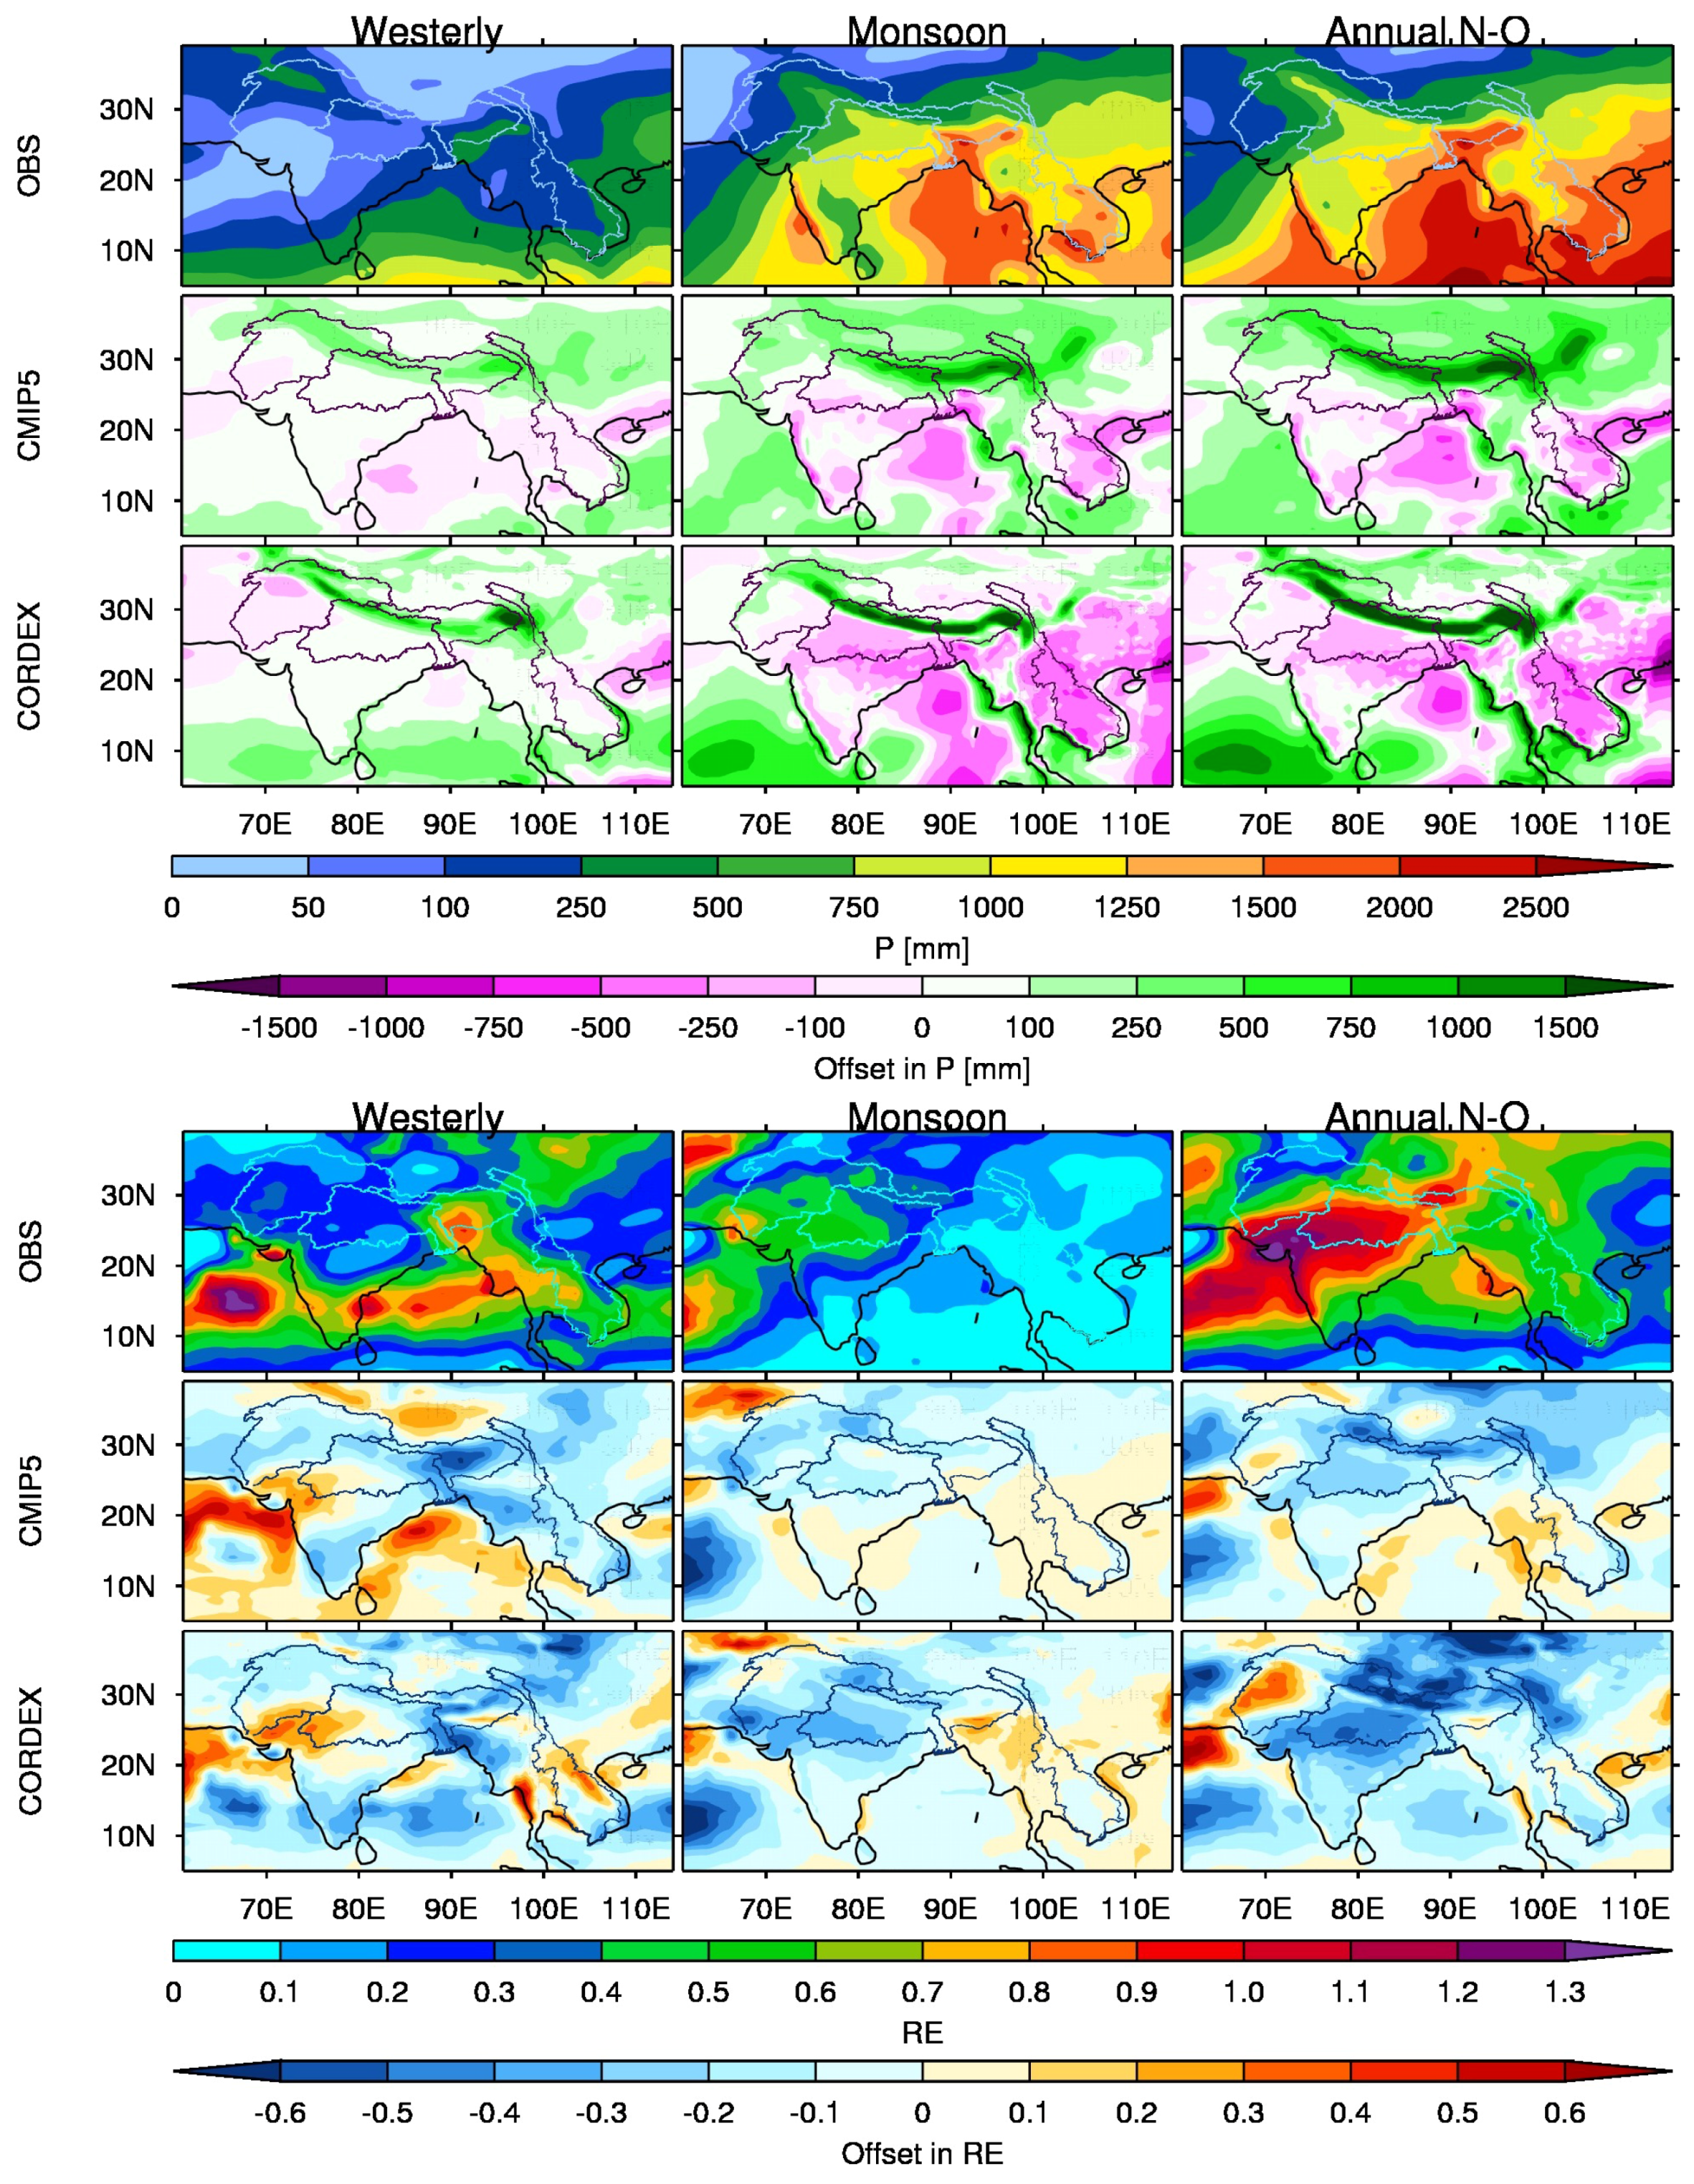
5.1. Statistical Properties of Monsoonal Precipitation Regime
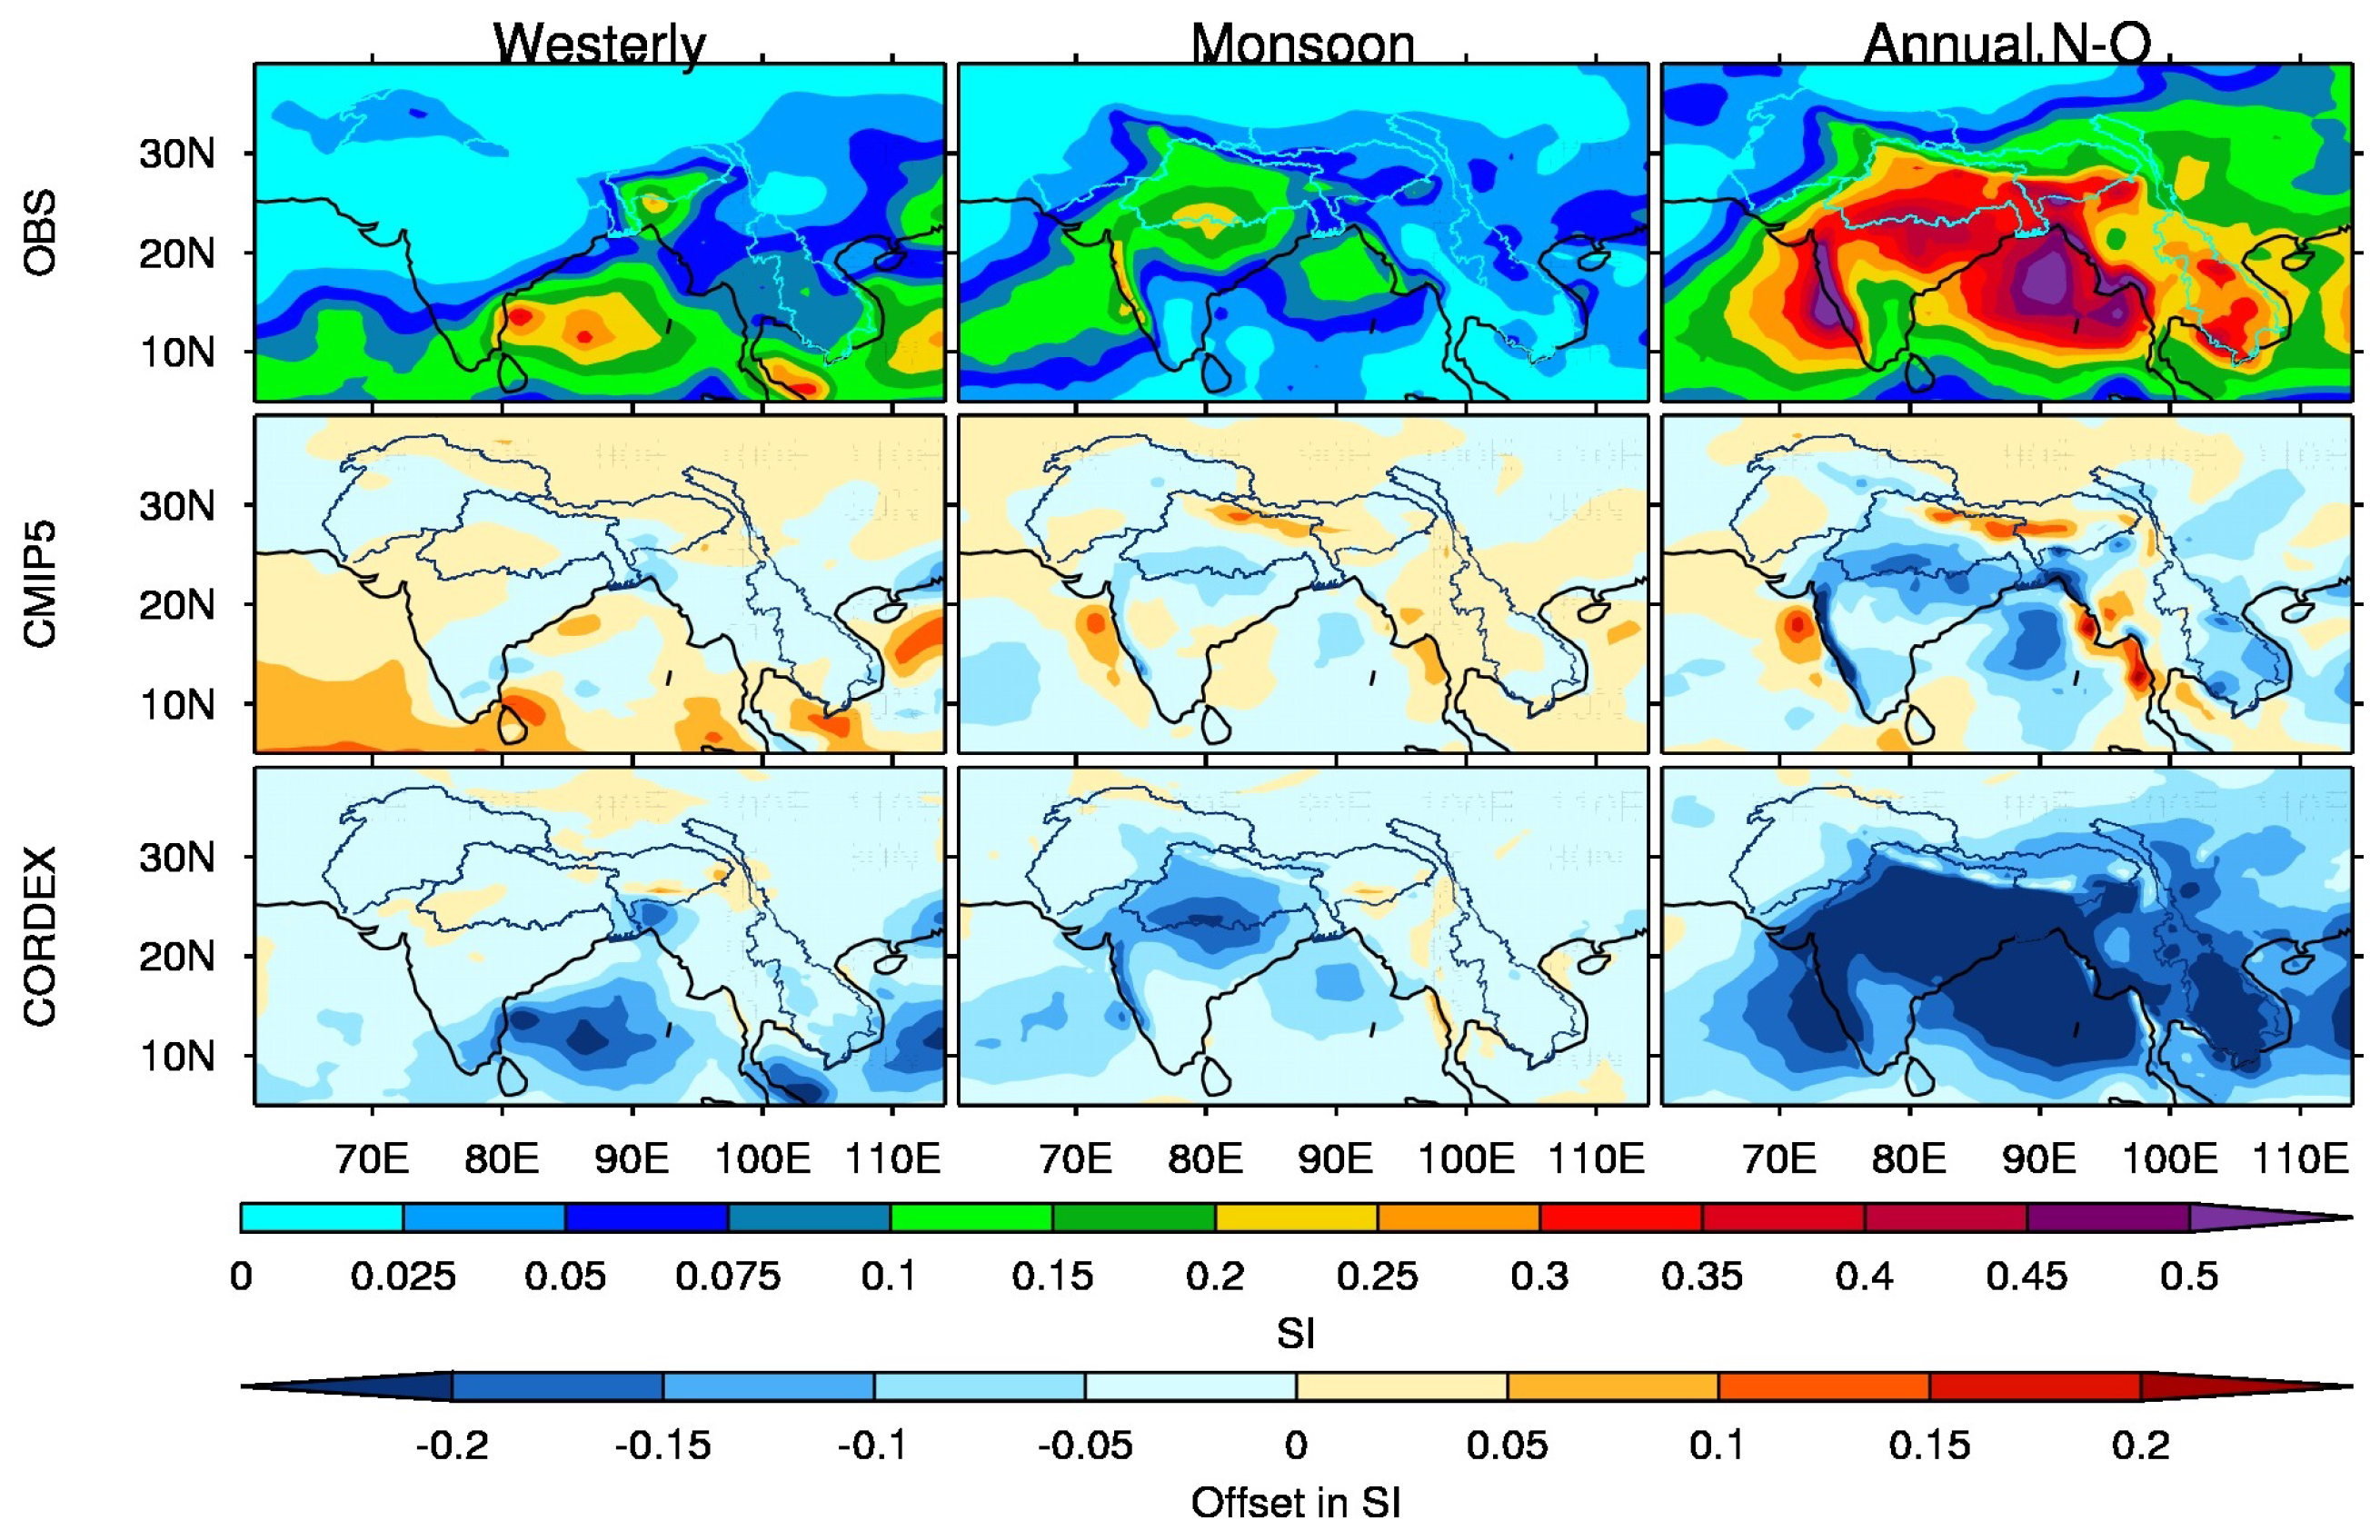
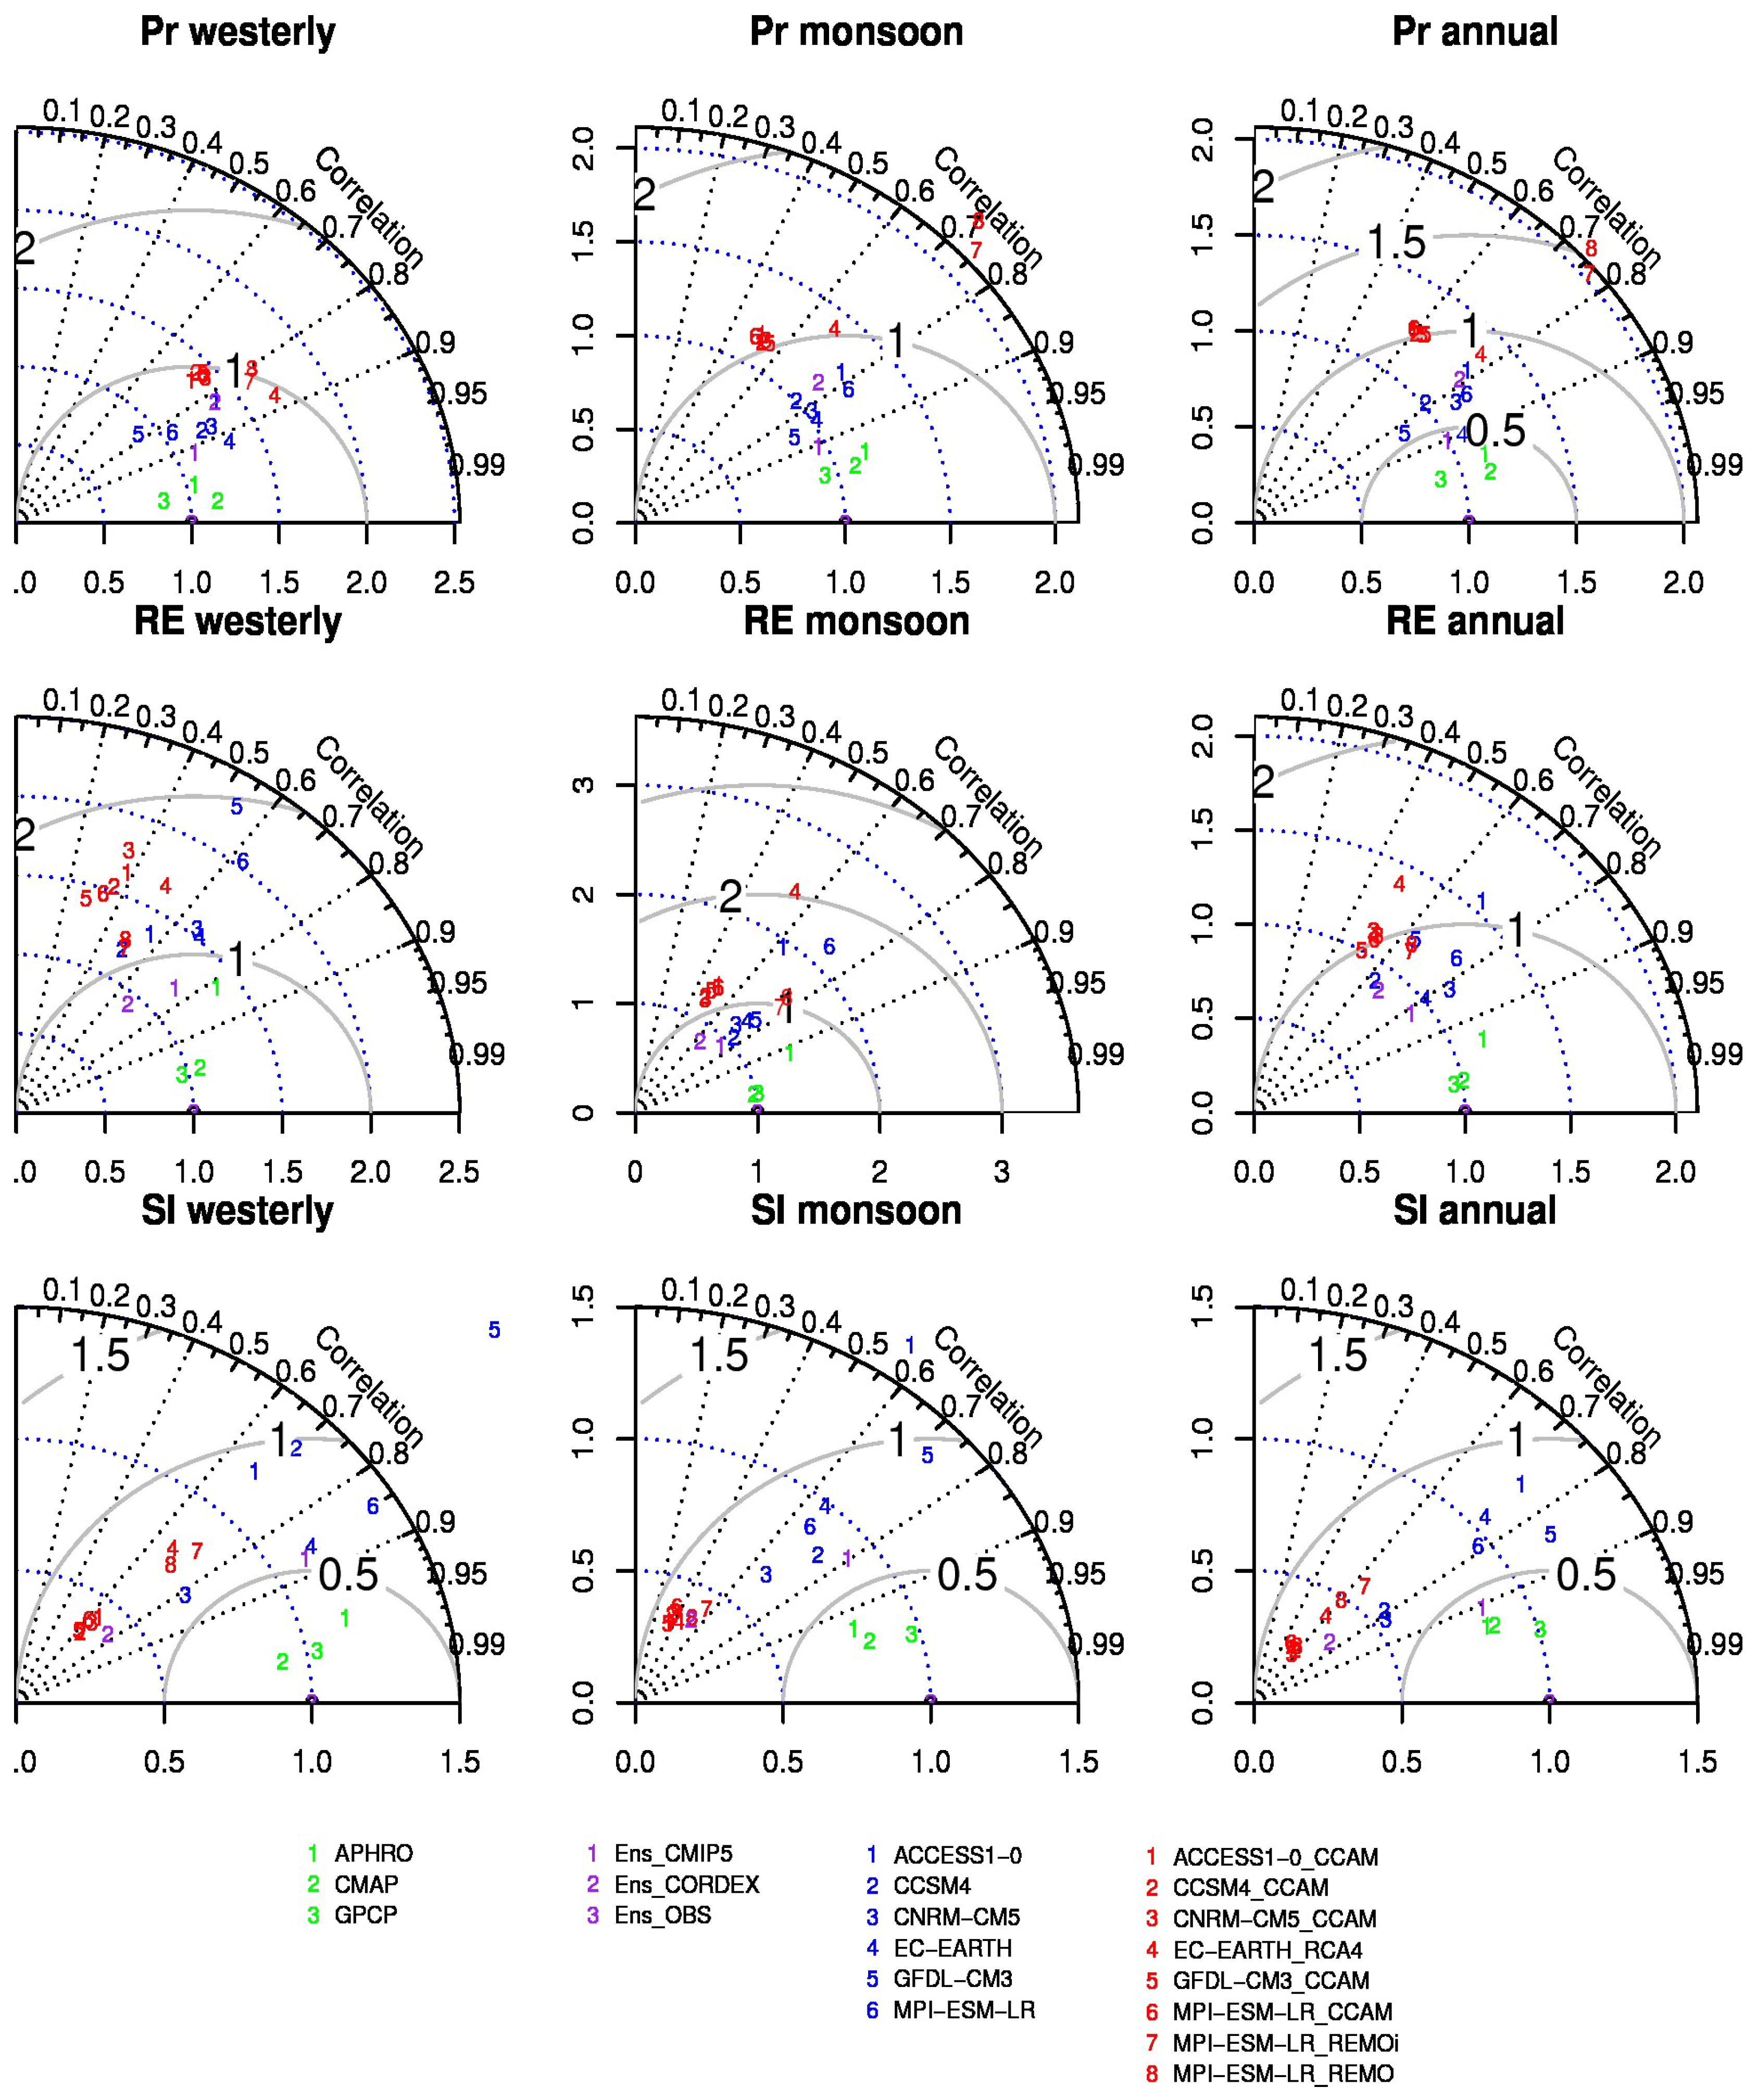
5.2. Seasonality Indices of Overall Precipitation Regimes
5.2.1. Monsoonal Precipitation Regime
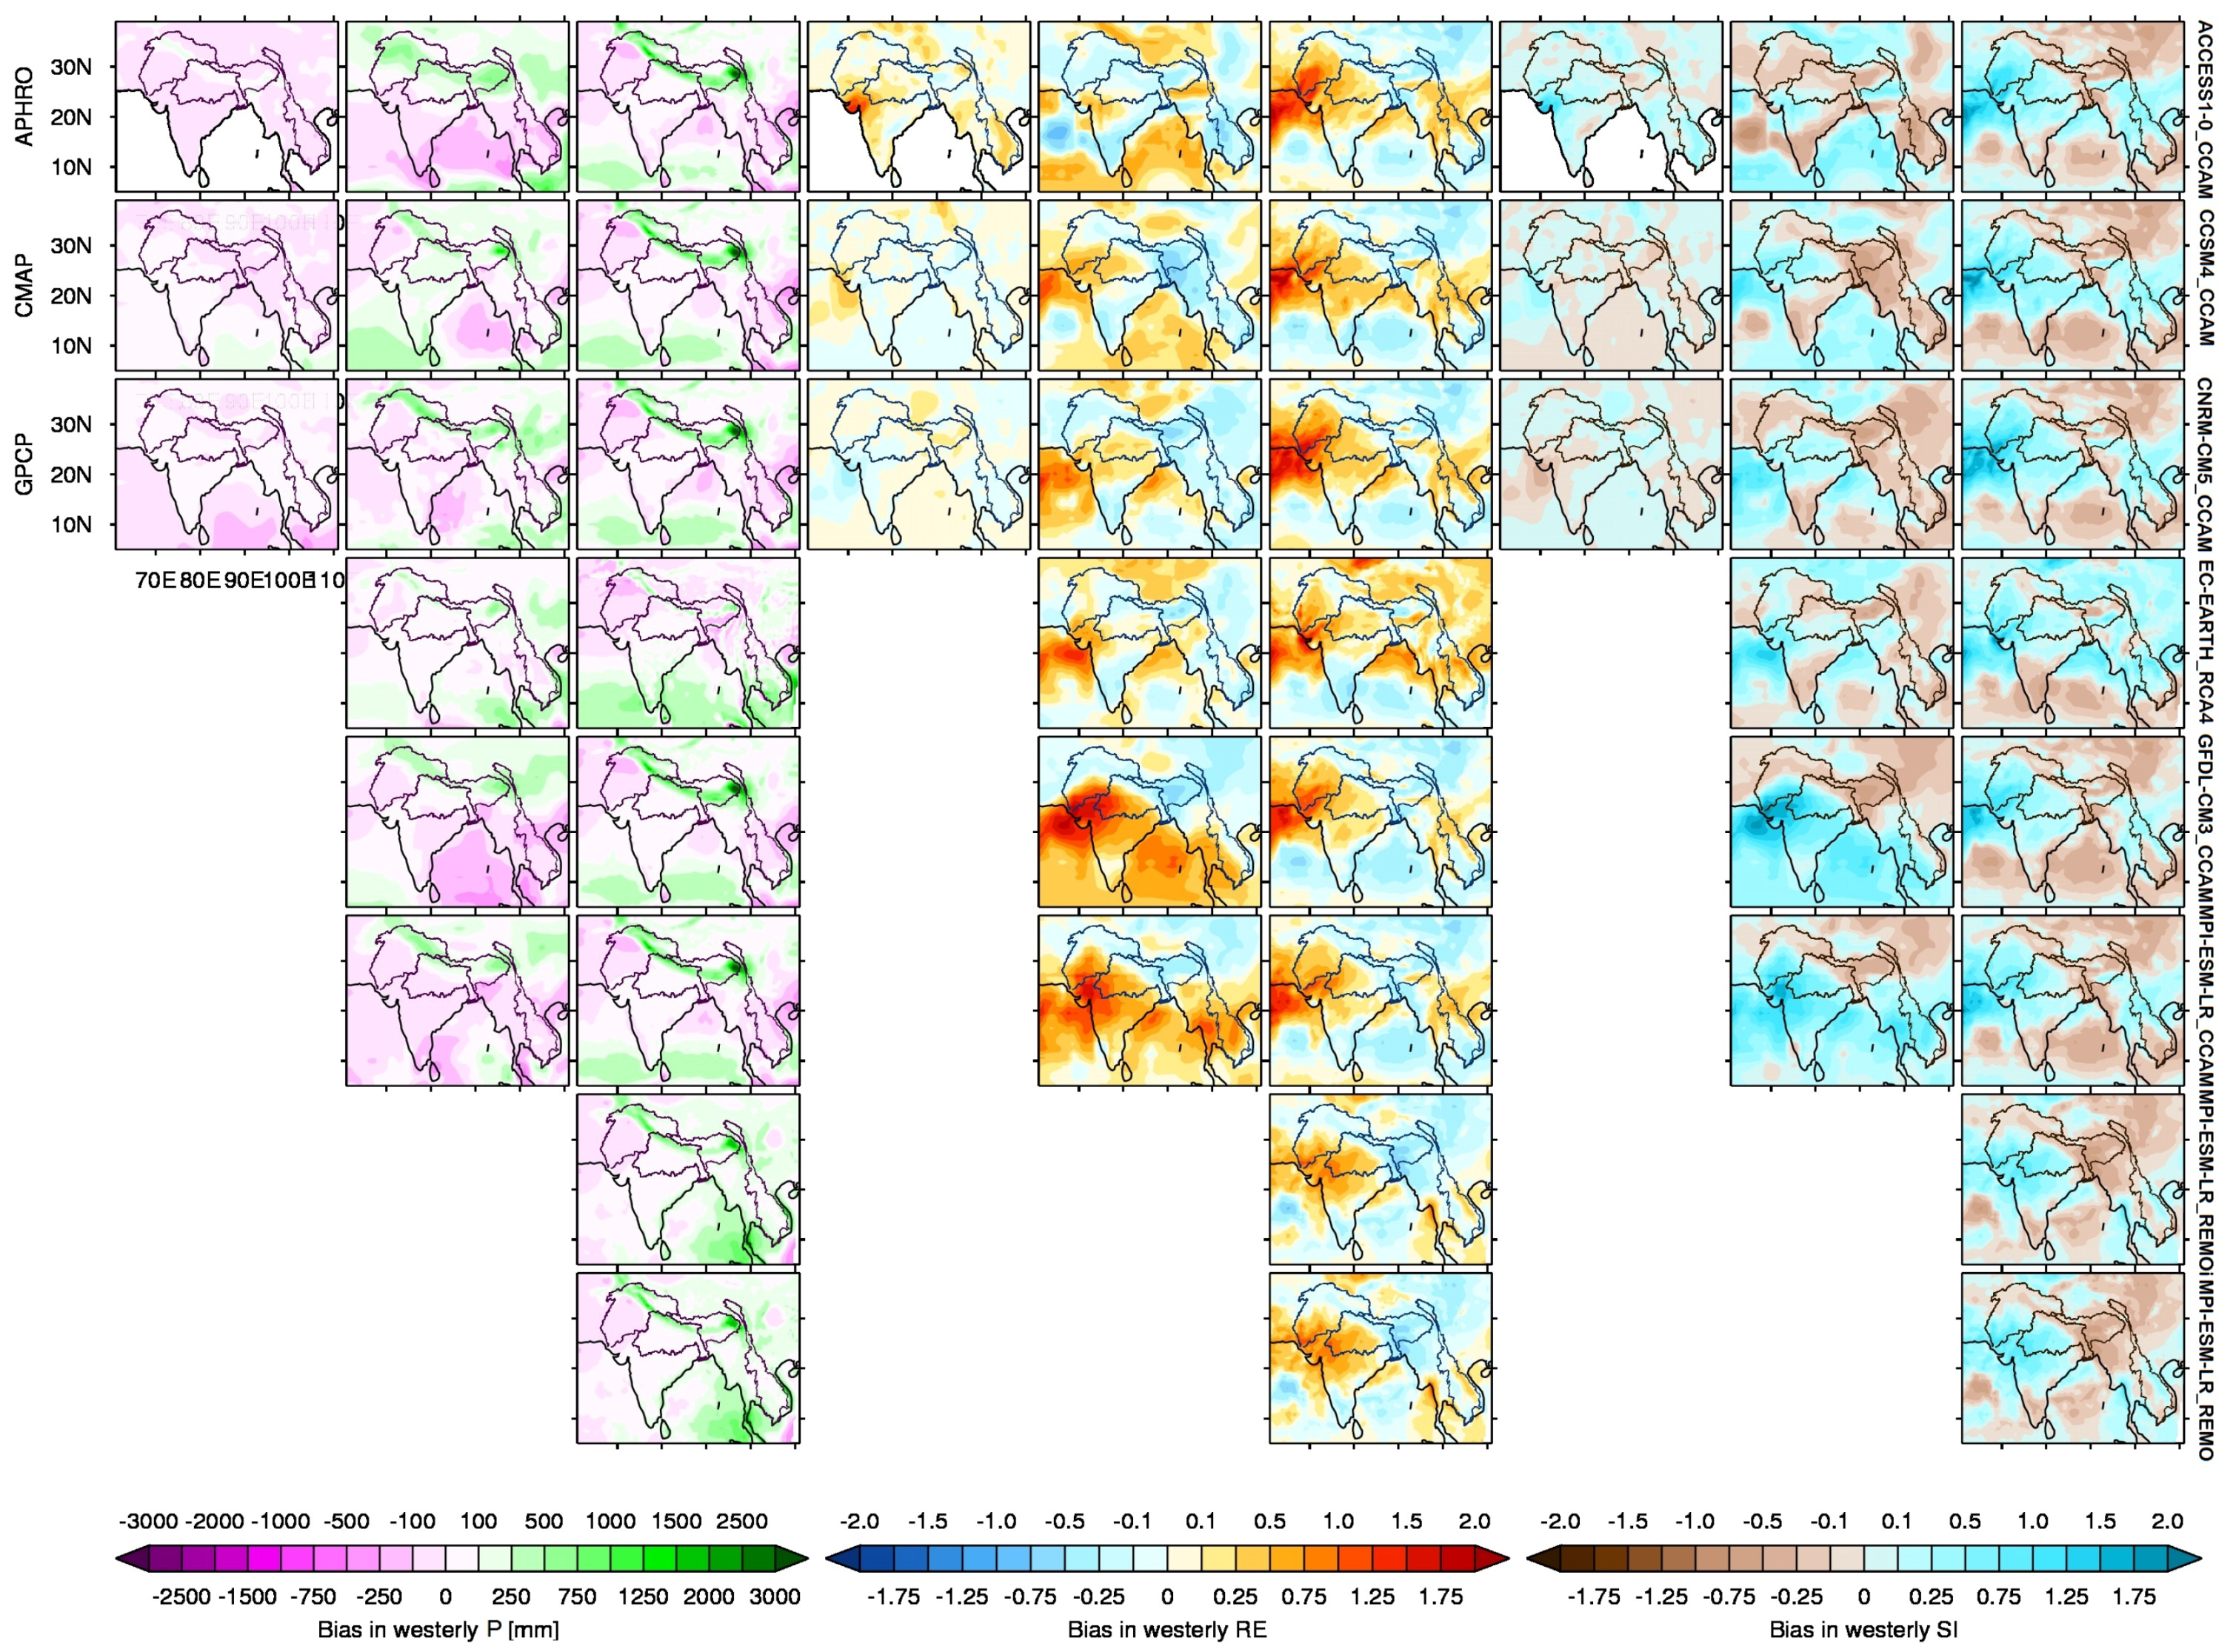
5.2.2. Westerly Precipitation Regime
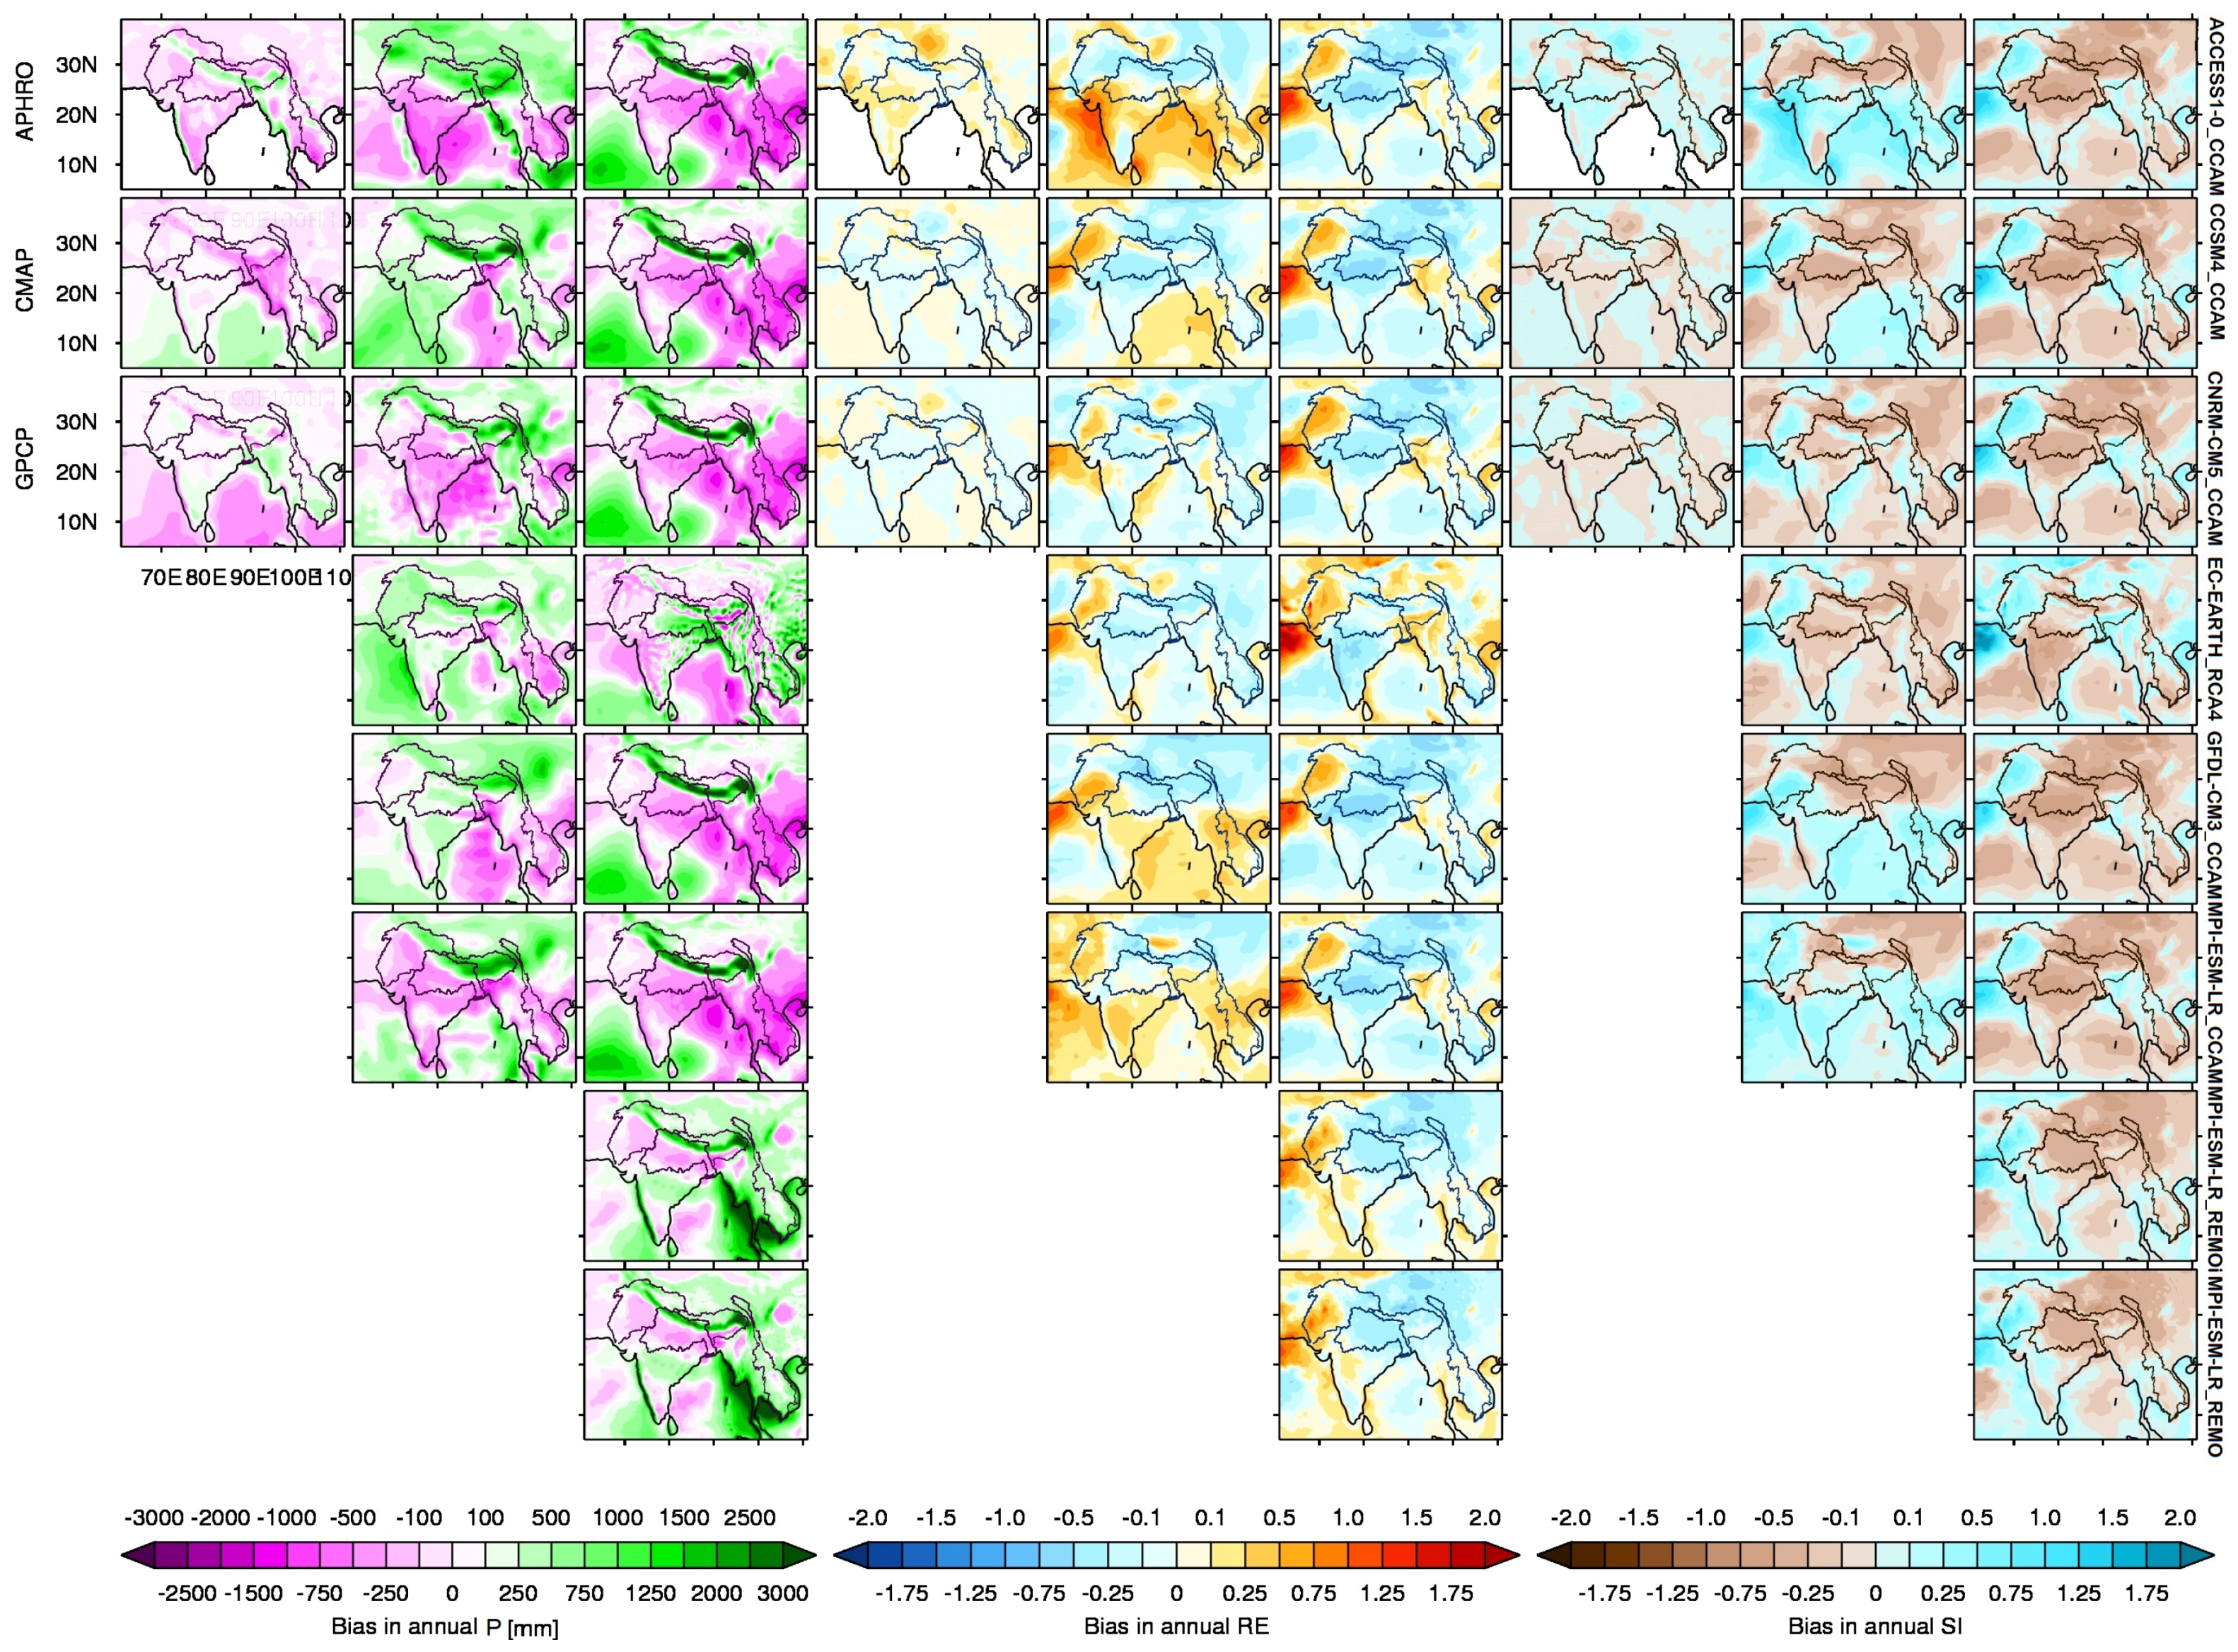
5.2.3. Overall Precipitation Regime (Annual)
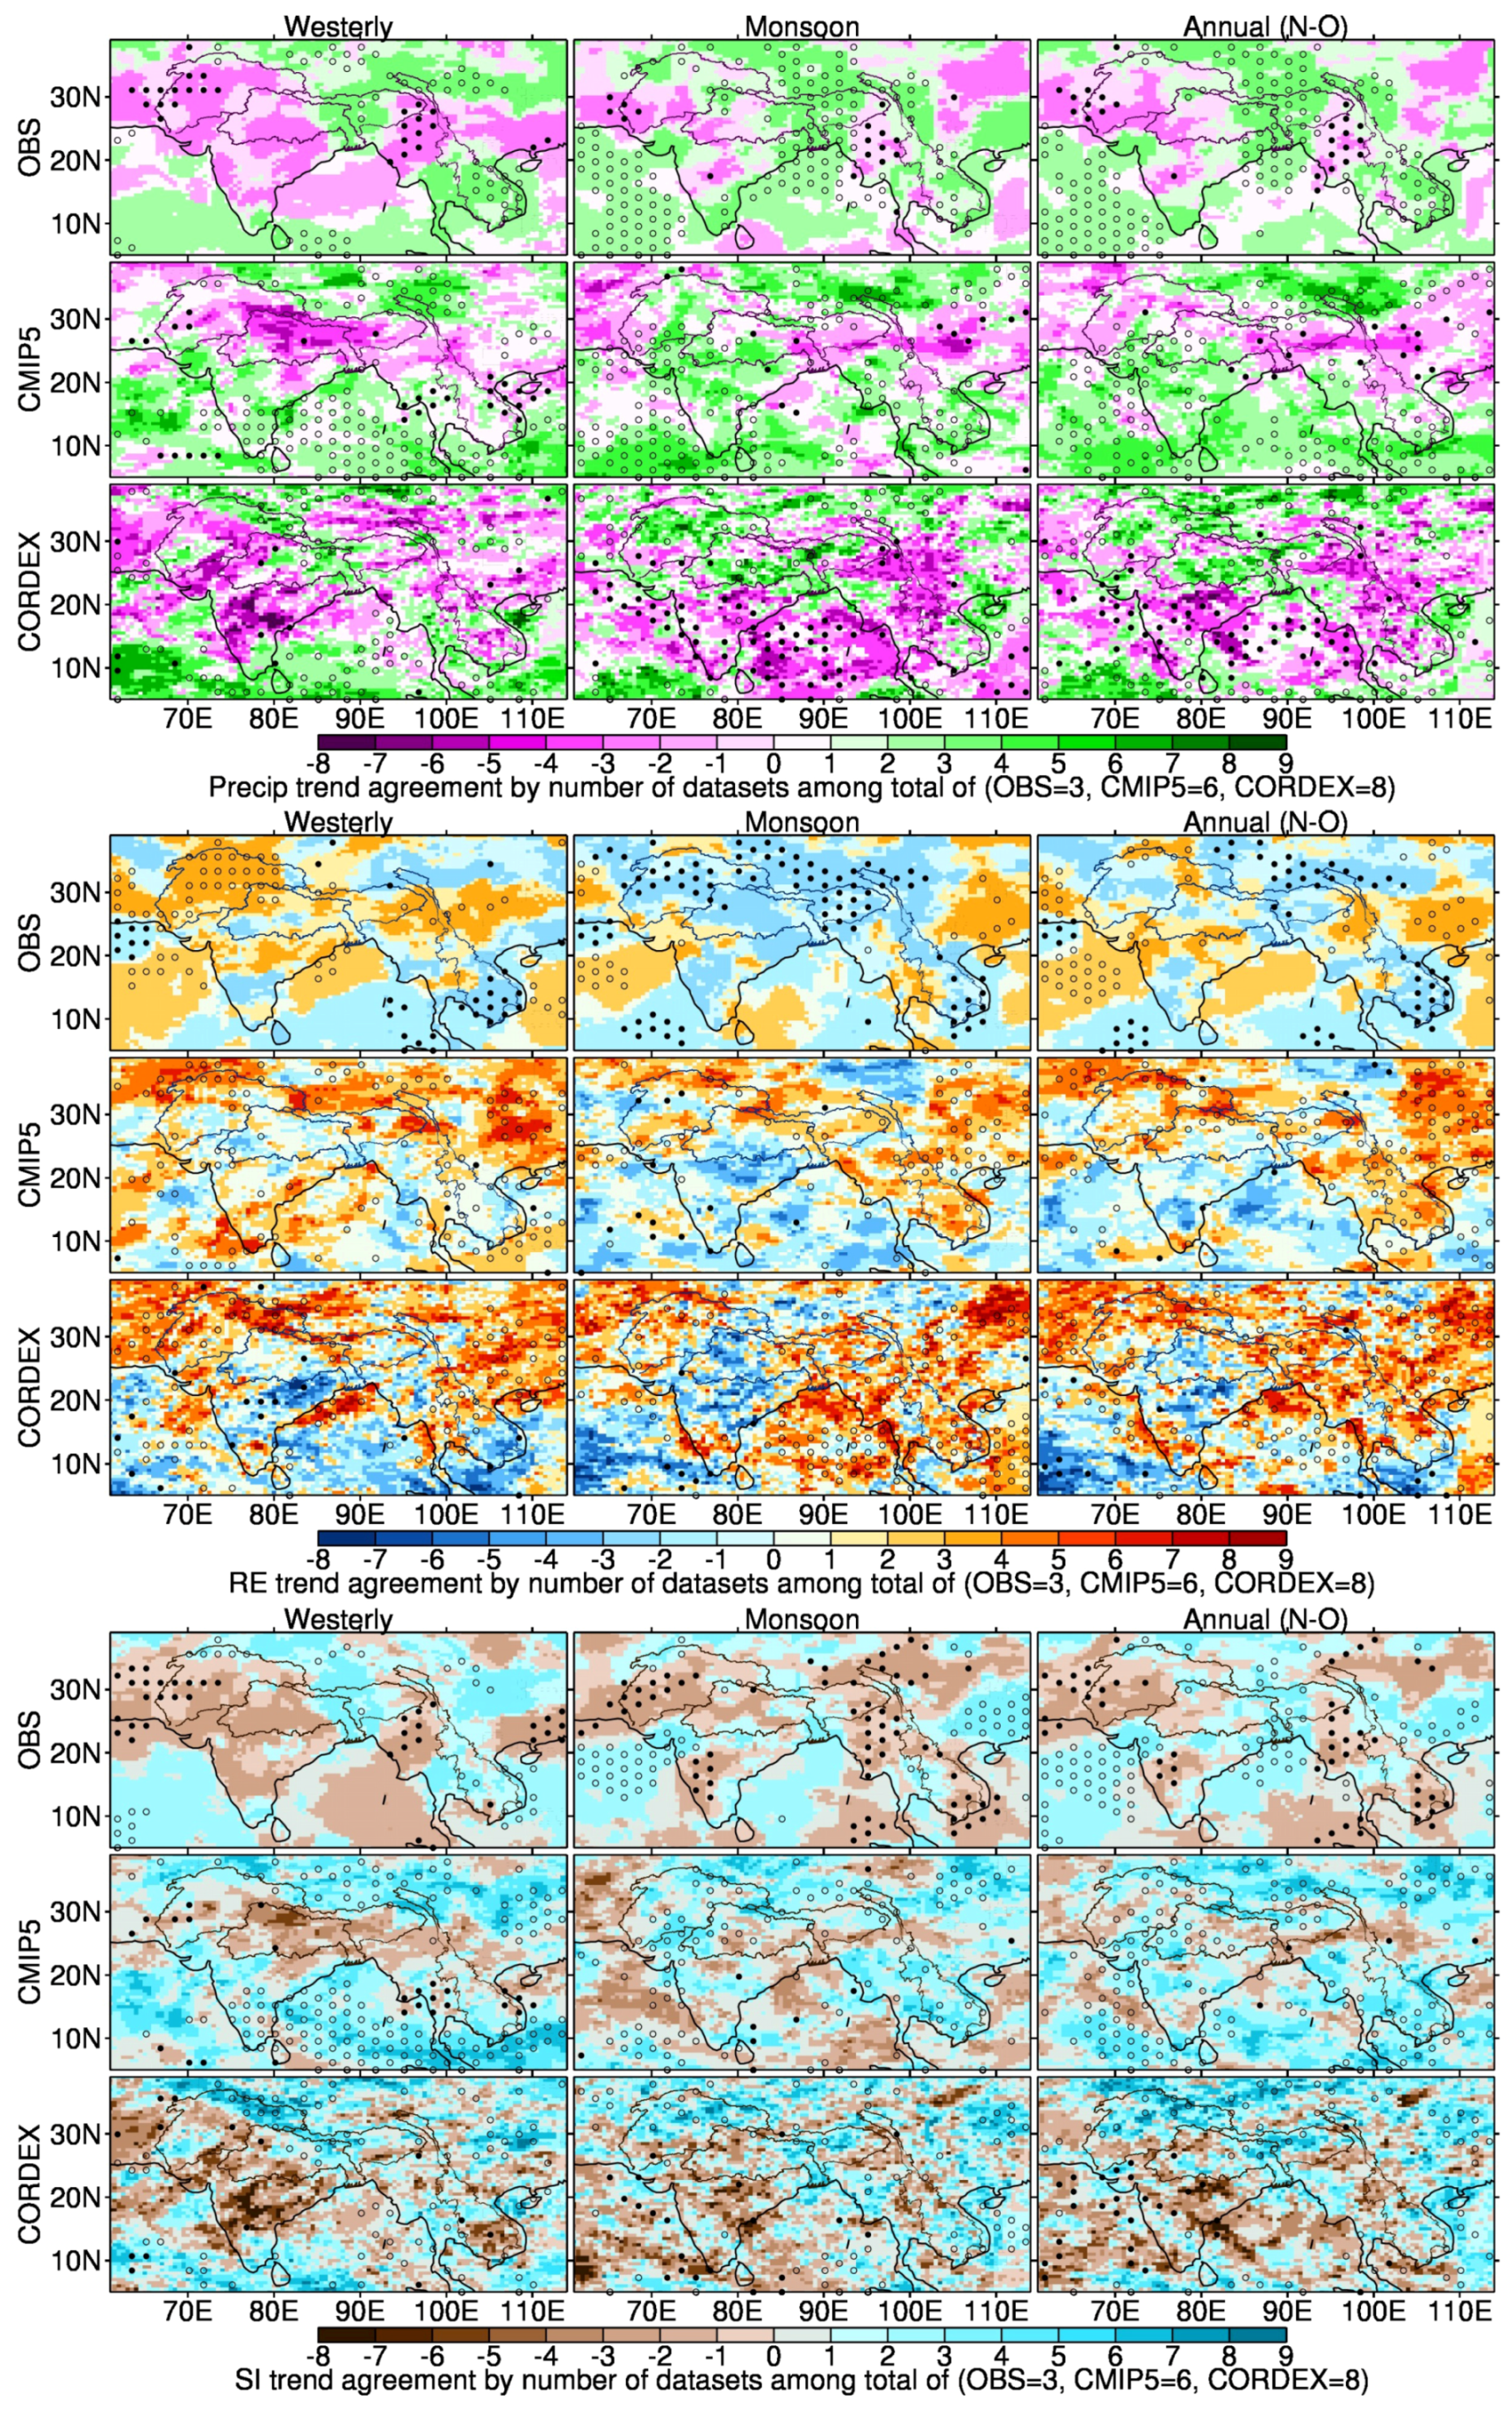
5.3. Trend Changes in the Seasonality Indices of Precipitation Regimes
5.3.1. Monsoonal Precipitation Regime
5.3.2. Westerly Precipitation Regime
5.3.3. Overall Precipitation Regime (Annual)
6. Summary and Conclusions
Acknowledgments
Conflicts of Interest
References
- IPCC. Climate Change 2007: The Physical Science Basis: Working Group I Contribution to the Fourth Assessment Report of The Intergovernmental Panel on Climate Change; Cambridge Universitiy Press: New York, NY, USA, 2007. [Google Scholar]
- IPCC. Climate Change 2013: The Physical Science Basis. Contribution of Working Group I to the Fifth Assessment Report of The Intergovernmental Panel on Climate Change; Cambridge Universitiy Press: New York, NY, USA, 2013. [Google Scholar]
- Mountain Research Initiative (MRI). Elevation-dependent warming in mountain regions of the world. Nat. Clim. Chang. 2015, 5, 424–430. [Google Scholar]
- Hasson, S.; Gerlitz, L.; Schickhoff, U.; Scholten, T.; Böhner, J. Recent climate change over High Asia. In Climate Change, Glacier Response, and Vegetation Dynamics in the Himalaya; Springer International Publishing: Basel, Switzerland, 2016; Volume 4, pp. 199–217. [Google Scholar]
- Hasson, S.; Lucarini, V.; Pascale, S. Hydrological cycle over South and Southeast Asian river basins as simulated by PCMDI/CMIP3 experiments. Earth Syst. Dyn. 2013, 4, 199–217. [Google Scholar] [CrossRef]
- Wake, C.P. Glaciochemical investigations as a tool for determining the spatial and seasonal variation of snow accumulation in the central Karakoram, northern Pakistan. Ann. Glaciol. 1989, 13, 279–284. [Google Scholar]
- Annamalai, H.; Hamilton, K.; Sperber, K.R. The South Asian summer monsoon and its relationship with ENSO in the IPCC AR4 simulations. J. Clim. 2007, 20, 1071–1092. [Google Scholar] [CrossRef]
- Clift, P.D.; Plumb, R.A. The Asian Monsoon: Causes, History and Effects; Cambridge University Press: Cambridge, UK, 2008; Volume 270. [Google Scholar]
- Bohner, J. General climatic controls and topoclimatic variations in Central and High Asia. BOREAS 2006, 35, 279–295. [Google Scholar] [CrossRef]
- Sperber, K.R.; Annamalai, H.; Kang, I.S.; Kitoh, A.; Moise, A.; Turner, A.; Wang, B.; Zhou, T. The Asian summer monsoon: An intercomparison of CMIP5 vs. CMIP3 simulations of the late 20th century. Clim. Dyn. 2013, 41, 2711–2744. [Google Scholar] [CrossRef]
- Wang, B.; Kang, I.S.; Lee, J.Y. Ensemble simulations of Asian-Australian monsoon variability by 11 AGCMs*. J. Clim. 2004, 17, 803–818. [Google Scholar] [CrossRef]
- Saha, A.; Ghosh, S.; Sahana, A.; Rao, E. Failure of CMIP5 climate models in simulating post-1950 decreasing trend of Indian monsoon. Geophys. Res. Lett. 2014, 41, 7323–7330. [Google Scholar] [CrossRef]
- Kang, I.S.; Jin, K.; Wang, B.; Lau, K.M.; Shukla, J.; Krishnamurthy, V.; Schubert, S.; Wailser, D.; Stern, W.; Kitoh, A.; et al. Intercomparison of the climatological variations of Asian summer monsoon precipitation simulated by 10 GCMs. Clim. Dyn. 2002, 19, 383–395. [Google Scholar]
- Lin, J.L.; Weickman, K.M.; Kiladis, G.N.; Mapes, B.E.; Schubert, S.D.; Suarez, M.J.; Bacmeister, J.T.; Lee, M.I. Subseasonal variability associated with Asian summer monsoon simulated by 14 IPCC AR4 coupled GCMs. J. Clim. 2008, 21, 4541–4567. [Google Scholar] [CrossRef]
- Feng, X.; Porporato, A.; Rodriguez-Iturbe, I. Changes in rainfall seasonality in the tropics. Nat. Clim. Chang. 2013, 3, 811–815. [Google Scholar] [CrossRef]
- Pascale, S.; Lucarini, V.; Feng, X.; Porporato, A.; Hasson, S. Analysis of rainfall seasonality from observations and climate models. Clim. Dyn. 2015, 44, 3281–3301. [Google Scholar] [CrossRef]
- Favre, A.; Philippon, N.; Pohl, B.; Kalognomou, E.A.; Lennard, C.; Hewitson, B.; Nikulin, G.; Dosio, A.; Panitz, H.J.; Cerezo-Mota, R. Spatial distribution of precipitation annual cycles over South Africa in 10 CORDEX regional climate model present-day simulations. Clim. Dyn. 2016, 46, 1799–1818. [Google Scholar] [CrossRef]
- Chou, C.; Chiang, J.C.; Lan, C.W.; Chung, C.H.; Liao, Y.C.; Lee, C.J. Increase in the range between wet and dry season precipitation. Nat. Geosci. 2013, 6, 263–267. [Google Scholar] [CrossRef]
- Wang, B.; Lin, H. Rainy season of the asian-pacific summer monsoon. J. Clim. 2002, 15, 386–398. [Google Scholar] [CrossRef]
- Hasson, S.; Pascale, S.; Lucarini, V.; Böhner, J. Seasonal cycle of precipitation over major river basins in South and Southeast Asia: A review of the CMIP5 climate models data for present climate and future climate projections. Atmos. Res. 2016, 180, 42–63. [Google Scholar] [CrossRef]
- Geil, K.L.; Serra, Y.L.; Zeng, X. Assessment of CMIP5 model simulations of the North American monsoon system. J. Clim. 2013, 26, 8787–8801. [Google Scholar] [CrossRef]
- Hasson, S.; Lucarini, V.; Pascale, S.; Böhner, J. Seasonality of the hydrological cycle in major South and Southeast Asian river basins as simulated by PCMDI/CMIP3 experiments. Earth Syst. Dyn. 2014, 5, 67–87. [Google Scholar] [CrossRef]
- Sperber, K.R.; Annamalai, H. The use of fractional accumulated precipitation for the evaluation of the annual cycle of monsoons. Clim. Dyn. 2014, 43, 3219–3244. [Google Scholar] [CrossRef]
- Giorgi, F.; Jones, C.; Asrar, G.R. Addressing climate information needs at the regional level: The CORDEX framework. World Meteorol. Org. (WMO) Bull. 2009, 58, 175–183. [Google Scholar]
- Jones, C.; Giorgi, F.; Asrar, G. The Coordinated Regional Downscaling Experiment: CORDEX, an international downscaling link to CMIP5. CLIVAR Exch. 2011, 56, 34–40. [Google Scholar]
- Hao, Z.; Singh, V.P. Integrating entropy and copula theories for hydrologic modeling and analysis. Entropy 2015, 17, 2253–2280. [Google Scholar] [CrossRef]
- Pascale, S.; Lucarini, V.; Feng, X.; Porporato, A.; Hasson, S. Projected changes of rainfall seasonality and dry spells in a high greenhouse gas emissions scenario. Clim. Dyn. 2015, 46, 1331–1350. [Google Scholar] [CrossRef]
- Turner, A.G.; Annamalai, H. Climate change and the South Asian summer monsoon. Nat. Clim. Chang. 2012, 2, 587–595. [Google Scholar] [CrossRef]
- Bengtsson, L.; Hodges, K.I.; Roeckner, E. Storm tracks and climate change. J. Clim. 2006, 19, 3518–3543. [Google Scholar] [CrossRef]
- Fasullo, J.; Webster, P. A hydrological definition of Indian monsoon onset and withdrawal. J. Clim. 2003, 16, 3200–3211. [Google Scholar] [CrossRef]
- Li, C.; Yanai, M. The onset and interannual variability of the Asian summer monsoon in relation to land-sea thermal contrast. J. Clim. 1996, 9, 358–375. [Google Scholar] [CrossRef]
- Janowiak, J.E.; Xie, P. A global-scale examination of monsoon-related precipitation. J. Clim. 2003, 16, 4121–4133. [Google Scholar] [CrossRef]
- Krishnamurti, T.; Simon, A.; Thomas, A.; Mishra, A.; Sikka, D.; Niyogi, D.; Chakraborty, A.; Li, L. Modeling of forecast sensitivity on the march of monsoon isochrones from Kerala to New Delhi: The first 25 days. J. Atmos. Sci. 2012, 69, 2465–2487. [Google Scholar] [CrossRef]
- Hasson, S.; Lucarini, V.; Khan, M.; Petitta, M.; Bolch, T.; Gioli, G. Early 21st century snow cover state over the western river basins of the Indus River system. Hydrol. Earth Syst. Sci. 2014, 18, 4077–4100. [Google Scholar] [CrossRef]
- Yatagai, A.; Kamiguchi, K.; Arakawa, O.; Hamada, A.; Yasutomi, N.; Kitoh, A. APHRODITE: Constructing a long-term daily gridded precipitation dataset for Asia based on a dense network of rain gauges. Bull. Am. Meteorol. Soc. 2012, 93, 1401–1415. [Google Scholar] [CrossRef]
- Xie, P.; Janowiak, J.E.; Arkin, P.A.; Adler, R.; Gruber, A.; Ferraro, R.; Huffman, G.J.; Curtis, S. GPCP pentad precipitation analyses: An experimental dataset based on gauge observations and satellite estimates. J. Clim. 2003, 16, 2197–2214. [Google Scholar] [CrossRef]
- Xie, P.; Arkin, P.A. Global precipitation: A 17-year monthly analysis based on gauge observations, satellite estimates, and numerical model outputs. Bull. Am. Meteorol. Soc. 1997, 78, 2539. [Google Scholar] [CrossRef]
- Adler, R.F.; Huffman, G.J.; Chang, A.; Ferraro, R.; Xie, P.P.; Janowiak, J.; Rudolf, B.; Schneider, U.; Curtis, S.; Bolvin, D.; et al. The version-2 global precipitation climatology project (GPCP) monthly precipitation analysis (1979-present). J. Hydrometeorol. 2003, 4, 1147–1167. [Google Scholar] [CrossRef]
- Huffman, G.J.; Adler, R.F.; Bolvin, D.T.; Gu, G. Improving the global precipitation record: GPCP version 2.1. Geophys. Res. Lett. 2009, 36. [Google Scholar] [CrossRef]
- Fekete, B.M.; Vörösmarty, C.J.; Roads, J.O.; Willmott, C.J. Uncertainties in precipitation and their impacts on runoff estimates. J. Clim. 2004, 17, 294–304. [Google Scholar] [CrossRef]
- Palazzi, E.; Hardenberg, J.; Provenzale, A. Precipitation in the Hindu-Kush Karakoram Himalaya: Observations and future scenarios. J. Geophys. Res. Atmos. 2013, 118, 85–100. [Google Scholar] [CrossRef]
- Prakash, S.; Mitra, A.K.; Momin, I.M.; Rajagopal, E.; Basu, S.; Collins, M.; Turner, A.G.; Achuta Rao, K.; Ashok, K. Seasonal intercomparison of observational rainfall datasets over India during the southwest monsoon season. Int. J. Climatol. 2015, 35, 2326–2338. [Google Scholar] [CrossRef]
- Taylor, K.E.; Stouffer, R.J.; Meehl, G.A. An overview of CMIP5 and the experiment design. Bull. Am. Meteorol. Soc. 2012, 93, 485–498. [Google Scholar] [CrossRef]
- McGregor, J.L.; Dix, M.R. An updated description of the conformal-cubic atmospheric model. In High Resolution Numerical Modelling of the Atmosphere and Ocean; Springer: New York, NY, USA, 2008; pp. 51–75. [Google Scholar]
- Dix, M.; Vohralik, P.; Bi, D.; Rashid, H.; Marsland, S.; O’Farrell, S.; Uotila, P.; Hirst, A.; Kowalczyk, E.; Sullivan, A.; et al. The ACCESS coupled model: Documentation of core CMIP5 simulations and initial results. Aust. Meteorol. Oceanogr. J. 2013, 63, 83–99. [Google Scholar]
- Gent, P.R.; Danabasoglu, G.; Donner, L.J.; Holland, M.M.; Hunke, E.C.; Jayne, S.R.; Lawrence, D.M.; Neale, R.B.; Rasch, P.J.; Vertenstein, M.; et al. The community climate system model version 4. J. Clim. 2011, 24, 4973–4991. [Google Scholar] [CrossRef]
- Voldoire, A.; Sanchez-Gomez, E.; y Mélia, D.S.; Decharme, B.; Cassou, C.; Sénési, S.; Valcke, S.; Beau, I.; Alias, A.; Chevallier, M.; et al. The CNRM-CM5. 1 global climate model: Description and basic evaluation. Clim. Dyn. 2013, 40, 2091–2121. [Google Scholar] [CrossRef]
- Samuelsson, P.; Jones, C.G.; Willén, U.; Ullerstig, A.; Gollvik, S.; Hansson, U.; Jansson, C.; Kjellström, E.; Nikulin, G.; Wyser, K. The Rossby Centre Regional Climate model RCA3: Model description and performance. Tellus A 2011, 63, 4–23. [Google Scholar] [CrossRef]
- Hazeleger, W.; Wang, X.; Severijns, C.; Ştefănescu, S.; Bintanja, R.; Sterl, A.; Wyser, K.; Semmler, T.; Yang, S.; Van den Hurk, B.; et al. EC-Earth V2. 2: Description and validation of a new seamless earth system prediction model. Clim. Dyn. 2012, 39, 2611–2629. [Google Scholar] [CrossRef]
- Griffies, S.M.; Winton, M.; Donner, L.J.; Horowitz, L.W.; Downes, S.M.; Farneti, R.; Gnanadesikan, A.; Hurlin, W.J.; Lee, H.C.; Liang, Z.; et al. The GFDL CM3 coupled climate model: Characteristics of the ocean and sea ice simulations. J. Clim. 2011, 24, 3520–3544. [Google Scholar] [CrossRef]
- Stevens, B.; Giorgetta, M.; Esch, M.; Mauritsen, T.; Crueger, T.; Rast, S.; Salzmann, M.; Schmidt, H.; Bader, J.; Block, K.; et al. Atmospheric component of the MPI-M Earth System Model: ECHAM6. J. Adv. Model. Earth Syst. 2013, 5, 146–172. [Google Scholar] [CrossRef]
- Sieck, K.; Raub, T.; Marien, L.; Buntemeyer, L.; Jacob, D. A new generation of the regional climate model REMO: REMO non-hydrostatic. In Proceedings of the EGU General Assembly Conference Abstracts, Vienna, Austria, 17–22 April 2016; Volume 18, p. 11945.
- Saeed, F.; Hagemann, S.; Jacob, D. Impact of irrigation on the South Asian summer monsoon. Geophys. Res. Lett. 2009, 36. [Google Scholar] [CrossRef]
- Thiessen, A.H. Precipitation averages for large areas. Mon. Weather Rev. 1911, 39, 1082–1089. [Google Scholar] [CrossRef]
- Mann, H.B. Nonparametric tests against trend. Econom. J. Econom. Soc. 1945, 13, 245–259. [Google Scholar] [CrossRef]
- Kendall, M. Rank Correlation Methods, 4th ed.; Charles Griffin: London, UK, 1975. [Google Scholar]
- Theil, H. A rank-invariant method of linear and polynomial regression analysis. In Collection of Henri Theil’s Contributions to Economics and Econometrics; Springer: Netherlands, 1992; pp. 345–381. [Google Scholar]
- Sen, P.K. Estimates of the regression coefficient based on Kendall’s tau. J. Am. Stat. Assoc. 1968, 63, 1379–1389. [Google Scholar] [CrossRef]
- Ghimire, S.; Choudhary, A.; Dimri, A. Assessment of the performance of CORDEX-South Asia experiments for monsoonal precipitation over the Himalayan region during present climate: Part I. Clim. Dyn. 2015, 1–24. [Google Scholar] [CrossRef]
- Syed, F.S.; Iqbal, W.; Syed, A.A.B.; Rasul, G. Uncertainties in the regional climate models simulations of South-Asian summer monsoon and climate change. Clim. Dyn. 2014, 42, 2079–2097. [Google Scholar] [CrossRef]
- Gao, X.; Shi, Y.; Zhang, D.; Wu, J.; Giorgi, F.; Ji, Z.; Wang, Y. Uncertainties in monsoon precipitation projections over China: Results from two high-resolution RCM simulations. Clim. Res. 2012, 52, 213–216. [Google Scholar] [CrossRef]
- Hasson, S.; Böhner, J.; Chishtie, F. Low Fidelity of Present-day Climate Modelling experiments and future climatic uncertainty over Himalayan watersheds of Indus basin. Clim. Dyn. 2016. under review. [Google Scholar]
- Mariotti, L.; Coppola, E.; Sylla, M.B.; Giorgi, F.; Piani, C. Regional climate model simulation of projected 21st century climate change over an all-Africa domain: Comparison analysis of nested and driving model results. J. Geophys. Res. Atmos. 2011, 116. [Google Scholar] [CrossRef]
- Johnson, S.J.; Levine, R.C.; Turner, A.G.; Martin, G.M.; Woolnough, S.J.; Schiemann, R.; Mizielinski, M.S.; Roberts, M.J.; Vidale, P.L.; Demory, M.E.; et al. The resolution sensitivity of the South Asian monsoon and Indo-Pacific in a global 0.35∘ AGCM. Clim. Dyn. 2016, 46, 807–831. [Google Scholar] [CrossRef]
- Wehner, M.F.; Reed, K.A.; Li, F.; Bacmeister, J.; Chen, C.T.; Paciorek, C.; Gleckler, P.J.; Sperber, K.R.; Collins, W.D.; Gettelman, A.; et al. The effect of horizontal resolution on simulation quality in the Community Atmospheric Model, CAM5. 1. J. Adv. Model. Earth Syst. 2014, 6, 980–997. [Google Scholar] [CrossRef]
- Boos, W.R.; Hurley, J.V. Thermodynamic bias in the multimodel mean boreal summer monsoon. J. Clim. 2013, 26, 2279–2287. [Google Scholar] [CrossRef]
- Chakraborty, A.; Nanjundiah, R.; Srinivasan, J. Role of Asian and African orography in Indian summer monsoon. Geophys. Res. Lett. 2002, 29, 50–51. [Google Scholar] [CrossRef]
- Chakraborty, A.; Nanjundiah, R.; Srinivasan, J. Theoretical aspects of the onset of Indian summer monsoon from perturbed orography simulations in a GCM. Ann. Geophys. 2006, 24, 2075–2089. [Google Scholar] [CrossRef]
- Saeed, F.; Hagemann, S.; Saeed, S.; Jacob, D. Influence of mid-latitude circulation on upper Indus basin precipitation: The explicit role of irrigation. Clim. Dyn. 2013, 40, 21–38. [Google Scholar] [CrossRef]
- Levine, R.C.; Turner, A.G. Dependence of Indian monsoon rainfall on moisture fluxes across the Arabian Sea and the impact of coupled model sea surface temperature biases. Clim. Dyn. 2012, 38, 2167–2190. [Google Scholar] [CrossRef]
- Levine, R.C.; Turner, A.G.; Marathayil, D.; Martin, G.M. The role of northern Arabian Sea surface temperature biases in CMIP5 model simulations and future projections of Indian summer monsoon rainfall. Clim. Dyn. 2013, 41, 155–172. [Google Scholar] [CrossRef]
- Sandeep, S.; Ajayamohan, R. Poleward shift in Indian summer monsoon low level jetstream under global warming. Clim. Dyn. 2015, 45, 337–351. [Google Scholar] [CrossRef]
- Sandeep, S.; Ajayamohan, R. Origin of cold bias over the Arabian Sea in climate models. Sci. Rep. 2014, 4. [Google Scholar] [CrossRef] [PubMed]
- Laprise, R.; Hernández-Díaz, L.; Tete, K.; Sushama, L.; Šeparović, L.; Martynov, A.; Winger, K.; Valin, M. Climate projections over CORDEX Africa domain using the fifth-generation Canadian Regional Climate Model (CRCM5). Clim. Dyn. 2013, 41, 3219–3246. [Google Scholar] [CrossRef]
- Dosio, A.; Panitz, H.J.; Schubert-Frisius, M.; Lüthi, D. Dynamical downscaling of CMIP5 global circulation models over CORDEX-Africa with COSMO-CLM: Evaluation over the present climate and analysis of the added value. Clim. Dyn. 2015, 44, 2637–2661. [Google Scholar] [CrossRef]
- Islam, S.; Rehman, N.; Sheikh, M.; Khan, A. Climate Change Projections for Pakistan, Nepal and Bangladesh for SRES A2 and A1B Scenarios Using Outputs of 17 GCMs Used in IPCC-AR4; Technical Report, GCISC-RR-03; Global Change Impact Studies Centre (GCISC): Islamabad, Pakistan, 2009. [Google Scholar]
- Syed, F.S.; Islam, S.; Rehman, N.; Sheikh, M.M.; Khan, A.M. Climate Change Scenarios for Pakistan and Some South Asian Countries for SRES A2 and B2 Scenarios Based on Six Different GCMs Used in IPCC-TAR; Technical Report GCISC-RR-02; Global Change Impact Studies Centre (GCISC): Islamabad, Pakistan, 2009. [Google Scholar]
- Islam, S.; Rehman, N.; Sheikh, M.M.; Khan, A.M. High Resolution Climate Change Scenarios Over South Asia Region Donscaled by Regional Climate Model PRECIS for IPCC SRES A2 Scneario; Technical Report GCISC-RR-06; Global Change Impact Studies Centre (GCISC): Islamabad, Pakistan, 2009. [Google Scholar]
- Kulkarni, A.; Patwardhan, S.; Kumar, K.K.; Ashok, K.; Krishnan, R. Projected climate change in the Hindu Kush-Himalayan region by using the high-resolution regional climate model PRECIS. Mt. Res. Dev. 2013, 33, 142–151. [Google Scholar] [CrossRef]
- Rajbhandari, R.; Shrestha, A.; Kulkarni, A.; Patwardhan, S.; Bajracharya, S. Projected changes in climate over the Indus river basin using a high resolution regional climate model (PRECIS). Clim. Dyn. 2015, 44, 339–357. [Google Scholar] [CrossRef]
- Iqbal, W.; Syed, F.; Sajjad, H.; Nikulin, G.; Kjellström, E.; Hannachi, A. Mean climate and representation of jet streams in the CORDEX South Asia simulations by the regional climate model RCA4. Theor. Appl. Climatol. 2016, 1–19. [Google Scholar] [CrossRef]
- Dimri, A.P. Wintertime land surface characteristics in climatic simulations over the western Himalayas. J. Earth Syst. Sci. 2012, 121, 329–344. [Google Scholar] [CrossRef]
- Sabeerali, C.; Rao, S.A.; Dhakate, A.; Salunke, K.; Goswami, B. Why ensemble mean projection of south Asian monsoon rainfall by CMIP5 models is not reliable? Clim. Dyn. 2015, 45, 161–174. [Google Scholar] [CrossRef]
- Mishra, V. Climatic uncertainty in Himalayan water towers. J. Geophys. Res. Atmos. 2015, 120, 2689–2705. [Google Scholar] [CrossRef]
- Ramanathan, V.; Chung, C.; Kim, D.; Bettge, T.; Buja, L.; Kiehl, J.; Washington, W.; Fu, Q.; Sikka, D.; Wild, M. Atmospheric brown clouds: Impacts on South Asian climate and hydrological cycle. Proc. Natl. Acad. Sci. USA 2005, 102, 5326–5333. [Google Scholar] [CrossRef] [PubMed]
- Ramesh, K.; Goswami, P. Assessing reliability of regional climate projections: The case of Indian monsoon. Sci. Rep. 2014, 4, 4071. [Google Scholar] [CrossRef] [PubMed]
- Hasson, S.; Böhner, J.; Lucarini, V. Prevailing climatic trends and runoff response from Hindukush–Karakoram–Himalaya, upper Indus basin. Earth Syst. Dyn. Discus. 2015, 6, 579–653. [Google Scholar] [CrossRef]


| S No | Experiment Name | RCM Employed/Experiment Contributing Institute | Driving GCM | GCM Resolution ( × ) |
|---|---|---|---|---|
| 1 | ACCESS1-0_CCAM | CCAM [44]—Conformal-Cubic Atmospheric Model/ Commonwealth Scientific and Industrial Research Organization (CSIRO), Marine and Atmospheric Research, Australia | ACCESS1-0 [45] | ∼ × |
| 2 | CCSM4_CCAM | CCAM / CSIRO | CCSM4 [46] | ∼ × |
| 3 | CNRM-CM5_CCAM | CCAM/CSIRO | CNRM-CM5 [47] | ∼ × |
| 4 | EC-EARTH_RCA4 | RCA4 [48]—Rossby Centre regional atmospheric model version 4-2/Swedish Meteorological and Hydrological Institute, Sweden | EC-EARTH [49] | ∼ × |
| 5 | GFDL-CM3_CCAM | CCAM/CSIRO | GFDL-CM3 [50] | ∼ × |
| 6 | MPI-ESM-LR_CCAM | CCAM/CSIRO | MPI-ESM-LR [51] | ∼ × |
| 7 | MPI-ESM-LR_REMOi | REMO [52,53]—Regional Model for climate simulations/Helmholtz-Zentrum Geesthacht, Climate Service Center and Max Plank Institute for Meteorology, Germany | ||
| 8 | MPI-ESM-LR_REMO |
| CORDEX Models | Indus Onset | Indus Slope | Ganges Onset | Ganges Slope | Brahm Onset | Brahm Slope | Mekong Onset | Mekong Slope |
|---|---|---|---|---|---|---|---|---|
| GPCP | 37 | 0.046 | 32 | 0.037 | 29 | 0.030 | 26 | 0.025 |
| APHRO | 3 | 2 | 2 | 2 | 5 | |||
| CMAP | 1 | 4 | 4 | 2 | 1 | |||
| ACCESS1-0 | 18 | 18 | ||||||
| ACCESS1-0_CCAM | −46 | |||||||
| CCSM4 | 9 | 3 | ||||||
| CCSM4_CCAM | −37 | −30 | −21 | |||||
| CNRM-CM5 | 6 | −40 | −10 | −17 | −18 | −18 | −12 | −8 |
| CNRM-CM5_CCAM | −40 | −19 | −35 | −33 | −37 | −31 | −22 | |
| EC-EARTH | −9 | −14 | −7 | −15 | −12 | −18 | −17 | −14 |
| EC-EARTH_RCA4 | −27 | −10 | 0 | −14 | −15 | −12 | ||
| GFDL-CM3 | 15 | −30 | 13 | −22 | −7 | −24 | 9 | 7 |
| GFDL-CM3_CCAM | −45 | −27 | −37 | −38 | −37 | −34 | −22 | |
| MPI-ESM-LR | 7 | -45 | −14 | 2 | −7 | 5 | ||
| MPI-ESM-LR_CCAM | −45 | −24 | −37 | −33 | −33 | −35 | −22 | |
| MPI-ESM-LR_REMO | 8 | −35 | −16 | −32 | −23 | −27 | −7 | |
| MPI-ESM-LR_REMOi | 8 | −35 | −16 | −32 | −22 | −27 | −7 | −5 |
| CORDEX Models | Indus Onset | Indus Slope | Ganges Onset | Ganges Slope | Brahm Onset | Brahm Slope | Mekong Onset | Mekong Slope |
|---|---|---|---|---|---|---|---|---|
| ACCESS1-0_CCAM | −5 | 3 | −21 | 1 | −18 | −48 | −34 | |
| CCSM4_CCAM | −14 | −26 | −36 | −12 | −29 | −17 | −24 | −18 |
| CNRM-CM5_CCAM | −9 | −9 | −21 | −15 | −22 | −19 | −15 | |
| EC-EARTH_RCA4 | 7 | −15 | 6 | 6 | 11 | 5 | 2 | 2 |
| GFDL-CM3_CCAM | −18 | −21 | −41 | −20 | −30 | −17 | −43 | −27 |
| MPI-ESM-LR_CCAM | −10 | 0 | −22 | −27 | −35 | −28 | −34 | −26 |
| MPI-ESM-LR_REMO | 1 | 18 | −22 | −25 | −22 | −9 | ||
| MPI-ESM-LR_REMOi | 1 | 18 | −22 | −24 | −22 | −10 |
© 2016 by the author; licensee MDPI, Basel, Switzerland. This article is an open access article distributed under the terms and conditions of the Creative Commons Attribution (CC-BY) license (http://creativecommons.org/licenses/by/4.0/).
Share and Cite
Hasson, S. Seasonality of Precipitation over Himalayan Watersheds in CORDEX South Asia and their Driving CMIP5 Experiments. Atmosphere 2016, 7, 123. https://doi.org/10.3390/atmos7100123
Hasson S. Seasonality of Precipitation over Himalayan Watersheds in CORDEX South Asia and their Driving CMIP5 Experiments. Atmosphere. 2016; 7(10):123. https://doi.org/10.3390/atmos7100123
Chicago/Turabian StyleHasson, Shabeh. 2016. "Seasonality of Precipitation over Himalayan Watersheds in CORDEX South Asia and their Driving CMIP5 Experiments" Atmosphere 7, no. 10: 123. https://doi.org/10.3390/atmos7100123
APA StyleHasson, S. (2016). Seasonality of Precipitation over Himalayan Watersheds in CORDEX South Asia and their Driving CMIP5 Experiments. Atmosphere, 7(10), 123. https://doi.org/10.3390/atmos7100123