Article

Winter Dew Harvest in Mexico City

by
Arias-Torres Jorge Ernesto
1 and
Flores-Prieto Jose Jasson
2,*
1
Departamento de Ingeniería de Procesos e Hidráulica, Universidad Autónoma Metropolitana-Iztapalapa, Av. San Rafael Atlixco 186, col., Vicentina, Cd. de México DF 11000, Mexico
2
Department of Mechanical Engineering, Centro Nacional de Investigación y Desarrollo Tecnológico, CENIDET-DGEST-SEP, Int. Internado Palmira S/N, Col. Palmira, Cuernavaca, Morelos CP 62490, Mexico
*
Author to whom correspondence should be addressed.
Atmosphere 2016, 7(1), 2; https://doi.org/10.3390/atmos7010002
Submission received: 6 October 2015 / Revised: 8 December 2015 / Accepted: 9 December 2015 / Published: 23 December 2015

Abstract

:
This study presents experimental and theoretical results of winter dew harvest in México City in terms of condensation rate. A simplified theoretical model based on a steady-state energy balance on a radiator-condenser was fitted, as a function of the ambient temperature, the relative humidity and the wind velocity. A glass sheet and aluminum sheet white-painted were used as samples over the outdoor experiments. A good correlation was obtained between the theoretical and experimental data. The experimental results show that there was condensation in 68% of the winter nights on both condensers. The total winter condensed mass was 2977 g/m2 and 2888 g/m2 on the glass sheet and aluminum sheet white-painted, respectively. Thus, the condensed mass on the glass was only 3% higher than that on the painted surface. The maximum nightly dew harvests occurred during December, which linearly reduced from 50 g/m2 night to 22 g/m2 night as the winter months went by. The condensation occurred from 1:00 a.m. to 9:00 a.m., with maximum condensation rates between 6:00 a.m. and 7:00 a.m. The dew harvest can provide a partial alternative to the winter water shortage in certain locations with similar climates to the winter in Mexico City, as long as pollution is not significant.

1. Introduction

People around the world have taken advantage of the abundant atmospheric water vapor, especially when the population is increasing, and the water shortage is growing globally, or when there are isolated communities, or communities that lack basic services. The latter has promoted the design and use of different types of Atmospheric Dew Collectors (ADC) and more research in non-conventional sources of water, representing more efficient water management in many parts of the world [1]. The fresh water shortage has several solutions for each type of use, as in the cases of agriculture, industry, and municipal and domestic services. Rainwater collection, fog water collection and dew collection, also called dew harvest, are three of the main non-conventional solutions for use as alternative or supplemental sources of water [2]. Generally, these solutions share the advantages of simplicity of implementation and an energy-free operation. However, at the same time, there are also disadvantages in terms of the seasonality, geographical location and unfavorable climates. Regarding dew water collection, several studies have been done for different climates, heights above sea level, and configurations and materials for dewcollectors. Nevertheless, the dew harvest still requires a wider knowledge about its performance linked to ambient and geographical parameters for use as alternative or supplemental sources of water.
While reviewing the literature, we found that people have been constructing different types of dew collectors with a variety of materials and configurations, estimating their performance according to the weather conditions and the geographical coordinates. It is believed that the ancient Greeks recovered atmospheric water vapor to supply water to the city of Theodosia [3]. In the last 20 years, some of the dew harvest studies looked for places and seasons of higher production. Nilsson et al. [4] reported experiments in Dodoma, Tanzania and in Sweden [5]. Alnaser and Barakat [6] collected in Bahrain the maximum quantity of dew in January and the least amount in August. Beysens et al. [7] experimented with a low-cost radiative condenser in Grenoble, France. Berkowicz et al. [8] carried out dew harvest on a roof under semi-arid conditions, during an annual period, in Jerusalem. These authors found that the maximum monthly dew harvest was during the hot summer months, at rainless times. Gandhidasan and Abulhamayel [9] reported that in Dhahran, Saudi Arabia, the maximum dew harvest requires a clear sky and high atmospheric humidity. Muselli et al. [10] and Beysens et al. [11] found that dew is a notable source of water on the Adriatic coast, Zadar, and the islands Vis and Biševo, Croatia, especially during the dry summer. Sharan et al. [12] experimented in Sayara, an arid coastal region of north-west India, with a special condensing foil on the roof of a school. Jacobs et al. [13] performed dew harvest experiments within a grassland area in the center of the Netherlands. As indicated above, a wide range of climates for dew harvest has been studied: arid, semi-arid, subtropical desert, Mediterranean and temperate, except for dry winter climates, such as that in México City. The places of the aforementioned studies are situated, from 6°S to 57°N latitude, from 0°E to 73°E longitude, and from 7 m a.s.l. to 1120 m a.s.l. All of them agree that the maximum dew collection requires a clear sky and high atmospheric humidity.
At the same time, the studies of the dew harvest focused on finding efficient materials and configurations that are suitable for the Radiator-Condensers (RCs). The study of Nilsson et al. [4] and Nilsson [5] shows that one of the main parameters of the RC is the optical properties. They used pigments with TiO2, BaSO4, or SiO2/TiO2 on polymer foils. Beysens et al. [7] tested a condenser surface with embedded microspheres of TiO2 and BaSO4 in polyethylene; they compared its yield with Polymethylmethacrylate (Plexiglas) as a reference. In addition, Berkowicz et al. [8] used a thin foil of polyethylene with TiO2/BaSO4 embedded microspheres. Gandhidasan and Abualhamayel [9] used pigmented polyethylene foils as RCs. Jacobs et al. [13] tested a dew collector using polyethylene foil that was 0.39 mm thick and polyvinyl chloride 4 mm thick. Alnaser and Barakat [6] tested, in the laboratory, aluminum, glass, and polyethylene foils as condensation surfaces, in order to know which of these collects the largest amount of dew. They controlled the temperatures and relative humidity, and found that the aluminum collected 1.3 L/(m2·h), the glass, 0.8 L/(m2·h), and the polyethylene collected 0.3 L/(m2·h). Mileta et al. [14] used a special configuration of a house roof to achieve a better rate of dew harvest in the Biševo Island. Sharan et al. [15] used 360 m2 of condensing foil on a school roof, where the foil was the same as that used by Nilsson [5]. Maestre-Valero et al. [16] tested two polyethylene foils: a white hydrophilic foil recommended by the International Organization for Dew Utilization (OPUR) as a standard for dew collection comparisons, and a low-cost black foil, which is widely used for mulching in horticulture. They showed that for large-scale dew harvesting, the black foil is suitable due to its dew collection performance, longer lifespan and much lower cost. However, they found that the higher number of dewy events with low yield (less than 0.05 mm) for white hydrophilic foil was due to its hydrophilic surface properties. This characteristic allowed this film to recover water from small events of dew (less than 0.10 mm) whereas the black foil was less effective in this aspect. The pigmented polymer foils are widely used and tested [17], in addition to coating materials that are commonly used in building construction, such as glass, aluminum sheets, or white paint, among others. As observed, this outlook shows that there is a lack of studies about RCs that are made with ordinary and low-cost materials and coatings, which is in agreement with Maestre-Valero et al. [16] and Beysens et al. [7].
Among the reported mathematical models for the prediction of dew harvest, some are mainly based on steady state energy balances on the radiator-condenser. Nilsson [5] validated their model by collecting 0.145 mm/night in the summer and 0.28 mm/night in autumn in Sweden, and 0.3 mm/night from June to November in Tanzania. However, their theory and experimental results do not match completely. Gandhidasan and Abualhamayel [9] report a dew harvest rate of 0.22 mm/night from January to February in Dhahran, Saudi Arabia, with an agreement of 14.3% between the theoretical and experimental results. On the other hand, Maestre-Valero et al. [18] report 17.4 mm/night and 20.8 mm/night of dew harvest for one year, using white standard foil and black foil, with a Root Mean Square Error (RMSE), of 0.051 mm, and 0.053 mm, respectively. The RMSE represents the sample standard deviation of the differences between predicted values and observed values. The Squared R (R2) were 0.66 and 0.71, respectively, which indicates how well the data fits a model. Vuollekoski et al. [17] reports a theoretical study of potential dew around the world. Because of the general need to determine dew yield in any place of the world, Beysens [19] elaborated a simple analytical formula valid for plane dew collectors. Therefore, most of the validated models report the dew harvest over nocturnal, monthly, or yearly periods, without a better time-step resolution.
México City, Cuzco (Peru), Addis Abeba (Ethiopia), Bogota (Colombia), Campos do Jordao (Brazil), La Paz (Bolivia), Johannesburg (South Africa), Gangtok (India), and many rural places all share similar climate conditions. Mexico has other rural regions around the country with this kind of climate [20]). It is noteworthy that in these places, the dry, cold period is one of the seasons when water scarcity increases. However, there is a lack of studies on dew collection in a temperate climate with dry winters. The goal of this paper is the measurement of dew harvest in a temperate climate with dry winters, as that in Mexico City, which can represent the dew harvest in other places with similar climate. In addition, a simplified model for the dew condensation rate was validated with hourly time-steps.

2. Materials and Methods

2.1. Materials and Climate

The atmospheric dew collector ADC consists of a Radiator-Condenser (RC), an aluminum gutter, and a glass container. A pair of semi-hydrophilic RCs, 1.0 m2 area, insulated on its back with 2.54 cm thick polystyrene foam (0.24 W/m·K), were tested. One RC was a flat glass sheet (gRC), 4.0 mm thick, and the other was an aluminum sheet coated with water based white paint (wpRC), with an emissivity of 0.84 and 0.90, respectively. Painting Berel brand contains titanium dioxide, 26% in weight [21]. The RC view factor was 0.7 according to Equation (3).
Mexico City is in an upland region whose climate is temperate with dry winters, according to the Köppen climate classification (Cwb). The rainy season runs from June to October, with tropical moist winds from the sea, while the dry season runs from November to May, with relatively dry winds. México City’s dry season subdivides into a cold period and a warm period. During the cold period (November–February), polar air masses are pushed down from the north, keeping the air quite dry, while in the warm period (March–May) the tropical winds dominate but do not have enough moisture for rain. The experimental campaign was conducted during the 2011–2012 winter at 19°25′N latitude, 99°13′W longitude, 2360 m a.s.l., in an open rooftop of 7 m high, located to the west of México City Downtown. The average wind velocity during the winter of 2011–2012 was 0.33 m/s, similar to that of previous years [22].

2.2. Modeling

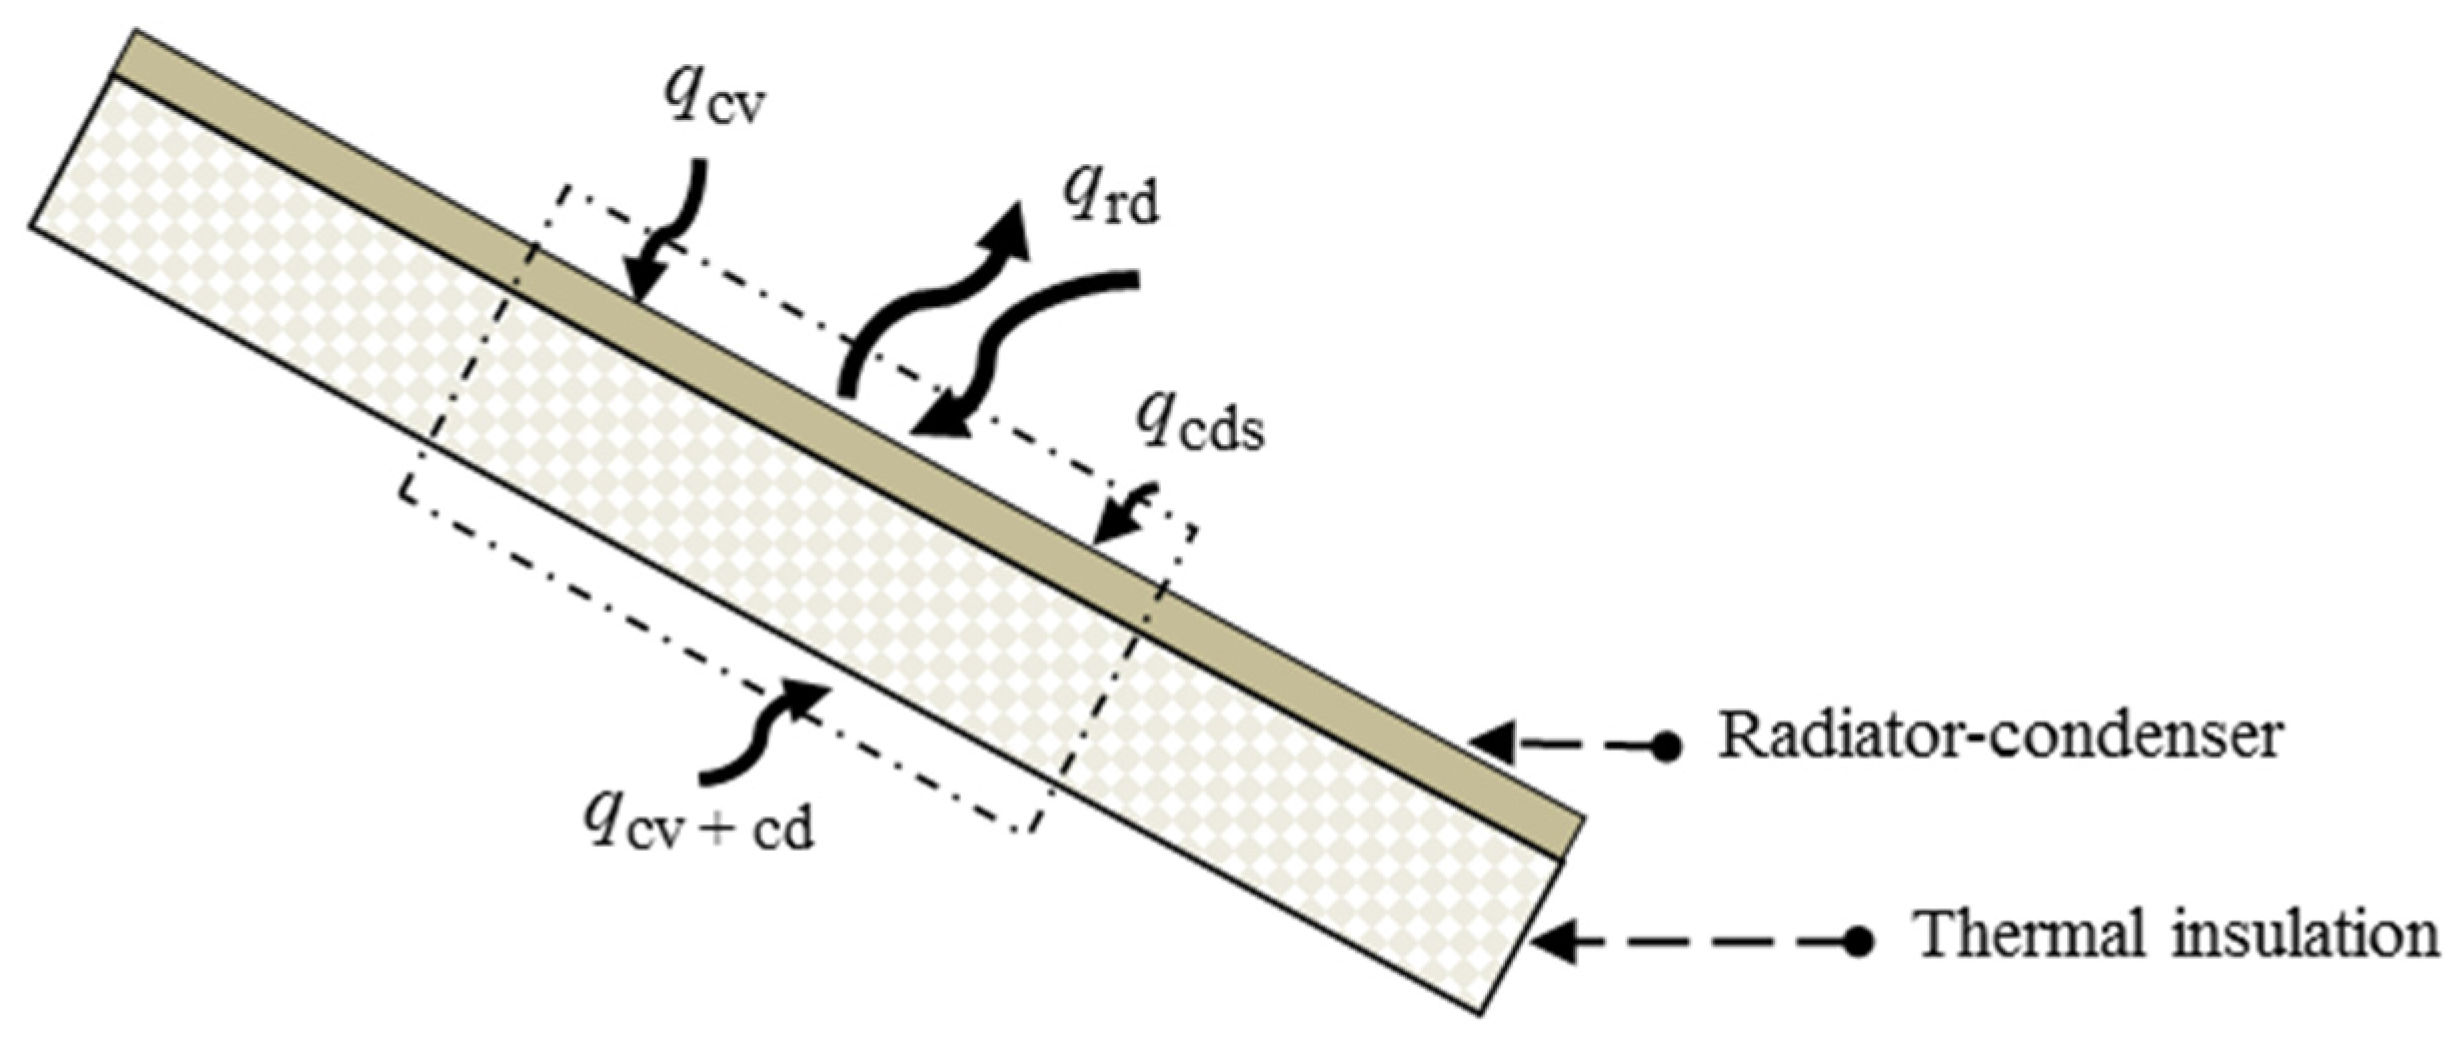
2.2.1. Theoretical Modeling

The theoretical model predicts the dew condensation as a function of the ambient temperature, relative humidity, wind velocity, and characteristic properties of the dew collector. The model considers the radiative heat exchange rate qrd, which occurs between the RC, at temperature TRC, and the sky, at temperature Tsk. If the TRC drops below the dew point temperature Tdp, then the flow of heat due to condensation occurs at the rate of qcds. Simultaneously, the ambient air, at Ta, transfers heat by convection to the dew collector at the rate qcv and by conduction at the rate qcd, reducing the potential for condensation.
The outgoing heat flux is due to the net radiative heat exchange qrd, between the sky and the RC. The incoming heat fluxes are due to the convective heat exchange qcv between the ambient air and the RC, the convective-conductive qcv+cv heat exchange between the ambient air and the RC thermal insulation, and the latent heat of condensation qcds on the RC (Figure 1). Equation (1) is the steady state energy balance on the RC [3,4,23] and it gives the rate of dew condensation .
qrd = qcv + (qcv+cd) + qcds
Figure 1. Steady state energy balance on the dew collector.
Atmosphere 07 00002 g001
The model considers the following assumptions: steady state, RC constant emissivity, low wind velocity, uniform temperature of the RC and clear sky conditions (non-cloudiness). Therefore, Equation (1) becomes Equation (2):
ε R C F σ ( T R C 4 T s k 4 ) = h ( T a T RC ) + h k i k i + h δ ( T a T RC ) + h ξ ( 6.108 H R   e 17.27   T a T a + 237.3 610.8   e 17.27   T RC T RC + 237.3 )
where εRC is the RC emissivity, F the view factor from the radiator toward the sky, σ the Stefan-Boltzmann constant, h the convective heat transfer coefficient, ki the conductive heat transfer coefficient, δ the insulation plate thickness, hm the water vapor transfer coefficient from the air toward the RC, and ξ the psychrometric constant. We used T s k = 0.0552   T a 1.5 [24] and h = 2.8 + 3ʋ [4], where ʋ represents the wind velocity. The dew point was calculated in terms of ambient temperature and relative humidity according to Lawrence [25]. The view factor is calculated using Equation (3), and corrected due to a small wall around the flat roof, of 0.8 m high, where the experiments were carried out.
F = (π − β)/π
where β is the collector tilt angle [26]. The TRC is calculated from Equation (2) by an iterative method, and then the condensation rate can be calculated with Equation (4):
qcds = L·
where L is the latent heat of condensation of water vapor, and is the rate of dew condensation. The aforementioned method was codified in FORTRAN to achieve the condensation rate. The model performance was evaluated in terms of the RMSE and R2.

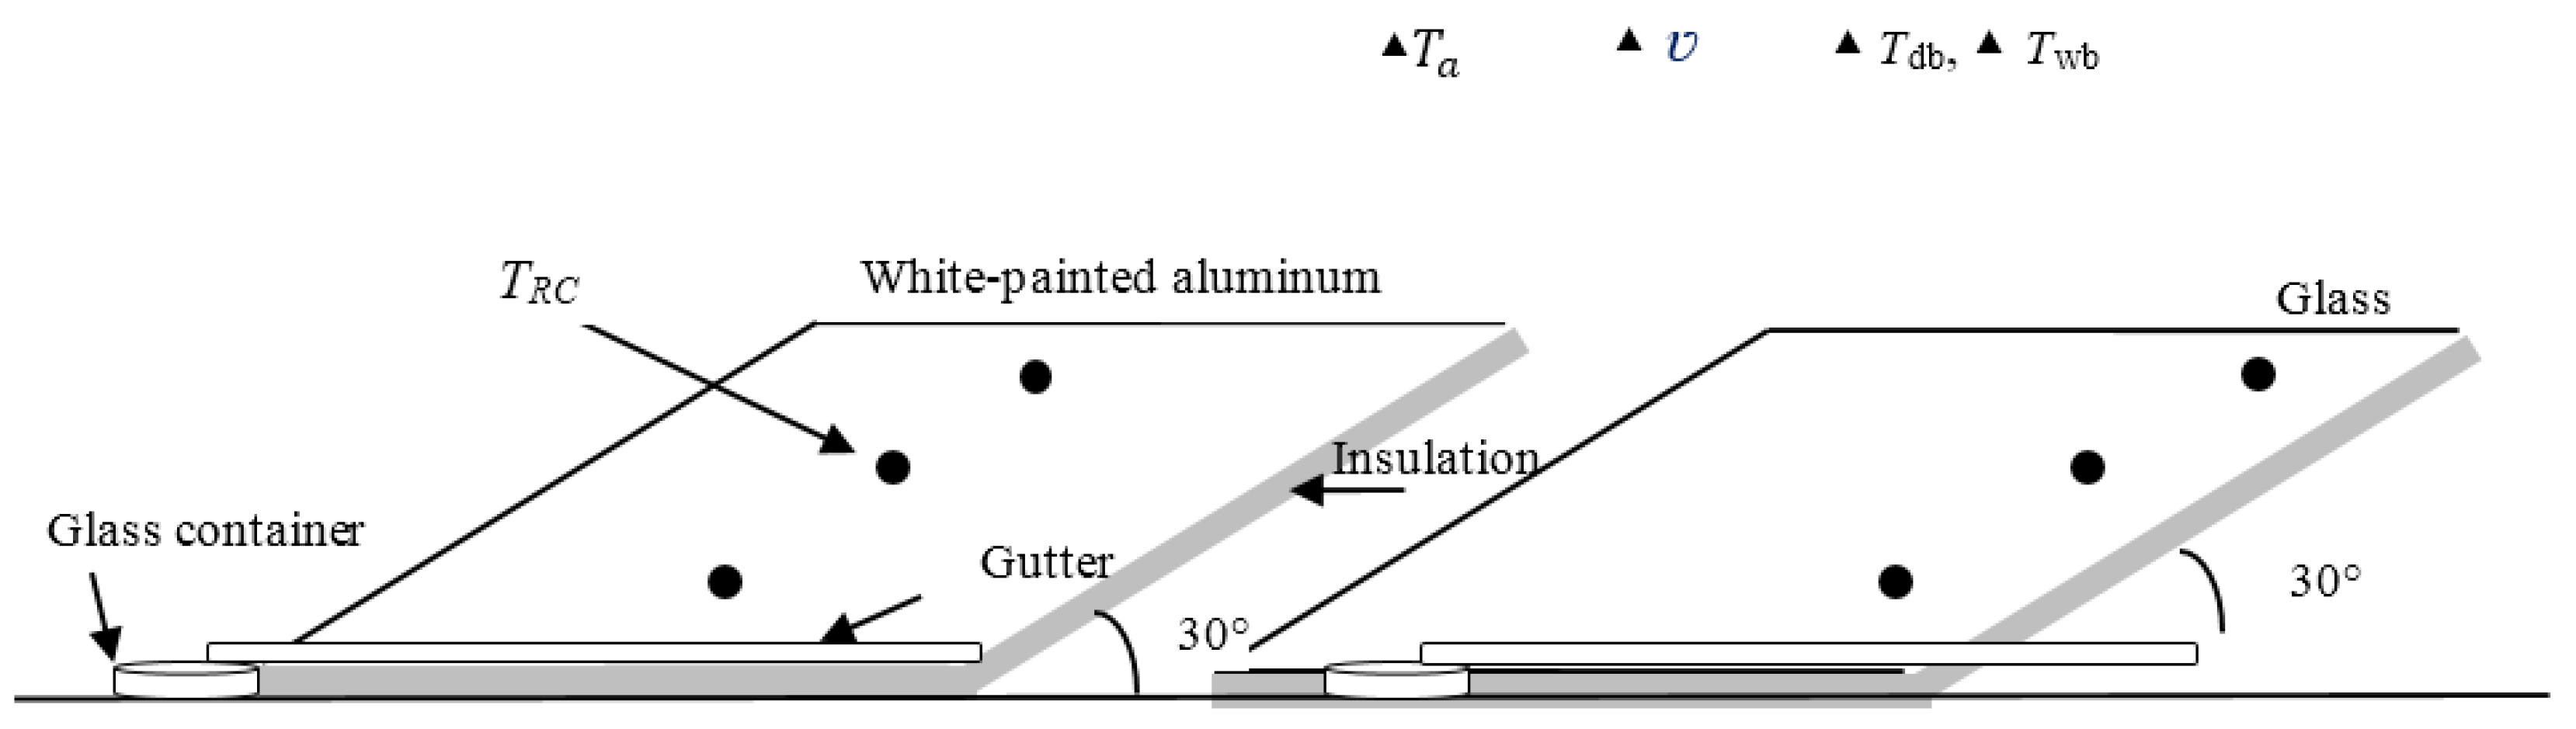
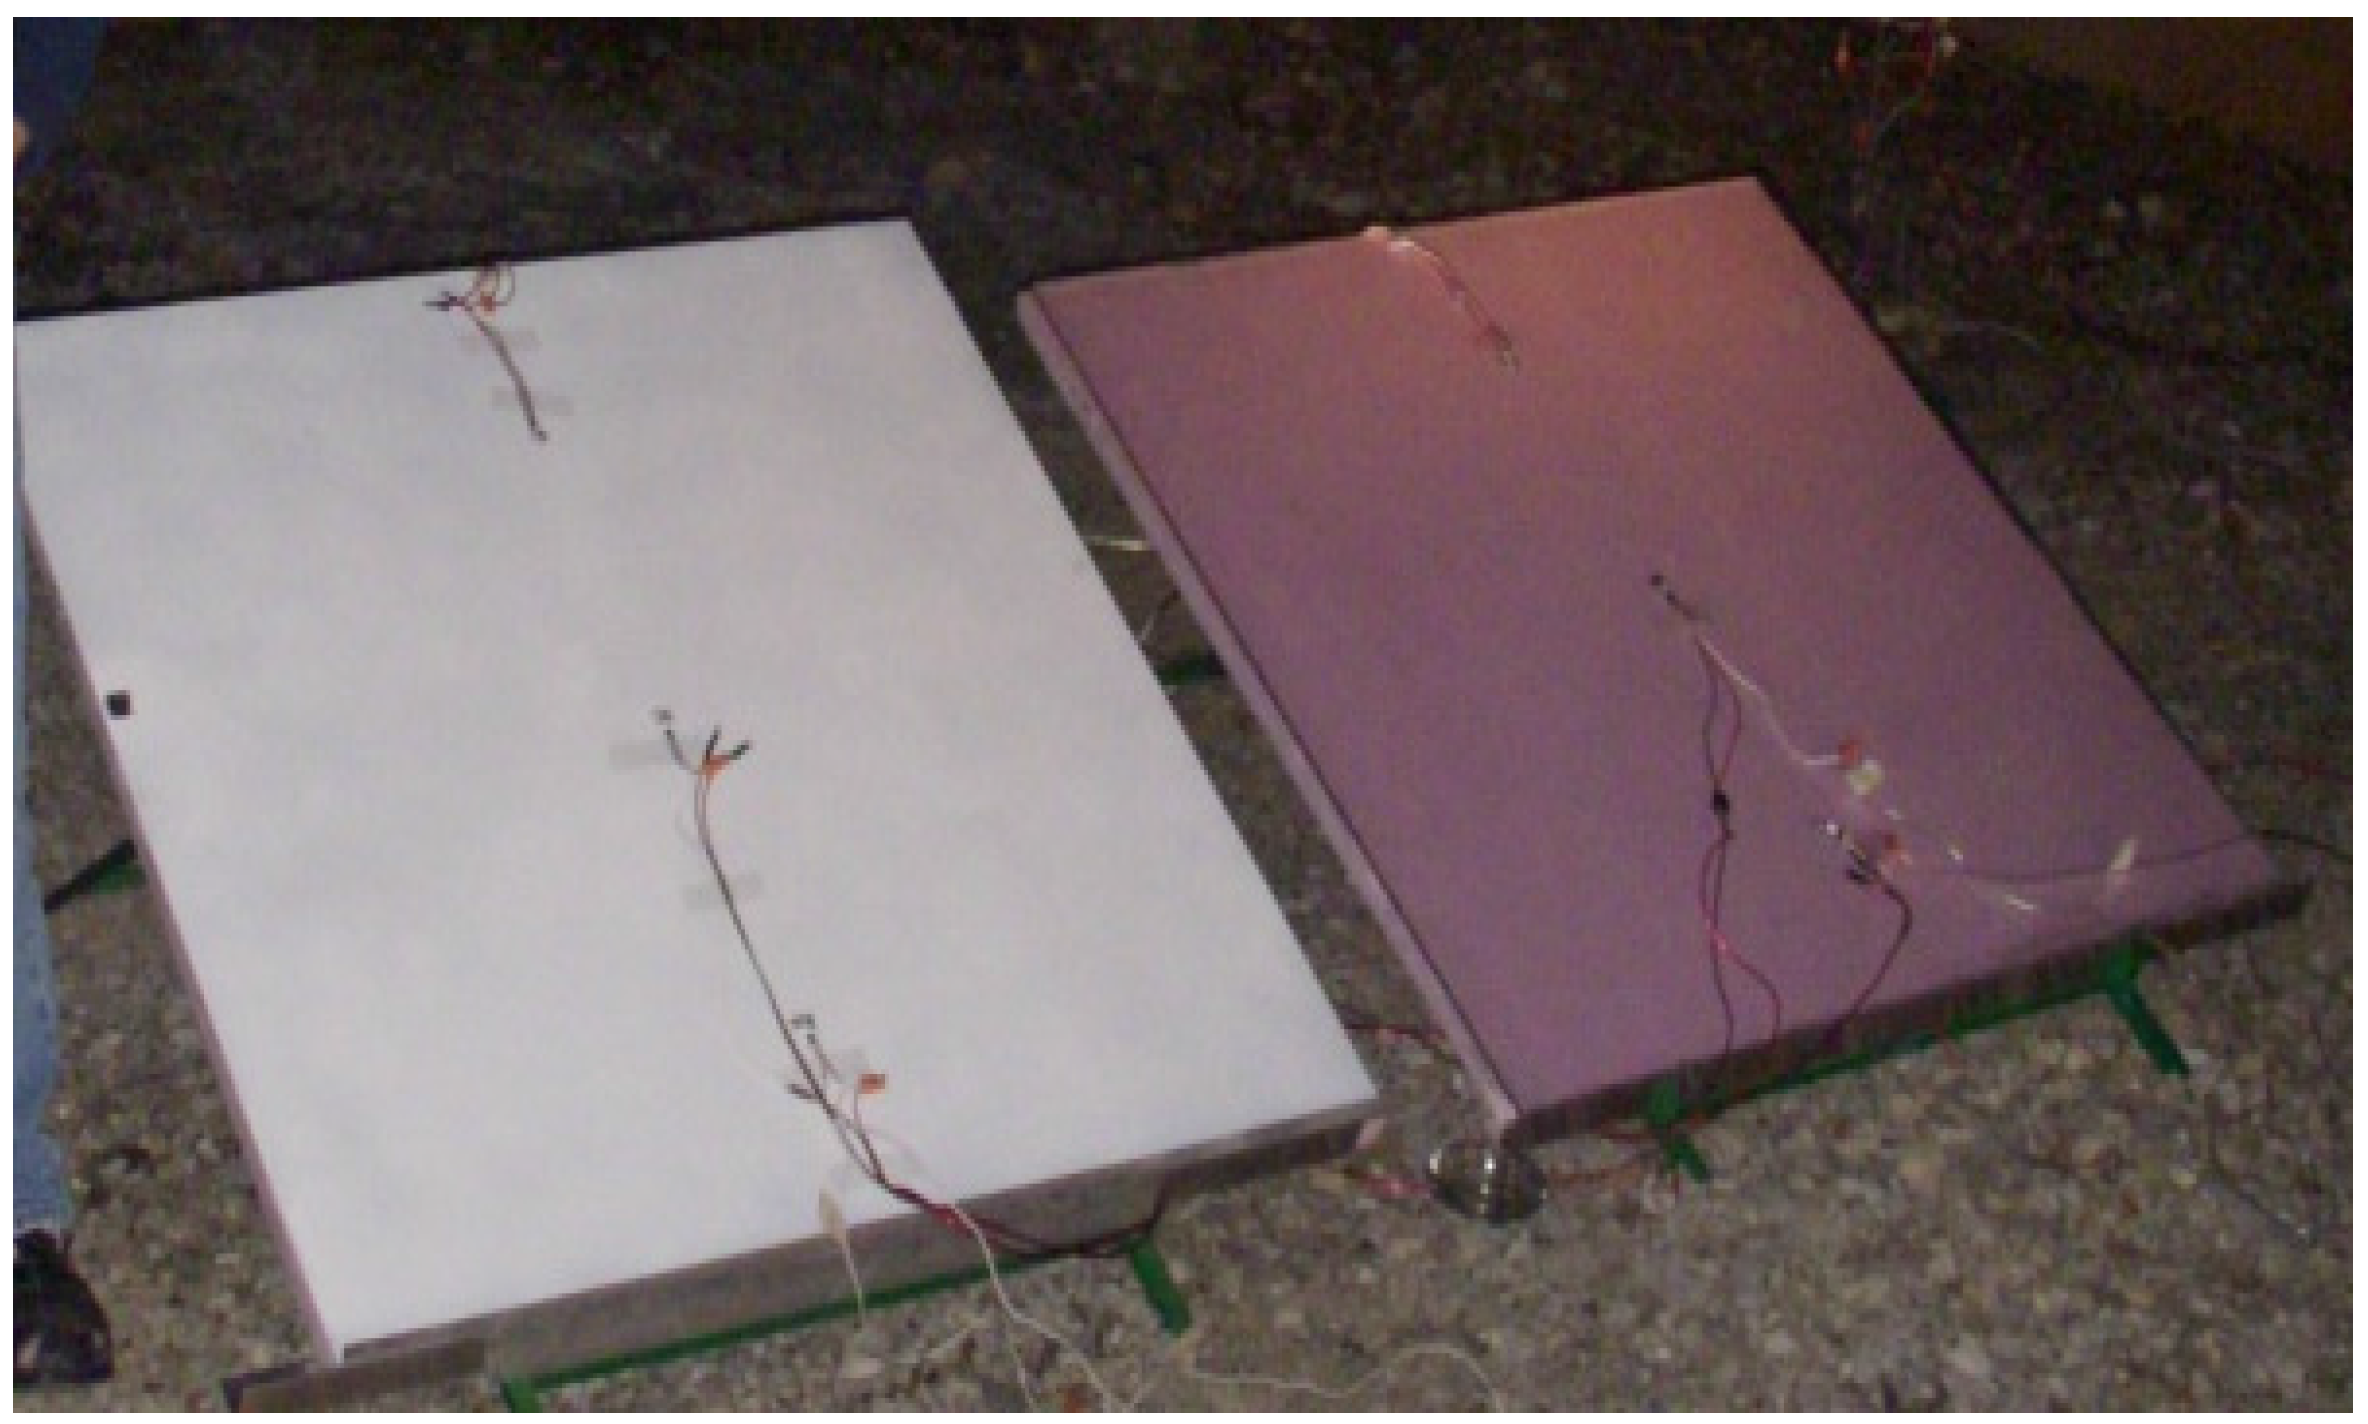
2.2.2. Experimental Model

The experiments consisted in measuring and TRC. During the dew harvest, was monitored at one-hour time steps, while the TRC and the weather conditions were monitored over the 91 nights of the winter, at time steps of 10 min, and then averaged for each hour.
Figure 2 and Figure 3 show the experimental setup. The two collectors were inclined 30° to the horizontal, facing North, according weather conditions of Section 2.1. The RC view factor was 0.7. The inclination allows the sliding of the condensed dew toward the bottom of the RC, then to a gutter, and finally to a glass container; both dew collectors operated at the same time for comparison. The TRC was measured at three points, and then averaged. The ambient temperature, wind velocity, and dry and wet bulb temperatures were measured by sensors that were placed above the dew collectors.
Figure 2. Experimental setup.
Atmosphere 07 00002 g002
Figure 3. View of the white-painted aluminum and glass dew collectors.
Atmosphere 07 00002 g003

2.2.3. Experimental Procedure

The experimental campaign was conducted from 22 December 2011 to 21 March 2012 (91 days). The nightly experiments were performed from 21:00 p.m. to 8:00 a.m. the next day (local time). The weighing of the collected dew was performed hourly. We measured the surface temperatures and weather conditions every 10 min and averaged them for each hour, day, month and over the winter. The condensed mass was measured in an Ohaus HH 120D digital electronic balance with an uncertainty of ±0.05 g. The surface temperatures were measured using LM35 sensors with an uncertainty of ±0.5 °C, and logged with a NI-4350-16 bits data logger and its Virtual Bench Data Acquisition software. The ambient temperatures were measured using LM35 sensors. The RH was measured with HMS112 Vaisala hygrometer with an accuracy of ±2%. The wind velocity was obtained with an uncertainty of 3%, from a meteorological weather station, which belongs to the company COPUSA, located 390 m away from the test side; the wind velocity meter was located 9 m above the ground. Because a small portion of dew remained on the RC, this portion was dragged down each hour with a water squeegee. The RC surface was carefully cleaned to prevent dust and dirt accumulating on the RC, which affects its emissivity and wettability, and consequently, affects the cooling and dew flow.

3. Results and Discussion

3.1. Experimental Results

The number of winter days for each month of the experimental campaign was the following: December—10 days, January—31 days, February—29 days, and March—21 days, which totals 91 days. Throughout the experimental campaign, the nocturnal environmental conditions were favorable to condensation, with clear sky conditions most of the time. The average wind directions were in December 2011, toward the SSW, in January 2012, toward the south, in February, toward the SSE, and in March toward the ESE; condenser was oriented toward the N. The average wind values were 0.14 m/s in December, 0.33 m/s in January, 0.31 m/s in February, and 0.33 m/s in March.

3.1.1. Winter Dew Harvest

There was dew harvested on 68% of the winter nights. Table 1 shows the minimum and maximum nighttime temperatures and relative humidity during the experiments. The nighttime ambient temperatures ranged from 4.0 °C to 13.0 °C and the relative humidity from 47% to 90%. The Ta went up and the RH decreased as the months progressed. Of these nights, considering those that had clear sky conditions and a low wind velocity, the night of 3 February 2012 was the closest to the hourly average values of RH, Ta, Tdp, Tsk, and wind velocity; therefore, that night was considered a representative night. The top eight nights of the dew harvest, during the winter, were averaged and plotted, which resulted in similar values to those of the representative night. A comparison of dew with atmospheric water (dew plus rain) shows that dew harvest was for all of winter: 3.2%, in December (22 to 31): 100%, January: 10.5%, February: 2.4% and March (1 to 21): 1.0%.
Table 1. Minimum and maximum Ta and RH during the experimental campaign.
--21–31 December1–31 January1–29 February1–21 MarchWinter
--minmaxminmaxminmaxminmaxminmax
Ta (°C)4.294106.2127.513413
RH (%)61814785609047904790

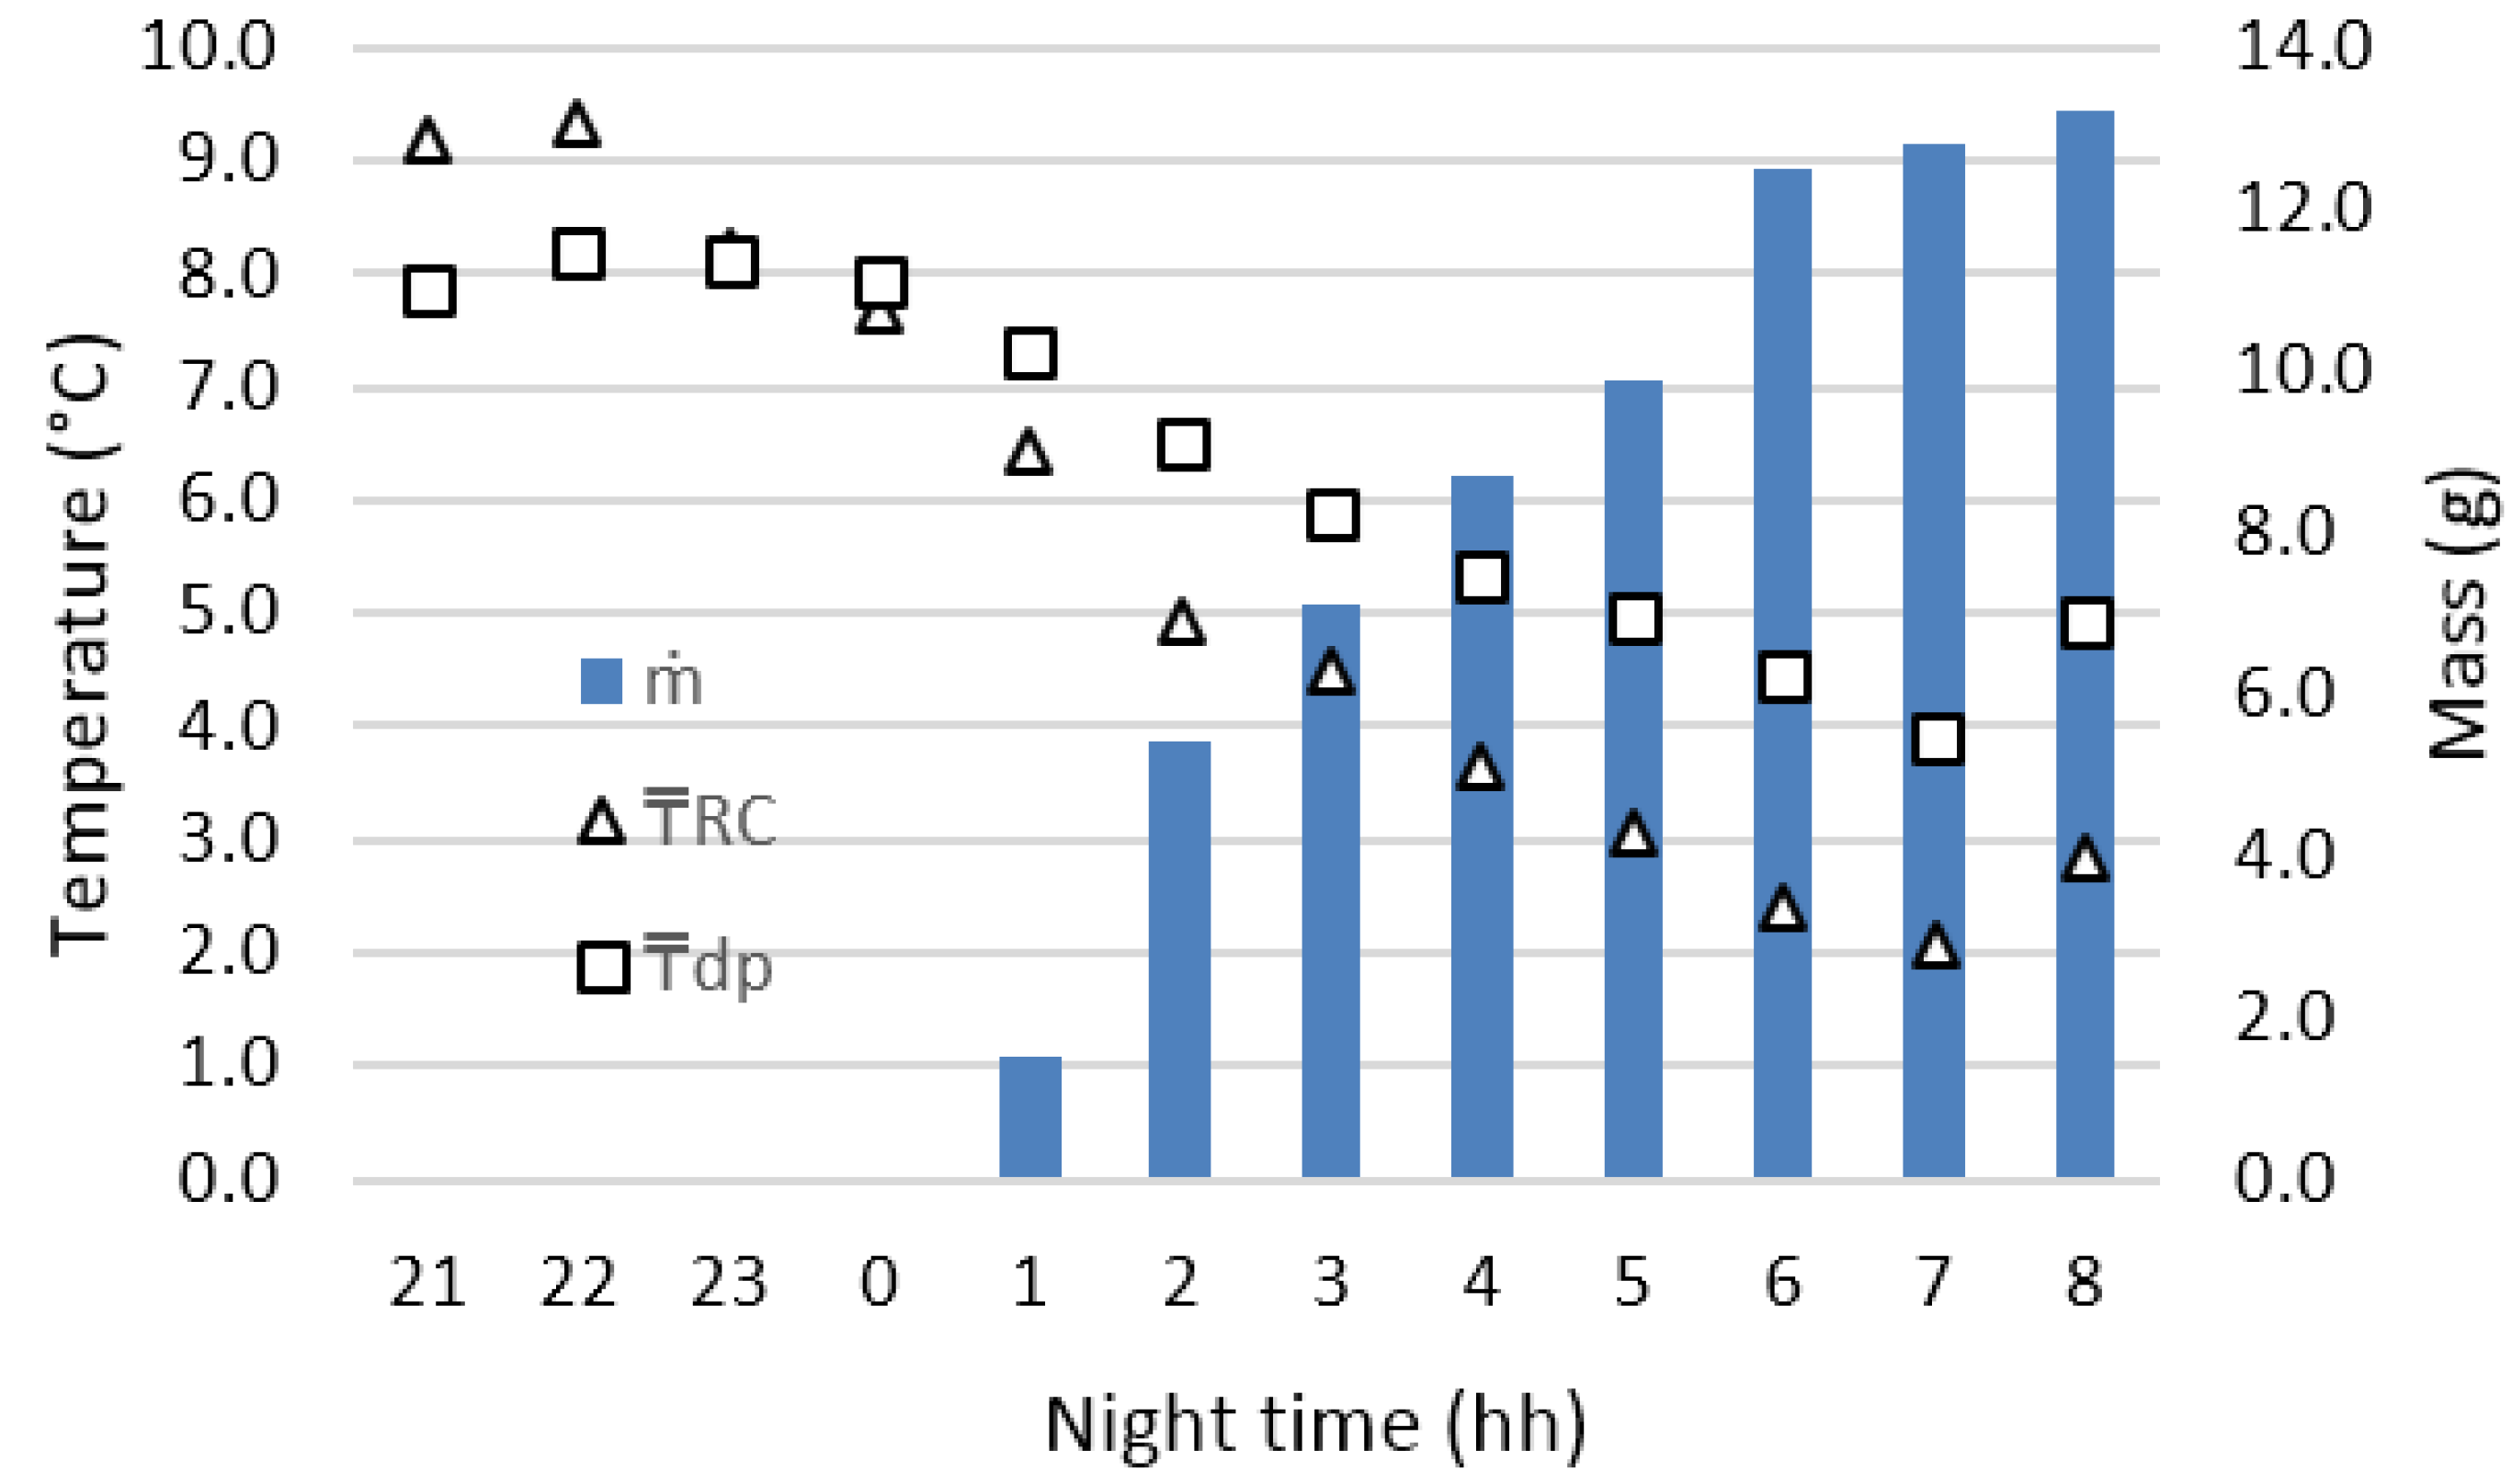
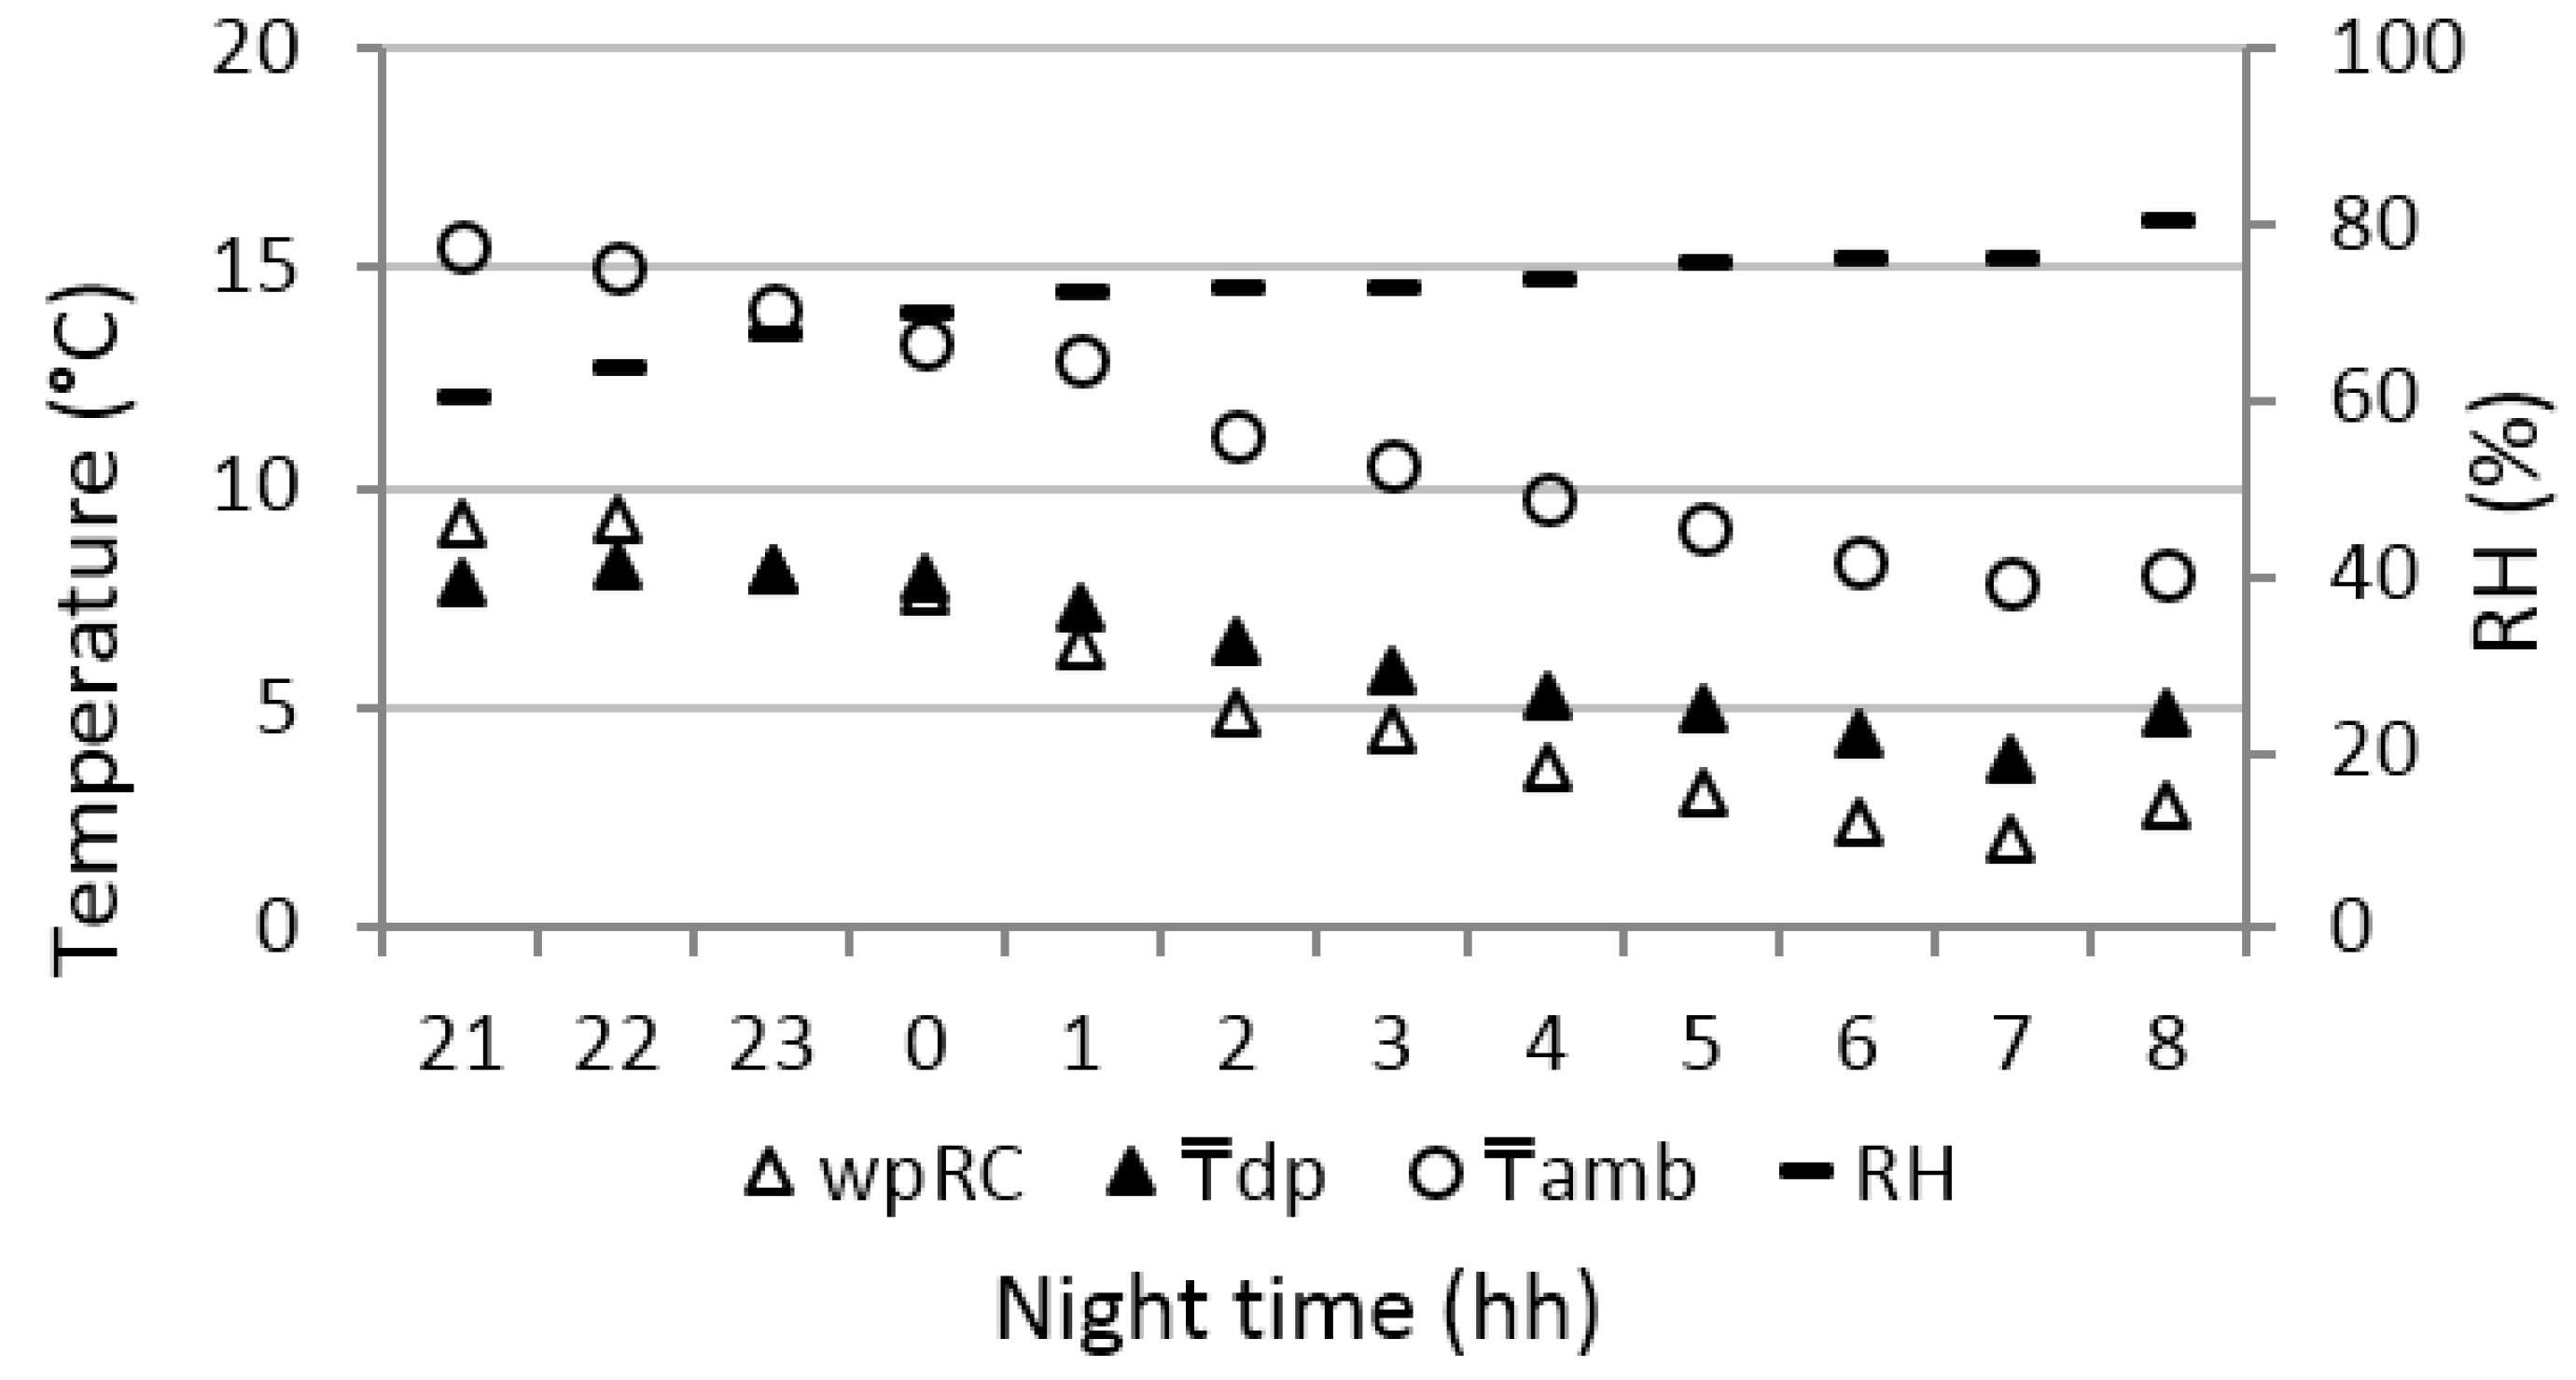
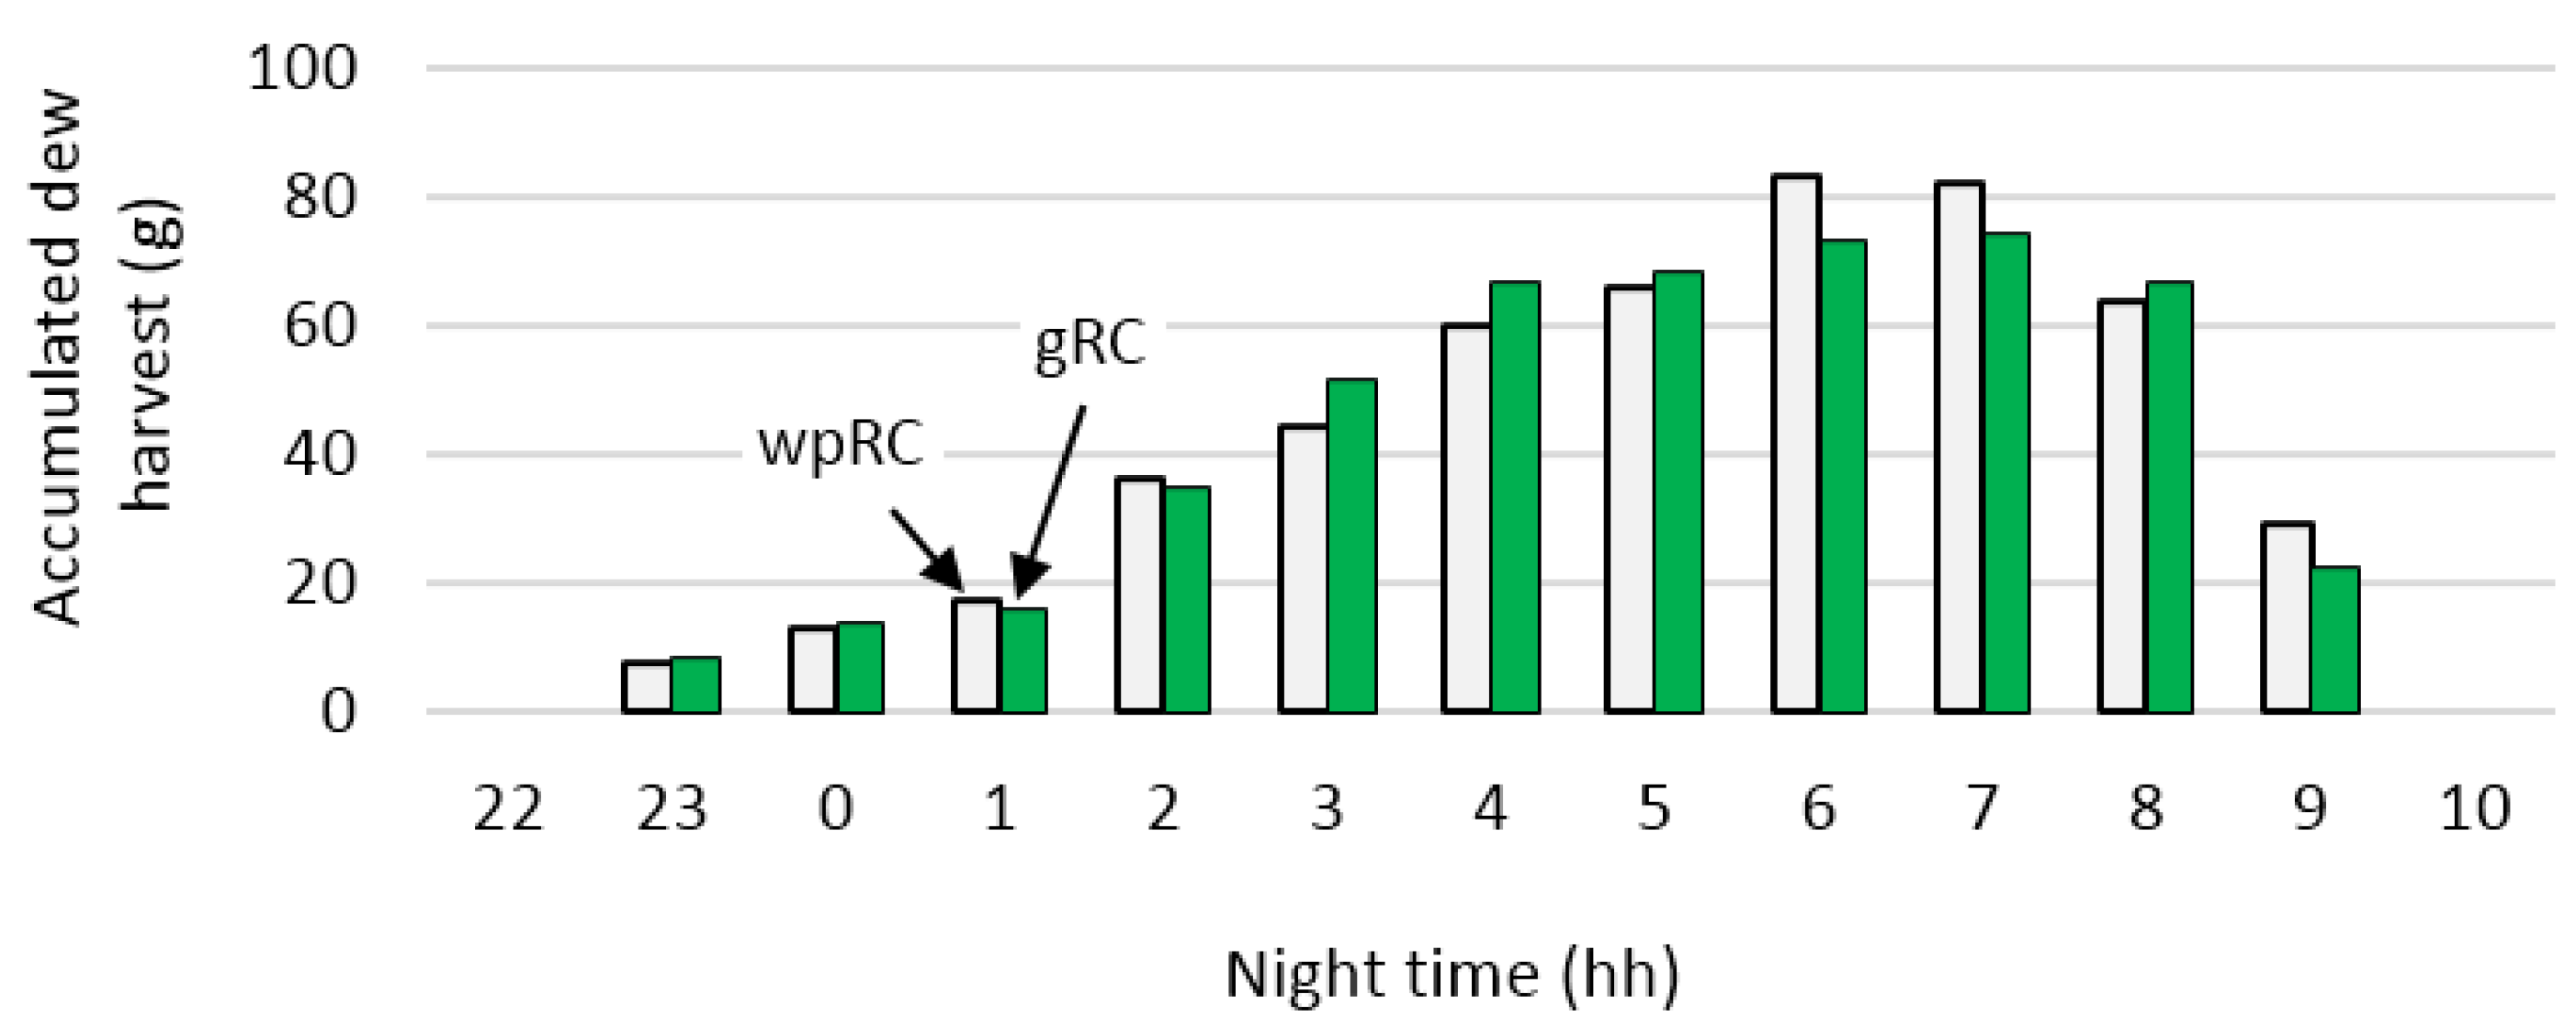
3.1.2. Hourly Dew Harvest during a Representative Winter Night

Figure 4 shows the hourly dew harvest and the weather conditions during the representative night. As observed, at the beginning of the experiment, at 21:00 p.m., RH was 60% and Ta was 16.0 °C, with TRC higher than Tdp, conditions that did not produce condensation. After 23:00 p.m., TRC was below the Tdp and the relative humidity increased to reach 80%, which caused condensation on the RC that lasted until 8:00 a.m. The hours considered in these graphs correspond to local time.
Figure 5 shows the hourly-accumulated dew harvest on both RCs, over eight clear sky nights. Throughout these nights, the wind velocity remained roughly constant, with maximum values of 1.5 m/s. As noted previously, at the beginning of the nights, the RH was relatively low (60% to 67%) and the Ta was relatively high (15.5 °C to 14.1 °C), which are unfavorable conditions for condensation. After 23:00 p.m., the aforementioned variables reached a combination that caused the onset of the condensation on the RC. The condensation continued until 9:00 a.m. of the next morning. The shape of the graph of the accumulated hourly dew harvest over the eight nights was similar to that of the representative night. The dew harvest occurred from 23:00 p.m. to 9:00 p.m., and the maximum was between 6:00 and 7:00 a.m., when the Ta reaches its minimum value and the RH reaches its maximum value. As observed in Figure 6, the wpRC sometimes collects slightly more than the gRC, but at times, this situation is reversed, apparently by randomness.
Figure 4. Hourly dew harvest and weather conditions during a representative night.
Atmosphere 07 00002 g004aAtmosphere 07 00002 g004b
Figure 5. Hourly dew harvests during eight clear sky nights.
Atmosphere 07 00002 g005

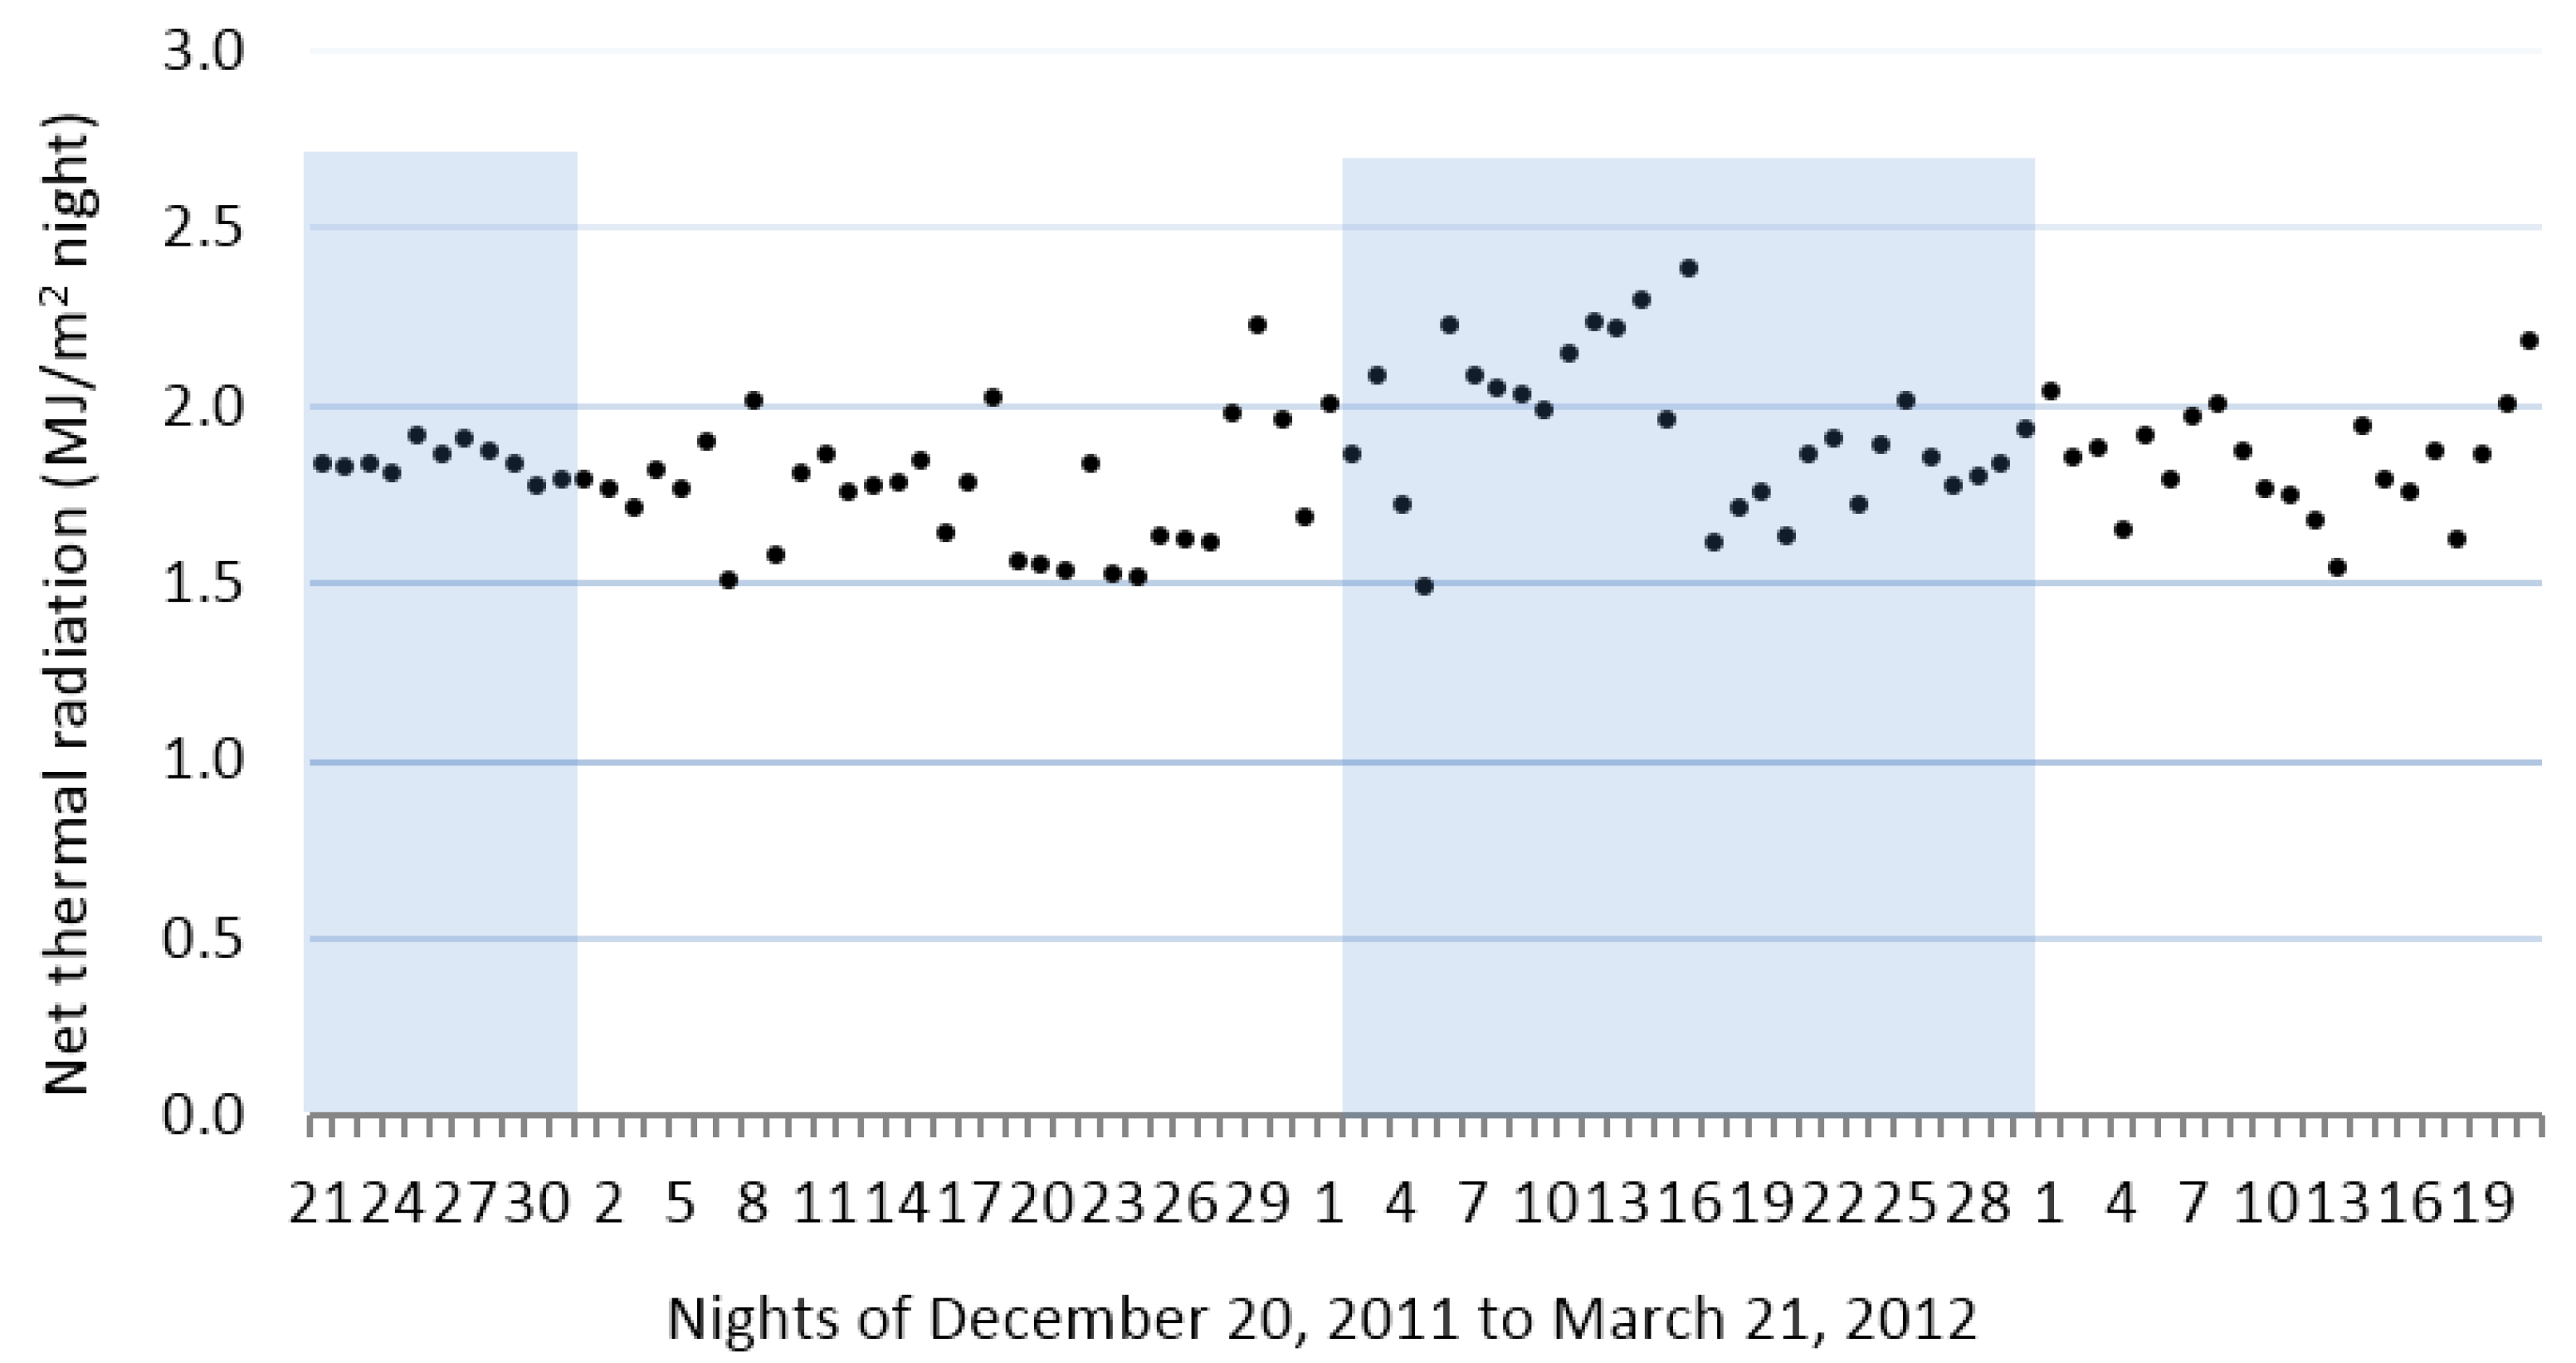
3.1.3. Nightly Radiative Cooling throughout Winter

During the experiments, the net thermal radiation was 1.9 MJ/m2 night, on average, according to the first term of Equation (3). It was roughly constant during the winter, with fluctuations of 20%, as shown in Figure 6. The causes of the net thermal radiation fluctuations are mainly attributable to variations in the cloudiness and relative humidity.
Figure 6. Night thermal radiation, calculated for the winter.
Atmosphere 07 00002 g006

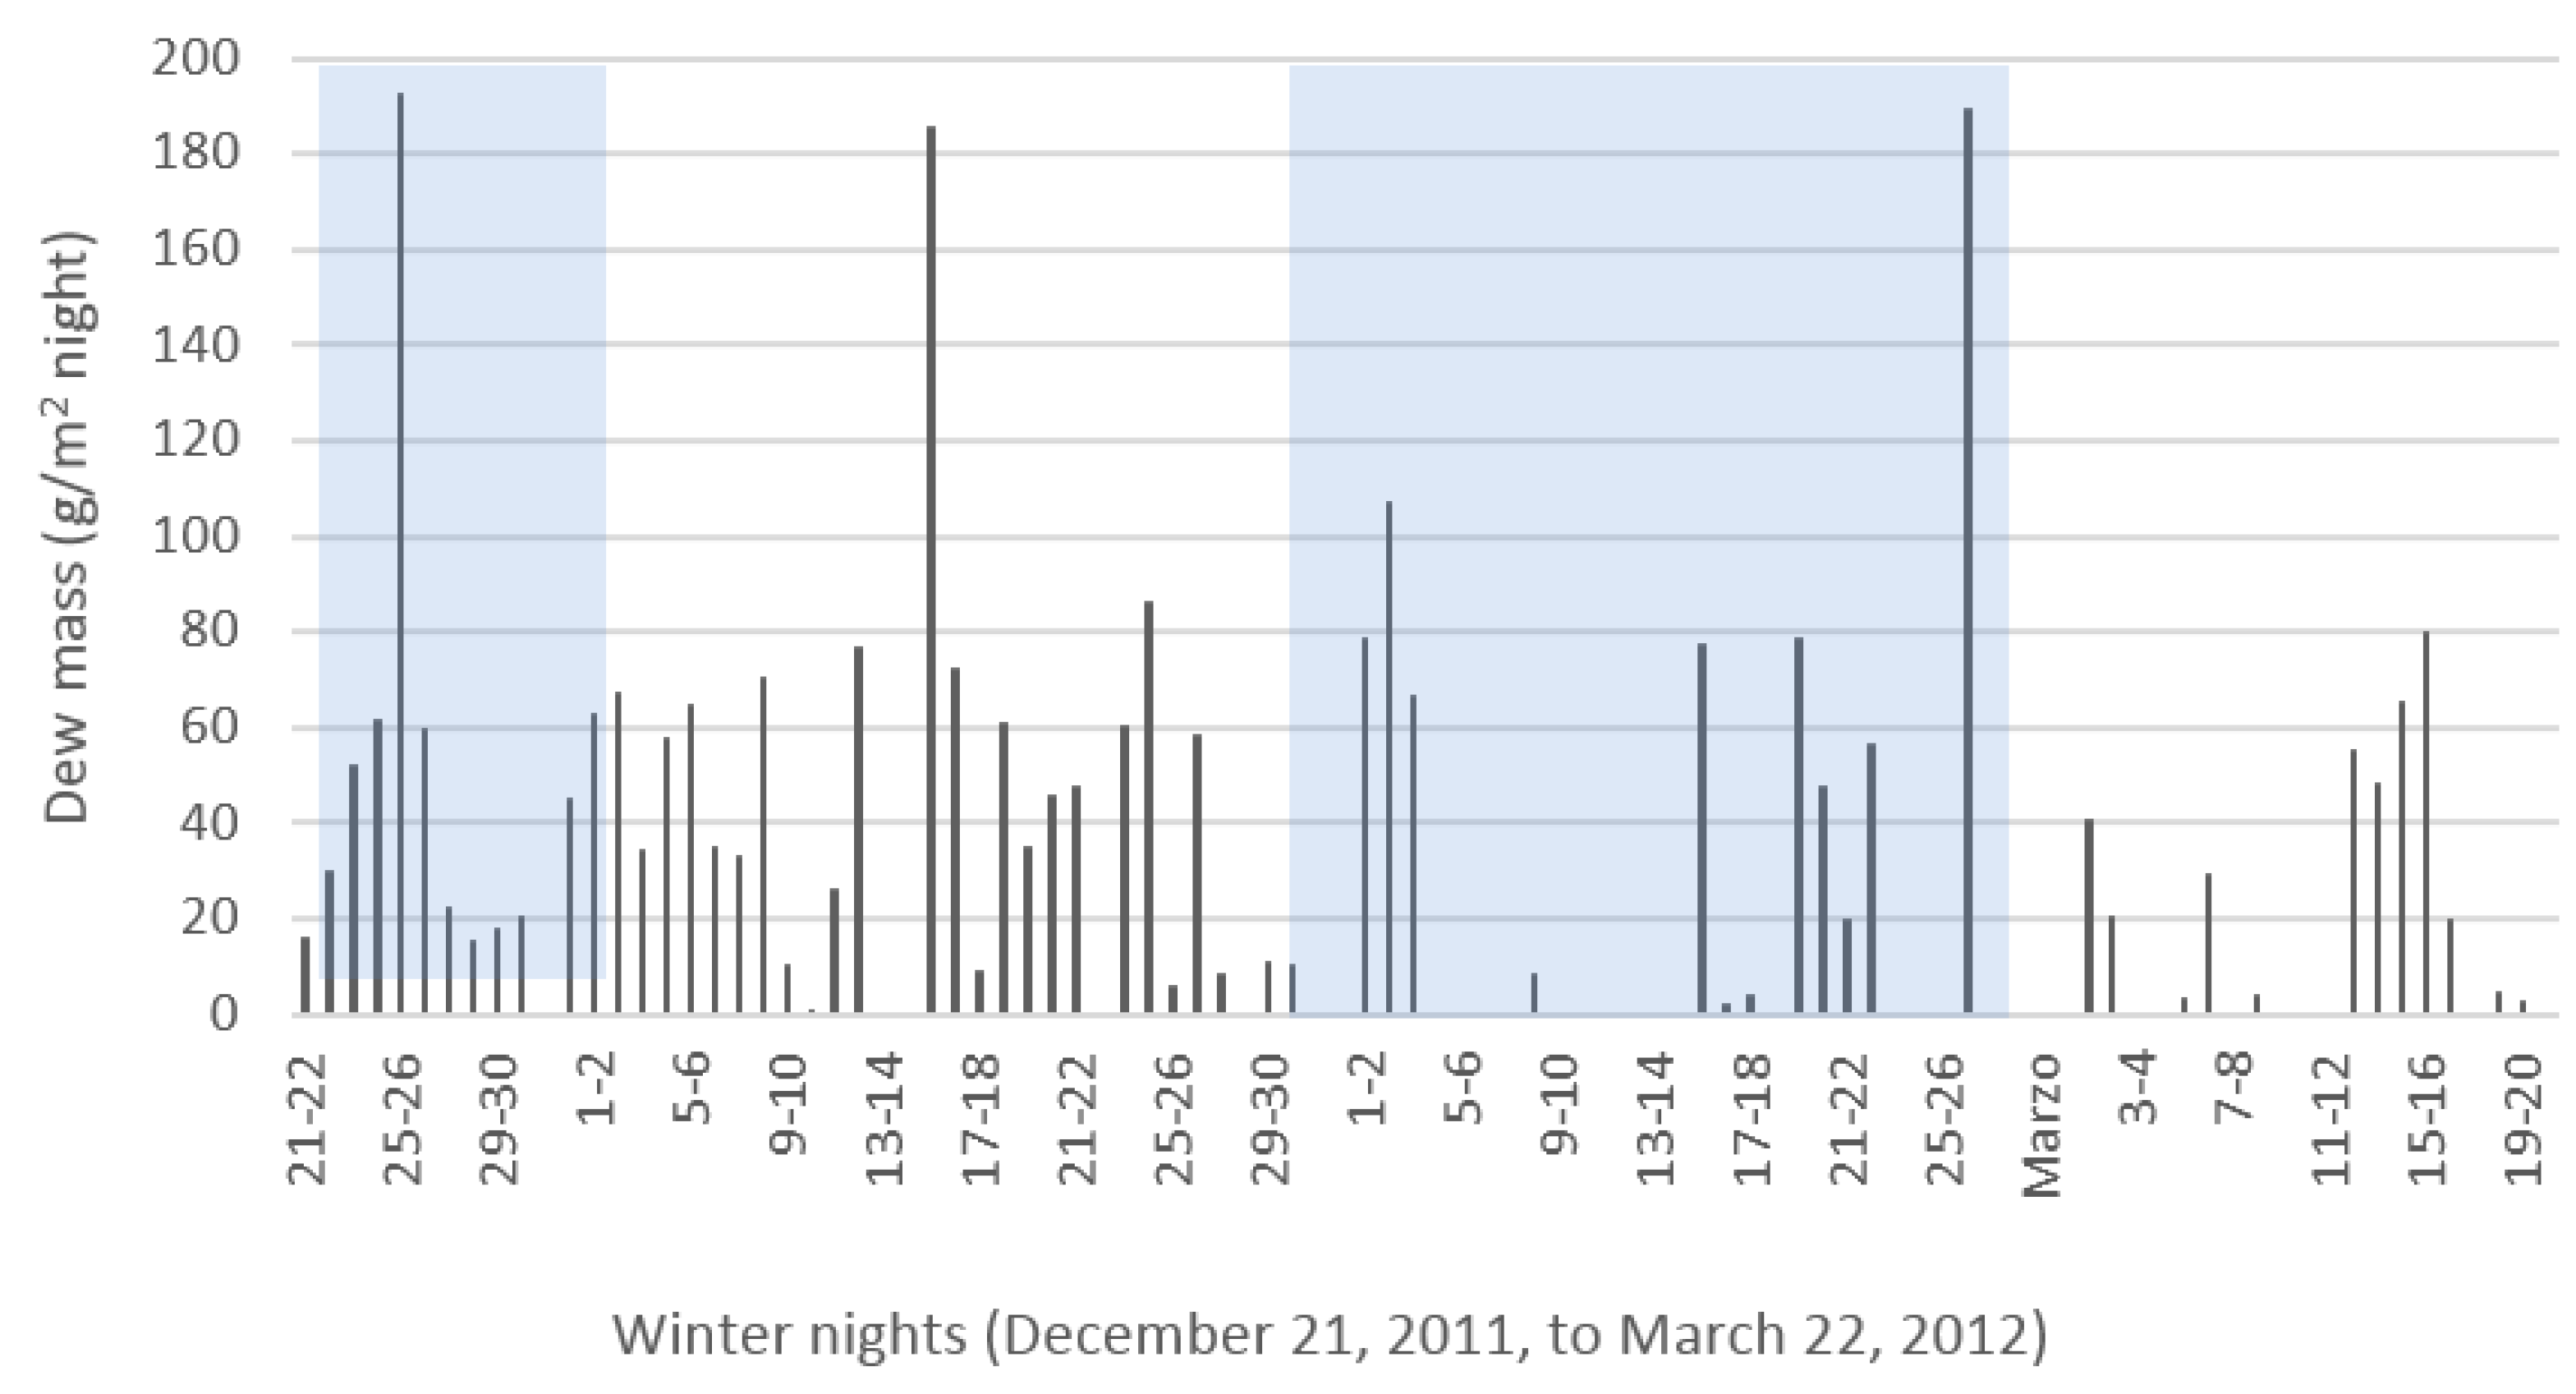
3.1.4. Nightly Dew Harvest throughout the Winter

Figure 7 shows the nightly dew harvest throughout the winter. There was condensation during 68% of the winter nights: December: 10 of 10 nights = 100%, January: 26 of 31 nights = 84%, February: 12 of 28 nights = 43%, and March: 12 of 31 nights = 39%. The latter reveals that there is a better dew harvest during the cold period (November to February) than during the warm period (March to May). Hence, in México City, according to the experimental results, the ADC area that is needed to fulfill the requirements for drinkable water for each person is between 62 and 152 m2. The required dew collector area was calculated according to the daily drinkable water requirements [8].
Figure 7. Dew condensation throughout the winter.
Atmosphere 07 00002 g007

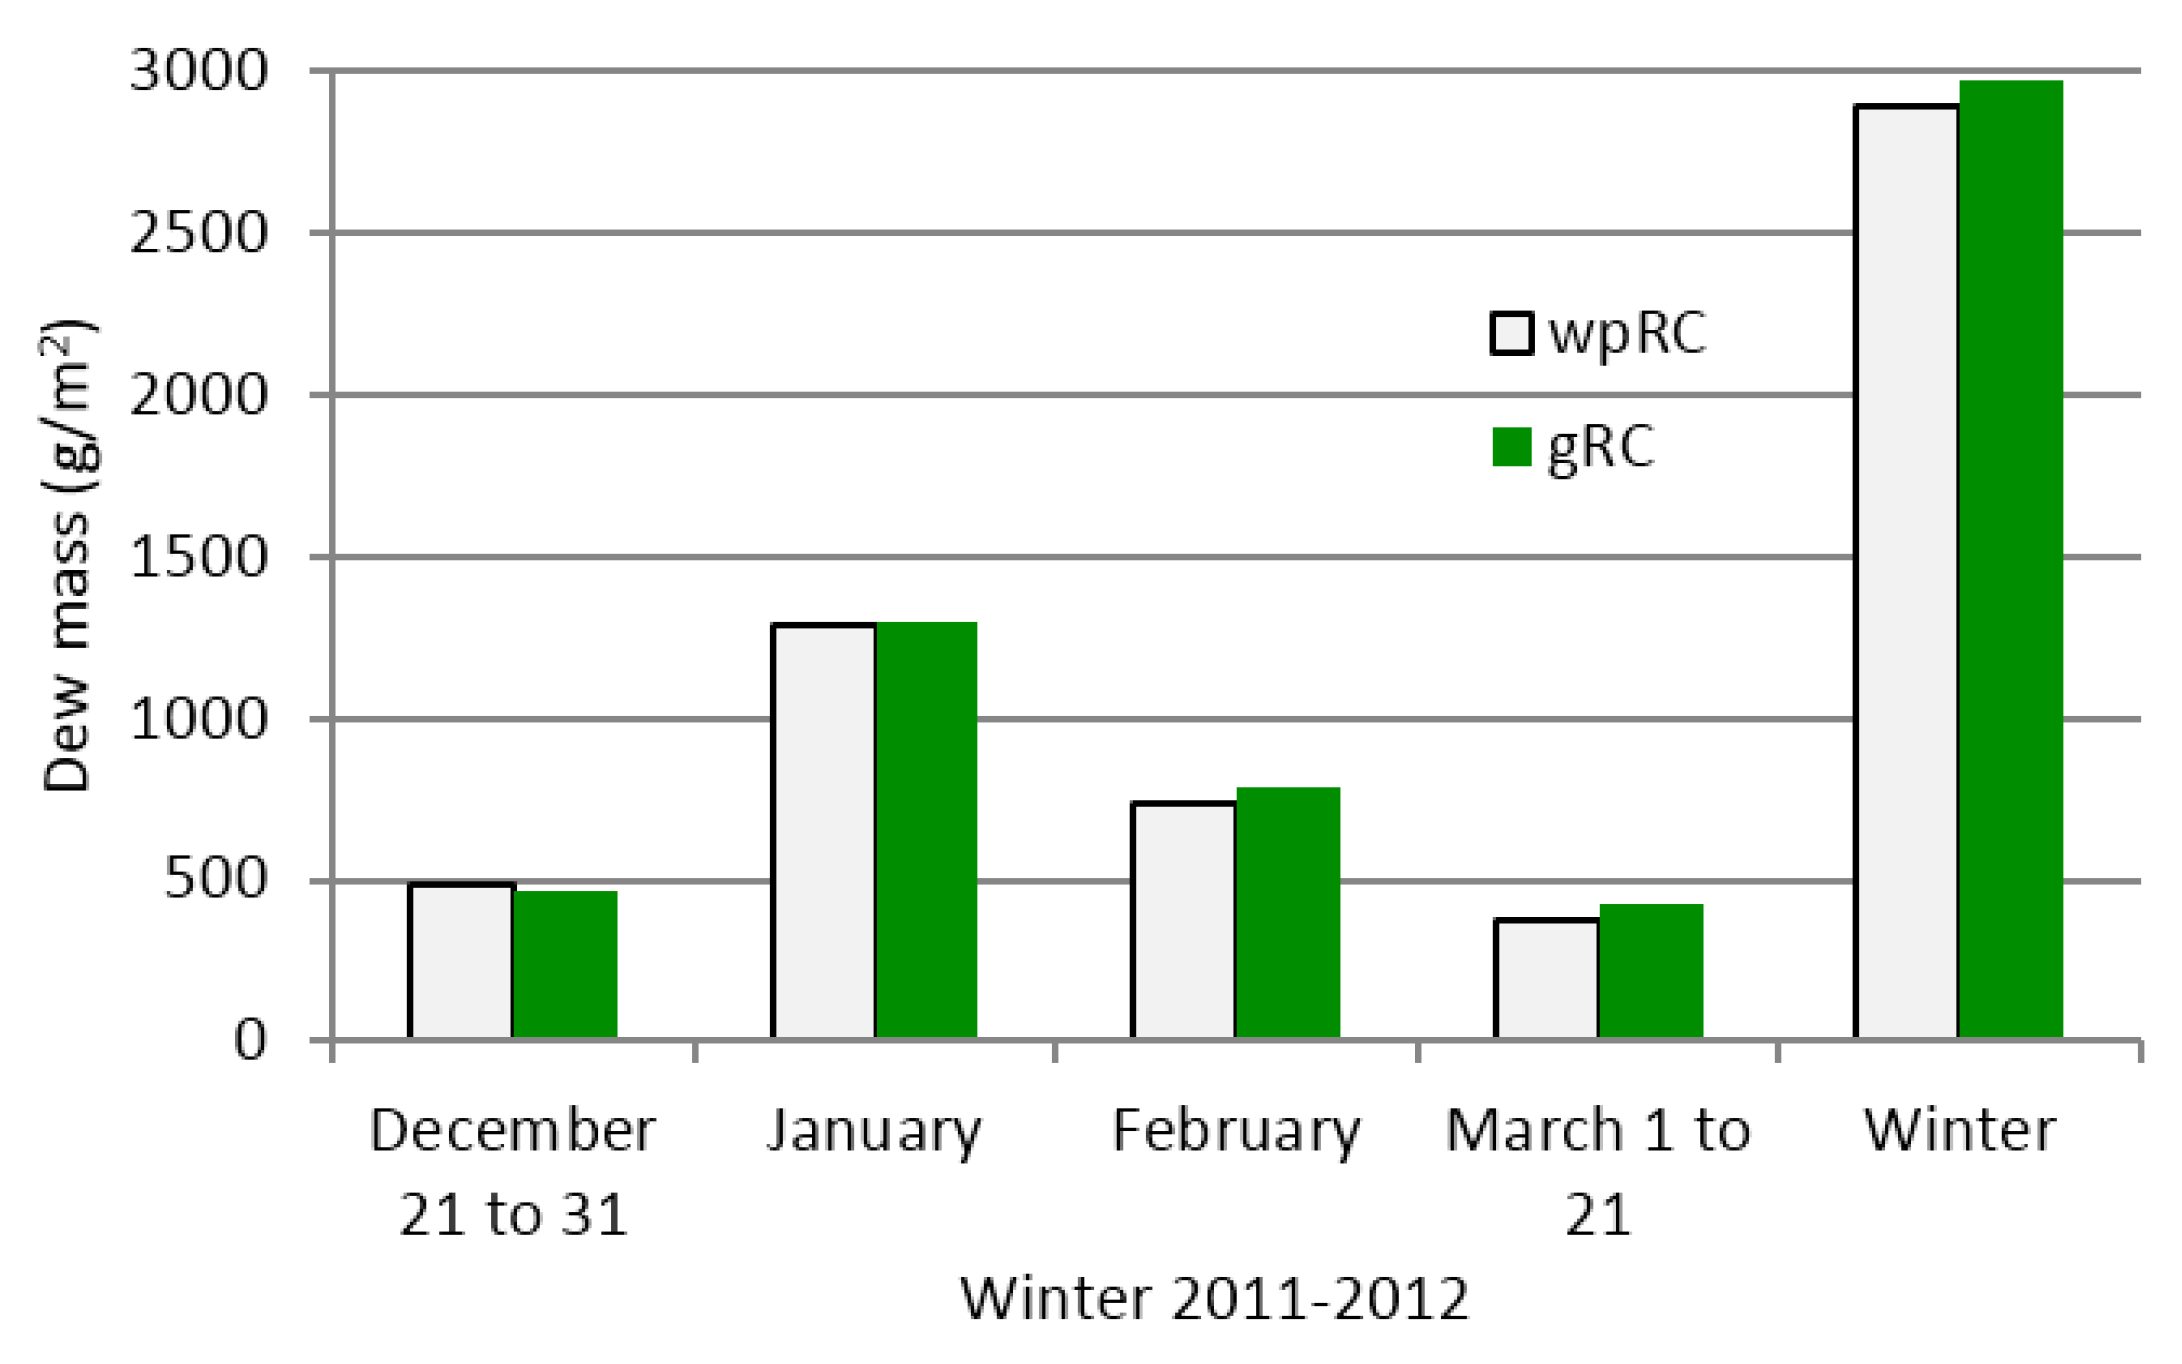
3.1.5. Monthly and Winter Dew Harvest

Figure 8 shows the monthly and winter dew harvest for both ADCs. The month with the highest dew collection was January, with a minimum difference between both ADCs (gRC = 1299 g/m2 and wpRC = 1286 g/m2). For the entire winter, the total dew harvest on the gRC was 2977 g/m2 (32.7 g/m2 night), and on the wpRC, it was 2888 g/m2 (31.7 g/m2 night); the difference was only 3.1%. Therefore, it is possible to select any of the two RCs, according to other selection criteria, such as price, durability, fragility, resistance to weathering, heaviness, or availability.
Figure 8. Comparison of the dew harvest in the gRC and wpRC.
Atmosphere 07 00002 g008
On the other hand, when accounting for the number of nights during each month, the monthly averages of the dew harvest per night for both RCs were as follows: December 50 g/m2 night, January 42 g/m2 night, February 27 g/m2 night, and March 20 g/m2 night. Therefore, the monthly average of the dew harvest per night behaves roughly linearly decreasing as the winter months proceed. The dew harvest in temperate with dry winter climate results are comparable to some those obtained from Mediterranean places with hot-dry climates, as is shown in experimental studies. The yearly average daily dew harvest ranged from 36.7 to 57.7 g/m2 for the Mediterranean climate cases, as is shown by Maestre-Valero [16,18]. The average seasonal daily dew harvest was 33 and 36 g/m2 for hot-dry weather according to Nilson et al. [4] and Mileta [14].

3.2. Model Prediction

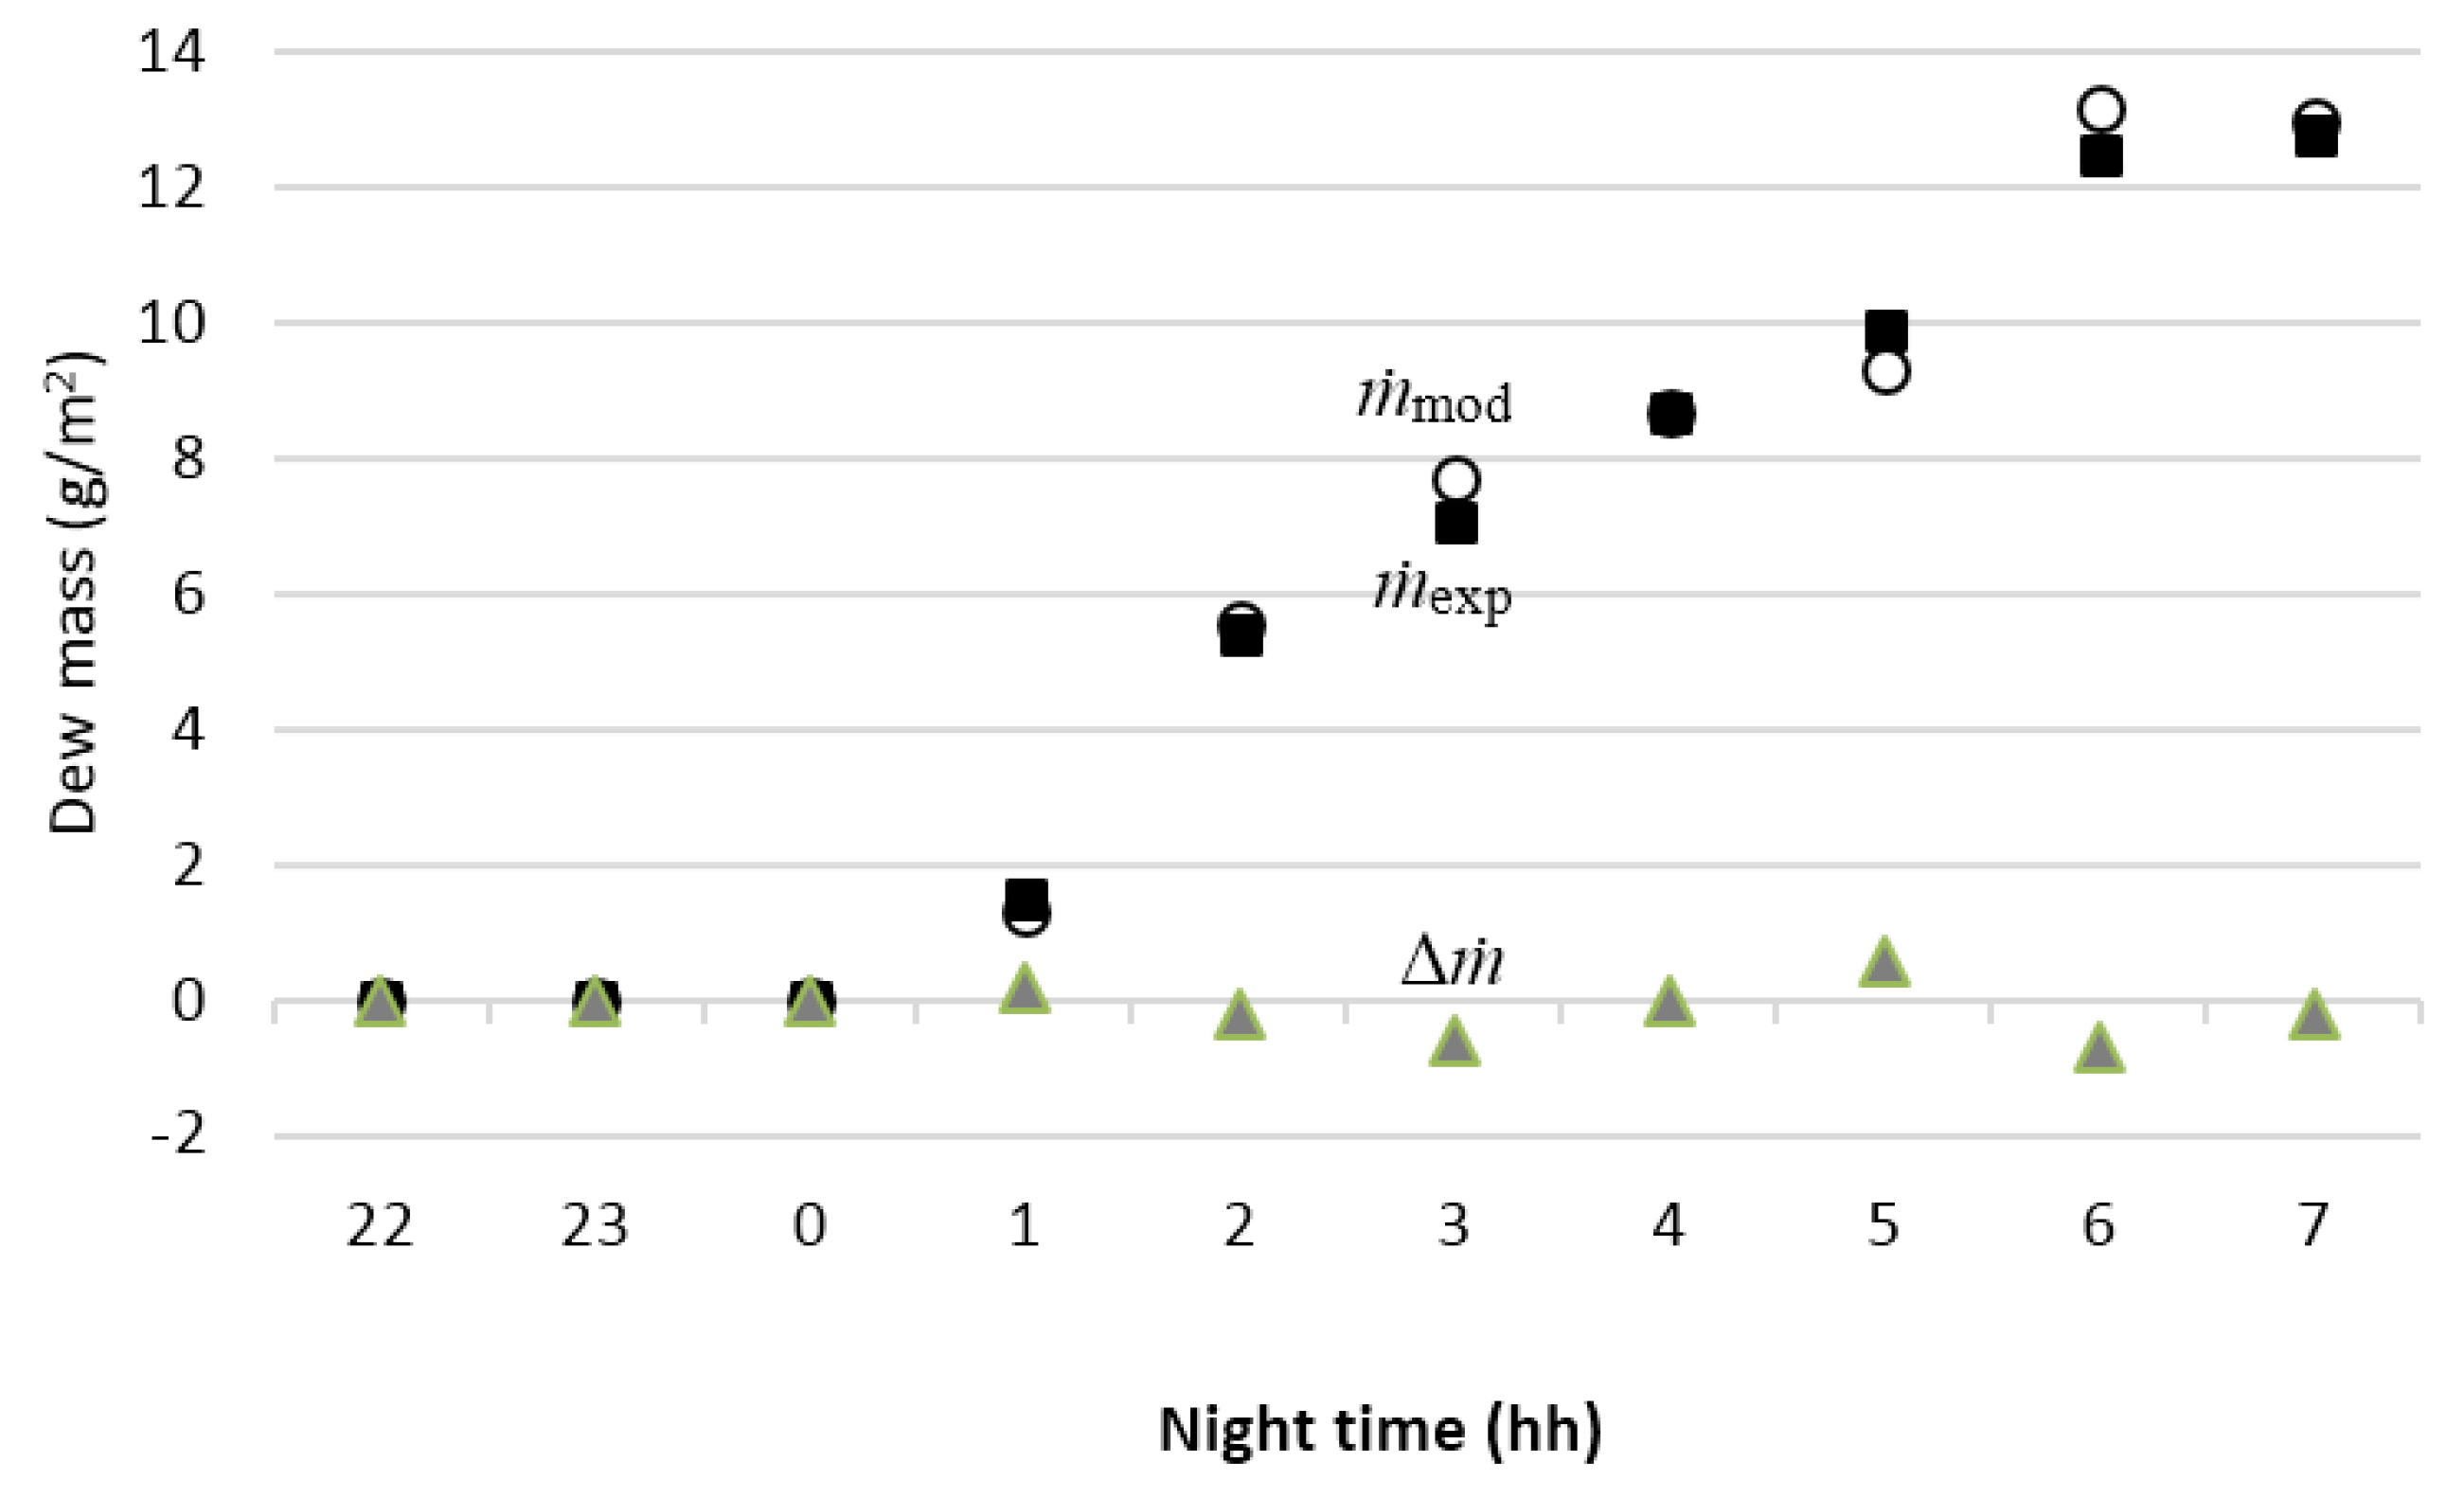
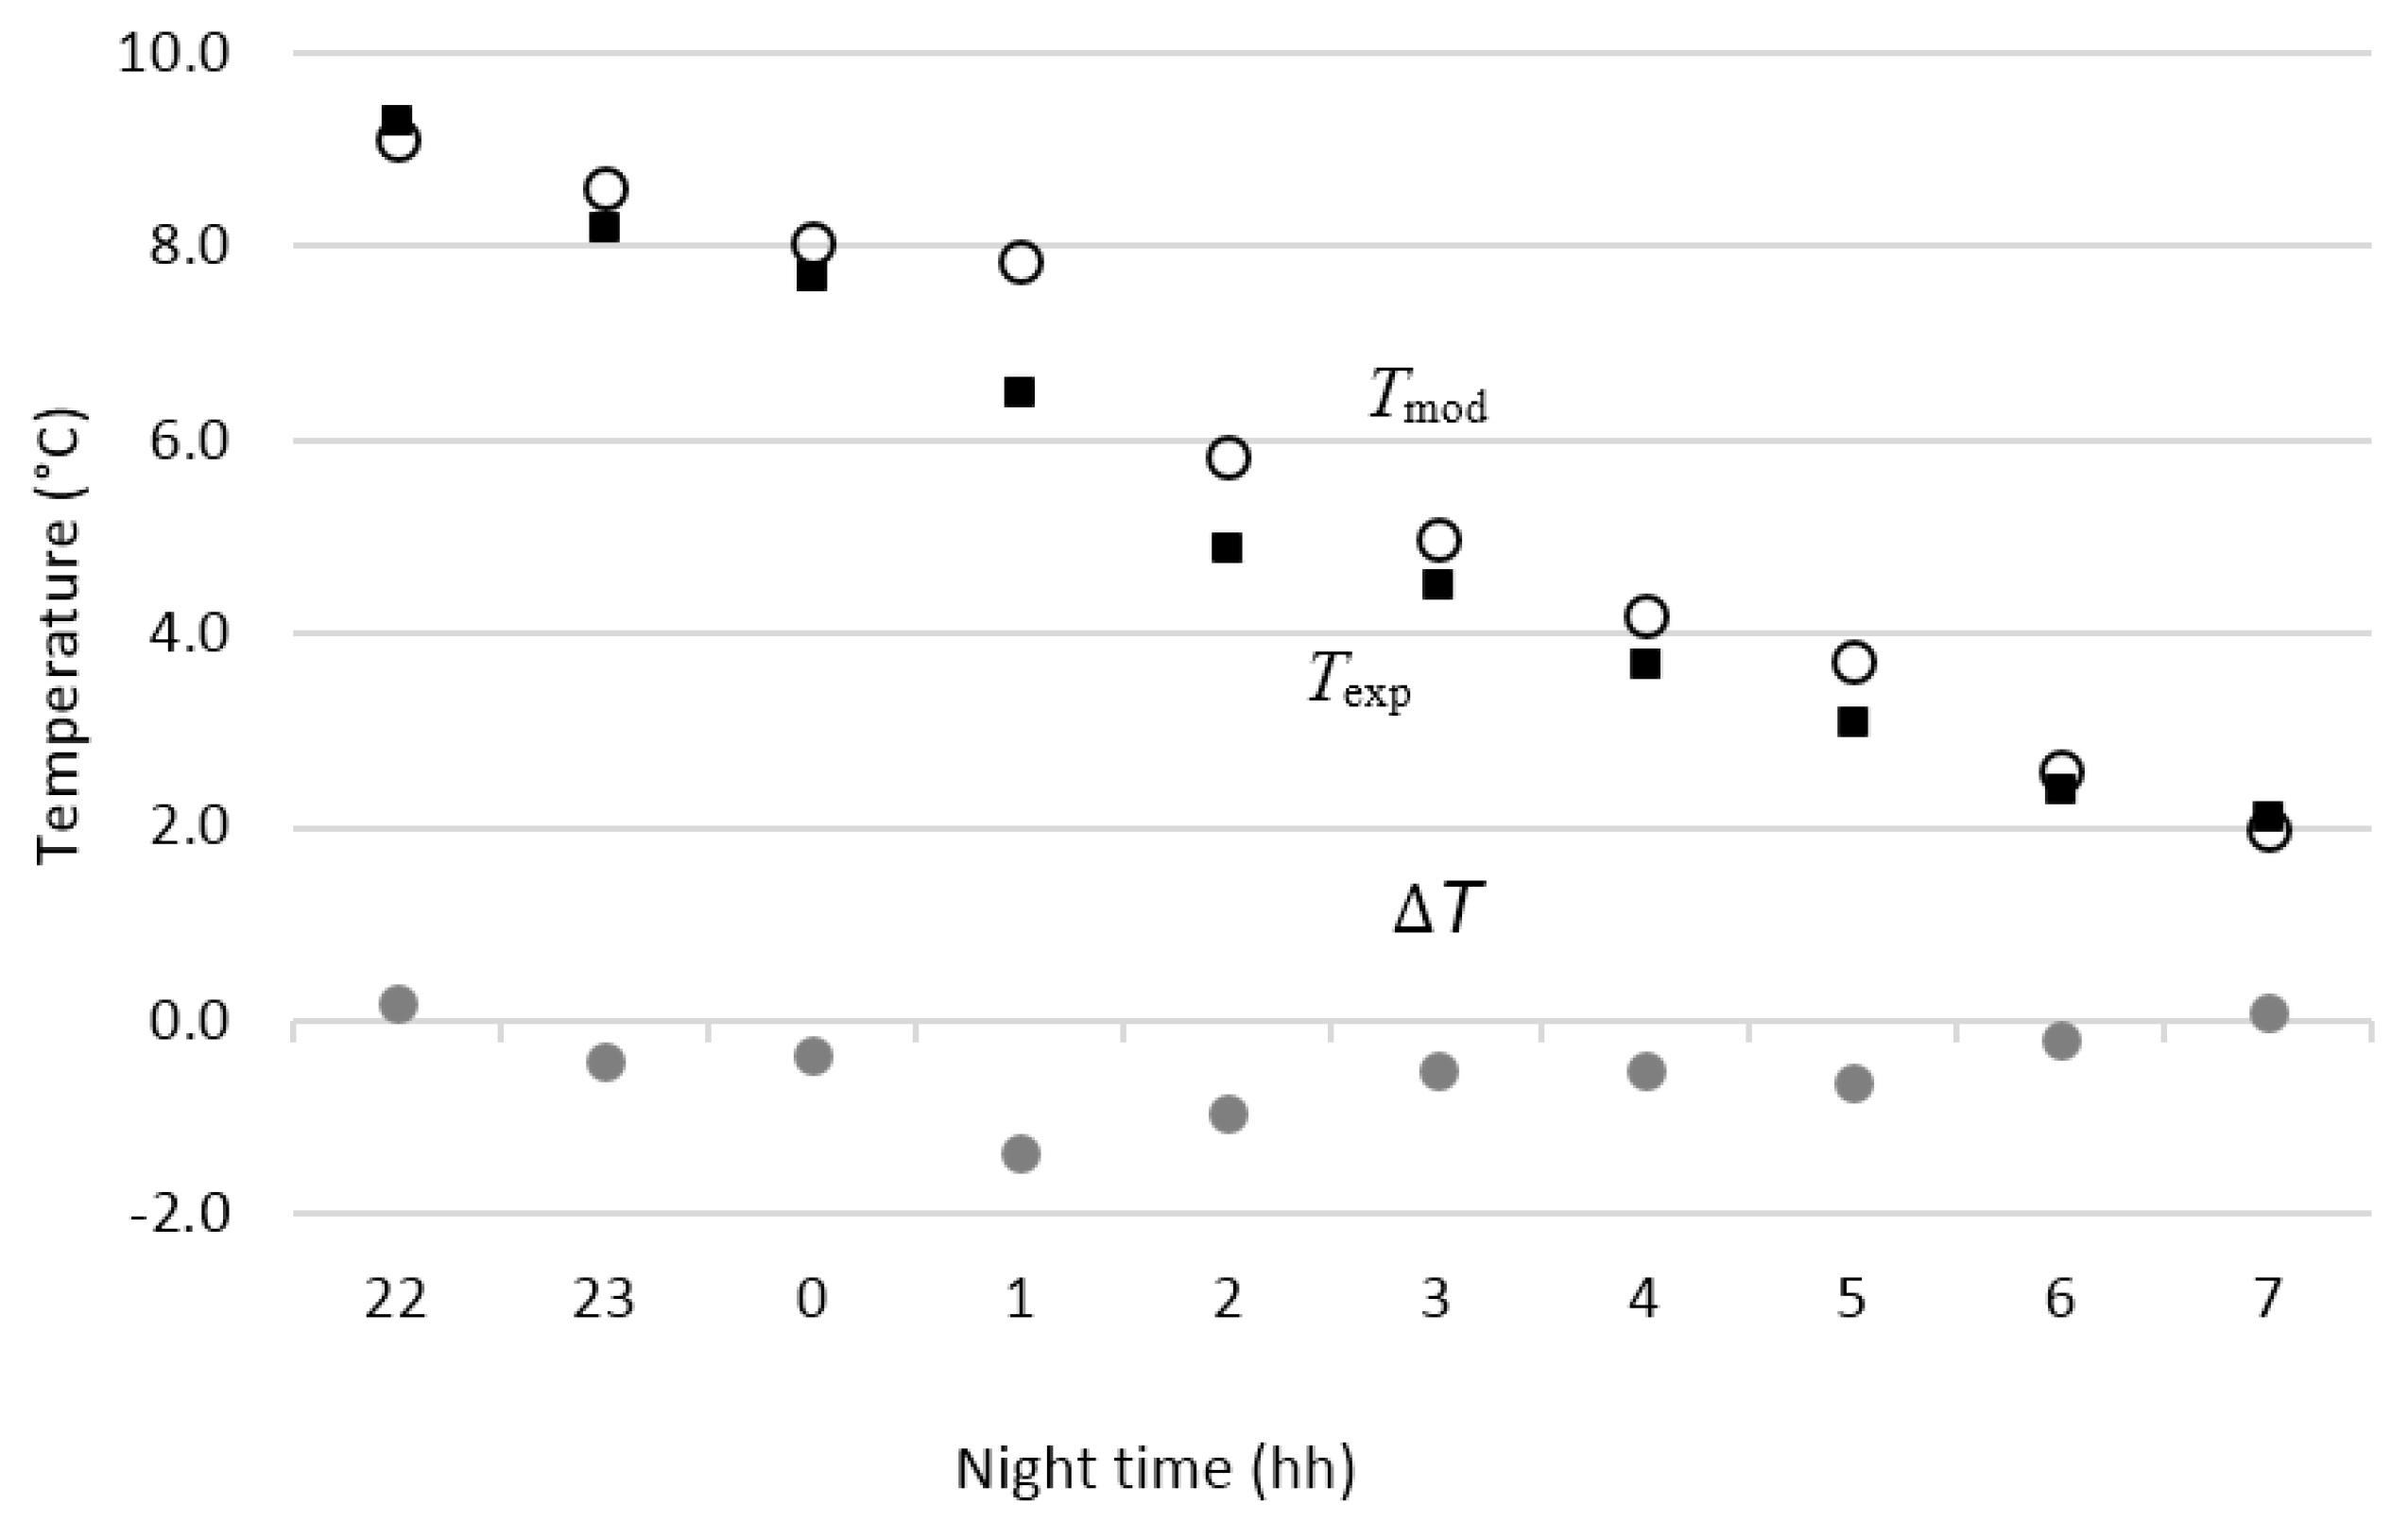
3.2.1. Hourly Dew Harvest Predictions of Representative Nights

The evaluation of the performance of the model accounted for the average hourly TRC and the hourly dew harvest, from the representative night of the winter, as well as the nocturnal dew harvest throughout the winter. Figure 9 shows a comparison between the calculated and measured of TRC, as well as the difference of temperature ΔT during the test. The RMSE was 0.63 °C (R2 = 0.97). The maximum discrepancy, 1.4 °C, occurred at 1:00 a.m.
Figure 9. Comparison of the theoretical and experimental wpRC surface temperature.
Atmosphere 07 00002 g009
Figure 10 shows the measured and calculated values for the hourly dew harvest, as well as the variations during the test. The RMSE was 0.36 g/m2·h, (R2 = 0.99), which is a 10.7% discrepancy, while the maximum discrepancy between the measured and calculated temperatures was only 0.7 g/m2·h at 6:00 a.m. Therefore, a good concordance was observed between the calculated and measured values for Mexico City.
Figure 10. Comparison of the experimental and theoretical dew mass.
Atmosphere 07 00002 g010
Several causes provoked minimal differences between the measured and calculated values of TRC and , such as the small scattered clouds, which change the sky temperature, a non-homogeneous surface temperature of the RC, from the bottom to the top (ΔTRC = 1.0 °C), and the average hourly experimental variables which imply uncertainties.

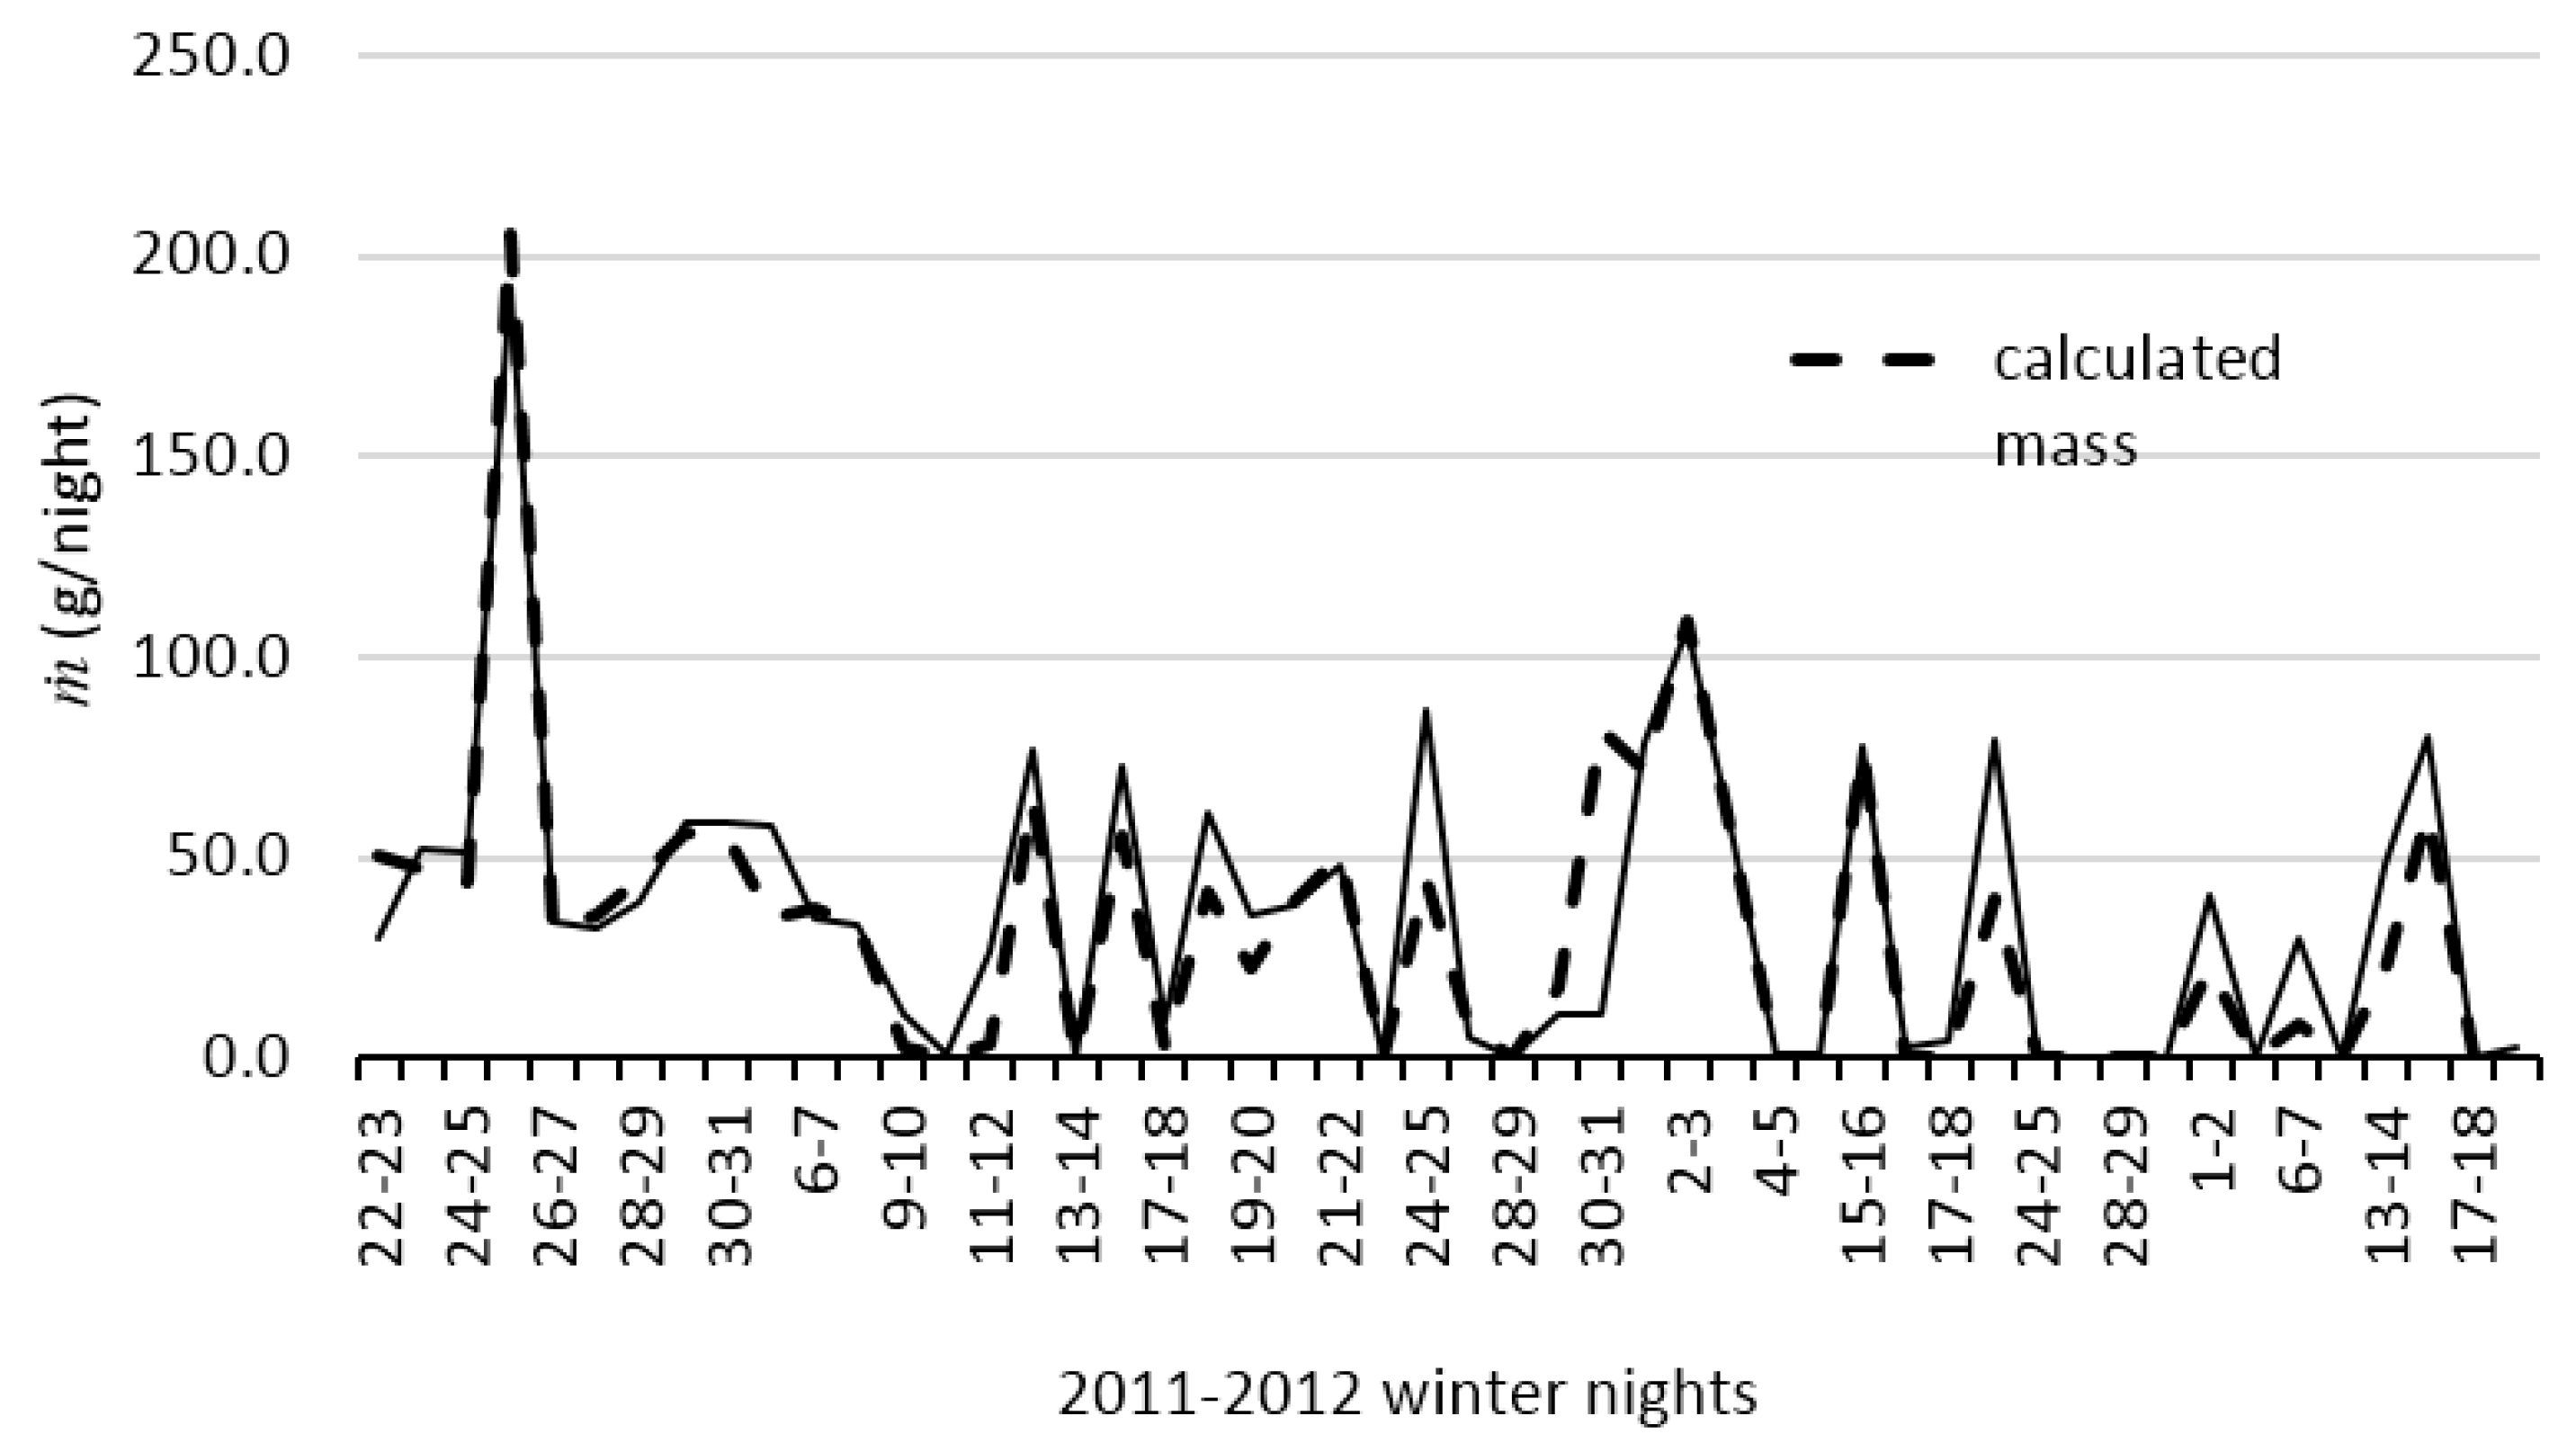
3.2.2. Nightly Prediction of Winter Dew Harvest

Figure 11 shows a comparison between the measured and calculated rates of condensation for only suitable days (low wind velocity, low temperature, high humidly, non-cloudiness, and clear sky). In this case, the RMSE was 16 g/m2 and R2 = 0.90, while for all of the winter nights, the RMSE was 22 g/m2 and R2 = 0.88. Figure 11 shows that the prediction for December was better than in the other months. Therefore, the model provides better predictions for the weather conditions of clear sky (non-clouds) and relatively low wind velocity as well as for the values of Ta and RH, where the fitted value of hm was 4.076 × 10⁻⁸ kg/m2·s·Pa.
Figure 11. Comparison between the measured and calculated rates of condensation.
Atmosphere 07 00002 g011

4. Conclusions

The dry winter in México City was favorable to the dew harvest, as it has also been reported in previous studies in other places. During the winter, we obtained approximately 3.0 kg/m2 (33 g/m2 per night on average). January was the month that had the highest yield, 1.3 kg/m2 (42 g/m2 night on average). Therefore, atmospheric dew condensation is feasible in temperate climates that have dry winters, as in Mexico City.
During the winter in México City, it was found that for both RCs the dew harvest had a minimum difference (wpRC = 2977 g/season and gRC = 2888 g/season). The hourly dew condensation shows that during the night, the highest performance was between 2:00 and 8:00 a.m. (local time). The fitted theoretical model has allowed a good calculation of the harvest, with a RMSE = 0.36 g/h and R2 = 0.99. The effect of the wind on the theoretical model was minimal, since the average value was 0.33 m/s with maximum values of 1.5 m/s, and the wind comes into contact with the back of the dew harvest collector.
The requirement of water for human survival is 2 to 5 L/day [8], and it can be fulfilled by placing dew collectors on the roof of a house or building, as many other authors have reported. Therefore, the requirement of glass or white painted aluminum sheets is approximately 62 to 152 m2 for the dew recollection in México City. The dew harvest can provide a partial alternative to the winter water shortage in certain locations with similar climates to Mexico City, as long as pollution is not significant, according Báez et al. [27].

Acknowledgments

This project was developed with funding from DGEST-SEP (Contract DGEST-4275_2011).

Author Contributions

The authors contribute equally to this work.

Conflicts of Interest

The authors declare no conflict of interest.

References

  1. Rosegrant, M.W.; Cai, X.; Cline, S.A. Global Water Outlook to 2025. Averting an Impending Crisis. A 2020 Vision for Food, Agriculture and the Environment Initiative. Available online: www.ifpri.cgiar.org/sites/default/files/pubs/pubs/fpr/fprwater 2025.pdf (accessed on 25 April 2014).
  2. Lekouch, I.; Muselli, M.; Kabbachi, B.; Ouazzani, J.; Melnytchouk-Milimouk, I.; Beysens, D. Dew, fog, and rain as supplementary sources of water in southwestern Morocco. Energy 2011, 36, 2257–2265. [Google Scholar] [CrossRef] [Green Version]
  3. Nikolayev, V.S.; Beysens, D.; Gioda, A.; Milimouk, I.; Katiushin, E.; Morel, J.P. Water recovery from dew. J. Hydrol. 1996, 182, 19–35. [Google Scholar] [CrossRef] [Green Version]
  4. Nilsson, T.; Vargas, W.E.; Niklasson, G.A.; Granqvist, C.G. Condensation of water by radiative cooling. Renew. Energy 1994, 5, 310–317. [Google Scholar] [CrossRef]
  5. Nilsson, T. Initial experiments on dew collection in Sweden and Tanzania. Sol. Energy Mater. Sol. Cells 1996, 40, 23–32. [Google Scholar] [CrossRef]
  6. Alnaser, W.E.; Barakat, A. Use of condensed water vapour from the atmosphere for irrigation in Bahrain. Appl. Energy 2000, 65, 3–18. [Google Scholar] [CrossRef]
  7. Beysens, D.; Milimouk, I.; Nikolayev, V.; Muselli, M.; Marcillat, J. Using radiative cooling to condense atmospheric vapor: A study to improve water yield. J. Hydrol. 2003, 276, 1–11. [Google Scholar] [CrossRef]
  8. Berkowicz, S.M.; Beysens, D.; Milimouk, I.; Heusinkveld, B.G.; Muselli, M.; Wakshal, E.; Jacobs, A.F.G. Urban Dew Collection Under Semi-arid Conditions: Jerusalem. In Proceedings of the Third International Conference on Fog, Fog Collection and Dew, Cape Town, South Africa, 11–15 October 2004.
  9. Gandhidasan, P.; Abualhamayel, H.I. Modeling and testing of a dew collection system. Desalination 2005, 180, 47–51. [Google Scholar] [CrossRef]
  10. Muselli, M.; Beysens, D.; Mileta, M.; Milimouk, I. Dew and rainwater collection in the Dalmatian Coast, Croatia. Atmos. Res. 2009, 92, 455–463. [Google Scholar] [CrossRef]
  11. Beysens, D.; Lekouch, I.; Mileta, M.; Milimouk, I.; Muselli, M. Dew and Rain Water Collection in South Croatia. Int. J. Environ. Sci. Eng. 2009, 1, 64–70. [Google Scholar]
  12. Sharan, G.; Singh, S.; Clus, O.; Milimouk-Melnytchouk, I.; Muselli, M.; Beysens, D. Roofs as dew collectors: III. Special Polyethylene foil on a school in Sayara (NW India). In Proceedings of the Fourth International Conference on Fog, Fog Collection and Dew, La Serena, Chile, 23–27 July 2007.
  13. Jacobs, A.F.G.; Heusinkveld, B.G.; Berkowicz, S.M. Passive dew collection in a grassland area, The Netherlands. Atmos. Res. 2008, 87, 377–385. [Google Scholar] [CrossRef]
  14. Mileta, M.; Beysens, D.; Nikolayev, V.; Milimouk, I.; Clus, O.; Muselli, M. Fog and Dew Collection Projects in Croatia. In Proceedings of the International Conference on “Water Observation and Information System for Decision Support” (BALWOIS 2006), Ohrid, Macedonia, 23–26 May 2006.
  15. Sharan, G.; Beysens, D.; Milimouk-Melnytchouk, I. A study of dew water yields on Galvanized iron roofs in Kothara (North-West India). J. Arid Environ. 2007, 69, 259–269. [Google Scholar] [CrossRef]
  16. Maestre-Valero, J.F.; Martinez-Alvarez, V.; Baille, A.; Martín-Górriz, B.; Gallego-Elvira, B. Comparative analysis of two polyethylene foil materials for dew harvesting in a semi-arid climate. J. Hydrol. 2011, 410, 84–91. [Google Scholar] [CrossRef]
  17. Vuollekoski, H.; Vogt, M.; Sinclair, V.A.; Duplissy, J.; Järvinen, H.; Kyrö, E.M.; Makkonen, R.; Petäjä, T.; Prisle, N.L.; Räisänen, P.; et al. Estimates of global dew collection potential on artificial surfaces. Hydrol. Earth Syst. Sci. 2015, 19, 601–613. [Google Scholar] [CrossRef] [Green Version]
  18. Maestre-Valero, J.F.; Ragab, R.; Martínez-Alvarez, V.; Baille, A. Estimation of dew yield from radiative condensers by means of an energy balance model. J. Hydrol. 2012, 460–461, 103–109. [Google Scholar] [CrossRef]
  19. Beysens, D. Estimating dew yield worldwide from a few meteo data. Atmos. Res. 2016, 167, 146–155. [Google Scholar] [CrossRef]
  20. CONEVYT. Secretaría de Educación Pública, México. Clasificación y distribución de los climas en México. Available online: http://www.conevyt.org.mx/cursos/cursos/cnaturales_v2/interface/main/recursos/antología/cnant_4_13.htm (accessed on 24 April 2013).
  21. Berel Painting Datasheet. Available online: http://www.berel.com.mx/mobile/hojasseguridad/BA100acryl.pdf (accessed on 12 January 2012).
  22. Weather Underground. Climas Históricos de la Ciudad de México MMMX. Available online: www.wunderground.com/personal-weather-station/dashboard?ID=IDFMEXIC8#history/tdata/s20111223/e20120321/mcustom (accessed 24 April 2013).
  23. Beysens, D.; Muselli, M.; Nikolayev, V.; Narhe, R.; Milimouk, I. Measurement and modelling of dew in island, coastal and alpine areas. Atmos. Res. 2005, 73, 1–22. [Google Scholar] [CrossRef] [Green Version]
  24. Tang, R.; Etzion, Y.; Meir, I.A. Estimates of clear night sky emissivity in the Negev Highlands, Israel. Energy Convers. Manag. 2004, 45, 1831–1843. [Google Scholar] [CrossRef]
  25. Lawrence, M.G. The relationship between relative humidity and the dew point temperature in moist air: A simple conversion and applications. Bull. Am. Meteor. Soc. 2005, 86, 225–233. [Google Scholar] [CrossRef]
  26. Rakovec, J.; Zaksek, K. On the proper analytical expression for the sky-view factor and the diffuse irradiation of a slope for an isotropic sky. Renew. Energy 2012, 37, 440–444. [Google Scholar] [CrossRef]
  27. Báez, A.; Belmont, R.; García, R.; Padilla, H.; Torres, M.C. Chemical composition of rainwater collected at a southwest site of Mexico City, Mexico. Atmos. Res. 2007, 86, 61–75. [Google Scholar] [CrossRef]

