
Frequency and Character of Extreme Aerosol Events in the Southwestern United States: A Case Study Analysis in Arizona


Abstract
:
1. Introduction
2. Experimental Methods
2.1. EPA IMPROVE

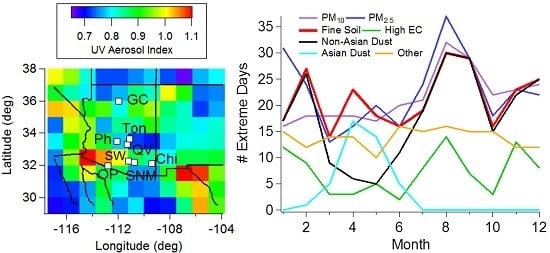
| Site Name | Latitude (°) | Longitude (°) | Altitude (m) | Date Range |
|---|---|---|---|---|
| Chiricahua (Chi) | 32.0994 | −109.389 | 1554 | January 2001–August 2014 |
| Grand Canyon (GC) | 35.9731 | −111.9841 | 2267 | January 2001–August 2014 |
| Organ Pipe (OP) | 31.9506 | −112.8016 | 504 | December 2002–August 2014 |
| Phoenix (Ph) | 33.5038 | −112.096 | 342 | April 2001–August 2014 |
| Queen Valley (QV) | 33.2939 | −111.2858 | 661 | April 2001–August 2014 |
| Saguaro NM (SNM) | 32.1746 | −110.737 | 941 | April 2001–August 2014 |
| Saguaro West (SW) | 32.2486 | −111.2178 | 714 | October 2001–August 2014 |
| Tonto (Ton) | 33.6548 | −111.1068 | 775 | January 2001–August 2014 |
2.2. NAAPS Aerosol Model
2.3. Satellite Data
2.4. Criteria for Events
3. Results and Discussion
3.1. Frequency and Categorization of Events
| Site Name | Total Days Data Available | Extreme Event Types | |||||||
|---|---|---|---|---|---|---|---|---|---|
| Total | PM10 | PM2.5 | Fine Soil | High EC | Non-Asian Dust | Asian Dust | Other | ||
| Chiricahua * | 1664 | 89 | 61 | 56 | 54 | 14 | 41 | 10 | 23 |
| Grand Canyon | 1664 | 120 | 82 | 64 | 69 | 30 | 49 | 20 | 25 |
| Organ Pipe | 1431 | 76 | 45 | 55 | 54 | 7 | 41 | 13 | 17 |
| Phoenix ** | 1628 | 98 | 54 | 58 | 63 | 9 | 50 | 10 | 30 |
| Queen Valley *** | 1628 | 98 | 65 | 60 | 60 | 9 | 43 | 15 | 30 |
| Saguaro NM *** | 1628 | 85 | 49 | 56 | 56 | 8 | 40 | 14 | 23 |
| Saguaro West **** | 1563 | 91 | 56 | 55 | 55 | 10 | 44 | 10 | 30 |
| Tonto *** | 1664 | 103 | 67 | 65 | 67 | 12 | 47 | 18 | 25 |
| Site Name | PM10 | PM2.5 | Fine Soil | High EC | Non-Asian Dust | Asian Dust | Other | ||||||||||||||
|---|---|---|---|---|---|---|---|---|---|---|---|---|---|---|---|---|---|---|---|---|---|
| 1 | 2–4 | 5–8 | 1 | 2–4 | 5–8 | 1 | 2–4 | 5–8 | 1 | 2–4 | 5–8 | 1 | 2–4 | 5–8 | 1 | 2–4 | 5–8 | 1 | 2–4 | 5–8 | |
| Chiricahua | 0.38 | 0.34 | 0.28 | 0.39 | 0.38 | 0.23 | 0.43 | 0.33 | 0.24 | 0.79 | 0.21 | 0.00 | 0.30 | 0.40 | 0.30 | 0.49 | 0.34 | 0.17 | 0.74 | 0.26 | 0.00 |
| Grand Canyon | 0.65 | 0.24 | 0.11 | 0.64 | 0.33 | 0.03 | 0.51 | 0.33 | 0.16 | 1.00 | 0.00 | 0.00 | 0.50 | 0.20 | 0.30 | 0.51 | 0.39 | 0.10 | 0.84 | 0.12 | 0.04 |
| Organ Pipe | 0.31 | 0.40 | 0.29 | 0.44 | 0.36 | 0.20 | 0.37 | 0.30 | 0.33 | 0.71 | 0.29 | 0.00 | 0.08 | 0.38 | 0.54 | 0.46 | 0.27 | 0.27 | 0.71 | 0.29 | 0.00 |
| Phoenix | 0.39 | 0.37 | 0.24 | 0.47 | 0.34 | 0.19 | 0.41 | 0.40 | 0.19 | 0.89 | 0.11 | 0.00 | 0.00 | 0.60 | 0.40 | 0.48 | 0.38 | 0.14 | 0.83 | 0.17 | 0.00 |
| Queen Valley | 0.25 | 0.45 | 0.31 | 0.27 | 0.47 | 0.27 | 0.22 | 0.40 | 0.38 | 0.56 | 0.44 | 0.00 | 0.00 | 0.47 | 0.53 | 0.30 | 0.40 | 0.30 | 0.57 | 0.40 | 0.03 |
| Saguaro NM | 0.20 | 0.45 | 0.35 | 0.27 | 0.50 | 0.23 | 0.27 | 0.36 | 0.38 | 0.75 | 0.25 | 0.00 | 0.21 | 0.21 | 0.57 | 0.30 | 0.43 | 0.28 | 0.74 | 0.22 | 0.04 |
| Saguaro West | 0.25 | 0.43 | 0.32 | 0.35 | 0.36 | 0.29 | 0.38 | 0.36 | 0.25 | 0.50 | 0.50 | 0.00 | 0.10 | 0.40 | 0.50 | 0.45 | 0.36 | 0.18 | 0.60 | 0.37 | 0.03 |
| Tonto | 0.18 | 0.51 | 0.31 | 0.20 | 0.57 | 0.23 | 0.13 | 0.55 | 0.31 | 0.75 | 0.25 | 0.00 | 0.11 | 0.44 | 0.44 | 0.15 | 0.62 | 0.23 | 0.60 | 0.36 | 0.04 |
| Site Name | PM10:PM2.5 | Fe:Ca | ||||
|---|---|---|---|---|---|---|
| Non-Asian Dust | Asian Dust | Other and CM | Non-Asian Dust | Asian Dust | Other and CM | |
| Chiricahua | 0.32 ± 0.17 | 0.30 ± 0.10 | 0.19 ± 0.08 | 0.82 ± 0.35 | 0.88 ± 0.24 | 0.95 ± 0.30 |
| Grand Canyon | 0.38 ± 0.11 | 0.43 ± 0.11 | 0.34 ± 0.06 | 0.83 ± 0.27 | 0.79 ± 0.21 | 0.92 ± 0.19 |
| Organ Pipe | 0.27 ± 0.10 | 0.39 ± 0.08 | 0.20 ± 0.09 | 0.98 ± 0.35 | 0.81 ± 0.16 | 0.96 ± 0.43 |
| Phoenix | 0.35 ± 0.16 | 0.30 ± 0.08 | 0.20 ± 0.07 | 1.27 ± 0.28 | 1.02 ± 0.25 | 1.22 ± 0.26 |
| Queen Valley | 0.27 ± 0.17 | 0.30 ± 0.10 | 0.18 ± 0.05 | 1.04 ± 0.35 | 0.84 ± 0.13 | 1.09 ± 0.40 |
| Saguaro NM | 0.57 ± 0.36 | 0.39 ± 0.13 | 0.27 ± 0.04 | 0.79 ± 0.28 | 0.80 ± 0.15 | 0.89 ± 0.24 |
| Saguaro West | 0.46 ± 0.26 | 0.31 ± 0.12 | 0.21 ± 0.06 | 0.95 ± 0.48 | 1.04 ± 0.38 | 1.02 ± 0.44 |
| Tonto | 0.35 ± 0.19 | 0.38 ± 0.14 | 0.23 ± 0.08 | 1.00 ± 0.31 | 0.86 ± 0.15 | 1.16 ± 0.38 |
3.2. “Other” Events
| Species | Chiricahua (N = 23) | Grand Canyon (N = 25) | Organ Pipe (N = 17) | Phoenix (N = 30) | Queen Valley (N = 30) | Saguaro NM (N = 23) | Tonto (N = 25) |
|---|---|---|---|---|---|---|---|
| PM10 | 0.78 | 0.84 | 0.47 | 0.70 | 0.63 | 0.65 | 0.73 |
| PM2.5 | 0.30 | 0.52 | 0.76 | 0.50 | 0.43 | 0.43 | 0.30 |
| CM | 0.74 | 0.48 | 0.41 | 0.47 | 0.63 | 0.57 | 0.73 |
| K | 0.09 | 0.24 | 0.12 | 0.17 | 0.10 | 0.09 | 0.03 |
| OC | 0.04 | 0.04 | 0.12 | 0.23 | 0.13 | 0.00 | 0.07 |
| NO3− | 0.13 | 0.20 | 0.18 | 0.17 | 0.10 | 0.17 | 0.10 |
| SO42− | 0.17 | 0.08 | 0.35 | 0.07 | 0.20 | 0.26 | 0.13 |
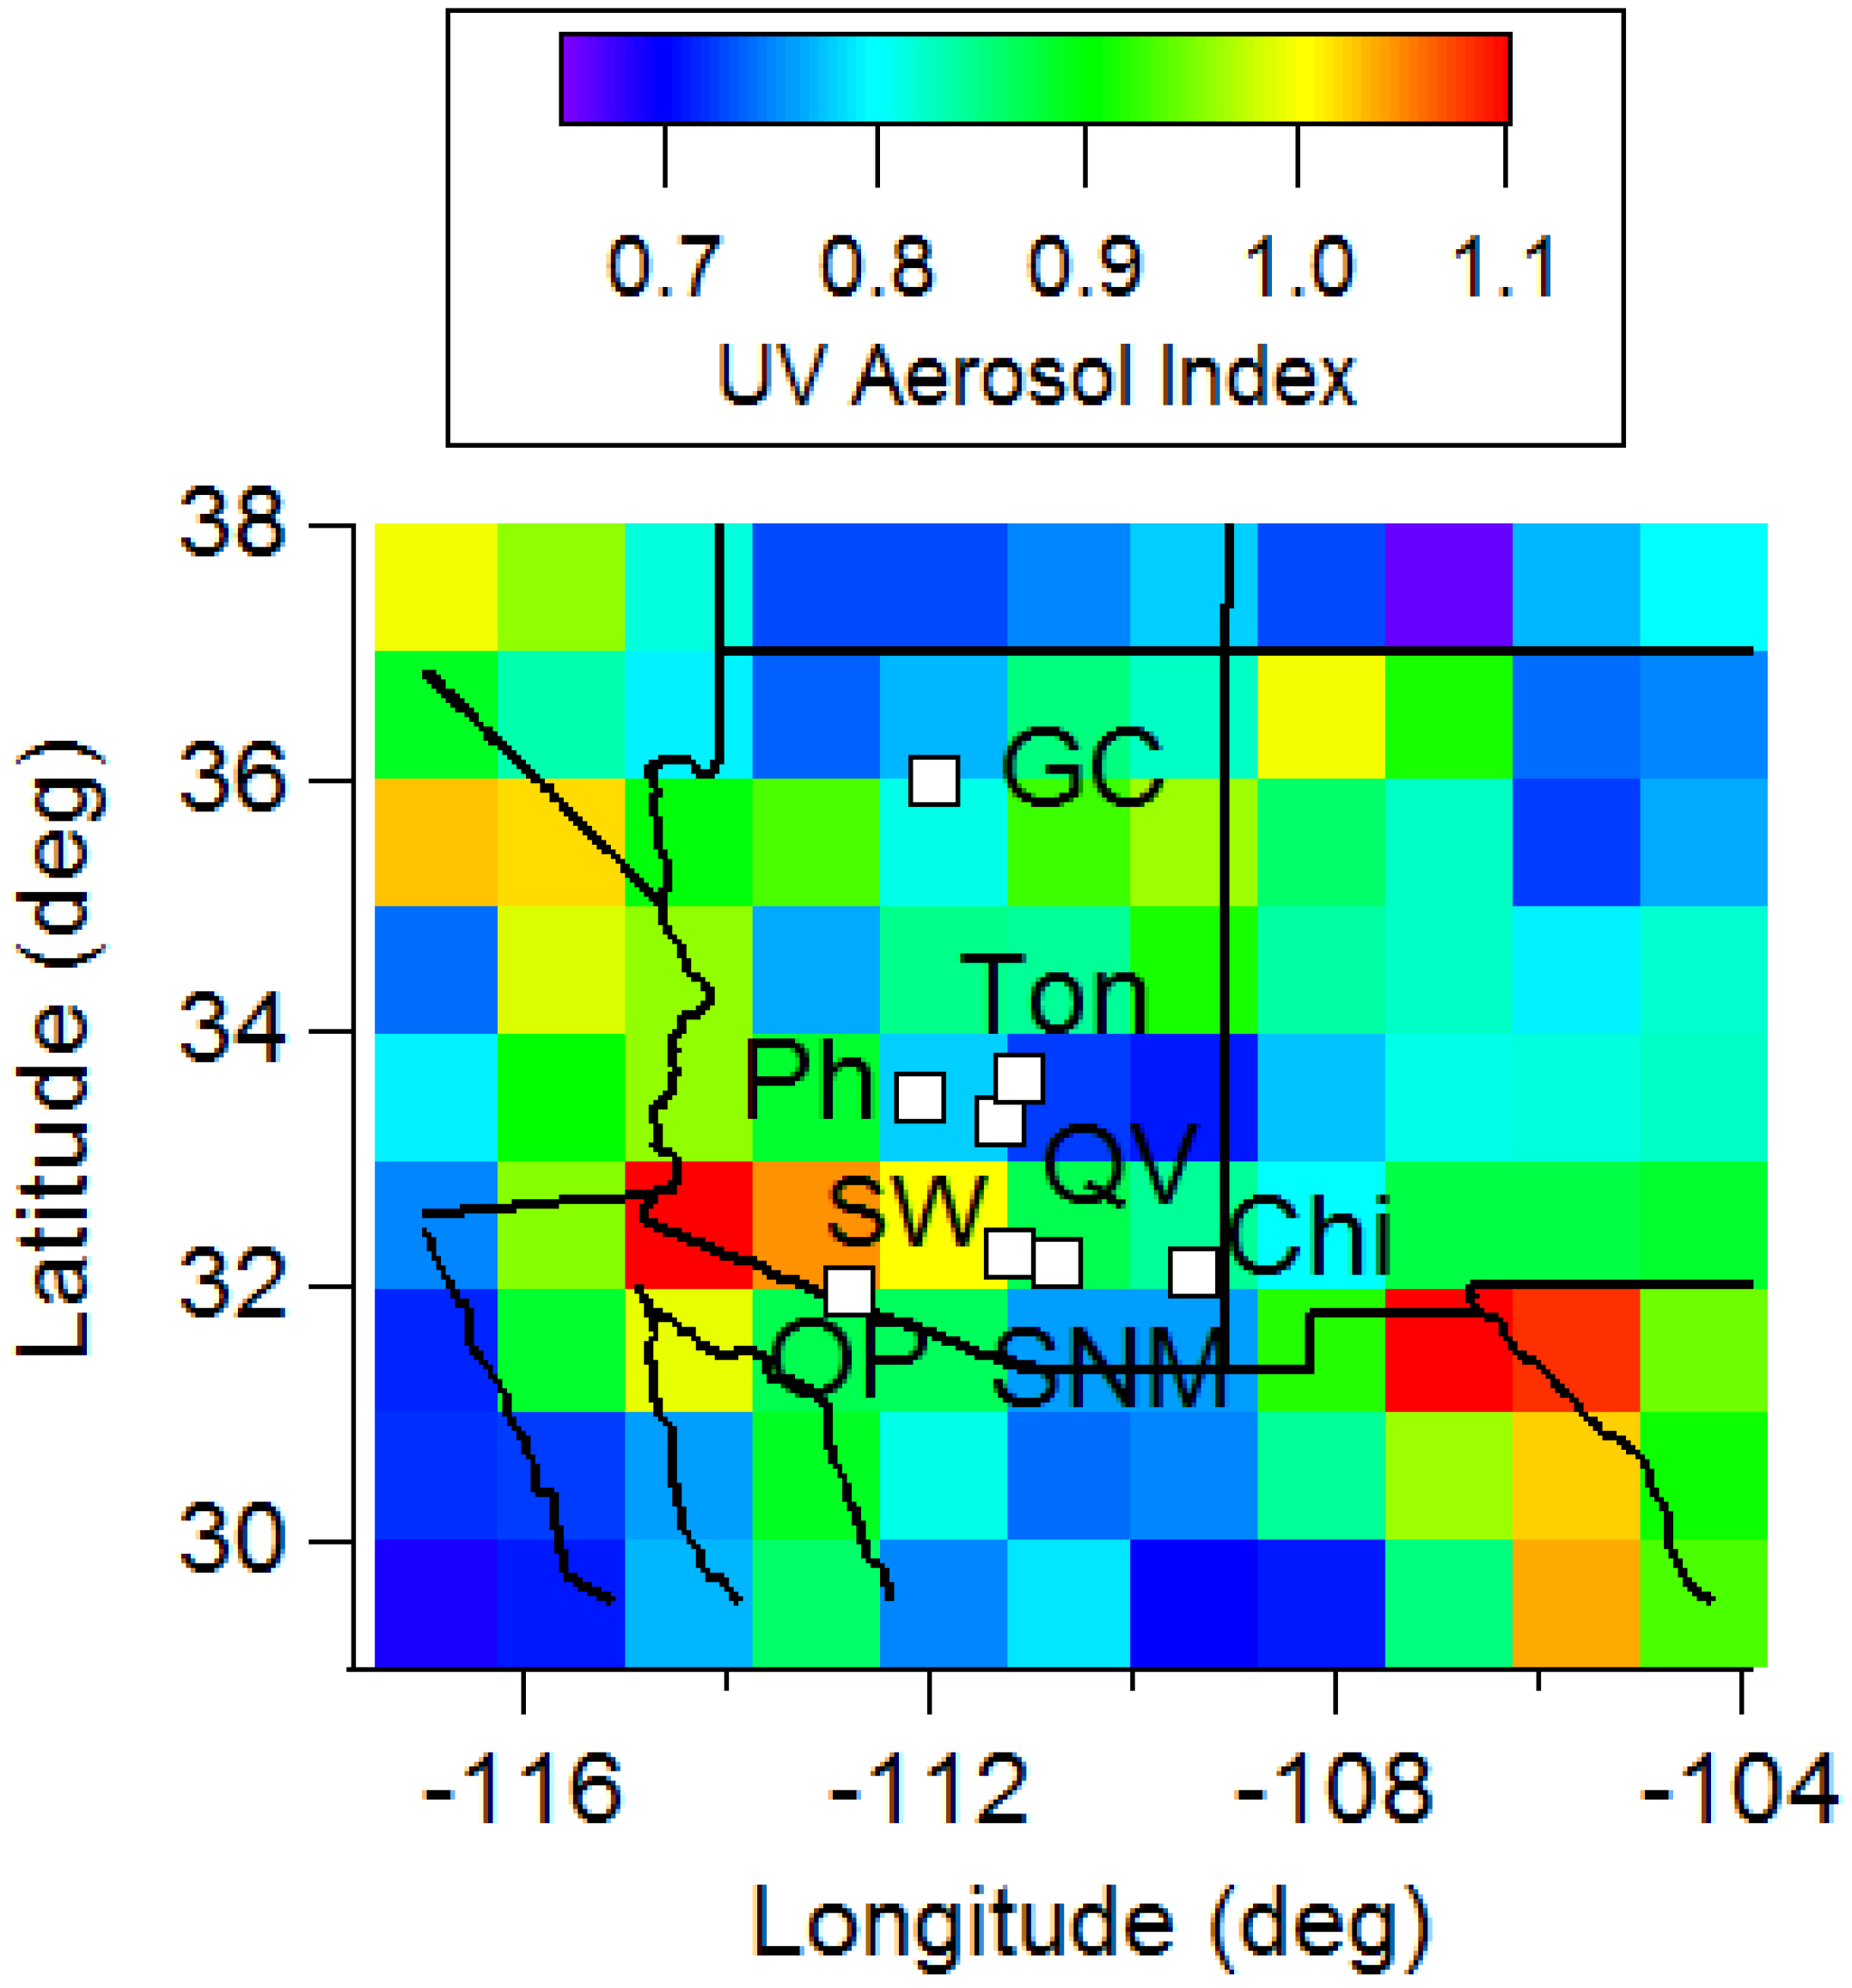
3.3. Temporal Nature of Events

| -- | Total | PM10 | PM2.5 | Fine Soil | High EC | Non-Asian Dust | Asian Dust | Other |
|---|---|---|---|---|---|---|---|---|
| Weekend (Saturday–Sunday) | 57 (28.5) | 65 (32.5) | 60 (30) | 21 (10.5) | 52 (26) | 9 (4.5) | 44 (22) | 57 (28.5) |
| Weekday (Monday–Friday) | 201 (40.2) | 208 (41.6) | 197 (39.4) | 66 (13.2) | 162 (32.4) | 33 (6.6) | 122 (24.4) | 201 (40.2) |
| Day With Most Events | W (53) | Th (55) | W/Th (50/50) | Th (19) | Th (42) | W (11) | W (35) | W (53) |
| Day with Least Events | Tu (23) | Tu (25) | Tu (21) | M/F (11) | Tu (19) | Tu (1) | Tu (11) | Tu (23) |
4. Conclusions
- (i)
- Between 5% and 7% of the total days (i.e., 1431–1664 depending on site) examined at the various sites exhibited an extreme aerosol event due to either extreme levels of PM10, PM2.5, and/or fine soil. Grand Canyon exhibited the most extreme event days (120, i.e., 7% of its total days), which is coincident with it being one of the most recognized tourism spots in the Southwest. Relative to the total number of extreme days, Grand Canyon exhibited the highest percentage in the High EC category (47% versus 13%–25% for other sites). “Other” events accounted for between 2% and 33% of the total extreme days, with most of these being associated with extreme PM10 levels (i.e., locally-generated dust). Of the total number of days with extreme fine soil (54–69 days depending on the site), the number of these events being linked to Asian dust, based on NAAPS analysis, ranged from 19% to 29% (i.e., 10–20 days). The analysis highlighted the complexity of using NAAPS and various mass concentration ratios to distinguish between transported and local dust owing to likely mixing effects, especially in urban-impacted areas, such as Tucson and Phoenix.
- (ii)
- Fine soil is the pollutant type that most frequently impacted multiple sites simultaneously on the same day at an extreme level. Five or more sites reached extreme fine soil levels on the same day for 16%–38% of all possible fine soil extreme events depending on the site. Within the fine soil category, Asian dust events impacted five or more sites between 30% and 57% of the time when they occurred. The pollutant categories with the least number of extreme events impacting five or more sites on the same day were High EC (0 days for all sites) and Other (0–1 day depending on site) due to locally generated emissions that were not regional in nature. Grand Canyon exhibited the highest number of days where an extreme event only impacted that site since it is farther removed from the other seven sites that are clustered closer in Southern Arizona.
- (iii)
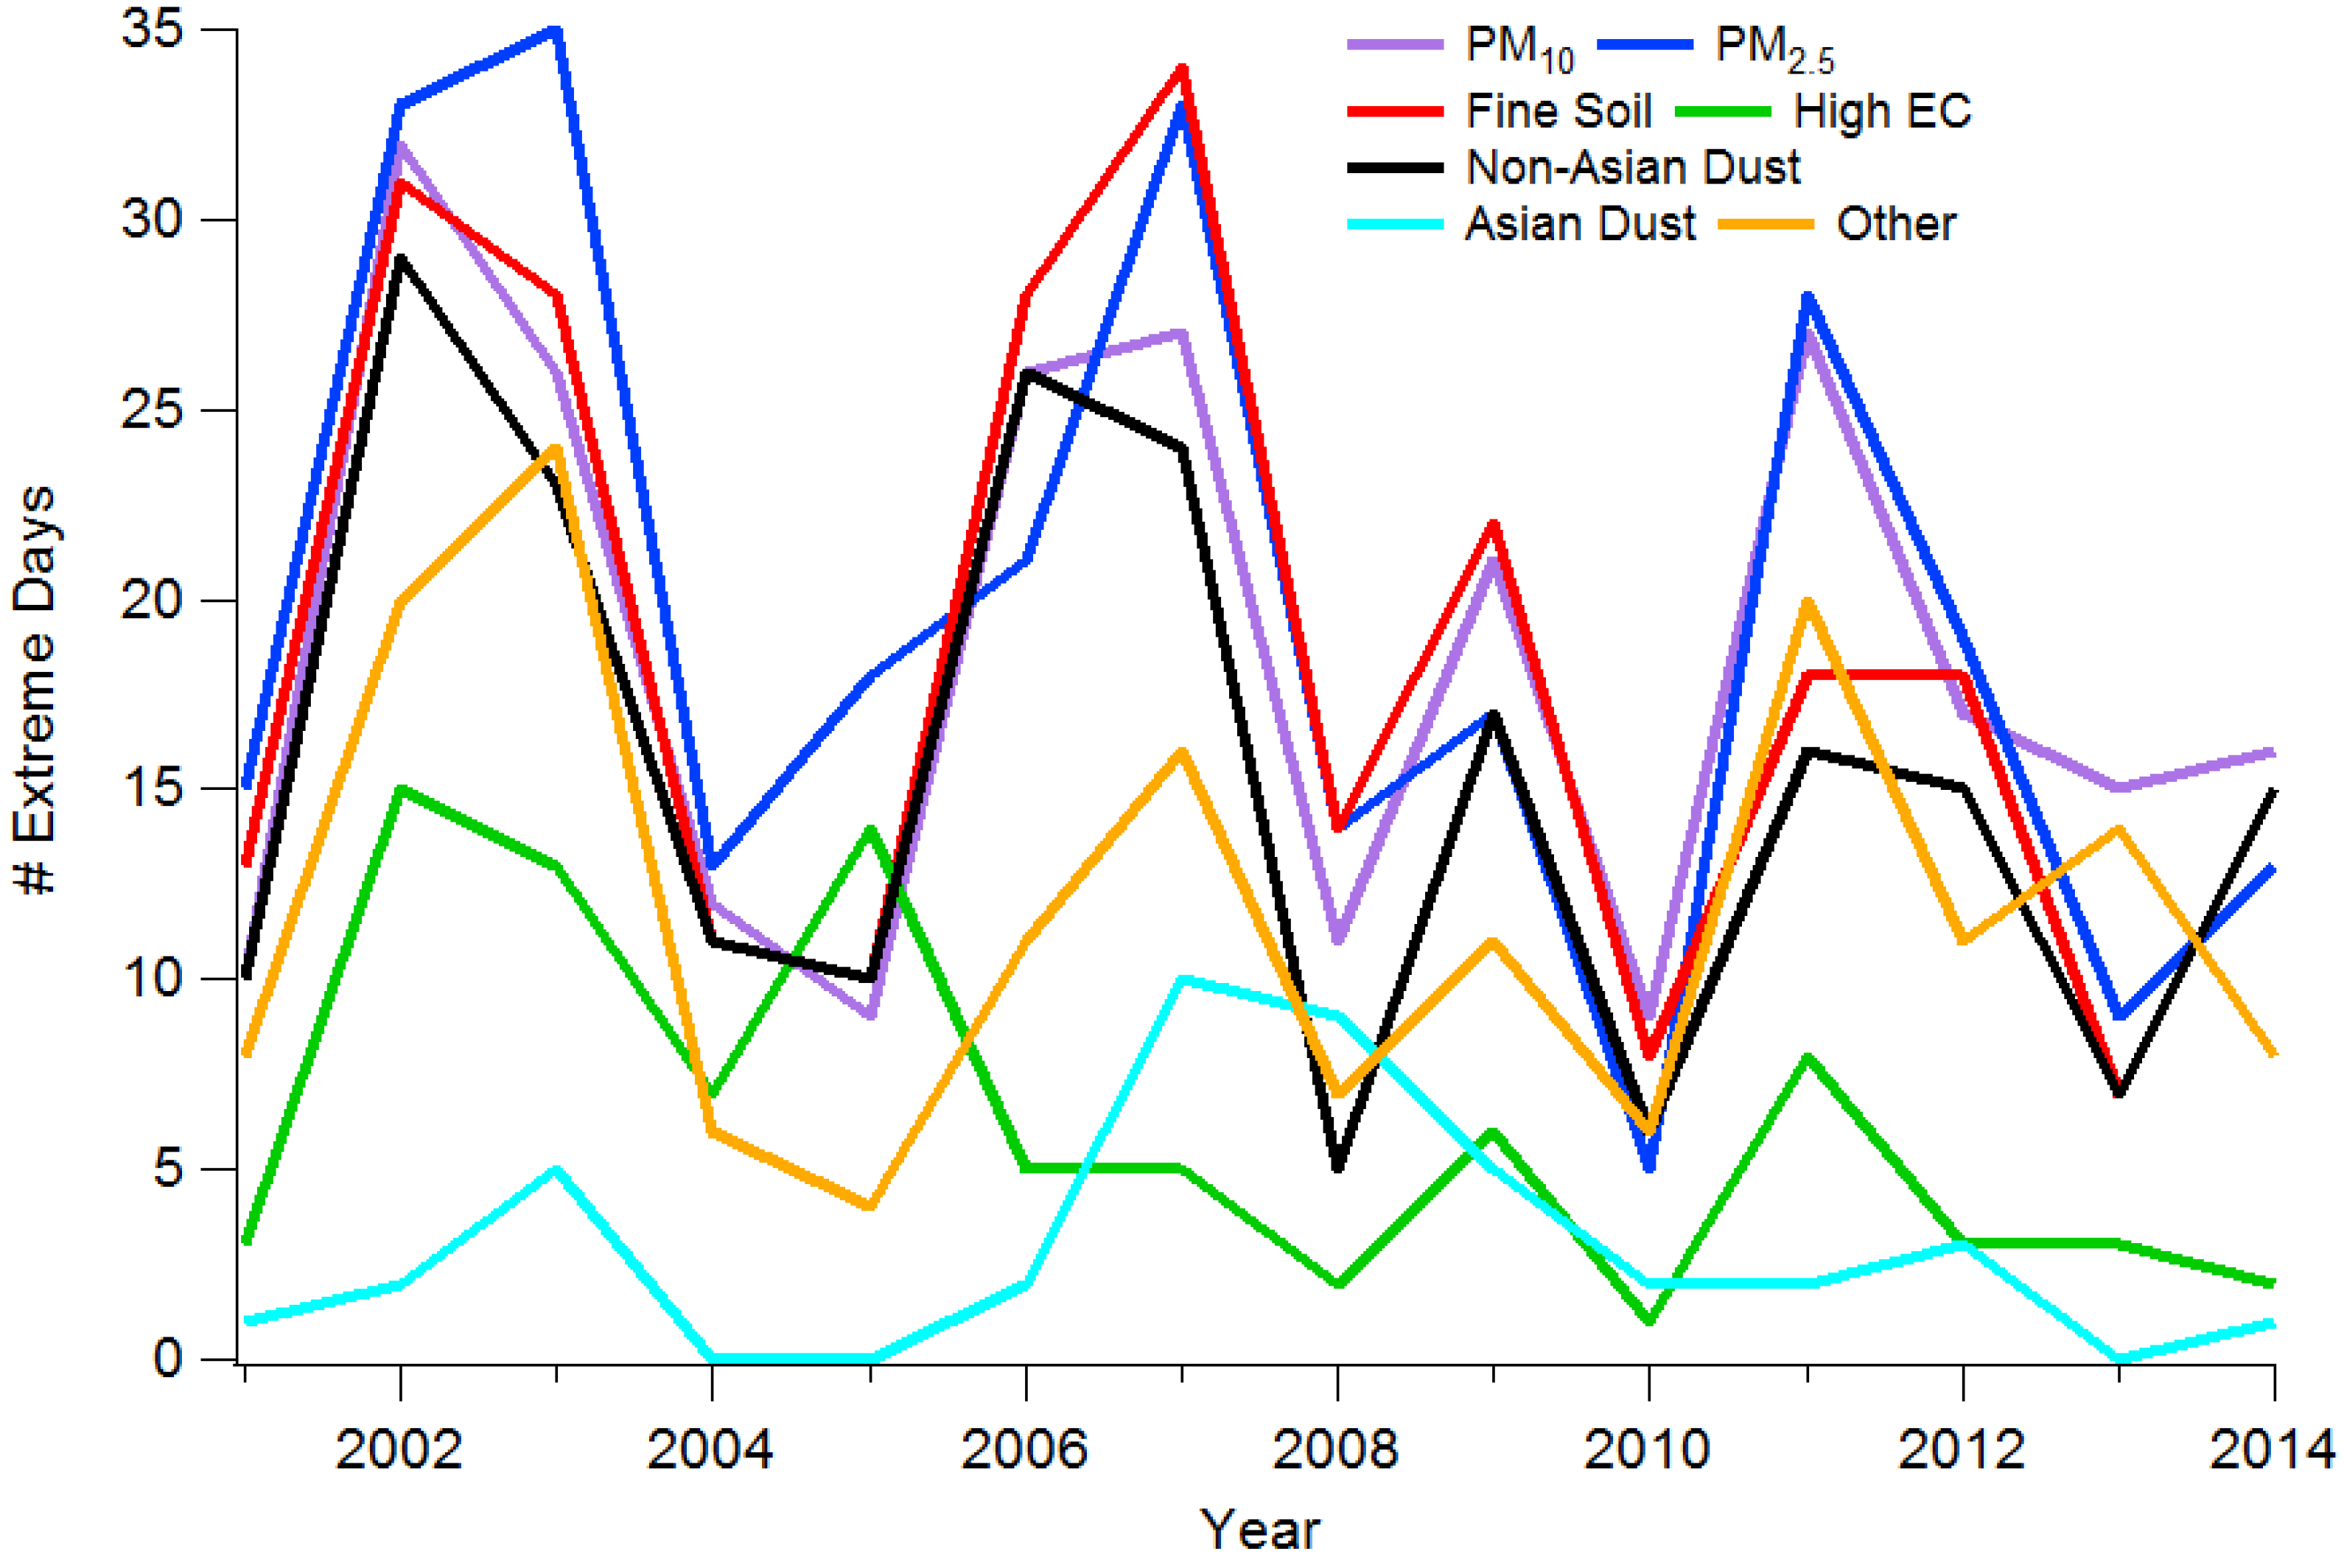
- Most pollutant categories (PM10, PM2.5, fine soil, non-Asian dust, High EC, Other) exhibited the highest number of extreme events in August. The Asian dust category was unique in its monthly pattern with its events occurring in the spring months of March–June (41 out of 42 days, i.e., 98%) with only one event in February. Unlike the other pollutant categories, High EC was the only one to show a statistically significant change in frequency of occurrence between 2003 and 2013. While extreme events were most frequent for the various pollutant categories on either Wednesday or Thursday, there was no statistically significant difference in the number of events on any particular day or on weekend days versus weekdays.
Supplementary Materials
- Table S1:
- Summary of criteria concentrations for PM10, PM2.5, fine soil, and elemental carbon (EC) as a function of month for eight EPA IMPROVE sites in Arizona.
- Figure S1:
- Case examples demonstrating how NAAPS was used as a tool to identify which extreme fine soil events qualified as Asian dust events. The examples below are for extreme fine soil events occurring on 15 May 2003, 12 April 2007, and 5 June 2008, which qualified as extreme events at four, six, and five sites, respectively.
Acknowledgments
Author Contributions
Conflicts of Interest
References
- Dockery, D.W.; Pope, C.A.; Xu, X.P.; Spengler, J.D.; Ware, J.H.; Fay, M.E.; Ferris, B.G.; Speizer, F.E. An Association between Air-Pollution and Mortality in 6 United-States Cities. New Engl. J. Med. 1993, 329, 1753–1759. [Google Scholar] [CrossRef] [PubMed]
- Pope, C.A.; Ezzati, M.; Dockery, D.W. Fine-particulate air pollution and life expectancy in the United States. New Engl. J. Med. 2009, 360, 376–386. [Google Scholar] [CrossRef] [PubMed]
- Porter, W.C.; Heald, C.L.; Cooley, D.; Russell, B. Investigating the observed sensitivities of air-quality extremes to meteorological drivers via quantile regression. Atmos. Chem. Phys. 2015, 15, 10349–10366. [Google Scholar] [CrossRef]
- Crosbie, E.; Sorooshian, A.; Monfared, N.A.; Shingler, T.; Esmaili, O. A multi-year aerosol characterization for the greater Tehran area using satellite, surface, and modeling data. Atmosphere 2014, 5, 178–197. [Google Scholar] [CrossRef] [PubMed]
- Sutton, L.J. Haboobs. Q. J. Roy. Meteor. Soc. 1925, 51, 25–30. [Google Scholar] [CrossRef]
- Miller, S.D.; Kuciauskas, A.P.; Liu, M.; Ji, Q.; Reid, J.S.; Breed, D.W.; Walker, A.L.; Al Mandoos, A. Haboob dust storms of the southern Arabian Peninsula. J. Geophys. Res. 2008, 113. [Google Scholar] [CrossRef]
- Raman, A.; Arellano, A.F.; Brost, J.J. Revisiting haboobs in the southwestern United States: An observational case study of the 5 July 2011 Phoenix dust storm. Atmos. Environ. 2014, 89, 179–188. [Google Scholar] [CrossRef]
- Seager, R.; Ting, M.F.; Held, I.; Kushnir, Y.; Lu, J.; Vecchi, G.; Huang, H.P.; Harnik, N.; Leetmaa, A.; Lau, N.C.; et al. Model projections of an imminent transition to a more arid climate in southwestern North America. Science 2007, 316, 1181–1184. [Google Scholar] [CrossRef] [PubMed]
- Neff, J.C.; Ballantyne, A.P.; Farmer, G.L.; Mahowald, N.M.; Conroy, J.L.; Landry, C.C.; Overpeck, J.T.; Painter, T.H.; Lawrence, C.R.; Reynolds, R.L. Increasing eolian dust deposition in the western United States linked to human activity. Nat. Geosci. 2008, 1, 189–195. [Google Scholar] [CrossRef]
- Field, J.P.; Belnap, J.; Breshears, D.D.; Neff, J.C.; Okin, G.S.; Whicker, J.J.; Painter, T.H.; Ravi, S.; Reheis, M.C.; Reynolds, R.L. The ecology of dust. Front. Ecol. Environ. 2010, 8, 423–430. [Google Scholar] [CrossRef]
- Dennison, P.E.; Brewer, S.C.; Arnold, J.D.; Moritz, M.A. Large wildfire trends in the western United States, 1984–2011. Geophys. Res. Lett. 2014, 41, 2928–2933. [Google Scholar] [CrossRef]
- Stavros, E.N.; Abatzoglou, J.T.; McKenzie, D.; Larkin, N.K. Regional projections of the likelihood of very large wildland fires under a changing climate in the contiguous Western United States. Clim. Chang. 2014, 126, 455–468. [Google Scholar] [CrossRef]
- Painter, T.H.; Barrett, A.P.; Landry, C.C.; Neff, J.C.; Cassidy, M.P.; Lawrence, C.R.; McBride, K.E.; Farmer, G.L. Impact of disturbed desert soils on duration of mountain snow cover. Geophys. Res. Lett. 2007, 34. [Google Scholar] [CrossRef]
- Husar, R.B.; Tratt, D.M.; Schichtel, B.A.; Falke, S.R.; Li, F.; Jaffe, D.; Gasso, S.; Gill, T.; Laulainen, N.S.; Lu, F.; et al. Asian dust events of April 1998. J. Geophys. Res. 2001, 106, 18317–18330. [Google Scholar] [CrossRef]
- Tratt, D.M.; Frouin, R.J.; Westphal, D.L. April 1998 Asian dust event: A southern California perspective. J. Geophys. Res. 2001, 106, 18371–18379. [Google Scholar] [CrossRef]
- VanCuren, R.A.; Cahill, T.A. Asian aerosols in North America: Frequency and concentration of fine dust. J. Geophys. Res. 2002, 107. [Google Scholar] [CrossRef]
- Jaffe, D.; Snow, J.; Cooper, O. The 2001 Asian Dust Events: Transport and impact on surface aerosol concentrations in the U.S. EOS 2003, 84, 501–516. [Google Scholar] [CrossRef]
- Wells, K.C.; Witek, M.; Flatau, P.; Kreidenweis, S.M.; Westphal, D.L. An analysis of seasonal surface dust aerosol concentrations in the western US (2001–2004): Observations and model predictions. Atmos. Environ. 2007, 41, 6585–6597. [Google Scholar] [CrossRef]
- Kavouras, I.G.; Etyemezian, V.; DuBois, D.W.; Xu, J.; Pitchford, M. Source reconciliation of atmospheric dust causing visibility impairment in Class I areas of the western United States. J. Geophys. Res. 2009, 114. [Google Scholar] [CrossRef]
- Creamean, J.M.; Spackman, J.R.; Davis, S.M.; White, A.B. Climatology of long-range transported Asian dust along the West Coast of the United States. J. Geophys. Res. 2014, 119, 12171–12185. [Google Scholar] [CrossRef]
- Westerling, A.L.; Hidalgo, H.G.; Cayan, D.R.; Swetnam, T.W. Warming and earlier spring increase western US forest wildfire activity. Science 2006, 313, 940–943. [Google Scholar] [CrossRef] [PubMed]
- Kavouras, I.G.; Nikolich, G.; Etyemezian, V.; DuBois, D.W.; King, J.; Shafer, D. In situ observations of soil minerals and organic matter in the early phases of prescribed fires. J. Geophys. Res. 2012, 117. [Google Scholar] [CrossRef]
- Popovicheva, O.; Kistler, M.; Kireeva, E.; Persiantseva, N.; Timofeev, M.; Kopeikin, V.; Kasper-Giebl, A. Physicochemical characterization of smoke aerosol during large-scale wildfires: Extreme event of August 2010 in Moscow. Atmos. Environ. 2014, 96, 405–414. [Google Scholar] [CrossRef]
- Maudlin, L.C.; Wang, Z.; Jonsson, H.H.; Sorooshian, A. Impact of wildfires on size-resolved aerosol composition at a coastal California site. Atmos. Environ. 2015, 119, 59–68. [Google Scholar] [CrossRef]
- Malm, W.C.; Sisler, J.F.; Huffman, D.; Eldred, R.A.; Cahill, T.A. Spatial and Seasonal Trends in Particle Concentration and Optical Extinction in the United-States. J. Geophys. Res. 1994, 99, 1347–1370. [Google Scholar] [CrossRef]
- IMPROVE Particulate Monitoring Network Standard Operating Procedures. Available online: http://vista.cira.colostate.edu/improve/Publications/SOPs/UCDavis_SOPs/IMPROVE_SOPs.htm (accessed on 19 December 2015).
- Hogan, T.F.; Rosmond, T.E. The description of the navy operational global atmospheric prediction systems spectral forecast model. Mon. Weather Rev. 1991, 119, 1786–1815. [Google Scholar] [CrossRef]
- Hogan, T.F.; Brody, L.R. Sensitivity studies of the Navy’s global forecast model parameterizations and evaluation of improvements to NOGAPS. Mon. Wea. Rev. 1993, 121, 2373–2395. [Google Scholar] [CrossRef]
- Witek, M.L.; Flatau, P.J.; Quinn, P.K.; Westphal, D.L. Global sea-salt modeling: Results and validation against multicampaign shipboard measurements. J. Geophys. Res. 2007, 112. [Google Scholar] [CrossRef]
- McKendry, I.G.; Strawbridge, K.B.; O’Neill, N.T.; Macdonald, A.M.; Liu, P.S.K.; Leaitch, W.R.; Anlauf, K.G.; Jaegle, L.; Fairlie, T.D.; Westphal, D.L. Trans-Pacific transport of Saharan dust to western North America: A case study. J. Geophys. Res. 2007, 112. [Google Scholar] [CrossRef]
- Cottle, P.; Strawbridge, K.; McKendry, I.; O’Neill, N.; Saha, A. A pervasive and persistent Asian dust event over North America during spring 2010: Lidar and sunphotometer observations. Atmos. Chem. Phys. 2013, 13, 4515–4527. [Google Scholar] [CrossRef]
- Wu, Y.H.; Han, Z.; Nazmi, C.; Gross, B.; Moshary, F. A trans-Pacific Asian dust episode and its impacts to air quality in the east coast of US. Atmos. Environ. 2015, 106, 358–368. [Google Scholar] [CrossRef]
- Zhang, J.L.; Reid, J.S.; Westphal, D.L.; Baker, N.L.; Hyer, E.J. A system for operational aerosol optical depth data assimilation over global oceans. J. Geophys. Res. 2008, 113. [Google Scholar] [CrossRef]
- Hsu, N.C.; Herman, J.R.; Torres, O.; Holben, B.N.; Tanre, D.; Eck, T.F.; Smirnov, A.; Chatenet, B.; Lavenu, F. Comparisons of the TOMS aerosol index with Sun-photometer aerosol optical thickness: Results and applications. J. Geophys. Res. 1999, 104, 6269–6279. [Google Scholar] [CrossRef]
- Torres, O.; Bhartia, P.K.; Herman, J.R.; Ahmad, Z.; Gleason, J. Derivation of aerosol properties from satellite measurements of backscattered ultraviolet radiation: Theoretical basis (vol 103, pg 17099, 1998). J. Geophys. Res. 1998, 103, 23321–23321. [Google Scholar]
- Gkikas, A.; Hatzianastassiou, N.; Mihalopoulos, N. Aerosol events in the broader Mediterranean basin based on 7-year (2000–2007) MODIS C005 data. Ann. Geophys.-Germany 2009, 27, 3509–3522. [Google Scholar] [CrossRef]
- Reid, J.S.; Koppmann, R.; Eck, T.F.; Eleuterio, D.P. A review of biomass burning emissions part II: Intensive physical properties of biomass burning particles. Atmos. Chem. Phys. 2005, 5, 799–825. [Google Scholar] [CrossRef]
- VanCuren, R.A.; Cliff, S.S.; Perry, K.D.; Jimenez-Cruz, M. Asian continental aerosol persistence above the marine boundary layer over the eastern North Pacific: Continuous aerosol measurements from Intercontinental Transport and Chemical Transformation 2002 (ITCT 2K2). J. Geophys. Res. 2005, 110. [Google Scholar] [CrossRef]
- Tong, D.Q.; Dan, M.; Wang, T.; Lee, P. Long-term dust climatology in the western United States reconstructed from routine aerosol ground monitoring. Atmos. Chem. Phys. 2012, 12, 5189–5205. [Google Scholar] [CrossRef]
- Prabhakar, G.; Sorooshian, A.; Toffol, E.; Arellano, A.F.; Betterton, E.A. Spatiotemporal distribution of airborne particulate metals and metalloids in a populated arid region. Atmos. Environ. 2014, 92, 339–347. [Google Scholar] [CrossRef] [PubMed]
- Sorooshian, A.; Csavina, J.; Shingler, T.; Dey, S.; Brechtel, F.J.; Saez, A.E.; Betterton, E.A. Hygroscopic and Chemical Properties of Aerosols Collected near a Copper Smelter: Implications for Public and Environmental Health. Environ. Sci. Technol. 2012, 46, 9473–9480. [Google Scholar] [CrossRef] [PubMed]
- Sorooshian, A.; Shingler, T.; Harpold, A.; Feagles, C.W.; Meixner, T.; Brooks, P.D. Aerosol and precipitation chemistry in the southwestern United States: Spatiotemporal trends and interrelationships. Atmos. Chem. Phys. 2013, 13, 7361–7379. [Google Scholar] [CrossRef] [PubMed]
- Sorooshian, A.; Wonaschutz, A.; Jarjour, E.G.; Hashimoto, B.I.; Schichtel, B.A.; Betterton, E.A. An aerosol climatology for a rapidly growing arid region (southern Arizona): Major aerosol species and remotely sensed aerosol properties. J. Geophys. Res. 2011, 116. [Google Scholar] [CrossRef] [PubMed]
- Murphy, D.M.; Chow, J.C.; Leibensperger, E.M.; Malm, W.C.; Pitchford, M.; Schichtel, B.A.; Watson, J.G.; White, W.H. Decreases in elemental carbon and fine particle mass in the United States. Atmos. Chem. Phys. 2011, 11, 4679–4686. [Google Scholar] [CrossRef]
© 2015 by the authors; licensee MDPI, Basel, Switzerland. This article is an open access article distributed under the terms and conditions of the Creative Commons by Attribution (CC-BY) license (http://creativecommons.org/licenses/by/4.0/).
Share and Cite
Lopez, D.H.; Rabbani, M.R.; Crosbie, E.; Raman, A.; Arellano, A.F.; Sorooshian, A. Frequency and Character of Extreme Aerosol Events in the Southwestern United States: A Case Study Analysis in Arizona. Atmosphere 2016, 7, 1. https://doi.org/10.3390/atmos7010001
Lopez DH, Rabbani MR, Crosbie E, Raman A, Arellano AF, Sorooshian A. Frequency and Character of Extreme Aerosol Events in the Southwestern United States: A Case Study Analysis in Arizona. Atmosphere. 2016; 7(1):1. https://doi.org/10.3390/atmos7010001
Chicago/Turabian StyleLopez, David H., Michael R. Rabbani, Ewan Crosbie, Aishwarya Raman, Avelino F. Arellano, and Armin Sorooshian. 2016. "Frequency and Character of Extreme Aerosol Events in the Southwestern United States: A Case Study Analysis in Arizona" Atmosphere 7, no. 1: 1. https://doi.org/10.3390/atmos7010001
APA StyleLopez, D. H., Rabbani, M. R., Crosbie, E., Raman, A., Arellano, A. F., & Sorooshian, A. (2016). Frequency and Character of Extreme Aerosol Events in the Southwestern United States: A Case Study Analysis in Arizona. Atmosphere, 7(1), 1. https://doi.org/10.3390/atmos7010001