1. Introduction
Desert dust storms are a natural phenomenon which can pose a serious environmental hazard. The origin of the dust is mainly from desert soils and it contains diverse mineral and organic components [
1]. During dust events, which can last for several days, PM
10 concentrations (particulate matter with aerodynamic diameter less than 10 μm) increase far beyond air quality guidelines [
2,
3,
4].
A number of epidemiological studies have associated risk exposure to ambient PM
10 levels during desert dust outbreaks with increased cardiovascular and respiratory hospital admissions or even mortality [
5,
6,
7]. A study by Perez
et al. showed that an increase of 10 μg·m
−3 of PM during Sahara dust storms was associated with an increase in all-cause daily mortality of 8.4% [
8]. A 10-year analysis of respiratory and cardiovascular morbidity in Nicosia, Cyprus showed that cardiovascular admissions were 10.4% higher during dust days [
9]. The majority of epidemiological studies however were performed in non-arid urban environments. In addition these studies are based on outdoor PM measurements, although people are also exposed to PM in indoor environments such as homes, schools, offices and restaurants, where they spend most of their time- in particular during dust events.
Atmospheric PM has already been recognized as a matter of significant concern related to indoor air quality [
10,
11,
12,
13]. Understanding of how indoor exposure relates to outdoor concentrations is critical for assessment of policy interventions to reduce adverse health effects. However, the relations between outdoor and indoor PM concentrations during natural dust events remain unclear. Arid and semi-arid regions are strongly associated with dust storms due to their proximity to dust sources [
14]. Hundreds of millions of people live in such regions throughout the world (mainly in Africa and Asia) and therefore are exposed to increased atmospheric PM due to dust storms.
This study explores variations in outdoor and indoor PM levels in an arid city (Beer Sheva) through analyses of real-time data collected during a series of dust events. The city of Beer Sheva (Negev, Israel) is located at the margins of the global dust belt, which extends between West Africa and Saudi Arabia, and is frequently subjected to elevated PM concentrations due to dust storms [
15,
4]. This study aims to provide a better understanding of the natural dust phenomenon and to support decision making on environmental and health issues.
2. Methods
Dust storms in the Beer Sheva region occur mostly during the winter, associated with a passage of cold fronts followed by relatively high wind speeds (>6 m/s). The spring and the autumn seasons are characterized by mild storms while the summer is considered a dust-free season. A long-term analysis of atmospheric (outdoor) PM
10 concentrations in the studied region [
4] showed that dust storms can contribute a daily average PM concentration of up to 2643 µg·m
−3, while the average background value for non-dust days is 42 µg·m
−3. Hourly levels of PM
10 concentrations can reach as much as 5000 µg·m
−3.
The data set was comprised of measurements collected during both dust and non-dust days (background) during August 2013–March 2015. Measurements for this study were conducted during 18 dust storms. In each dust storm 5 to 15 houses were measured, depending on the event duration (from 2–3 h to 2 days). Overall 210 houses were sampled, in which 210 and 175 measurements (outdoor and indoor PM10) were conducted during non-dust and dust days respectively. Seven houses were visited a number of times during different dust events. The measurements were performed with portable real-time dust monitoring devices (TSI DustTrak DRX 8534; detection range 1 to 100,000 µg·m−3, reading resolution of 0.001 mg·m−3, accuracy of 1%). PM10 concentrations were recorded at 5-s intervals. In the indoor environment, the device was operated in the living room while all windows and doors were closed and air conditioning, cooking or smoking were not allowed. The corresponding outdoor measurements were recorded from a balcony or backyard of each house.
The PM database was assembled thanks to the use of portable monitoring devices (TSI DustTrak). The TSI DustTrak has gained widespread use in numerous studies of indoor and outdoor PM
2.5 and PM
10 due to its sensitivity to a range of different aerosols, fast response time, and high temporal measurement resolution. Natural dust particles are very similar to the Arizona Dust used to calibrate the DustTrak (TSI, 1997), providing confidence for attaining a reasonable measurement of the PM concentration during dust events [
16]. Data from the DustTrak can be corrected for more accurate mass concentrations [
17,
18,
19,
20,
21,
22]. In this study, the procedure of the real-time measurements included preliminary tests of the DustTrak readings through comparisons with records from a standard environmental PM monitor (Thermo Scientific TEOM
® 1405-DF) located in the center of Beer Sheva, which operates within the framework of the national air monitoring system.
3. Results and Discussion
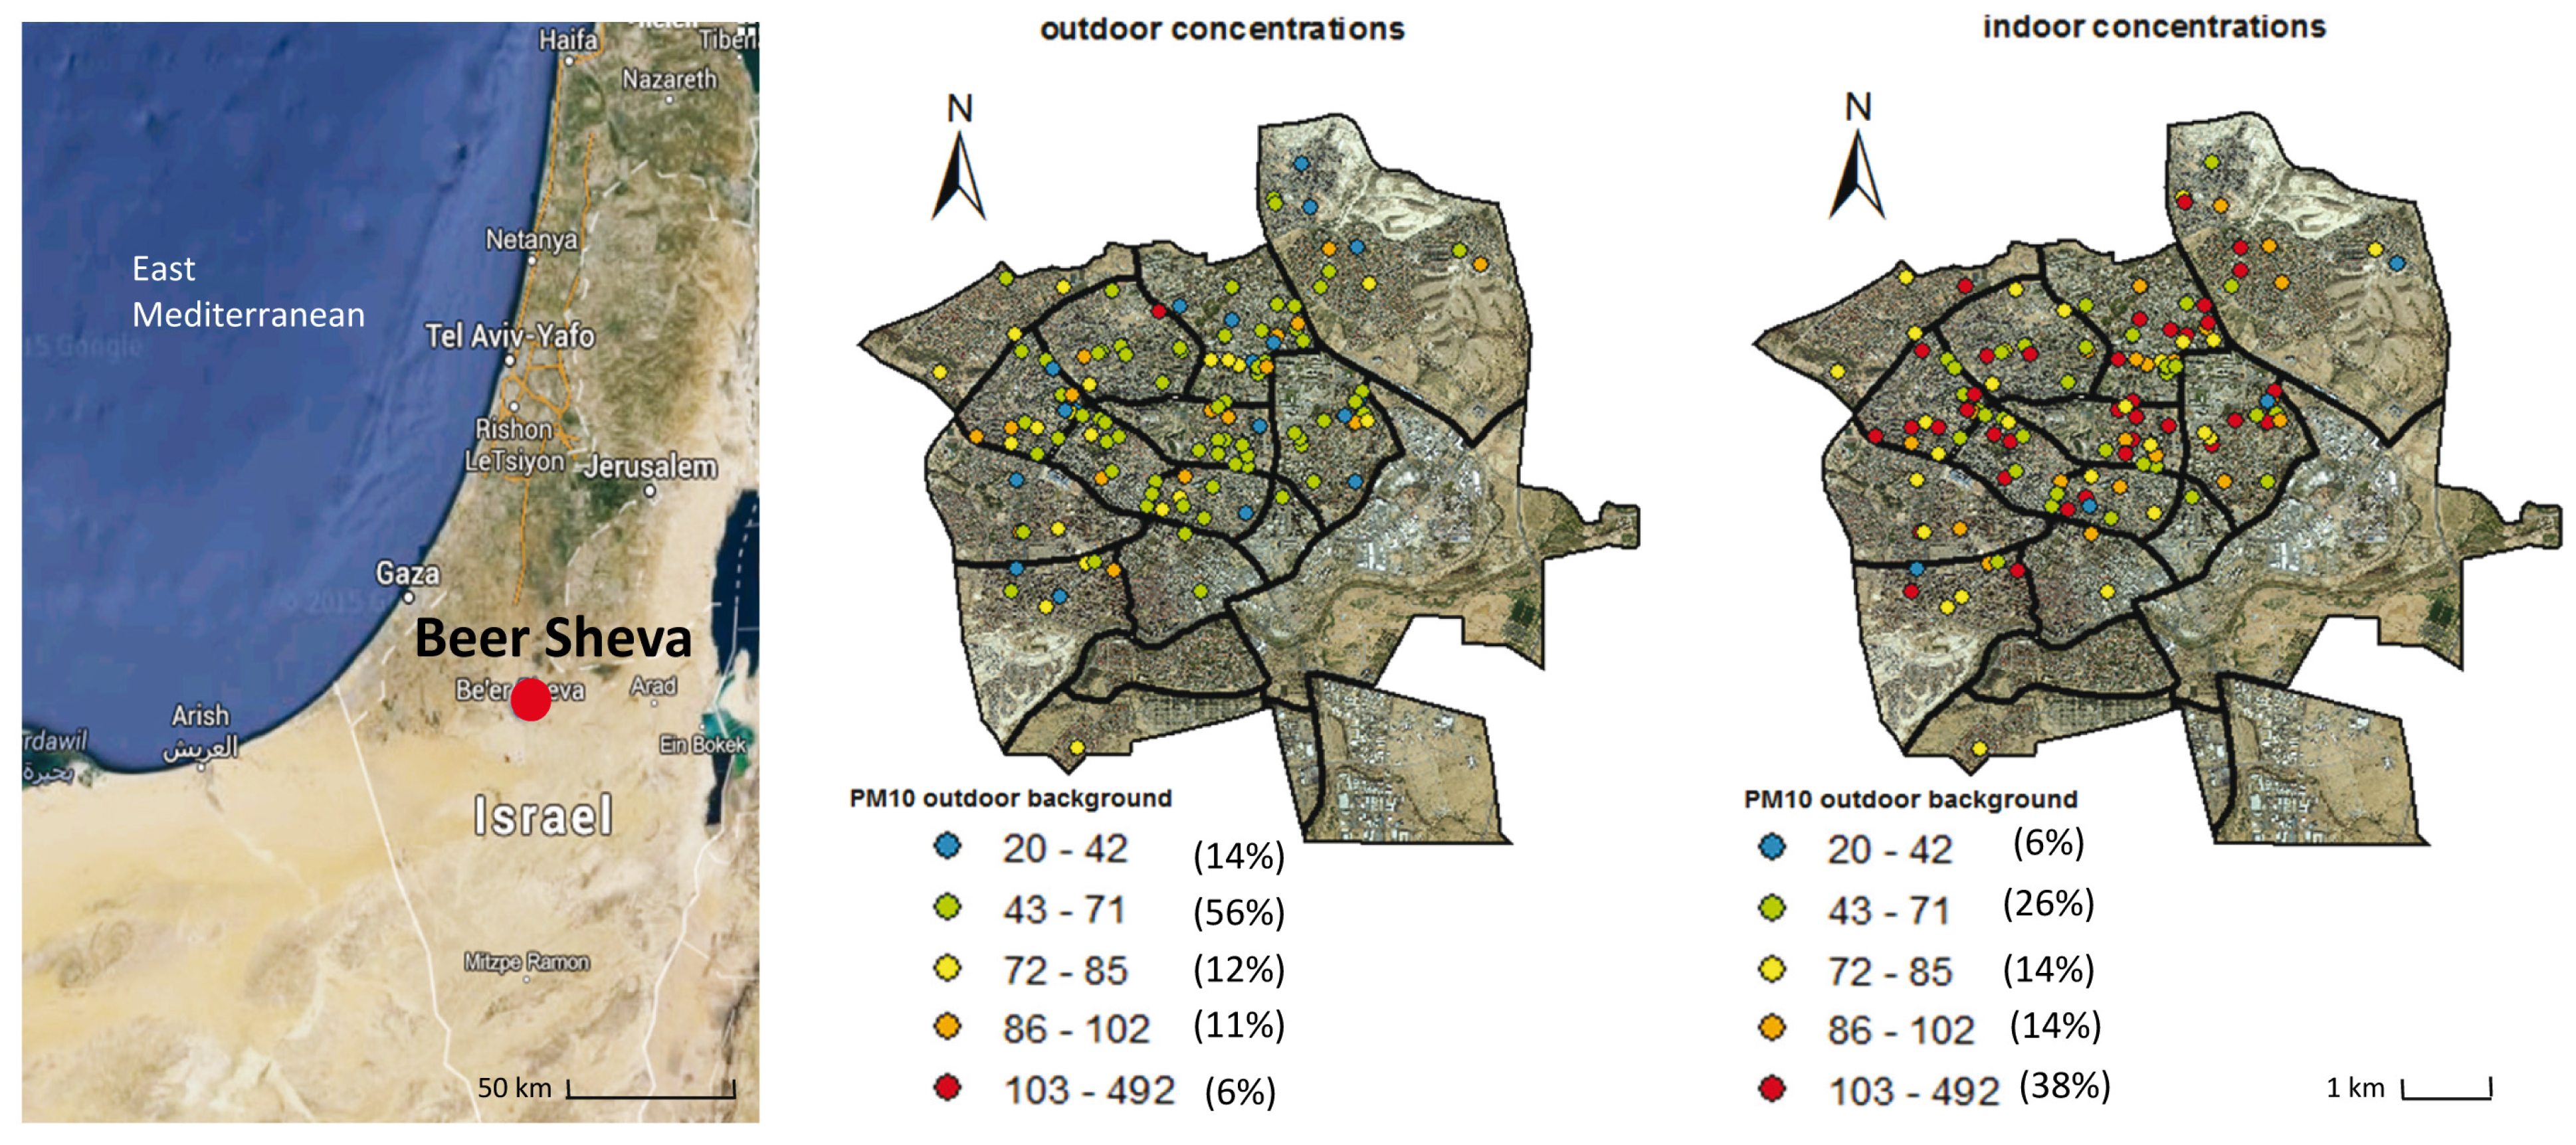
Figure 1 shows the PM
10 mean concentrations in indoor and outdoor environments during the non-dust days (background). The different colors represent the PM levels from lowest (cold colors) to highest (warm colors) concentrations divided to five groups. Outdoor concentrations range between 24–120 μg·m
−3. The larger group (56%) was within the range of 43–71 μg·m
−3 (light green). PM concentrations above 86 μg·m
−3 (orange) were found for a small group of 24 houses (11%) while concentrations above 103 μg·m
−3 were found only for 6%. Since the point measurements were performed from August 2013 to March 2015, the range can be related to temporal variations in which PM can be somewhat higher during the day time compared to evening, and during summer compared to the winter. The overall range of the PM concentrations on non-dust days is typical for Beer Sheva area based on long term analysis [
4]. However the PM concentrations on non-dust days are significantly lower than those of dust events.
The indoor concentrations ranged between 20 to 492 μg·m−3. The lowest concentrations (20–42 μg·m−3) were recorded in 6% of the houses (blue dots). The larger portion of houses (38%) was in the range of 103–492 μg·m−3 (red color). The higher PM concentrations (above 103 μg·m−3) in the indoor environment can be related mainly to the house characteristics.
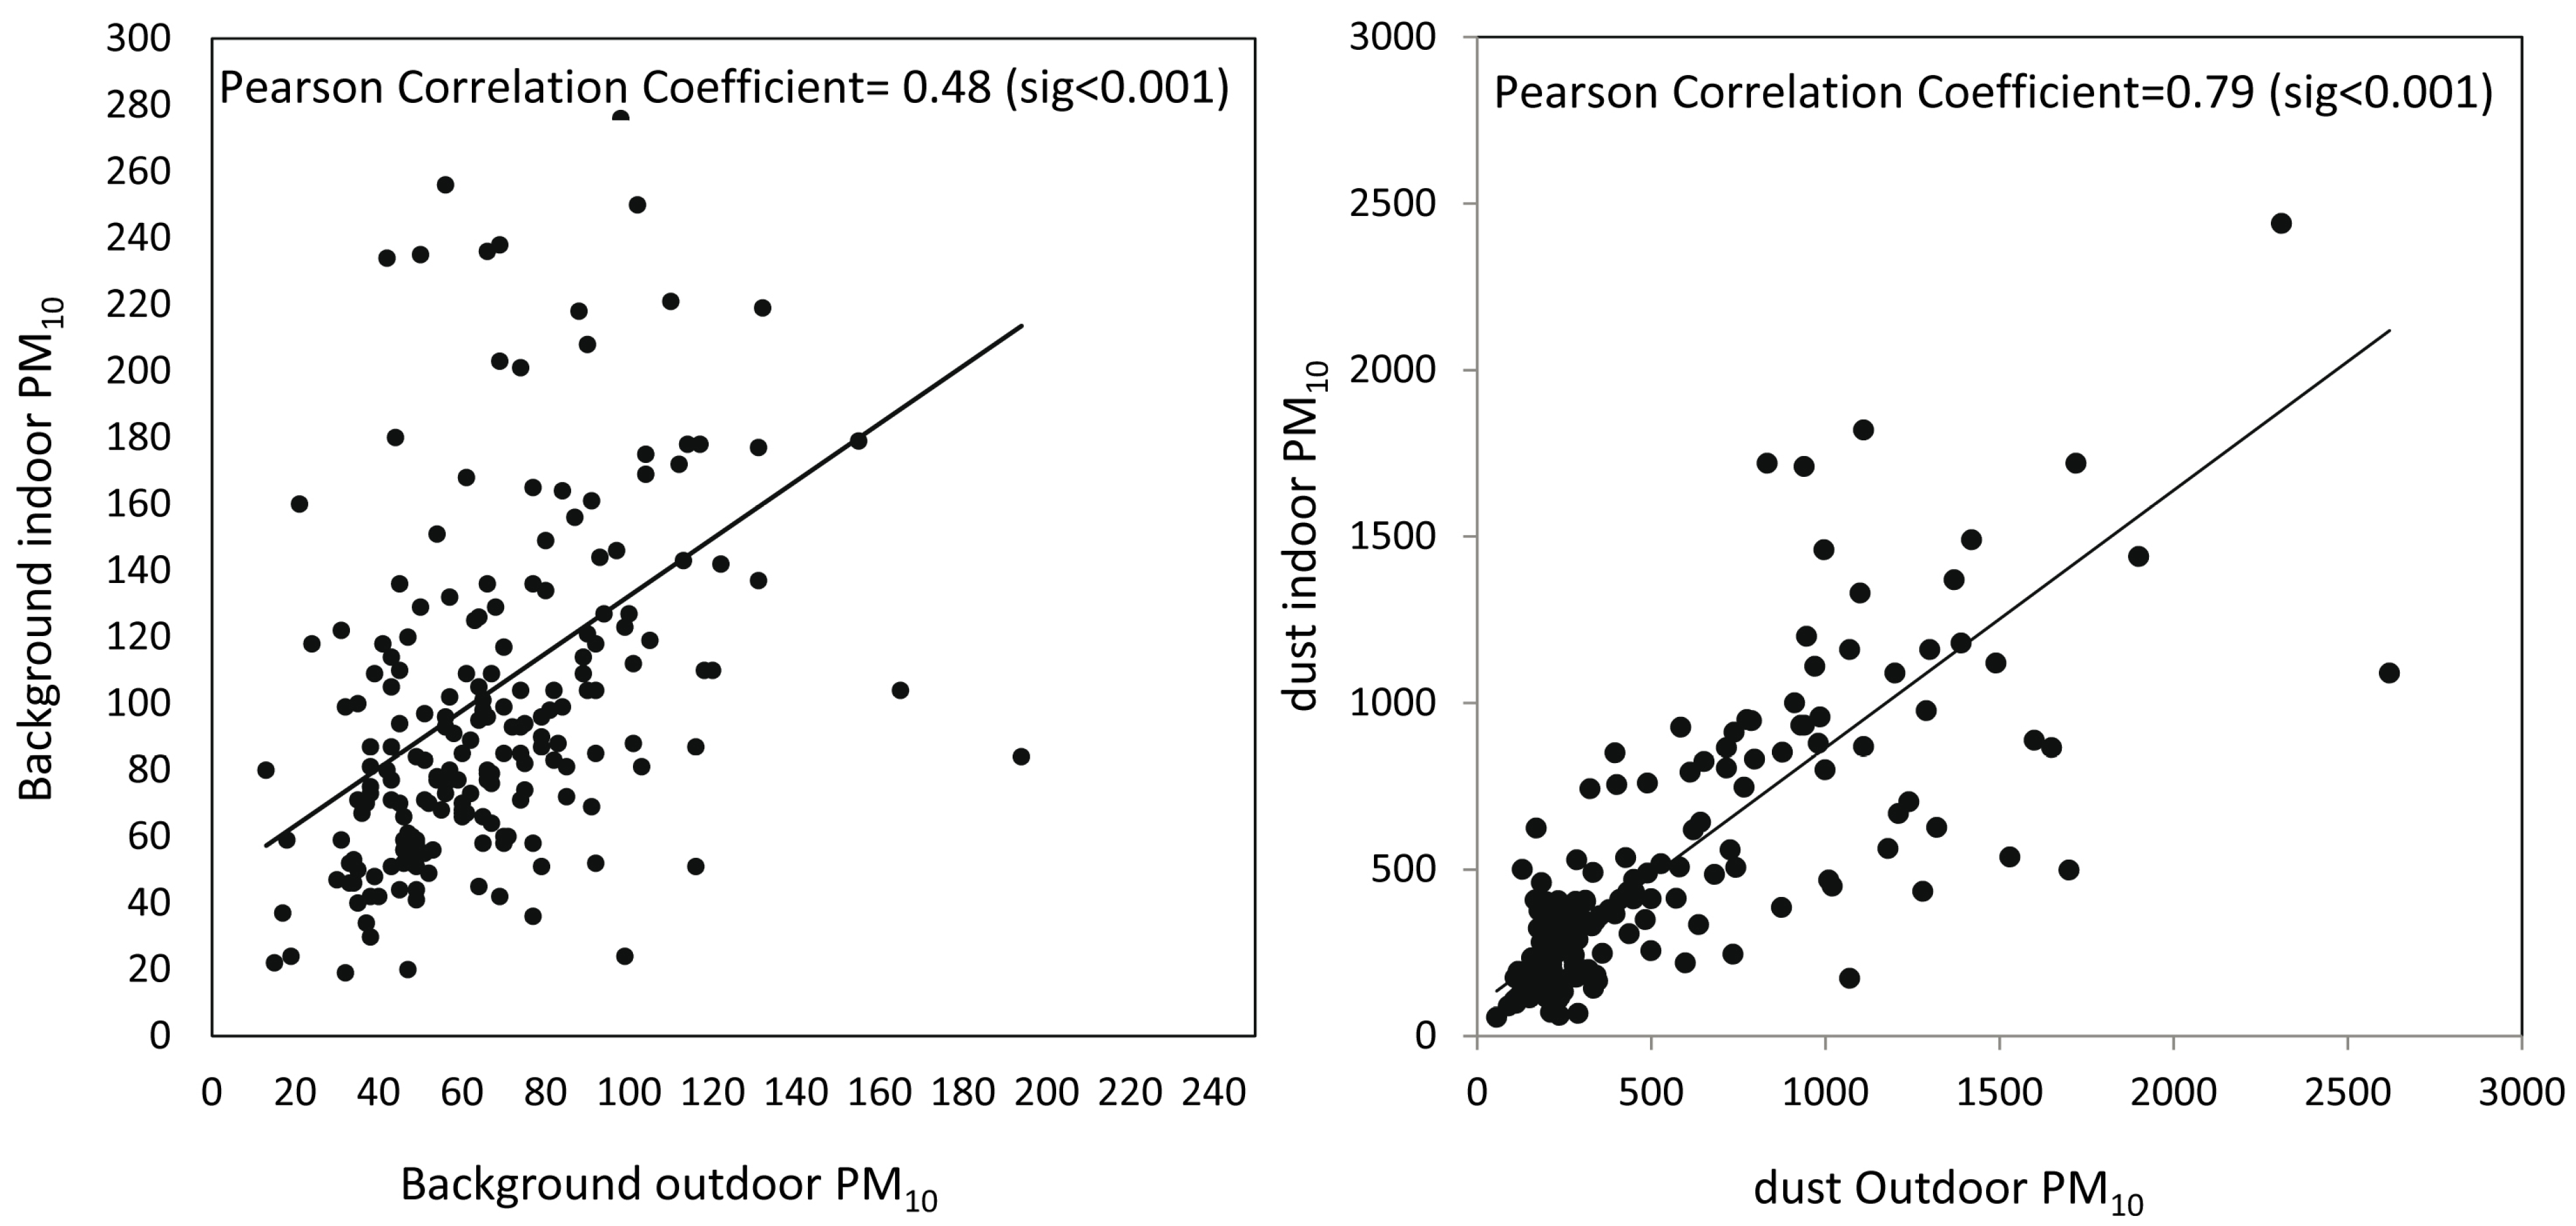
The correlations coefficient between the indoor and outdoor PM
10 was calculated (
Figure 2). During the background period, the correlation coefficient was relatively weak −48% (sig < 0.001), indicating that the house conditions are a more dominant effector on the indoor PM concentrations. However during elevated PM concentrations following dust storms the PM
10 concentrations increased significantly above the background values (up to 2300 μg·m
−3). The correlation coefficient during dust events increased to 79% (sig < 0.001). This is related to the atmospheric (outdoor) PM as a major controlling factor on indoor PM during dust events.
Figure 1.
Measurement locations of outdoor (left) and indoor (right) PM10 concentrations during background (non-dust days) in Beer Sheva. The different dot colors represent the PM levels from lowest (cold colors) to highest (warm colors) concentrations. Concentrations are given in μg·m−3. Percentages in brackets indicate the relative fraction of houses within the indicated particulate matter (PM) concentration range.
Figure 2.
Correlation factors between outdoor and indoor PM10 concentrations during background (non- dust days, left) and dust events (right). Note the difference in the scale of Y axis.
Figure 2.
Correlation factors between outdoor and indoor PM10 concentrations during background (non- dust days, left) and dust events (right). Note the difference in the scale of Y axis.
In order to examine the PM concentrations over time during dust events, continuous PM
10 measurements in the indoor and outdoor environments in typical houses in the study area were performed. In the example presented in
Figure 3, it is shown that during non-dust days (measured over several days––see methods chapter), the indoor PM
10 concentrations vary from 20 to 118 μg·m
−3 (44 μg·m
−3 on average). The corresponding outdoor concentrations (measured outside the house) were within a similar range of 20–110 μg·m
−3. The correlation between the indoor and outdoor PM measurements was relatively high, 87% (sig < 0.001).
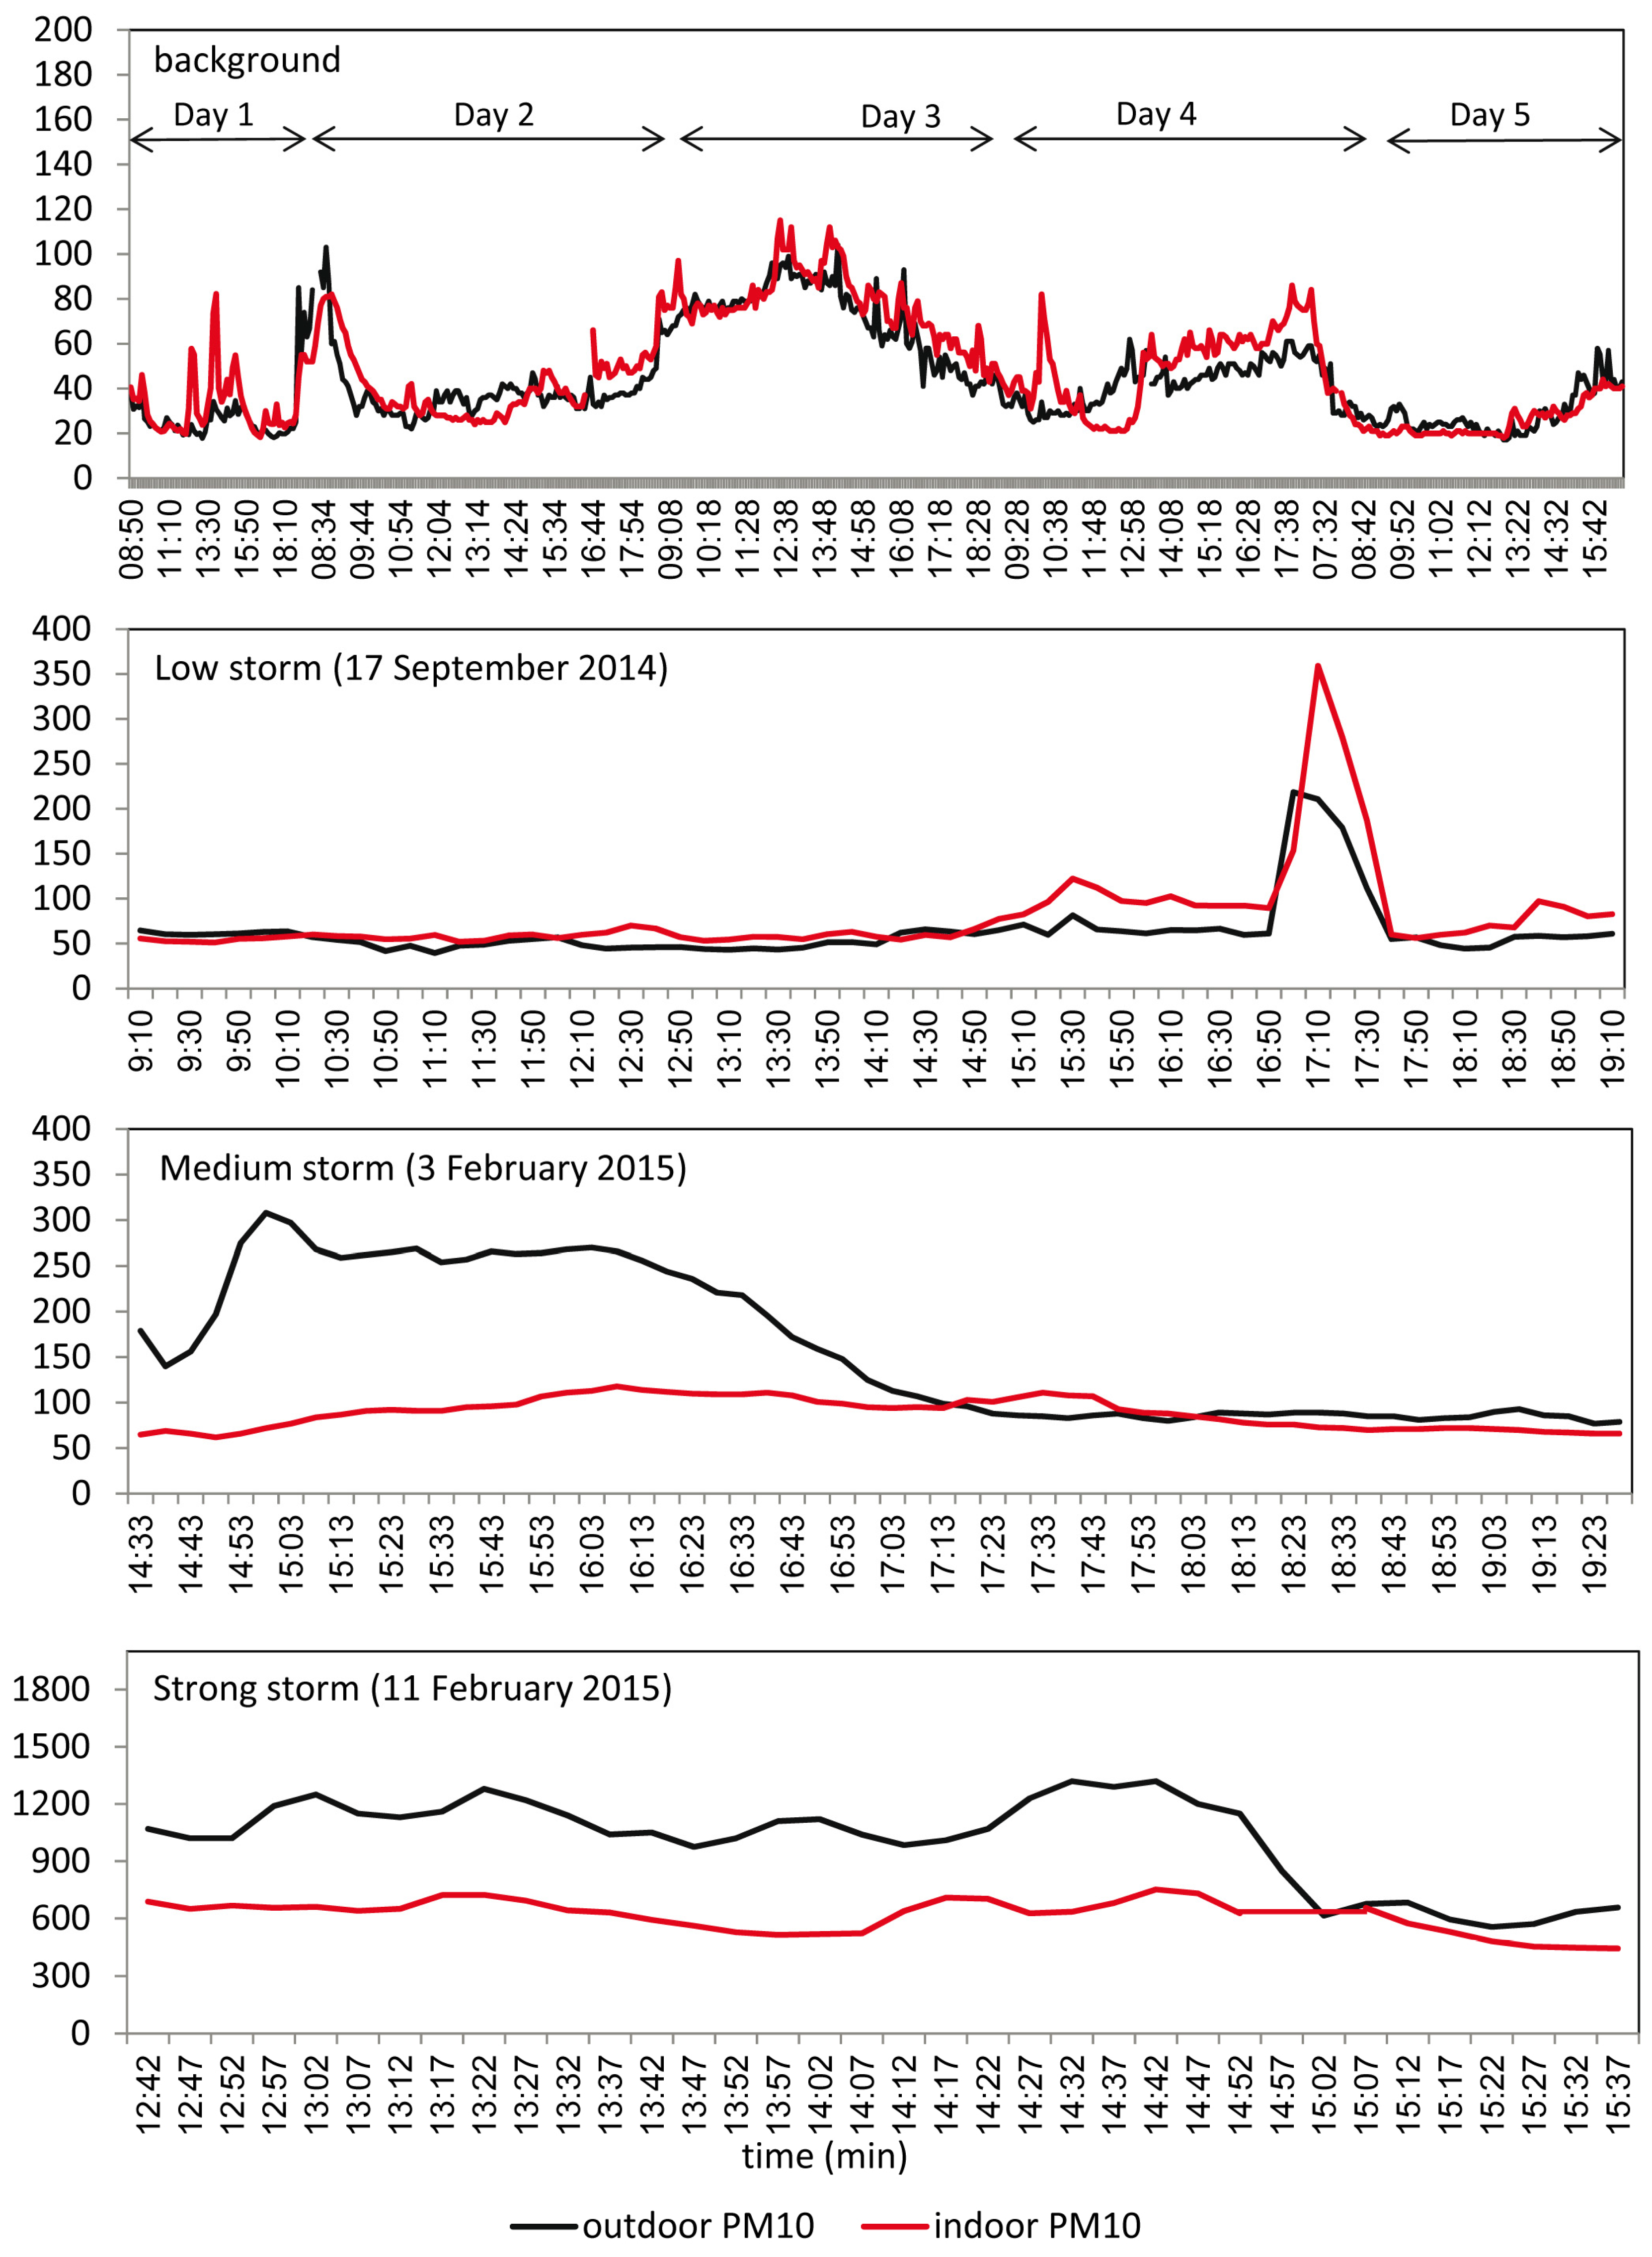
Figure 3.
PM10 concentrations in a typical house during background (upper graph) and different dust event levels (low, medium, high). The background measurements were collected during several days. Note the differences in Y axis scales.
Figure 3.
PM10 concentrations in a typical house during background (upper graph) and different dust event levels (low, medium, high). The background measurements were collected during several days. Note the differences in Y axis scales.
Figure 3 also shows the indoor and outdoor concentrations during dust storms with different intensities. The low intensity dust storms of September 2014 reached atmospheric (outdoor) concentrations of 220 μg·m
−3 after an initial background value of about 50 μg·m
−3. The dust event lasted for about an hour before the background value was reduced again to the level of 50 μg·m
−3. The corresponding indoor concentrations during the background were slightly higher than those of the outdoor and reached 360 μg·m
−3 during the dust event itself (correlation 86%, sig < 0.001). The increase in the indoor concentration occurred 10 min after the beginning of the dust event, and decreased to the background values about 30 min after the end of the event.
The medium intensity dust storm of 3 February 2015 lasted 3 h and atmospheric concentrations exceeded 300 μg·m−3. After 3 h, the concentrations dropped to a value of 80 μg·m−3, which is above the normal background values. The corresponding indoor concentrations rose from 65 μg·m−3 to 118 μg·m−3 (correlation 34%, sig < 0.001). The higher indoor concentrations persisted for about 2 h after outdoor concentrations began to decrease. The strong dust storm of 11 February 2015 was characterized by high outdoor and indoor levels (1320 μg·m−3 and 750 μg·m−3 respectively), lasting for more than 3 h. The indoor concentrations increased by 17 fold from the average indoor background (correlation 70%, sig < 0.001). After 3 h the outdoor concentrations decreased to 600 μg·m−3. The indoor concentrations, however, remained at their highest level throughout the entire measurement period.
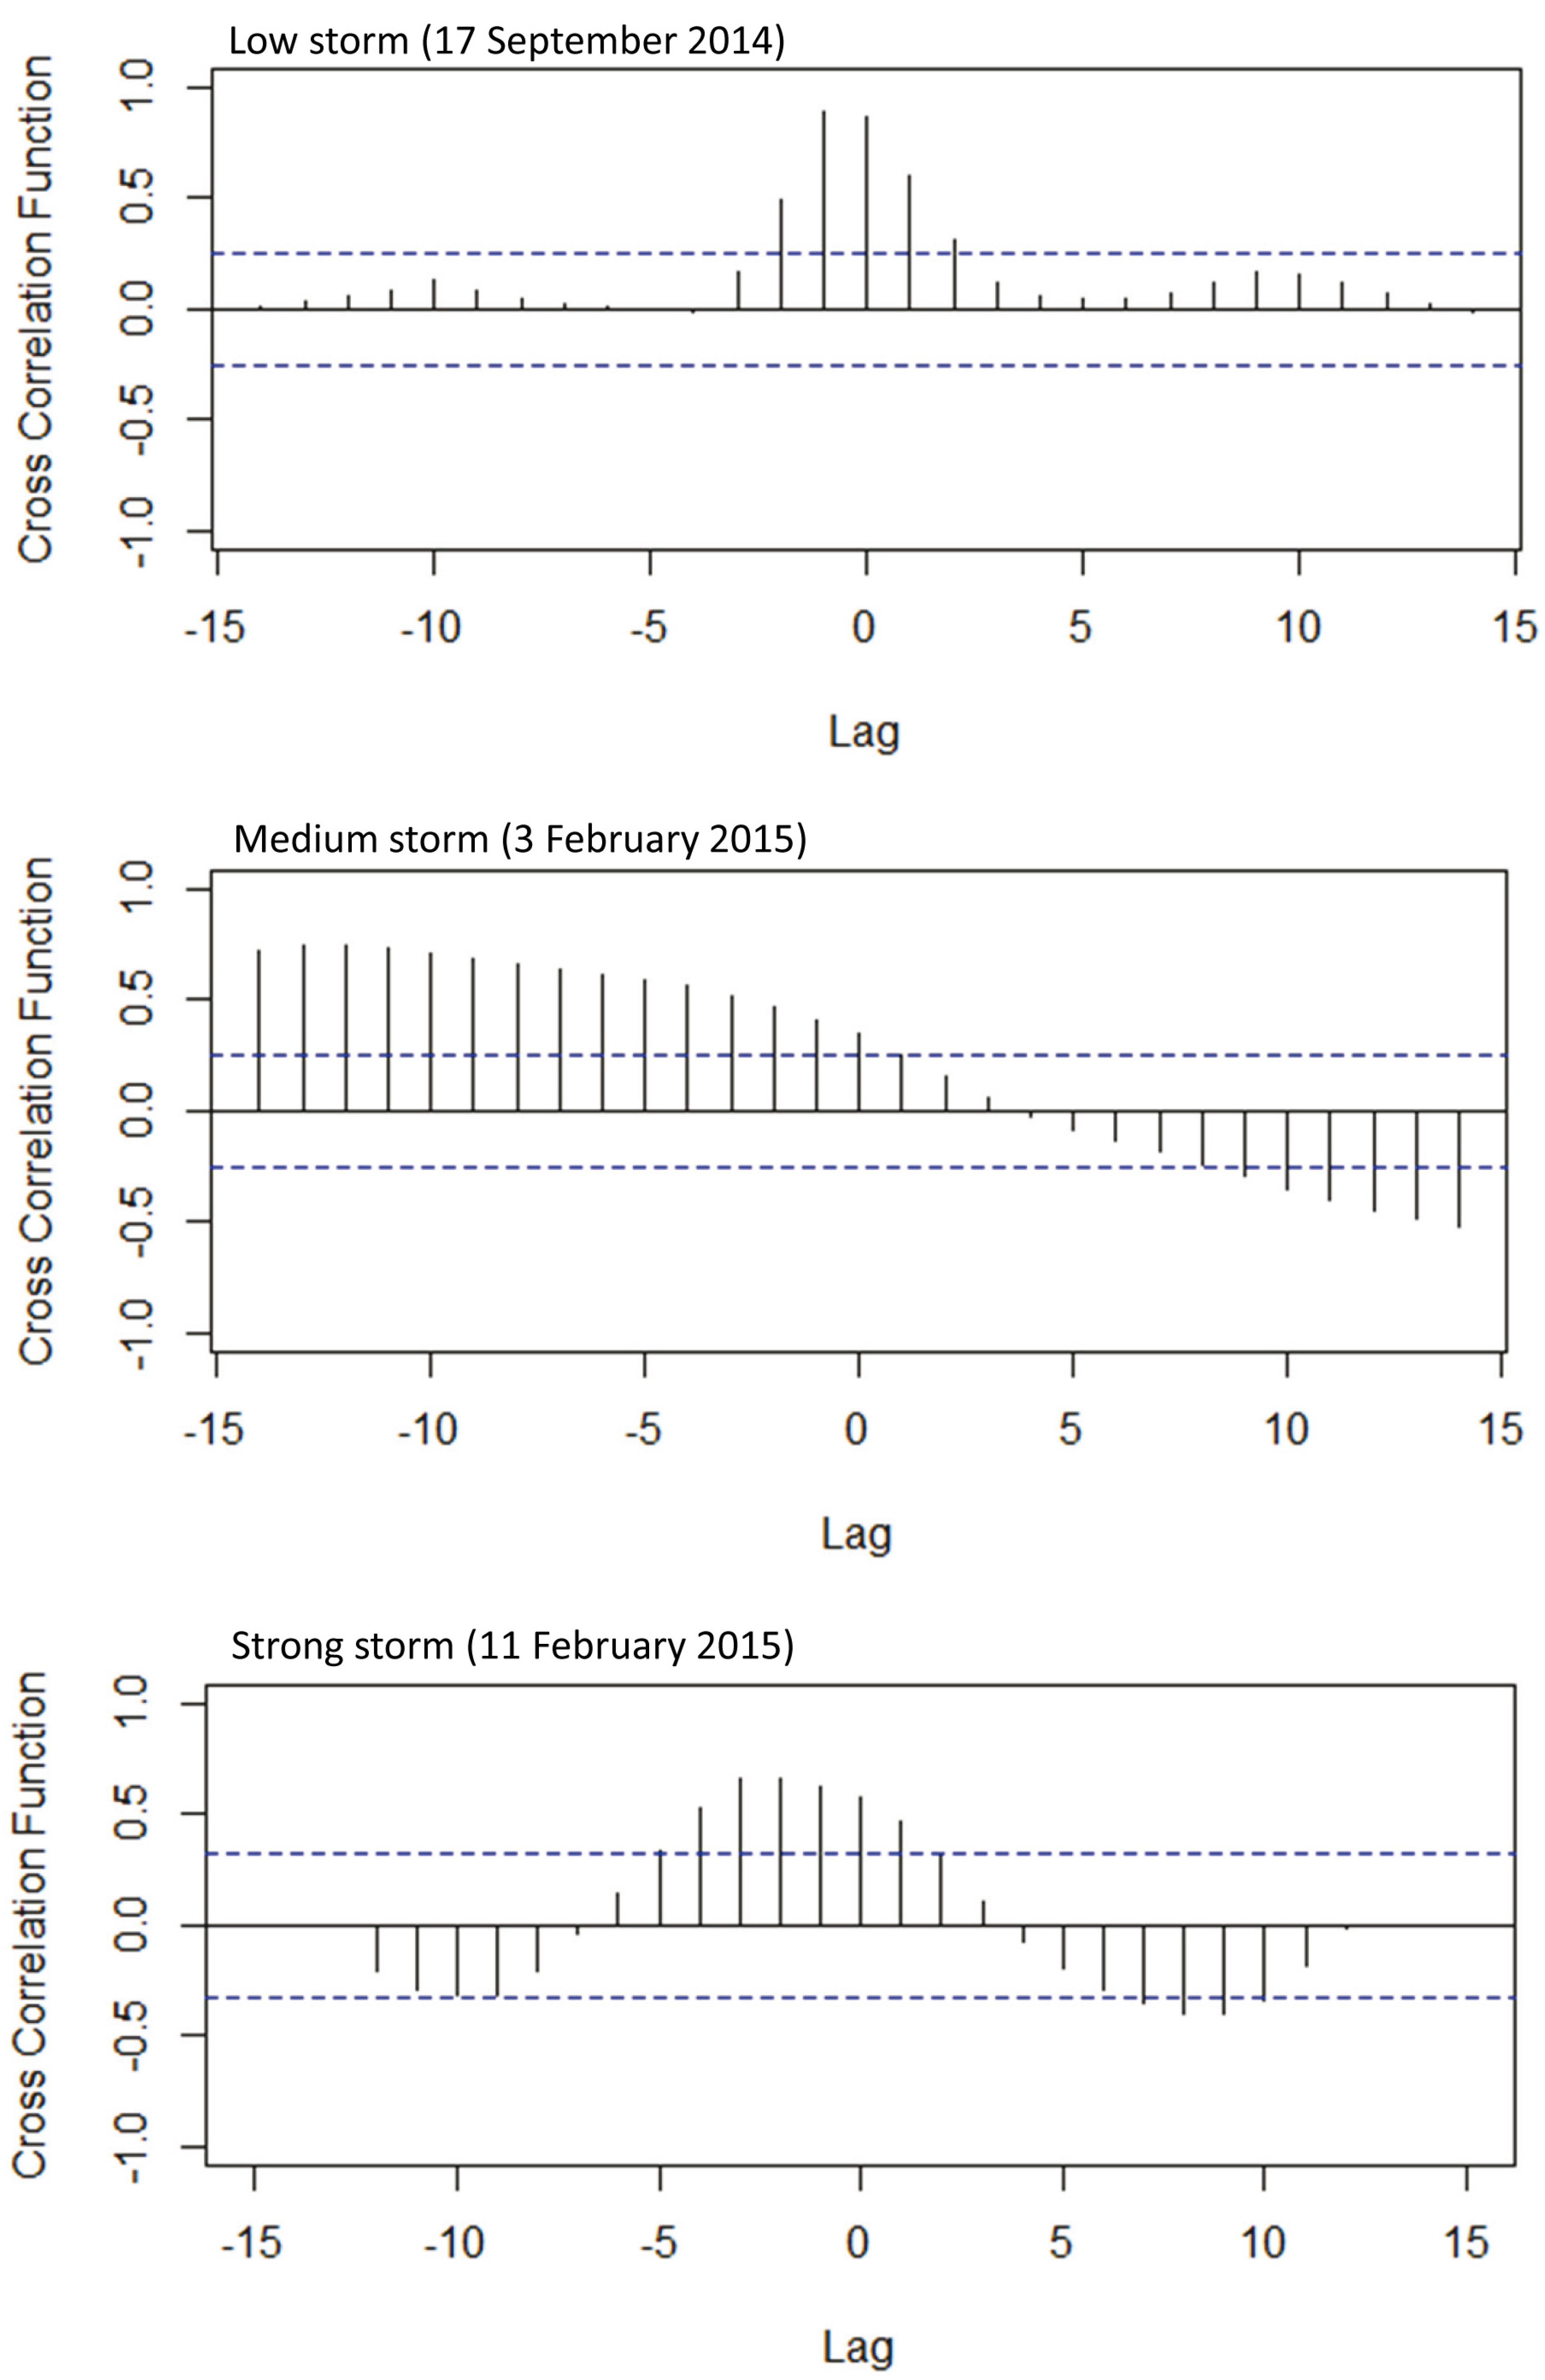
During non-dust days the indoor concentrations is somewhat higher than the corresponding outdoor concentrations due to low air exchange in houses compared with the outside. The trend remains during low storms and follows the small increase in outdoor concentrations. The outdoor concentrations reach extremely high values during medium to strong events. Probably only part of the particles penetrates into the indoor space, thus the trend is opposite to low storms with higher outdoor concentrations compared with indoor concentrations. Cross-correlation functions revealed a time lag for the increased indoor concentrations. The time lag is in the range of 10 min (one lag) to one hour (12 lag) (
Figure 4).
This demonstrates the impact of dust storms on indoor PM concentrations. The increase in indoor concentrations occurs even during a low-intensity dust storm in the area, with a short-term response during the peak of the dust storm. In the stronger storms, the indoor concentrations increase to high levels in terms of air quality and remain high for a long period of time. Typically, stronger storms are associated with stronger wind speeds, which can increase the pressure on windows and doors of houses and thus the penetration rates of particles from outdoor to indoor. However the high PM concentrations in the indoor environment following dust event persist for a long time.
Calculation of the indoor and outdoor ratio (I/O ratio) directly represents the relationship between these concentrations. A number of studies found that I/O ratios vary within in a wide range [
11]. A study in Beijing demonstrated I/O values between 0.6–0.9 and correlated it to wind speed and relative humidity changes during fog and haze episodes [
23]. In this study, the average indoor/outdoor (I/O) ratio was 1.7 (S.D = 0.3) for non-dust days (background) (based on
Figure 1). On dust days, this ratio was found to be dependent on the dust event level (
Figure 3). For the low intensity event (17 September 2014) the I/O is 1.24, for the medium intensity event (3 February 2015) I/O = 0.68, and for the strong event (11 February 2015) I/O = 0.58. The values below 1 of the medium and the strong events (0.58–0.68) represent the changes in the indoor-outdoor relationships due to dust events.
Figure 4.
Cross correlation function between indoor and outdoor concentrations for the different storms. Correlation coefficient between outdoor and indoor PM measurements are (sig < 0.001): 86% (17 September 2014); 43% (3 February 2015); 70% (11 February 2015).
Figure 4.
Cross correlation function between indoor and outdoor concentrations for the different storms. Correlation coefficient between outdoor and indoor PM measurements are (sig < 0.001): 86% (17 September 2014); 43% (3 February 2015); 70% (11 February 2015).
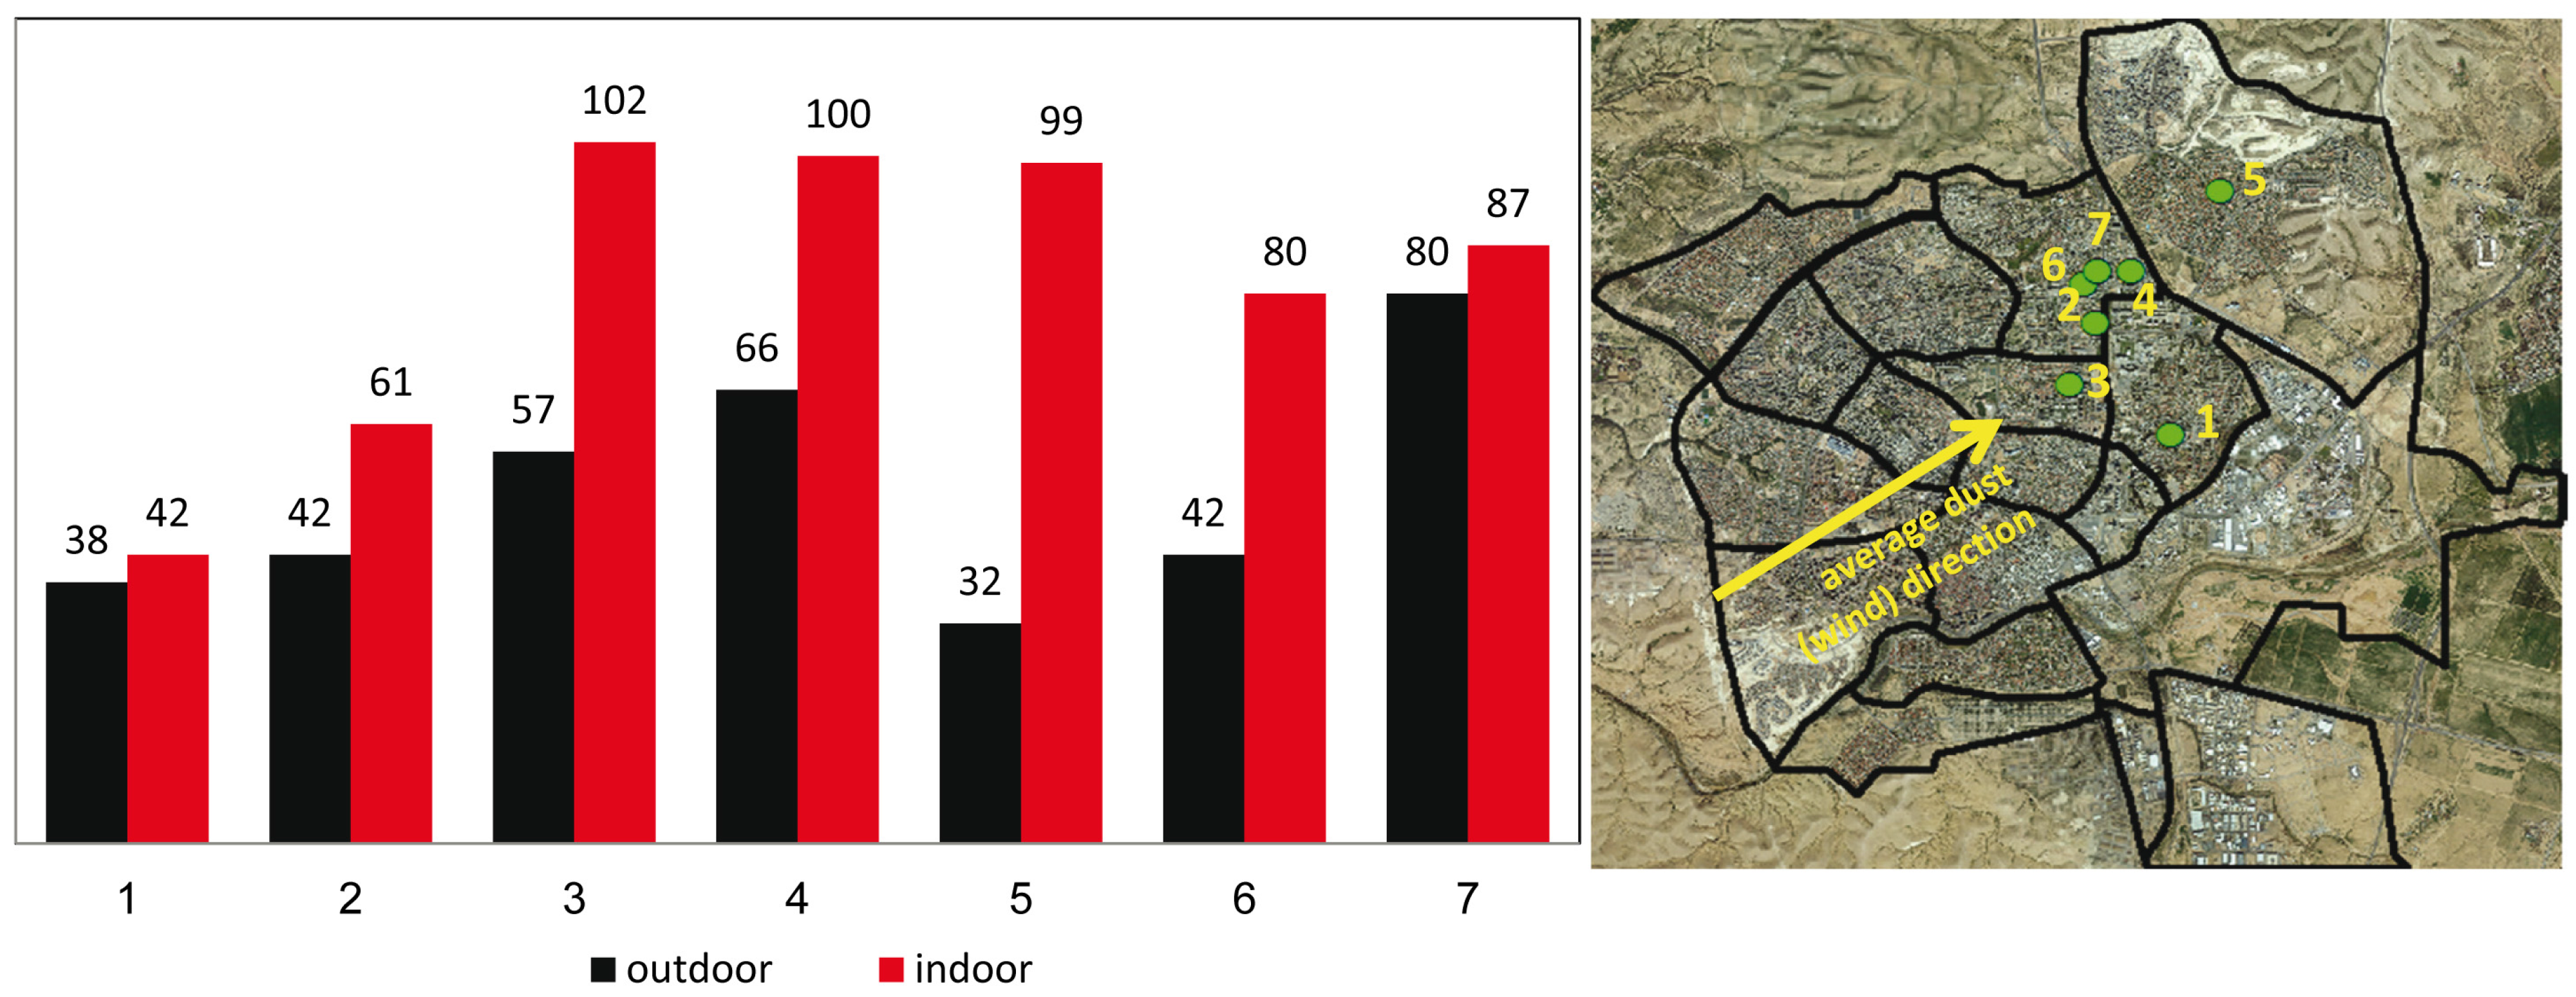
To further examine the indoor PM response to dust events, we compared the results of 7 houses during different dust events. The background levels recorded for indoor and outdoor environments of these houses are presented in
Figure 5 along with the locations of the houses and the main wind direction (and dust sources) in the study area. Outdoor PM
10 concentrations during non-dust days ranged between 32–80 μg·m
−3. The lowest outdoor concentration was observed in house #5, which is located relatively far from the dust sources. The highest concentration was measured in house #7. Indoor levels were within the range of 42–102 μg·m
−3. The lowest concentration was recorded in house #5, while the highest was measured in houses #3 and #4.
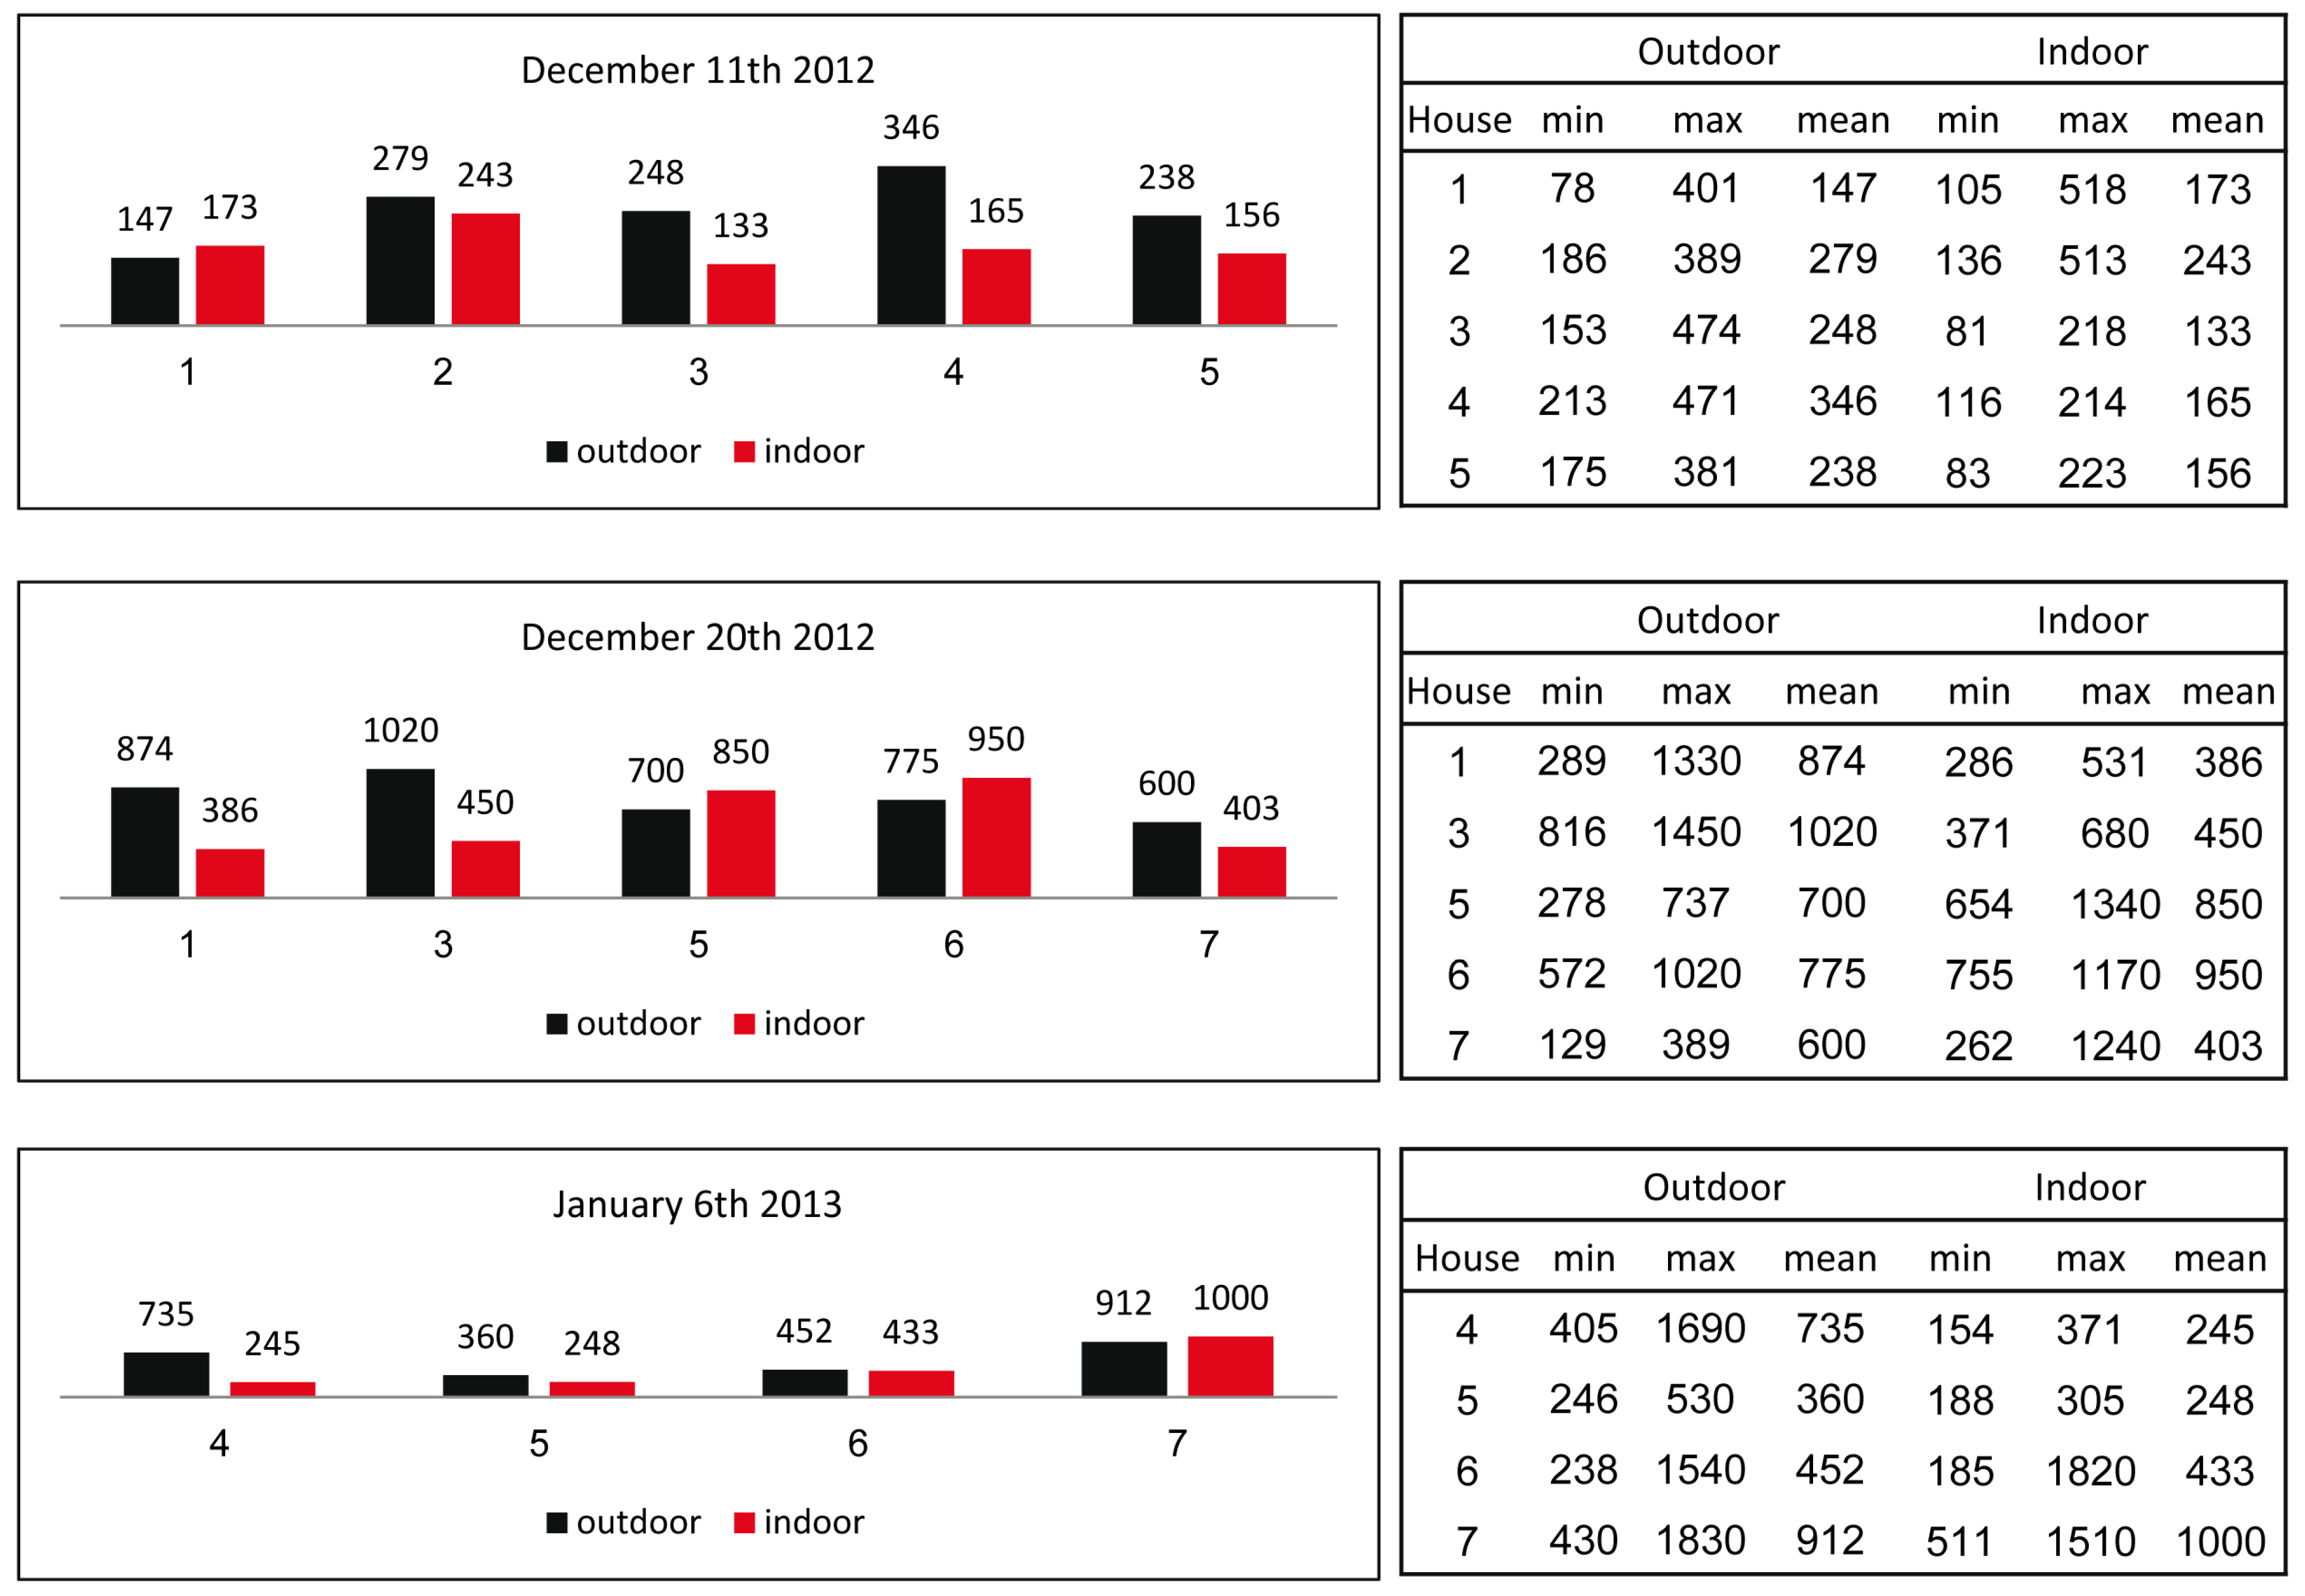
The indoor and outdoor levels for the same houses during three winter dust storms (west wind trajectory) are presented in
Figure 6. The dust event of 11 December 2012 lasted 10 h at a medium storm level with average outdoor concentrations of 335 μg·m
−3. The highest indoor value (346 μg·m
−3) was measured in house #4, and the lowest (147 μg·m
−3) was found in house #1. In this event, the indoor concentrations were lower than those of the outdoor in 4 out of 5 measured houses. The I/O ratio was less than 1 (0.74).
Figure 5.
Example of outdoor and indoor PM10 concentrations (values in μg·m−3 are presented above the columns) in different houses during non-dust days. The locations of the houses are presented in the map (right panel) together with the main wind direction for the study region.
Figure 5.
Example of outdoor and indoor PM10 concentrations (values in μg·m−3 are presented above the columns) in different houses during non-dust days. The locations of the houses are presented in the map (right panel) together with the main wind direction for the study region.
The dust events of 20 December 2012 and 6 January 2013 were high intensity storms. Both dust events lasted more than 10 h. Average outdoor PM10 concentration for 20 December 2012 was 1133 μg·m−3 with a maximum hourly value of 1290 μg·m−3. Very high outdoor and indoor concentrations were recorded in the five measured households. The highest outdoor level (1020 μg·m−3) was found in house #3; while house #7 had the lowest level (600 μg·m−3). In two of the houses (#1 and #3) the outdoor values were above 800 μg·m−3 and higher than the corresponding indoor concentrations. The I/O ratio was 0.79 on average.
During the storms of 6 January 2013, the PM
10 concentrations reached a maximum value of 1956 μg·m
−3 (with an average value for the dust event of 561 μg·m
−3). The highest outdoor and indoor concentrations (1000 μg·m
−3 and 912 μg·m
−3 respectively) were found in house #7, while the lowest were in house #5 (outdoor 360 μg·m
−3 and indoor 248 μg·m
−3). The I/O ratio for this event was 0.76 on average. The I/O ratio values for these storms are calculated as an average for several houses. The values (0.74–0.79) are somewhat higher than the I/O ratio values (0.58–0.68) calculated for two other dust storms (medium and high levels––see
Figure 3), but in a single house. In all cases (
Figure 3 and
Figure 6) the I/O ratio was below 1, which is significantly different from the background conditions and low intensity storms (>1). Nonetheless, the results of the I/O ratio demonstrate the variability in the impact of dust storms on the indoor PM concentrations.
Figure 6.
Average PM
10 concentrations (values in μg·m
−3 are presented above the columns) for indoor (red) and outdoor (black) of houses in the study area (
Figure 4) during different dust events. Summary statistics is also presented on the right.
Figure 6.
Average PM
10 concentrations (values in μg·m
−3 are presented above the columns) for indoor (red) and outdoor (black) of houses in the study area (
Figure 4) during different dust events. Summary statistics is also presented on the right.
4. Conclusions
The results show that the atmospheric PM10 concentrations in an arid city can increase significantly from 20 to 120 μg·m−3 on non-dust days to more than 1500 μg·m−3 during dust events. The high atmospheric (outdoor) dust concentrations have a direct effect on the indoor environment of houses. The indoor concentrations reached values as high as 1000 μg·m−3, which is significantly higher than the air quality guidelines.
The time lag in the increased indoor concentrations due to dust events varies between storms from several minutes to about one hour. Both indoor and outdoor concentrations varied considerably, depending on the dust storm intensity. The calculated indoor/outdoor (I/O) ratio was I/O < 1 for all measured houses in this study during a dust event. It ranged from 0.79 for low-level storms to 0.58 during the strongest storms.
Variations of outdoor and indoor PM concentrations during dust storms were demonstrated. Considering the indoor environment, no evidence was found for the impact of the house location in the city. The most important factors that were found to control the PM concentrations were: the dust storm intensity (low, medium, high), duration (and time lag), and physical characteristics of the houses.
This work is part of a comprehensive study aiming to explore the dynamics of dust storms in the city scale, and to examine the effect of natural PM on exposure risk for human health. The findings indicate that during dust events people are exposed to high levels of PM concentrations in indoor and well as outdoor environments. Such information is critical for assessment of policy interventions to reduce adverse health effects, especially in arid and semi-arid regions that are strongly associated with dust storms due to their proximity to dust sources.

