Estimation of the PM2.5 Pollution Levels in Beijing Based on Nighttime Light Data from the Defense Meteorological Satellite Program-Operational Linescan System
Abstract
:1. Introduction
2. Experimental Section
2.1. Study Area
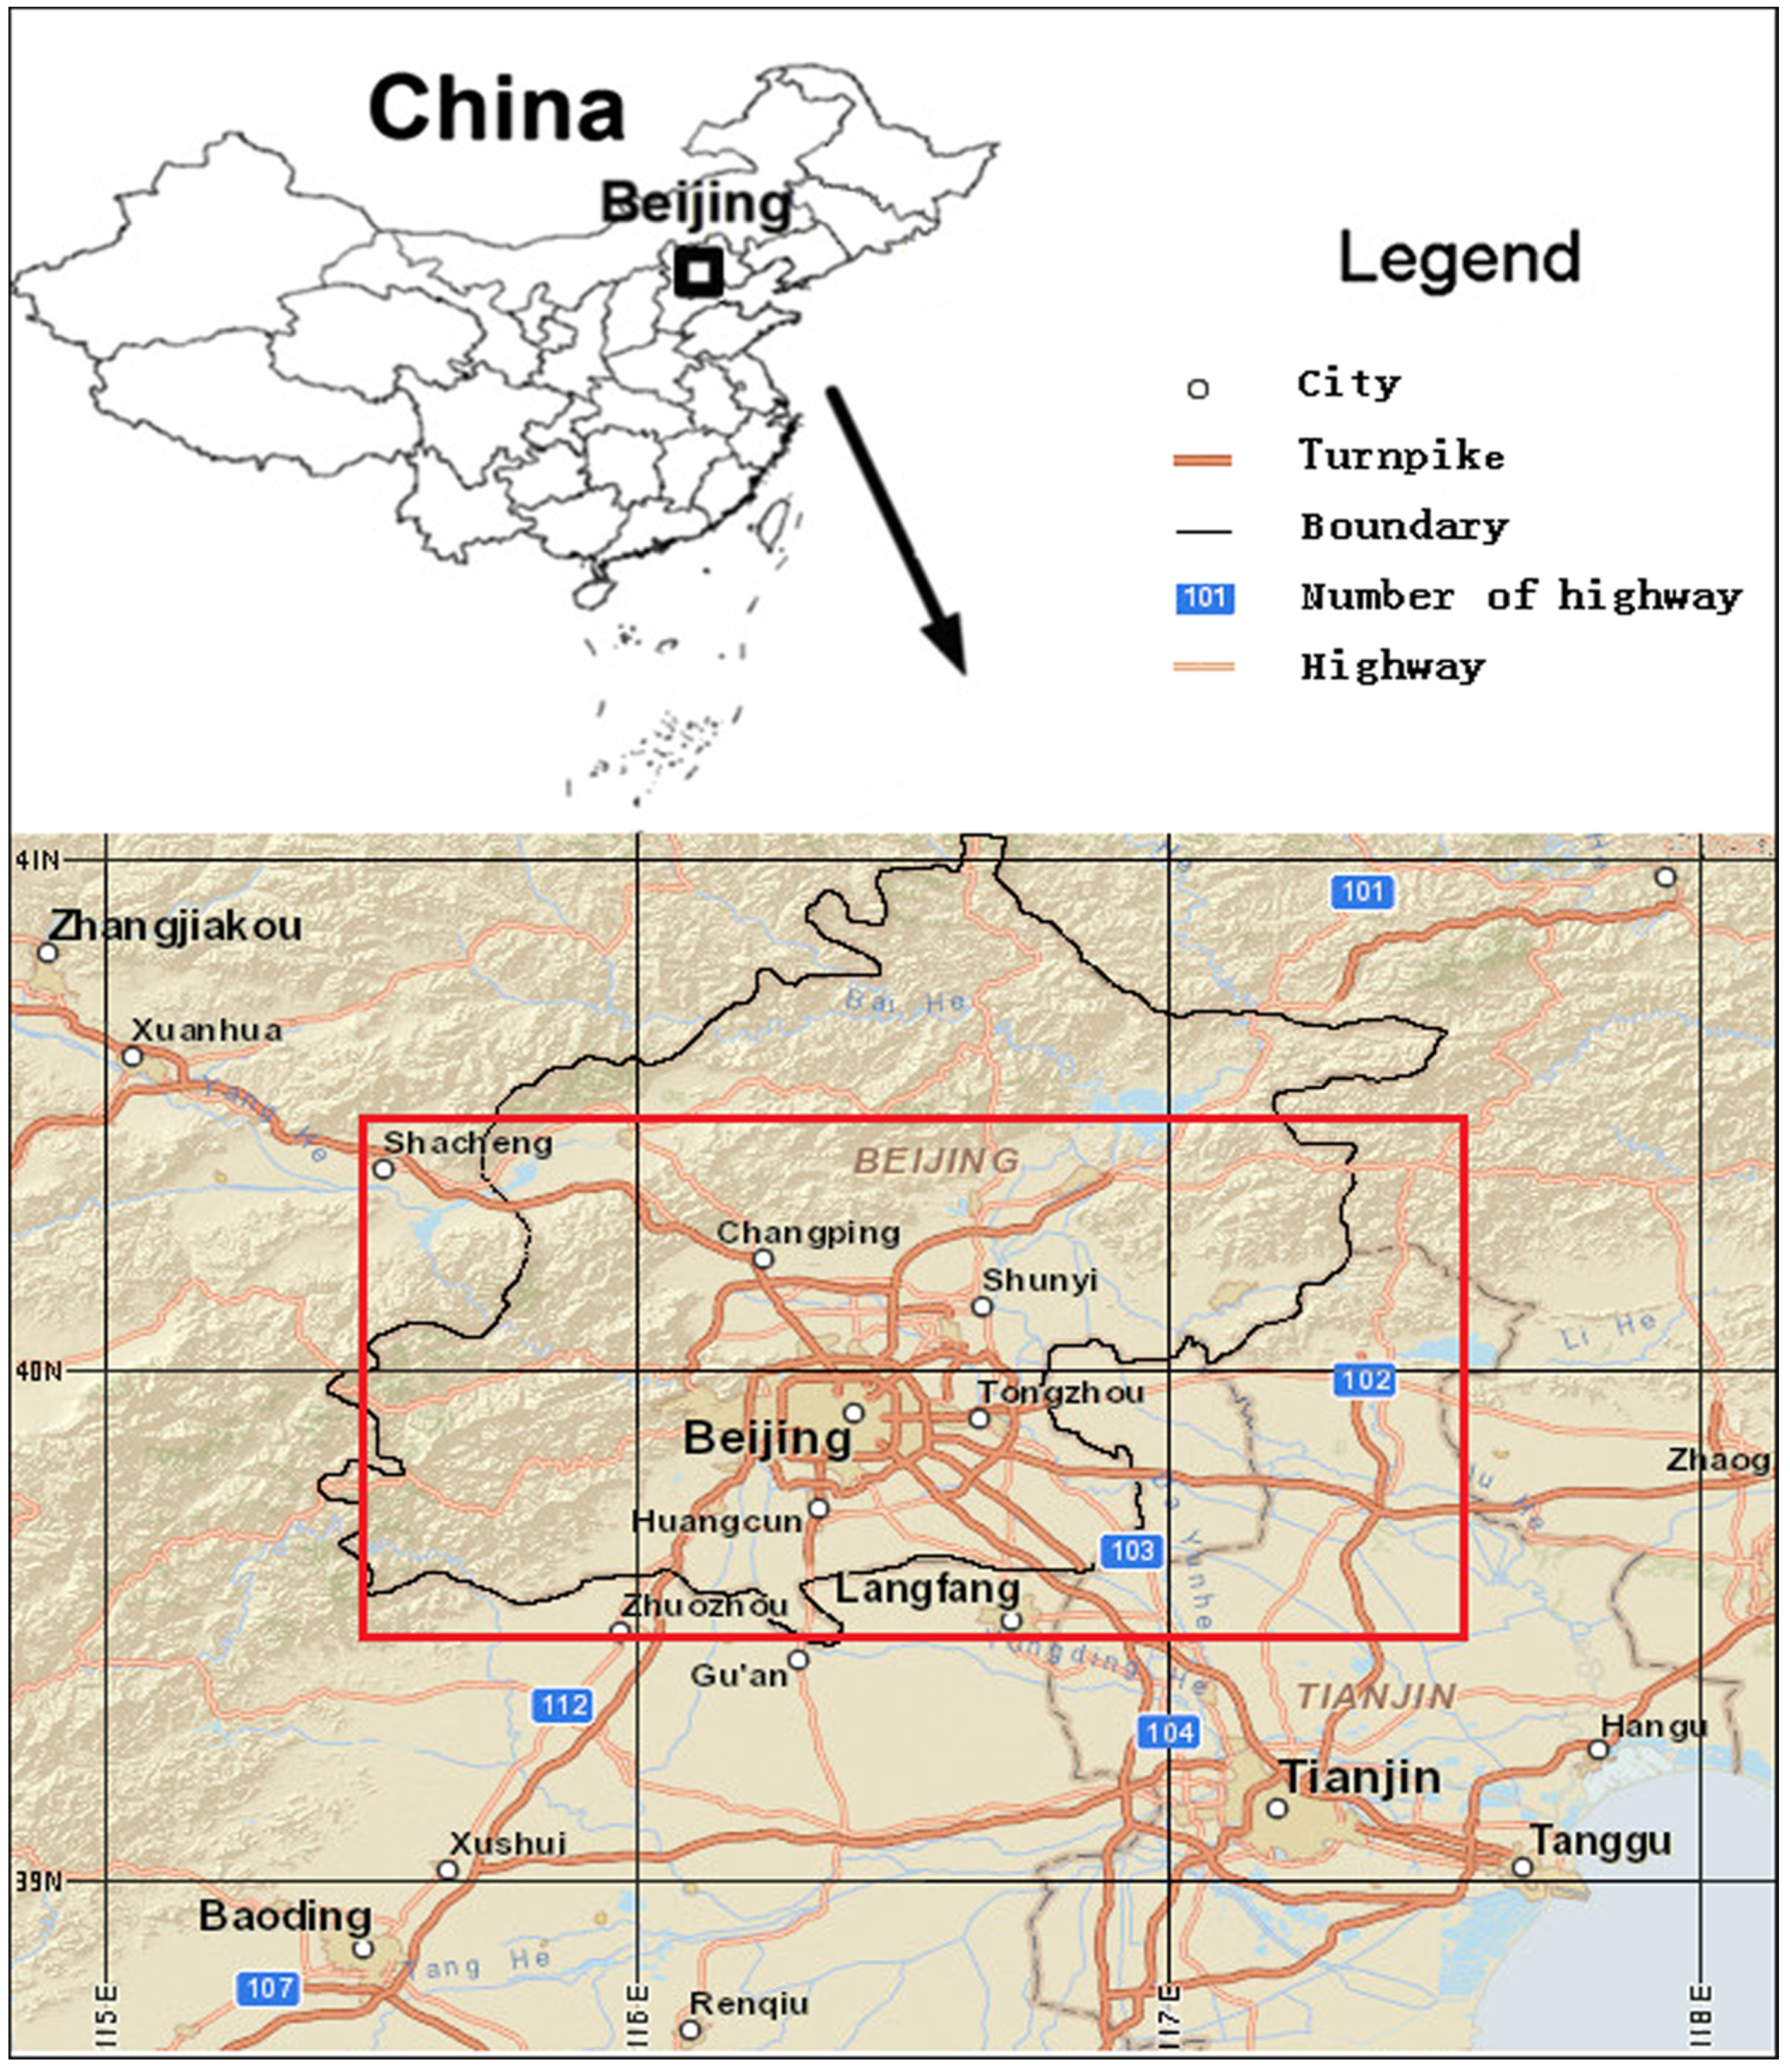
2.2. Data and General Procedures
2.2.1. DMSP-OLS Nighttime Light Data
2.2.2. Daily PM2.5 Average Concentrations
2.2.3. Phase of the Moon and Digitization
| Range of AQI (x: no unit data) | Range of PM2.5 Concentration (C:μg/m3) | Formula |
|---|---|---|
| 0 ≤ x ≤ 100 | 0 ≤ C ≤ 75 | C = 75 × x/100 |
| 100 ≤ x ≤ 150 | 75 ≤ C ≤ 115 | C = (x − 100) × (115 − 75)/(150 − 100) + 75 |
| 150 ≤ x ≤ 200 | 115 ≤ C ≤ 150 | C = (x − 150) × (150 − 115)/(200 − 150) +115 |
| 200 ≤ x ≤ 300 | 150 ≤ C ≤ 250 | C = (x − 200) × (250 − 150)/(300 − 200) + 150 |
| 300 ≤ x ≤ 400 | 250 ≤ C ≤ 350 | C = (x − 300) × (350 − 250)/(400 − 300) + 250 |
| 400 ≤ x ≤ 500 | 350 ≤ C ≤ 500 | C = (x − 400) × (500 − 350)/(500 − 400) + 350 |
| 500 = x | 500 ≤ C | C = 500 |
2.2.4. LANDSAT-8 OLI-TIRS Data of Beijing
2.2.5. Beijing Meteorological Data
2.3. Neural-Network Model Development
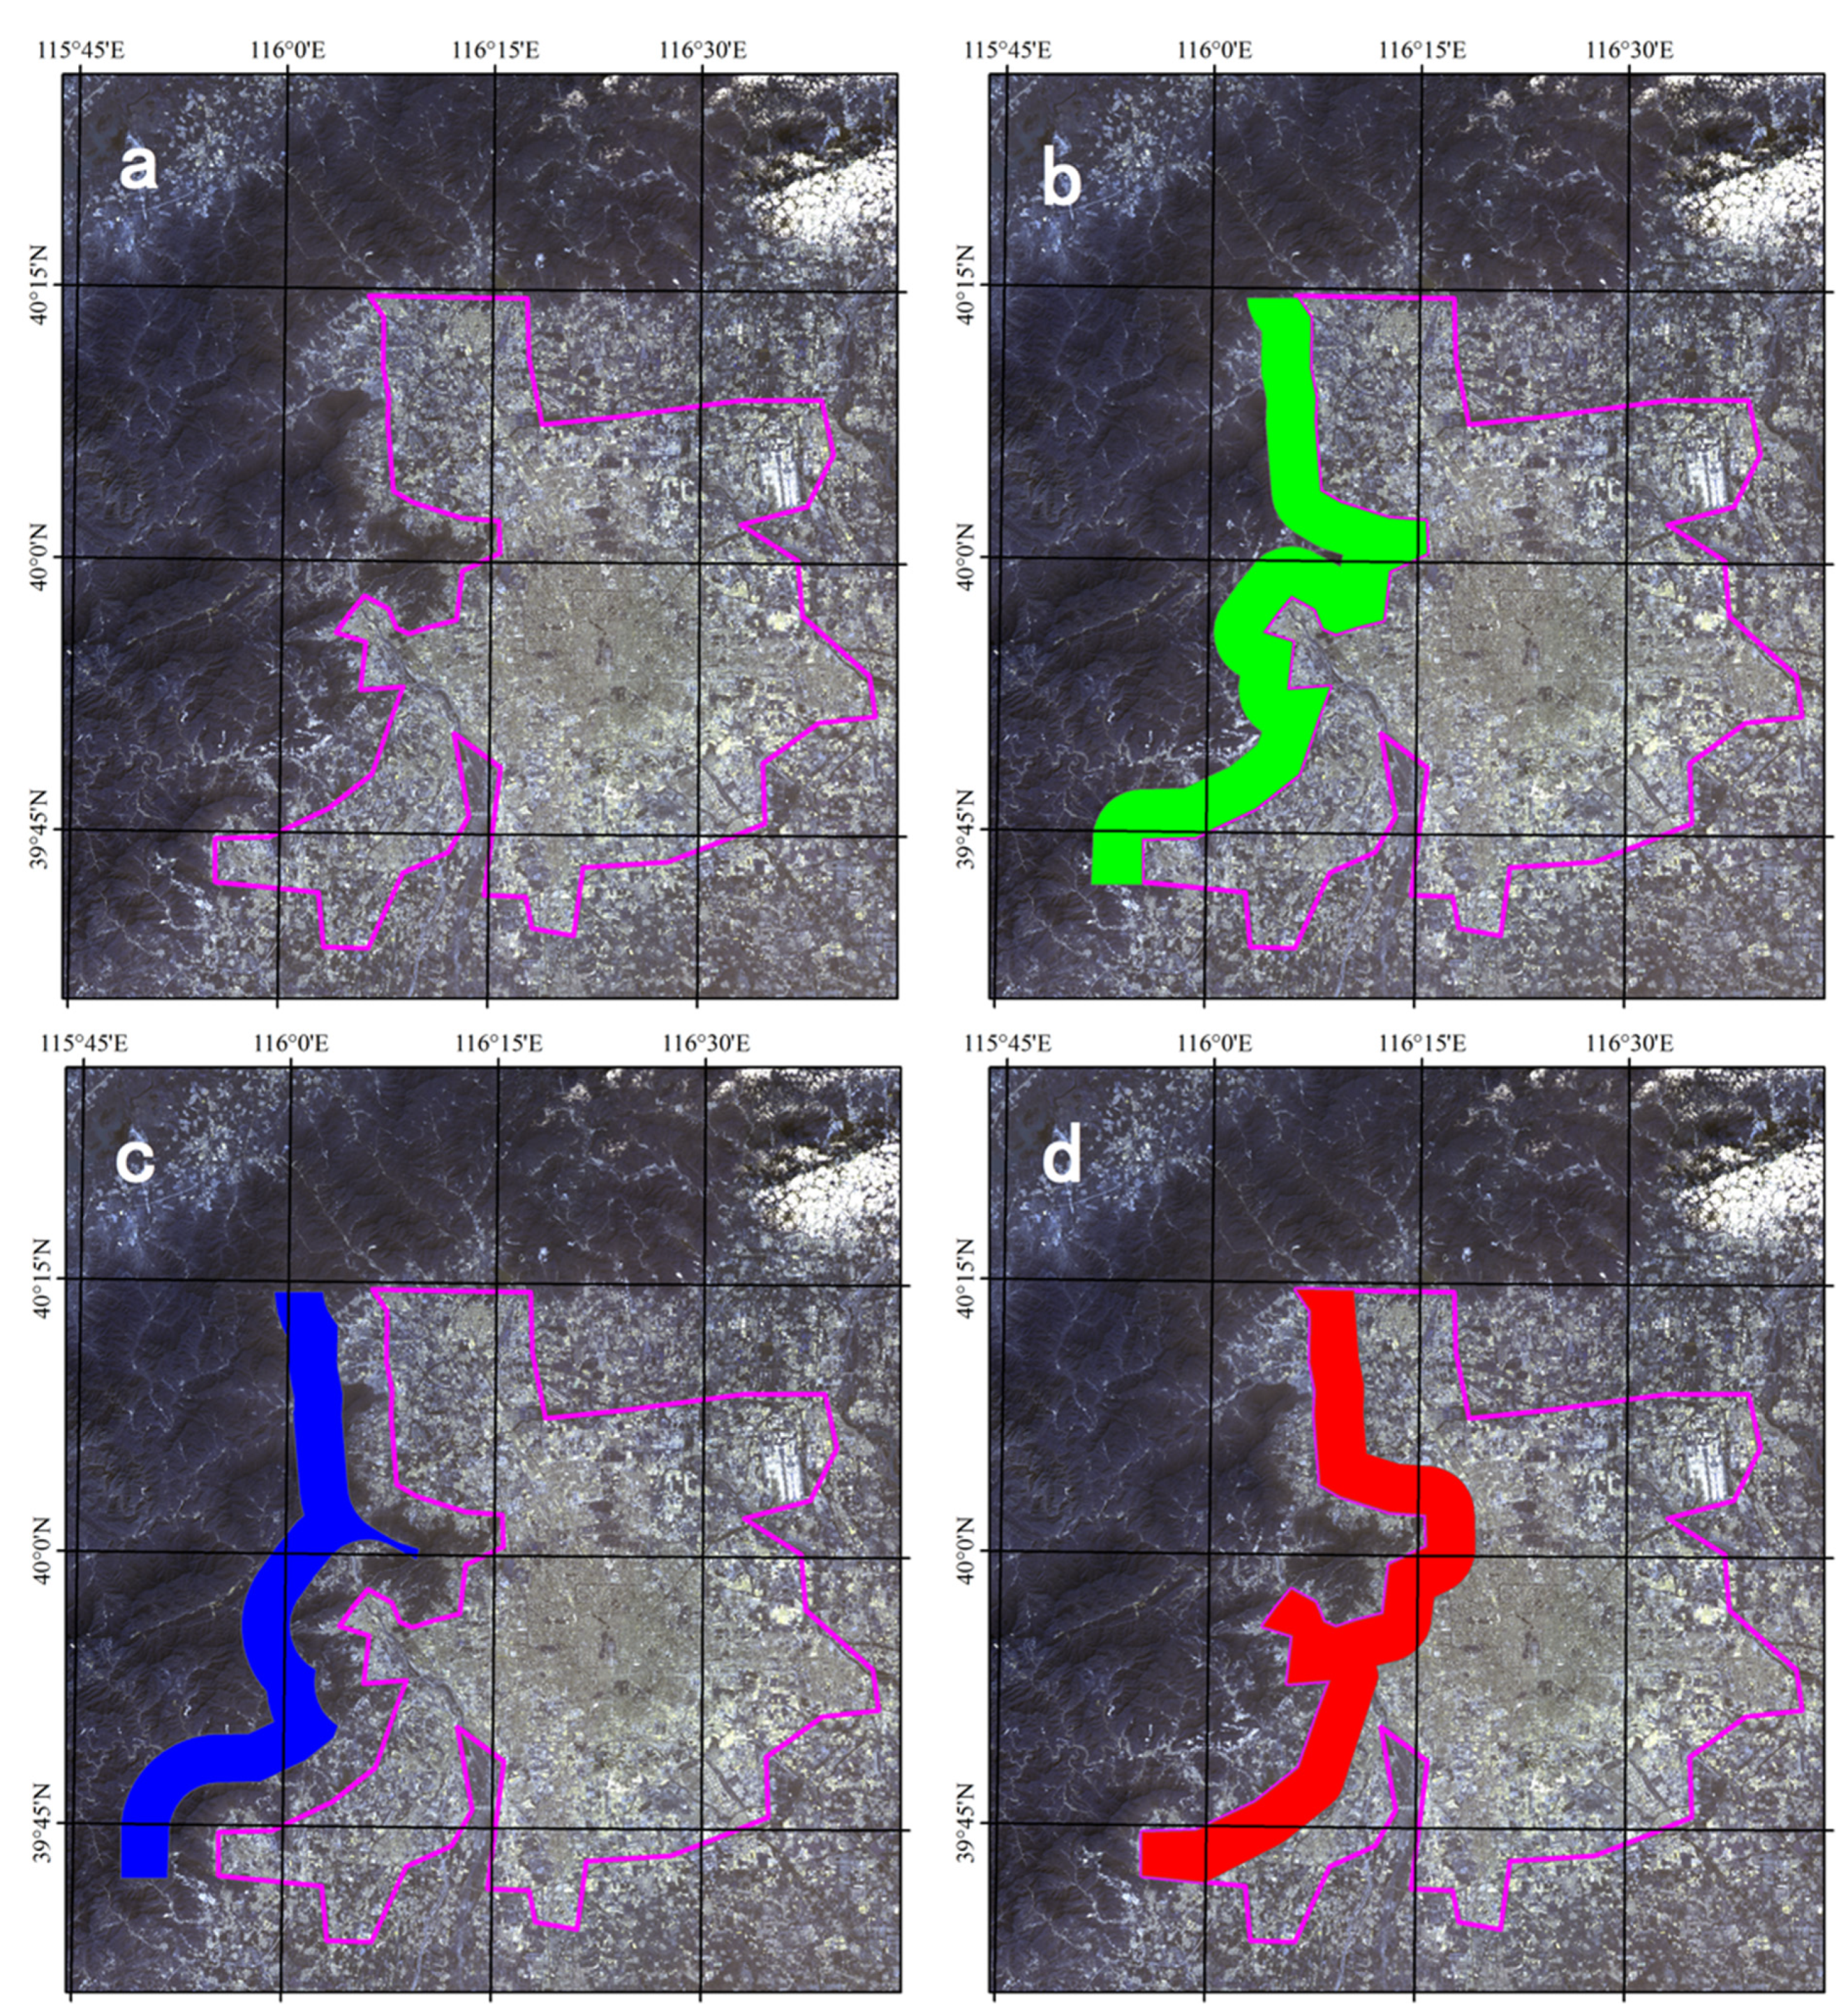
2.3.1. Data Pre-Processing Phase
Division of the DMSP-OLS NTL Data into Four Regions
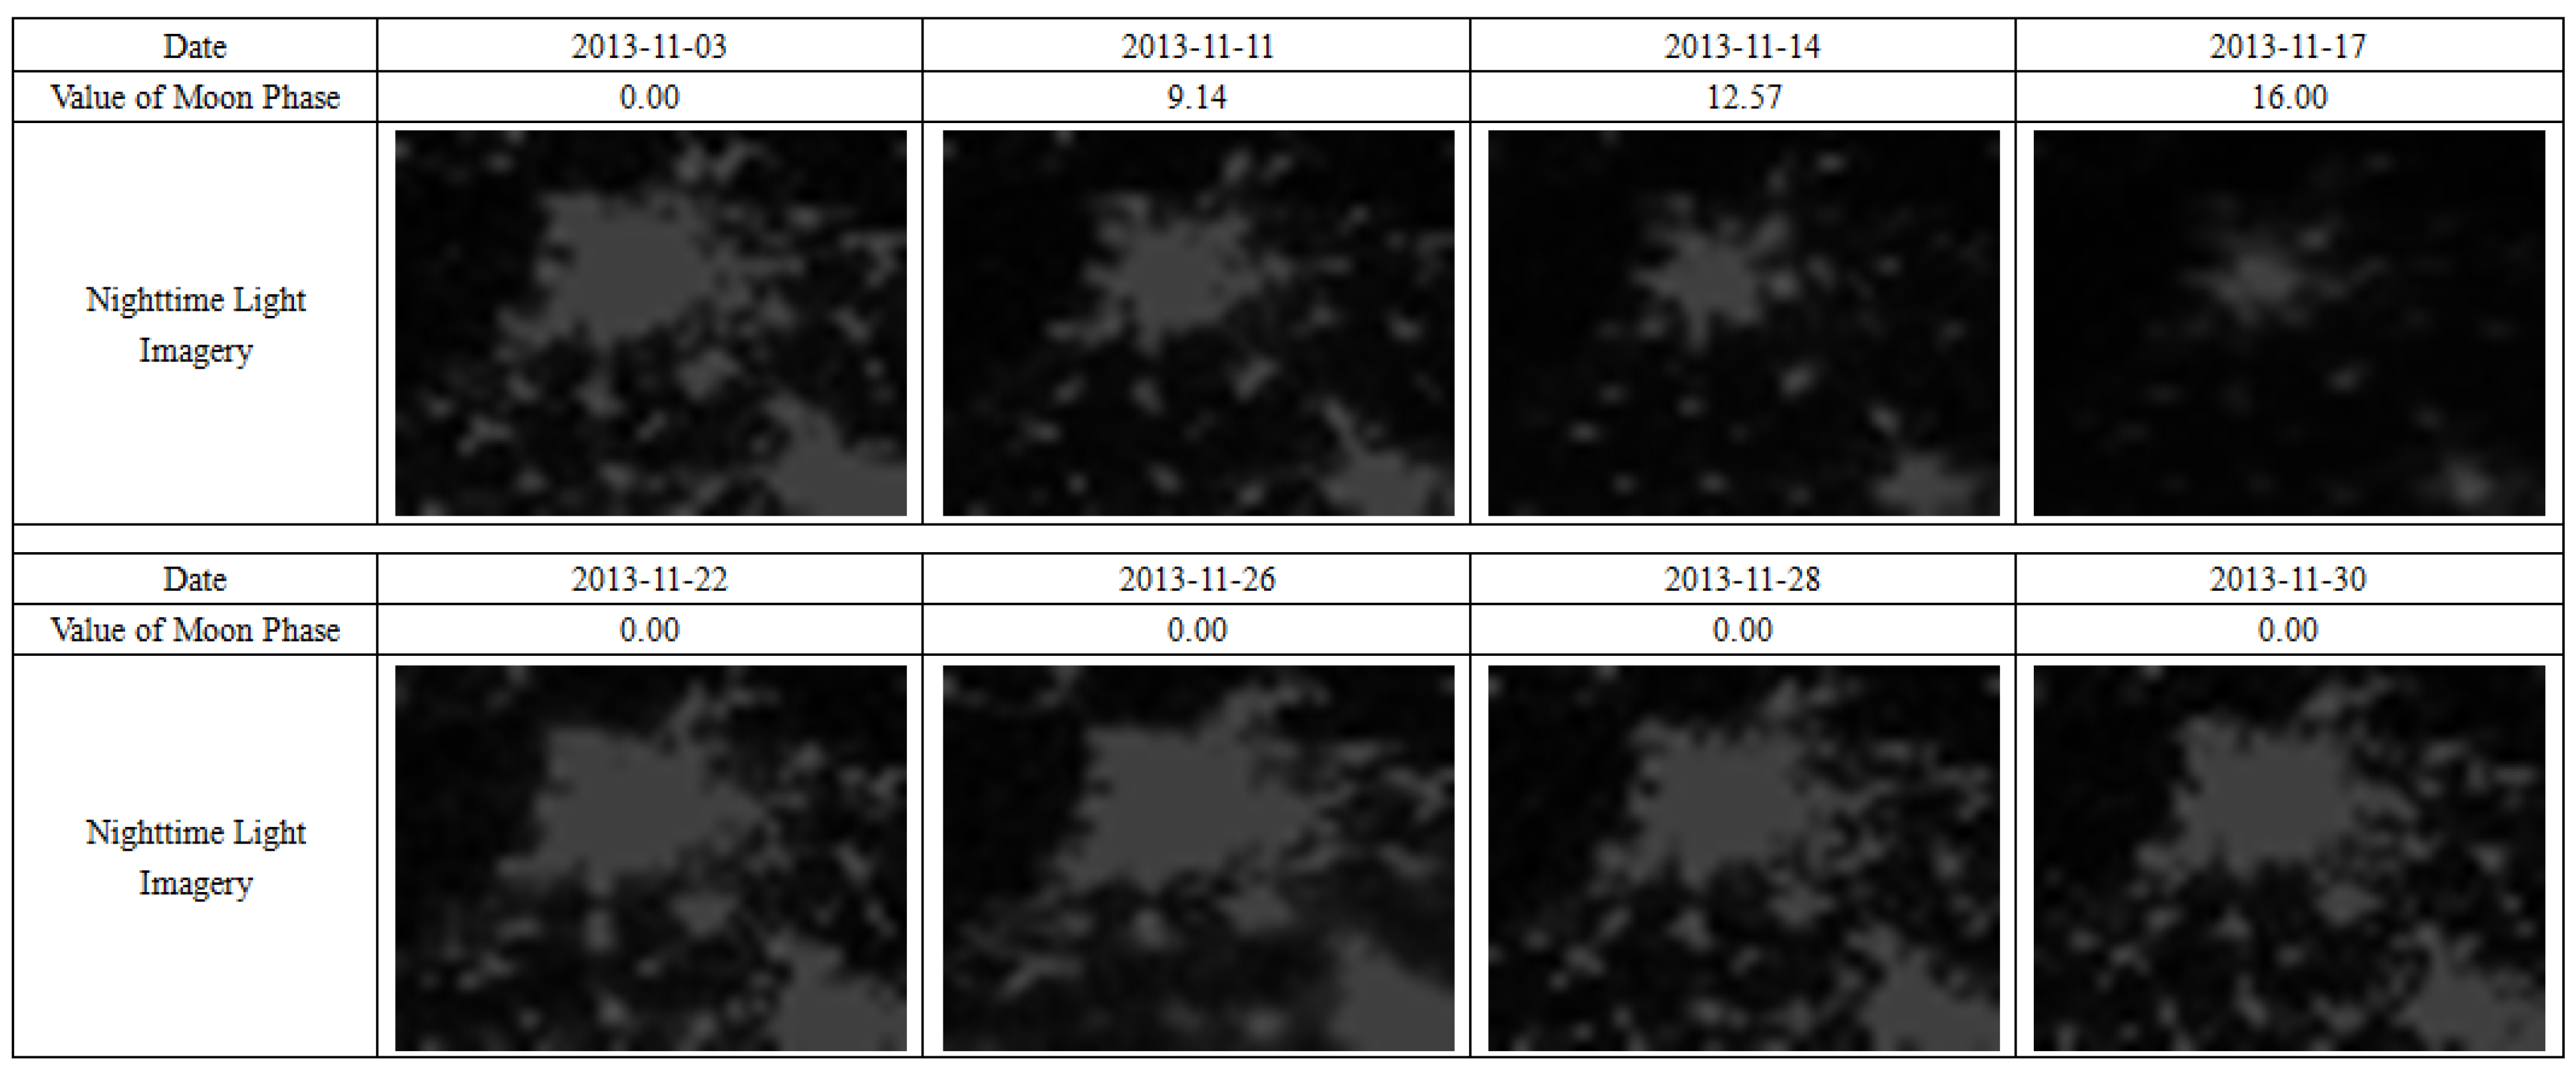
PM2.5 Concentrations Data Corrected By Relative Humidity
2.3.2. Data Normalization
2.3.3. Model Building Phase
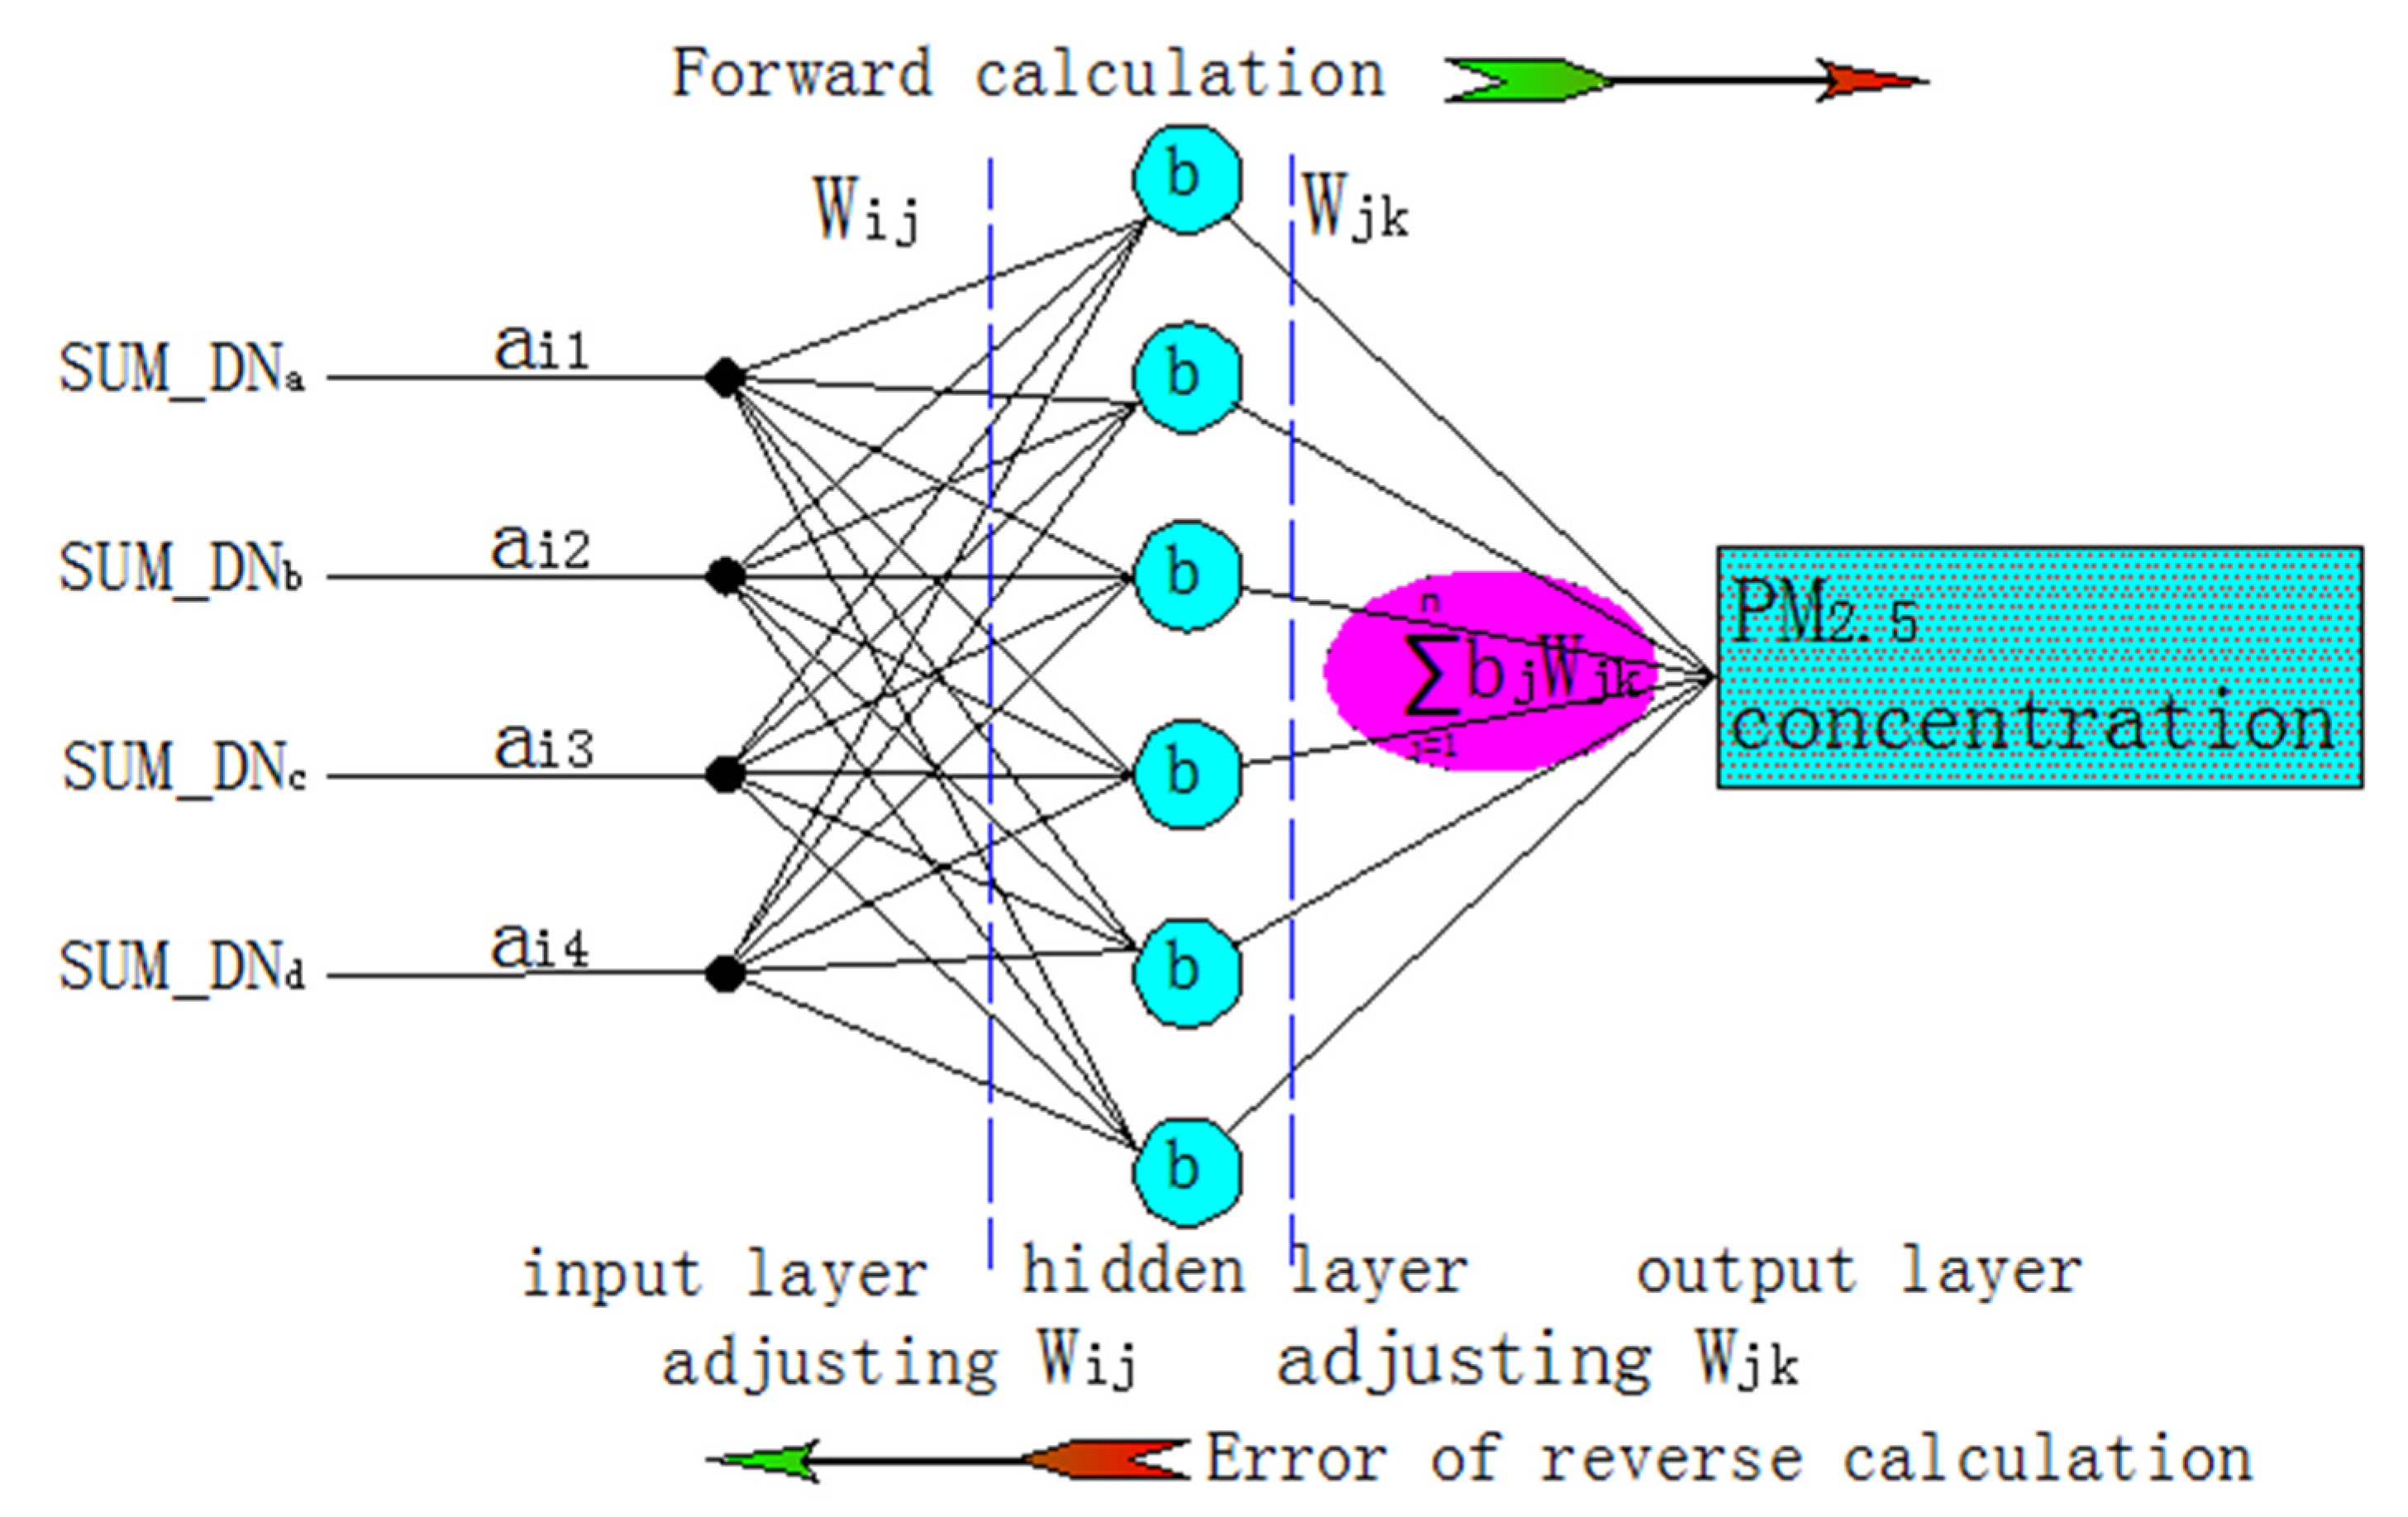
2.3.4. Model Evaluation Phase
3. Results and Discussions
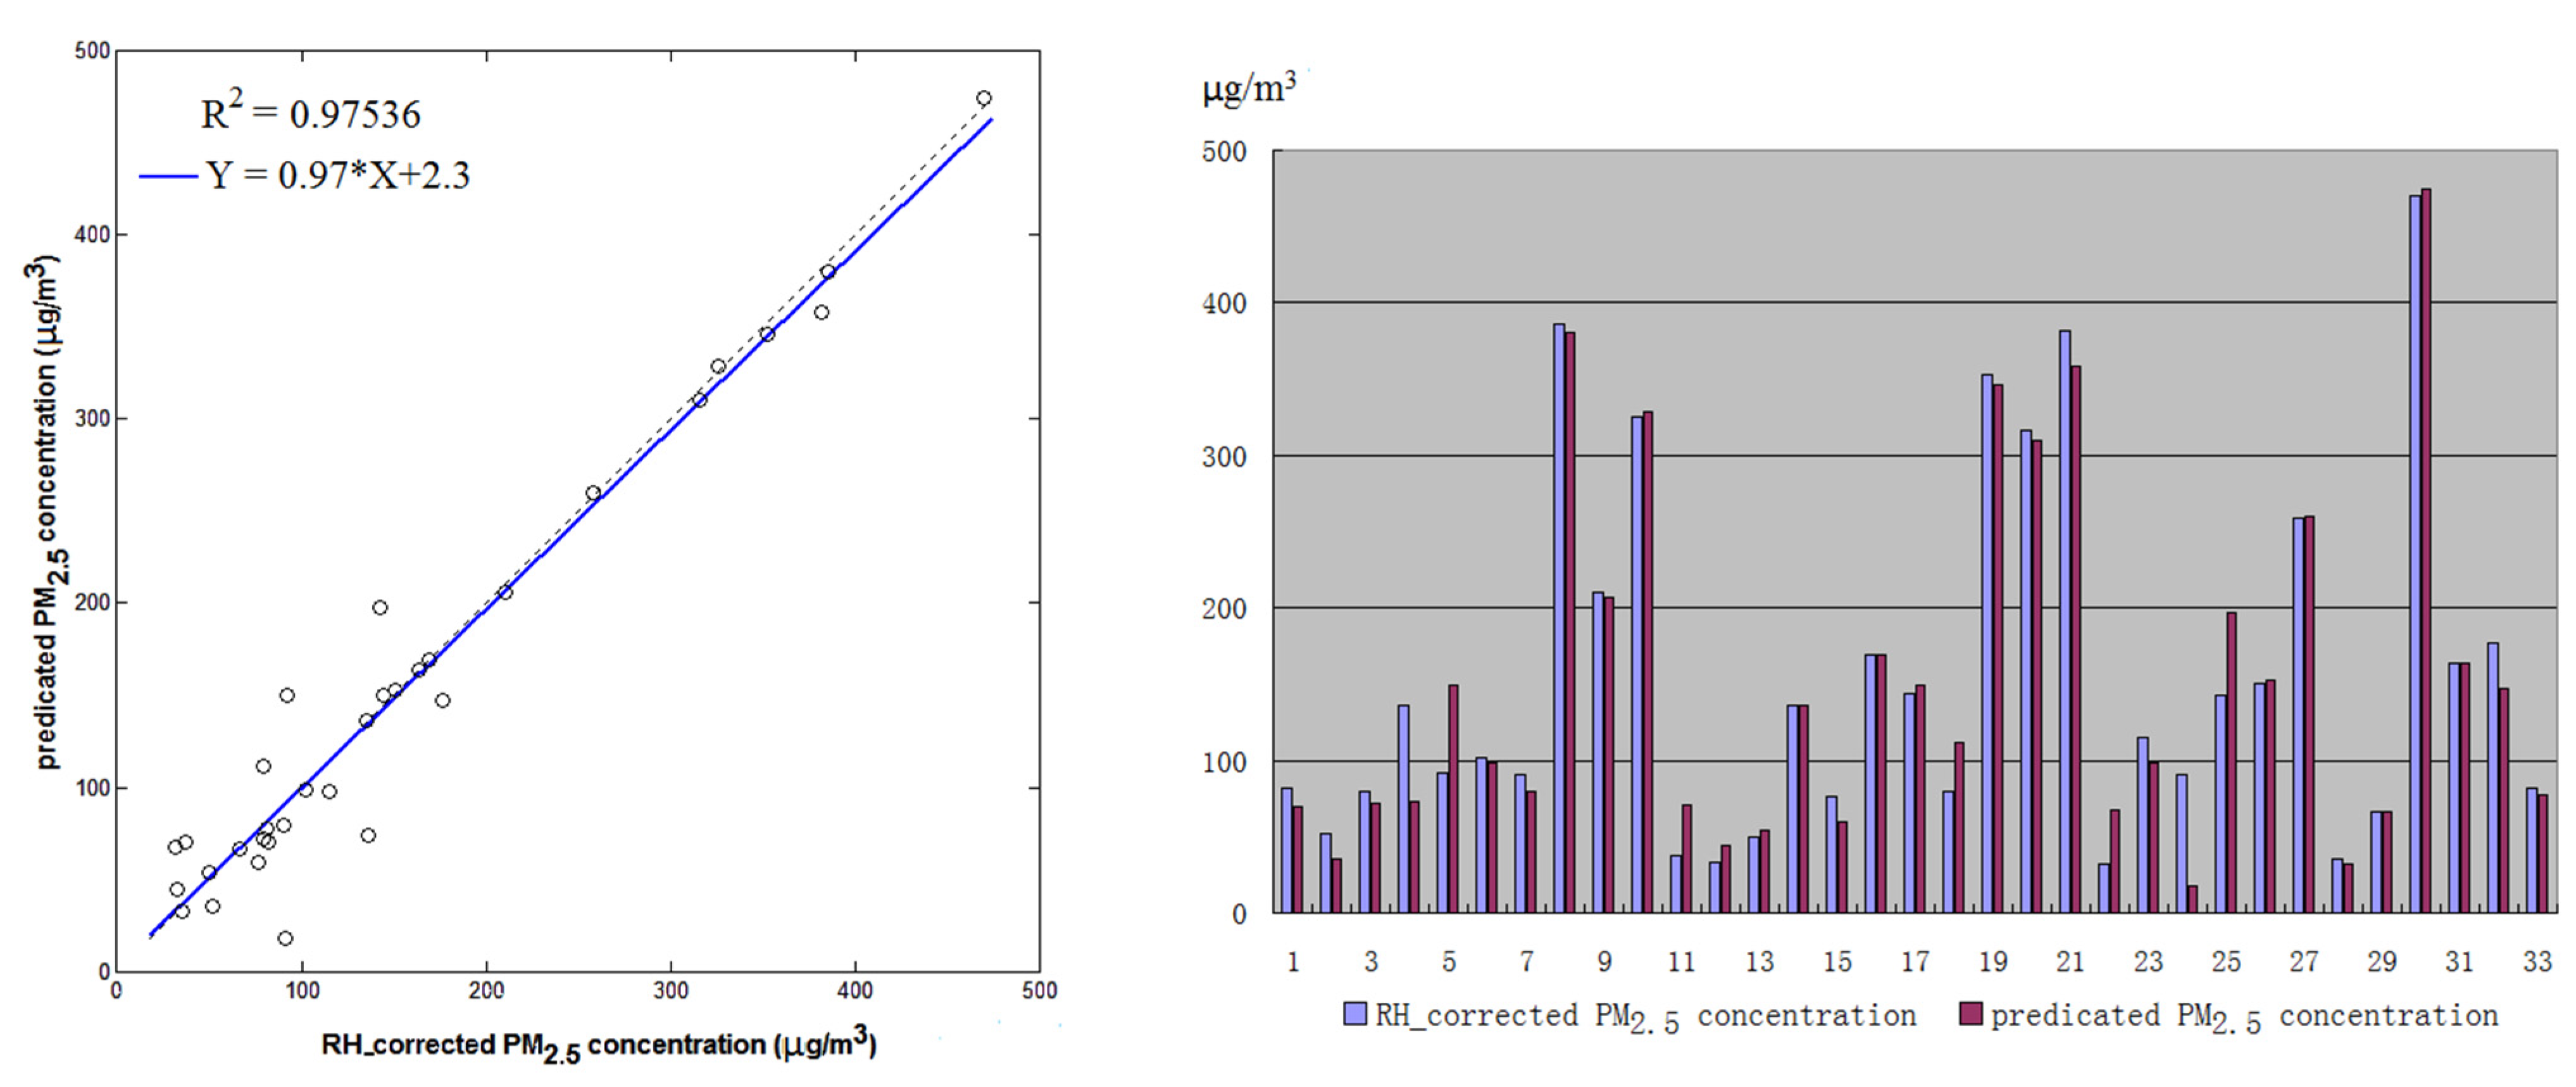
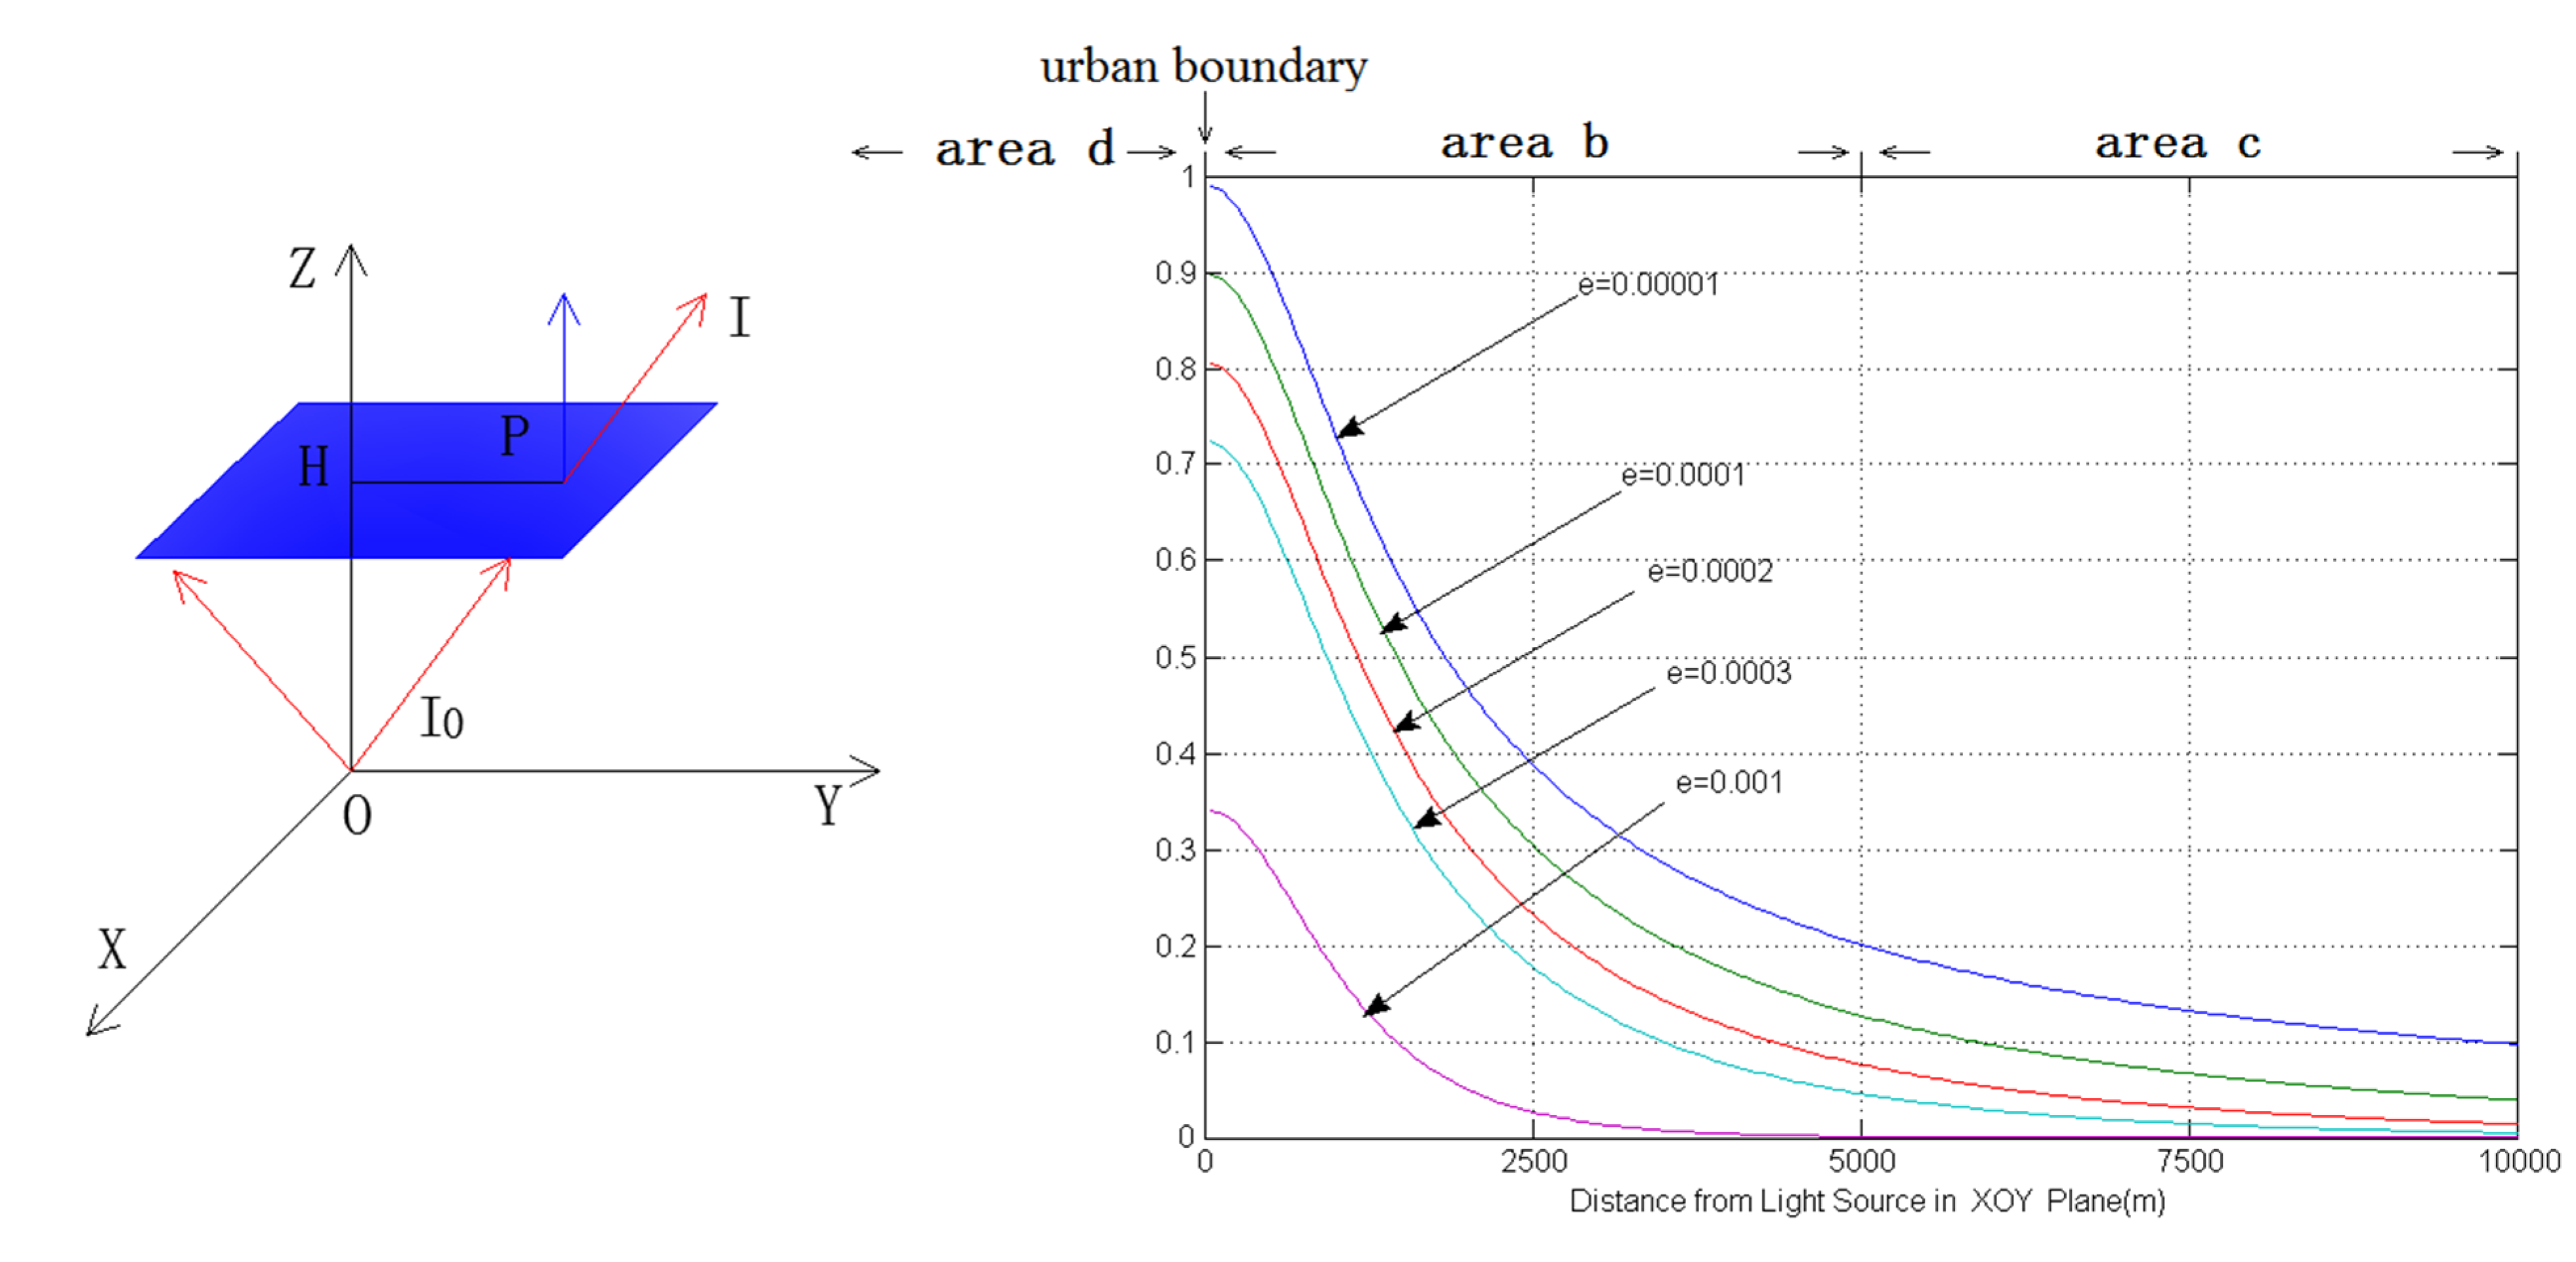
4. Conclusions
Acknowledgments
Author Contributions
Conflicts of Interest
References
- Kaufman, Y.J.; Tanré, D.; Boucher, O. A satellite view of aerosols in the climate system. Nature 2002, 419, 215–223. [Google Scholar] [CrossRef] [PubMed]
- WHO (World Health Organization). Air Quality Guidelines for Europe, 2nd ed.; Chapter 7, WHO Regional Publications, European Series: Geneva, Switzerland, 2000; Volume 91. [Google Scholar]
- Pope, C.A. Review: Epidemiological basis for particulate air pollution health standards. Aerosol Sci. Technol. 2000, 32, 4–14. [Google Scholar] [CrossRef]
- Wallace, L. Correlations of personal exposure to particles with outdoor air measurement: A review of recent studies. Aerosol Sci. Technol. 2000, 32, 15–25. [Google Scholar] [CrossRef]
- Kan, H.D.; Chen, B.H. Analysis of exposure-response relationships of air particulate matter and adverse health outcomes in China. J. Environ. Health 2002, 19, 422–424. (In Chinese) [Google Scholar]
- Li, J.J.; Shao, L.Y.; Yang, S.S. Adverse effect mechanisms of inhalable particulate matters. J. Environ. Health 2006, 3, 185–188. (In Chinese) [Google Scholar]
- Samoli, E.; Peng, R.; Ramsay, T.; Pipikou, M.; Touloumi, G.; Dominici, F.; Burnett, R.; Cohen, A.; Krewski, D.; Samet, J.; et al. Acute effects of ambient particulate matter on mortality in Europe and North America: Results from the APHENA study. Environ. Health. Perspect. 2008, 116, 1480–1486. [Google Scholar] [CrossRef] [PubMed]
- Nastos, P.T.; Paliatsos, A.G.; Anthracopoulos, M.B.; Roma, E.S.; Priftis, K.N. Outdoor particulate matter and childhood asthma admissions in Athens, Greece: A time-series study. Environ. Health 2010, 9. [Google Scholar] [CrossRef]
- Li, C.C.; Mao, J.T.; Lau, A.K.; Liu, X.Y.; Liu, G.Q.; Zhu, A. Research on the air pollution in Beijing and its surroundings with MODIS AOD product. Chin. J. Atmos. Sci. 2003, 27, 869–880. (In Chinese) [Google Scholar]
- Song, Y.; Tang, X.Y.; Fang, C.; Zhang, Y.; Hu, M.; Zeng, L.; Li, C.; Mao, J.; Michael, B. Relationship between the visibility degradation and particle pollution in Beijing. Acta Sci. Circumst. 2003, 23, 468–471. (In Chinese) [Google Scholar]
- The Ministry of Environmental Protection of the People’s Republic of China. Chinese National Standards: Ambient Air Quality Standards (GB3095–2012). Available online: http://bz.mep.gov.cn/bzwb/dqhjbh/dqhjzlbz/201203/t20120302_224165.htm (accessed on 1 May 2014). (In Chinese)
- Remer, L.A.; Kaufman, Y.J.; Tanré, D.; Mattoo, S.; Chu, D.A.; Martins, J.V.; Li, R.-R.; Ichoku, C.; Levy, R.C.; Kleidman, R.G.; et al. The MODIS aerosol algorithm, products, and validation. J. Atmos. Sci. 2005, 62, 947–973. [Google Scholar] [CrossRef]
- King, M.D.; Kaufman, Y.J.; Tanré, D. Remote sensing of tropospheric aerosols from space: Past, present, and future. B Am. Meteorol. Soc. 1999, 80, 2259. [Google Scholar] [CrossRef]
- Chu, D.A.; Kaufman, Y.J.; Zibordi, G.; Chern, J.D.; Mao, J.; Li, C.C.; Holben, B.N. Global monitoring of air pollution over land from the Earth Observing System—Terra Moderate Resolution Imaging Spectroradiometer (MODIS). J. Geophys. Res. 2003, 108, ACH4-1–ACH4-18. [Google Scholar]
- Wang, J.; Christopher, A. Intercomparison between satellite-derived aerosol optical thickness and PM2.5 mass: Implications for air quality studies. Geophys. Res. Lett. 2003, 30, 1–4. [Google Scholar]
- Li, C.C.; Mao, J.T.; Lau, A.K.; Yuan, Z.B.; Wang, M.H.; Liu, X.Y. Application of MODIS satellite product to the air pollution research in Beijing. Sci. China Ser. D 2005, 35, 177–186. [Google Scholar]
- Liu, Y.; Sarnat, J.A.; Kilaru, V.; Jacob, D.J.; Koutrakis, P. Estimating ground-level PM2.5 in the eastern United States using satellite remote sensing. Environ. Sci. Technol. 2005, 39, 3269–3278. [Google Scholar] [CrossRef] [PubMed]
- Doll, C.N.H.; Muller, J.P.; Morley, J.G. Mapping regional economic activity from night-time light satellite imagery. Ecol. Econ. 2006, 57, 75–92. [Google Scholar] [CrossRef]
- Elvidge, C.D.; Sutton, P.C.; Ghosh, T.; Tuttle, B.T.; Baugh, K.E.; Bhaduri, B.; Bright, E. A global poverty map derived from satellite data. Comp. Geosci. 2009, 35, 1652–1660. [Google Scholar] [CrossRef]
- Li, X.; Xu, H.; Chen, X.; Li, C. Potential of NPP-VIIRS nighttime light imagery for modeling the regional economy of China. Remote Sens. 2013, 5, 3057–3081. [Google Scholar] [CrossRef]
- Chen, X.; Nordhaus, W.D. Using luminosity data as a proxy for economic statistics. Proc. Natl. Acad. Sci. USA 2011, 108, 8589–8594. [Google Scholar] [CrossRef] [PubMed]
- Henderson, V.; Storeygard, A.; Weil, D.N. A bright idea for measuring economic growth. Am. Econ. Rev. 2011, 101, 194–199. [Google Scholar] [CrossRef] [PubMed]
- Ghosh, T.; Anderson, S.; Powell, R.L.; Sutton, P.C.; Elvidge, C.D. Estimation of Mexico’s informal economy and remittances using nighttime imagery. Remote Sens. 2009, 1, 418–444. [Google Scholar] [CrossRef]
- Zhuo, L.; Ichinose, T.; Zheng, J.; Chen, J.; Shi, P.J.; Li, X. Modelling the population density of China at the pixel level based on DMSP/OLS non-radiance-calibrated night-time light images. Int. J. Remote Sens. 2009, 30, 1003–1018. [Google Scholar] [CrossRef]
- Bharti, N.; Tatem, A.J.; Ferrari, M.J.; Grais, R.F.; Djibo, A.; Grenfell, B.T. Explaining seasonal fluctuations of measles in Niger using nighttime lights imagery. Science 2011, 334, 1424–1427. [Google Scholar] [CrossRef] [PubMed]
- Zhang, Q.L.; Seto, K.C. Mapping urbanization dynamics at regional and global scales using multi-temporal DMSP/OLS nighttime light data. Remote Sens. Environ. 2011, 115, 2320–2329. [Google Scholar] [CrossRef]
- Small, C.; Pozzi, F.; Elvidge, C.D. Spatial analysis of global urban extent from DMSP-OLS night lights. Remote Sens. Environ. 2005, 96, 277–291. [Google Scholar] [CrossRef]
- Zhang, Q.; Seto, K. Can night-time light data identify typologies of urbanization? A global assessment of successes and failures. Remote Sens. 2013, 5, 3476–3494. [Google Scholar] [CrossRef]
- Prasad, V.K.; Kant, Y.; Gupta, P.K.; Elvidge, C.; Badarinath, K. Biomass burning and related trace gas emissions from tropical dry deciduous forests of India: A study using DMSP-OLS data and ground-based measurements. Int. J. Remote Sens. 2002, 23, 2837–2851. [Google Scholar] [CrossRef]
- Waluda, C.; Yamashirob, C.; Elvidge, C.; Hobson, V.; Rodhouse, P. Quantifying light-fishing for Dosidicus gigas in the eastern Pacific using satellite remote sensing. Remote Sens. Environ. 2004, 91, 129–133. [Google Scholar] [CrossRef]
- Chand, T.R.K.; Badarinath, K.V.S.; Elvidge, C.D.; Tuttle, B.T. Spatial characterization of electrical power consumption patterns over India using temporal DMSP-OLS night-time satellite data. Int. J. Remote Sens. 2009, 30, 647–661. [Google Scholar] [CrossRef]
- Agnew, J.; Gillespie, T.W.; Gonzalez, J.; Min, B. Baghdad nights: Evaluating the US military “surge” using nighttime light signatures. Environ. Plan. A 2008, 40, 2285–2295. [Google Scholar] [CrossRef]
- Aubrecht, C.; Elvidge, C.; Longcore, T.; Rich, C.; Safran, J.; Strong, A.; Eakin, C.; Baugh, K.; Tuttle, B.; Howard, A. A global inventory of coral reef stressors based on satellite observed nighttime lights. Geocarto Int. 2008, 23, 467–479. [Google Scholar] [CrossRef]
- Liu, Y.; He, K.B.; Li, S.S.; Wang, Z.X.; David, C.C.; Petros, K. A statistical model to evaluate the effectiveness of PM2.5 emissions control during the Beijing 2008 Olympic Games. Environ. Int. 2012, 44, 100–105. [Google Scholar] [CrossRef] [PubMed]
- Elvidge, C.D.; Baugh, K.E.; Kihn, E.A.; Kroehl, H.W.; Davis, E.R. Mapping city lights with nighttime data from the DMSP operational linescan system. Photogramm. Eng. Remote Sens. 1997, 63, 727–734. [Google Scholar]
- NGDC. The National Geophysical Data Center. Available online: http://maps.ngdc. noaa.gov/viewers/dmsp_mosaic/ (accessed on 6 February 2014).
- The Beijing Municipal Environmental Protection Bureau. Available online: http://wsbs.bjepb.gov.cn/air2008/Air.aspx (accessed on 8 February 2014).
- The Ministry of Environmental Protection of the People’s Republic of China. Chinese National Environmental Protection Standards: Technical Regulation on Ambient Air Quality Index (on trial) (HJ 633–2012). Available online: http://bz.mep.gov.cn/bzwb/dqhjbh/jcgfffbz/201203/t20120302_224166.htm (accessed on 1 May 2014). (In Chinese)
- The Internet Observatory of China. Available online: http://www.astron.ac.cn/list-72-1.htm (accessed on 10 February 2014).
- The CalSky website. Available online: http://www.calsky.com/cs.cgi (accessed on 10 February 2014).
- GSCloud, Computer Network Information Center, Chinese Academy of Sciences. Available online: http://www.gscloud.cn/ (accessed on 1 May 2014).
- The National Meteorological Information Center of China. Available online: http://cdc.nmic.cn/ (accessed on 1 March 2015).
- Elvidge, C.D.; Baugh, K.E.; Dietz, J.B.; Bland, T.; Sutton, P.C.; Herbert, W.K. Radiance Calibration of DMSP-OLS Low-Light Imaging Data of Human Settlements. Remote Sens. Environ. 1999, 68, 77–88. [Google Scholar] [CrossRef]
- Thomas, A. Croft. The Brightness of Lights on Earth at Night, Digitally Recorded by DMSP Satellite. Available online: http://ngdc.noaa.gov/eog/dmsp_docs.html (accessed on 1 May 2014).
- Kit, Y.C.; Le, J. Identification of significant factors for air pollution levels using a neural network based knowledge discovery system. Neurocomputing 2003, 99, 564–569. [Google Scholar]
- Lu, F.; Liu, J.G.; Lu, Y.H.; Zhan, K.; Wang, Y.P.; Chen, J. Design of real-time ambient particulate monitoring system based on TEOM technology. J. Atmos. Environ. Opt. 2007, 2, 361–365. [Google Scholar]
- Kotchenruther, R.A.; Hobbs, P.V.; Hegg, D.A. Humidification factors for atmospheric aerosols off the mid-Atlantic coast of the United States. J. Geophys. Res. 1999, 104, 2239–2251. [Google Scholar] [CrossRef]
- Im, J.; Saxena, V.K.; Wenny, B.N. An assessment of hygroscopic growth factors for aerosols in the surface boundary layer for computing direct radiative forcing. J. Geophys. Res. 2001, 106, 20213–20224. [Google Scholar] [CrossRef]
- Pachepsky, V.; Timlin, A.D.; Varallyay, G. Artificial neural networks to estimates oil water retention from easily measurable data. Soil Sci. Soc. Am. J. 1996, 60, 727–733. [Google Scholar] [CrossRef]
- Pal, N.R.; Pal, S.; Das, J.; Majumdar, K. SOFM-MLP: A hybrid neural network for atmospheric temperature prediction. IEEE Trans. Geosci. Remote. Sens. 2003, 41, 2783–2791. [Google Scholar] [CrossRef]
- Plate, T.; Bert, J.; Grace, J.; Band, P. Visualizing the function computed by a feed forward neural network. Neural Comput. 2000, 12, 1355–1370. [Google Scholar] [CrossRef] [PubMed]
- Tumbo, S.D.; Wagner, D.G.; Heinemann, P.H. Hyperspectral-based neural network for predicting chlorophyll status in corn. T. ASAE 2002, 45, 825–832. [Google Scholar]
- Ali, M.M.; Swain, D.; Weller, R.A. Estimation of ocean subsurface thermal structure from surface parameters: A neural network approach. Geophys. Res. Lett. 2004, 31, L20308. [Google Scholar] [CrossRef]
- Moustris, K.P.; Larissi, I.K.; Nastos, P.T.; Koukouletsos, K.V.; Paliatsos, A.G. Development and Application of Artificial Neural Network Modeling in Forecasting PM10 Levels in a Mediterranean City. Water Air Soil Pollut. 2013, 224, 1–11. [Google Scholar] [CrossRef]
- Gautam, R.; Panigrahi, S.; Franzen, D. Neural network optimization of remotely sensed maize leaf nitrogen with a genetic algorithm and linear programming using five performance parameters. Biosyst. Eng. 2006, 95, 359–370. [Google Scholar] [CrossRef]
- Henderson, M.; Yeh, E.T.; Gong, P.; Elvidge, C.; Baugh, K. Validation of urban boundaries derived from global night-time satellite imagery. Int. J. Remote Sens. 2003, 24, 595–609. [Google Scholar] [CrossRef]
- He, X.; Deng, Z.Z.; Li, C.C.; Alexis, K.L.; Wang, M.H.; Liu, X.Y.; Mao, J.T. Research on Application of MODIS aerosol optical thickness products in the ground PM10 monitoring. Acta Sci. Nat. Univ. Pekin. 2010, 2, 178–184. (In Chinese) [Google Scholar]
- Elvidge, C.D.; Baugh, K.E.; Zhizhi, M.; Hsu, F.-C. Why VIIRS data are superior to DMSP for mapping nighttime lights. Proc. Asia Pac. Adv. Netw. 2013, 35, 62–69. [Google Scholar] [CrossRef]
- Miller, S.D.; Straka, W.; Mills, S.P.; Elvidge, C.D.; Lee, T.F.; Solbrig, J.; Walther, A.; Heidinger, A.K.; Weiss, S.C. Illuminating the capabilities of the suomi national polar-orbiting partnership (NPP) visible infrared imaging radiometer suite (VIIRS) day/night band. Remote Sens. 2013, 5, 6717–6766. [Google Scholar] [CrossRef]
- Kaifang, S.; Bailang, Y.; Yixiu, H.; Yingjie, H.; Bing, Y.; Zuoqi, C.; Liujia, C.; Jianping, W. Evaluating the Ability of NPP-VIIRS Nighttime Light Data to Estimate the Gross Domestic Product and the Electric Power Consumption of China at Multiple Scales: A Comparison with DMSP-OLS Data. Remote Sens. 2014, 6, 1705–1724. [Google Scholar] [CrossRef]
- Noam, L.; Kasper, J.; Jorg, M.H.; Stuart, P. A newsource for high spatial resolution night time images—The EROS-B commercial satellite. Remote Sens. Environ. 2014, 149, 1–12. [Google Scholar] [CrossRef]
- Christopher, C.M.K.; Stefanie, G.; Helga, K.; Alejandro, S.M.; Jaime, Z.; Jürgen, F.; Franz, H. High-Resolution Imagery of Earth at Night: New Sources, Opportunities and Challenges. Remote Sens. 2015, 7, 1–23. [Google Scholar]
© 2015 by the authors; licensee MDPI, Basel, Switzerland. This article is an open access article distributed under the terms and conditions of the Creative Commons Attribution license (http://creativecommons.org/licenses/by/4.0/).
Share and Cite
Li, R.; Liu, X.; Li, X. Estimation of the PM2.5 Pollution Levels in Beijing Based on Nighttime Light Data from the Defense Meteorological Satellite Program-Operational Linescan System. Atmosphere 2015, 6, 607-622. https://doi.org/10.3390/atmos6050607
Li R, Liu X, Li X. Estimation of the PM2.5 Pollution Levels in Beijing Based on Nighttime Light Data from the Defense Meteorological Satellite Program-Operational Linescan System. Atmosphere. 2015; 6(5):607-622. https://doi.org/10.3390/atmos6050607
Chicago/Turabian StyleLi, Runya, Xiangnan Liu, and Xuqing Li. 2015. "Estimation of the PM2.5 Pollution Levels in Beijing Based on Nighttime Light Data from the Defense Meteorological Satellite Program-Operational Linescan System" Atmosphere 6, no. 5: 607-622. https://doi.org/10.3390/atmos6050607
APA StyleLi, R., Liu, X., & Li, X. (2015). Estimation of the PM2.5 Pollution Levels in Beijing Based on Nighttime Light Data from the Defense Meteorological Satellite Program-Operational Linescan System. Atmosphere, 6(5), 607-622. https://doi.org/10.3390/atmos6050607


