
Effects of Aerosol on Cloud Liquid Water Path: Statistical Method a Potential Source for Divergence in Past Observation Based Correlative Studies

Abstract
:List of Symbols
| AOD | Aerosol Optical Depth |
| LTSS | Lower Tropospheric Static Stability |
| WV | Water Vapor |
| CWP | Cloud Water Path |
| AAI | Absorbing Aerosol Index |
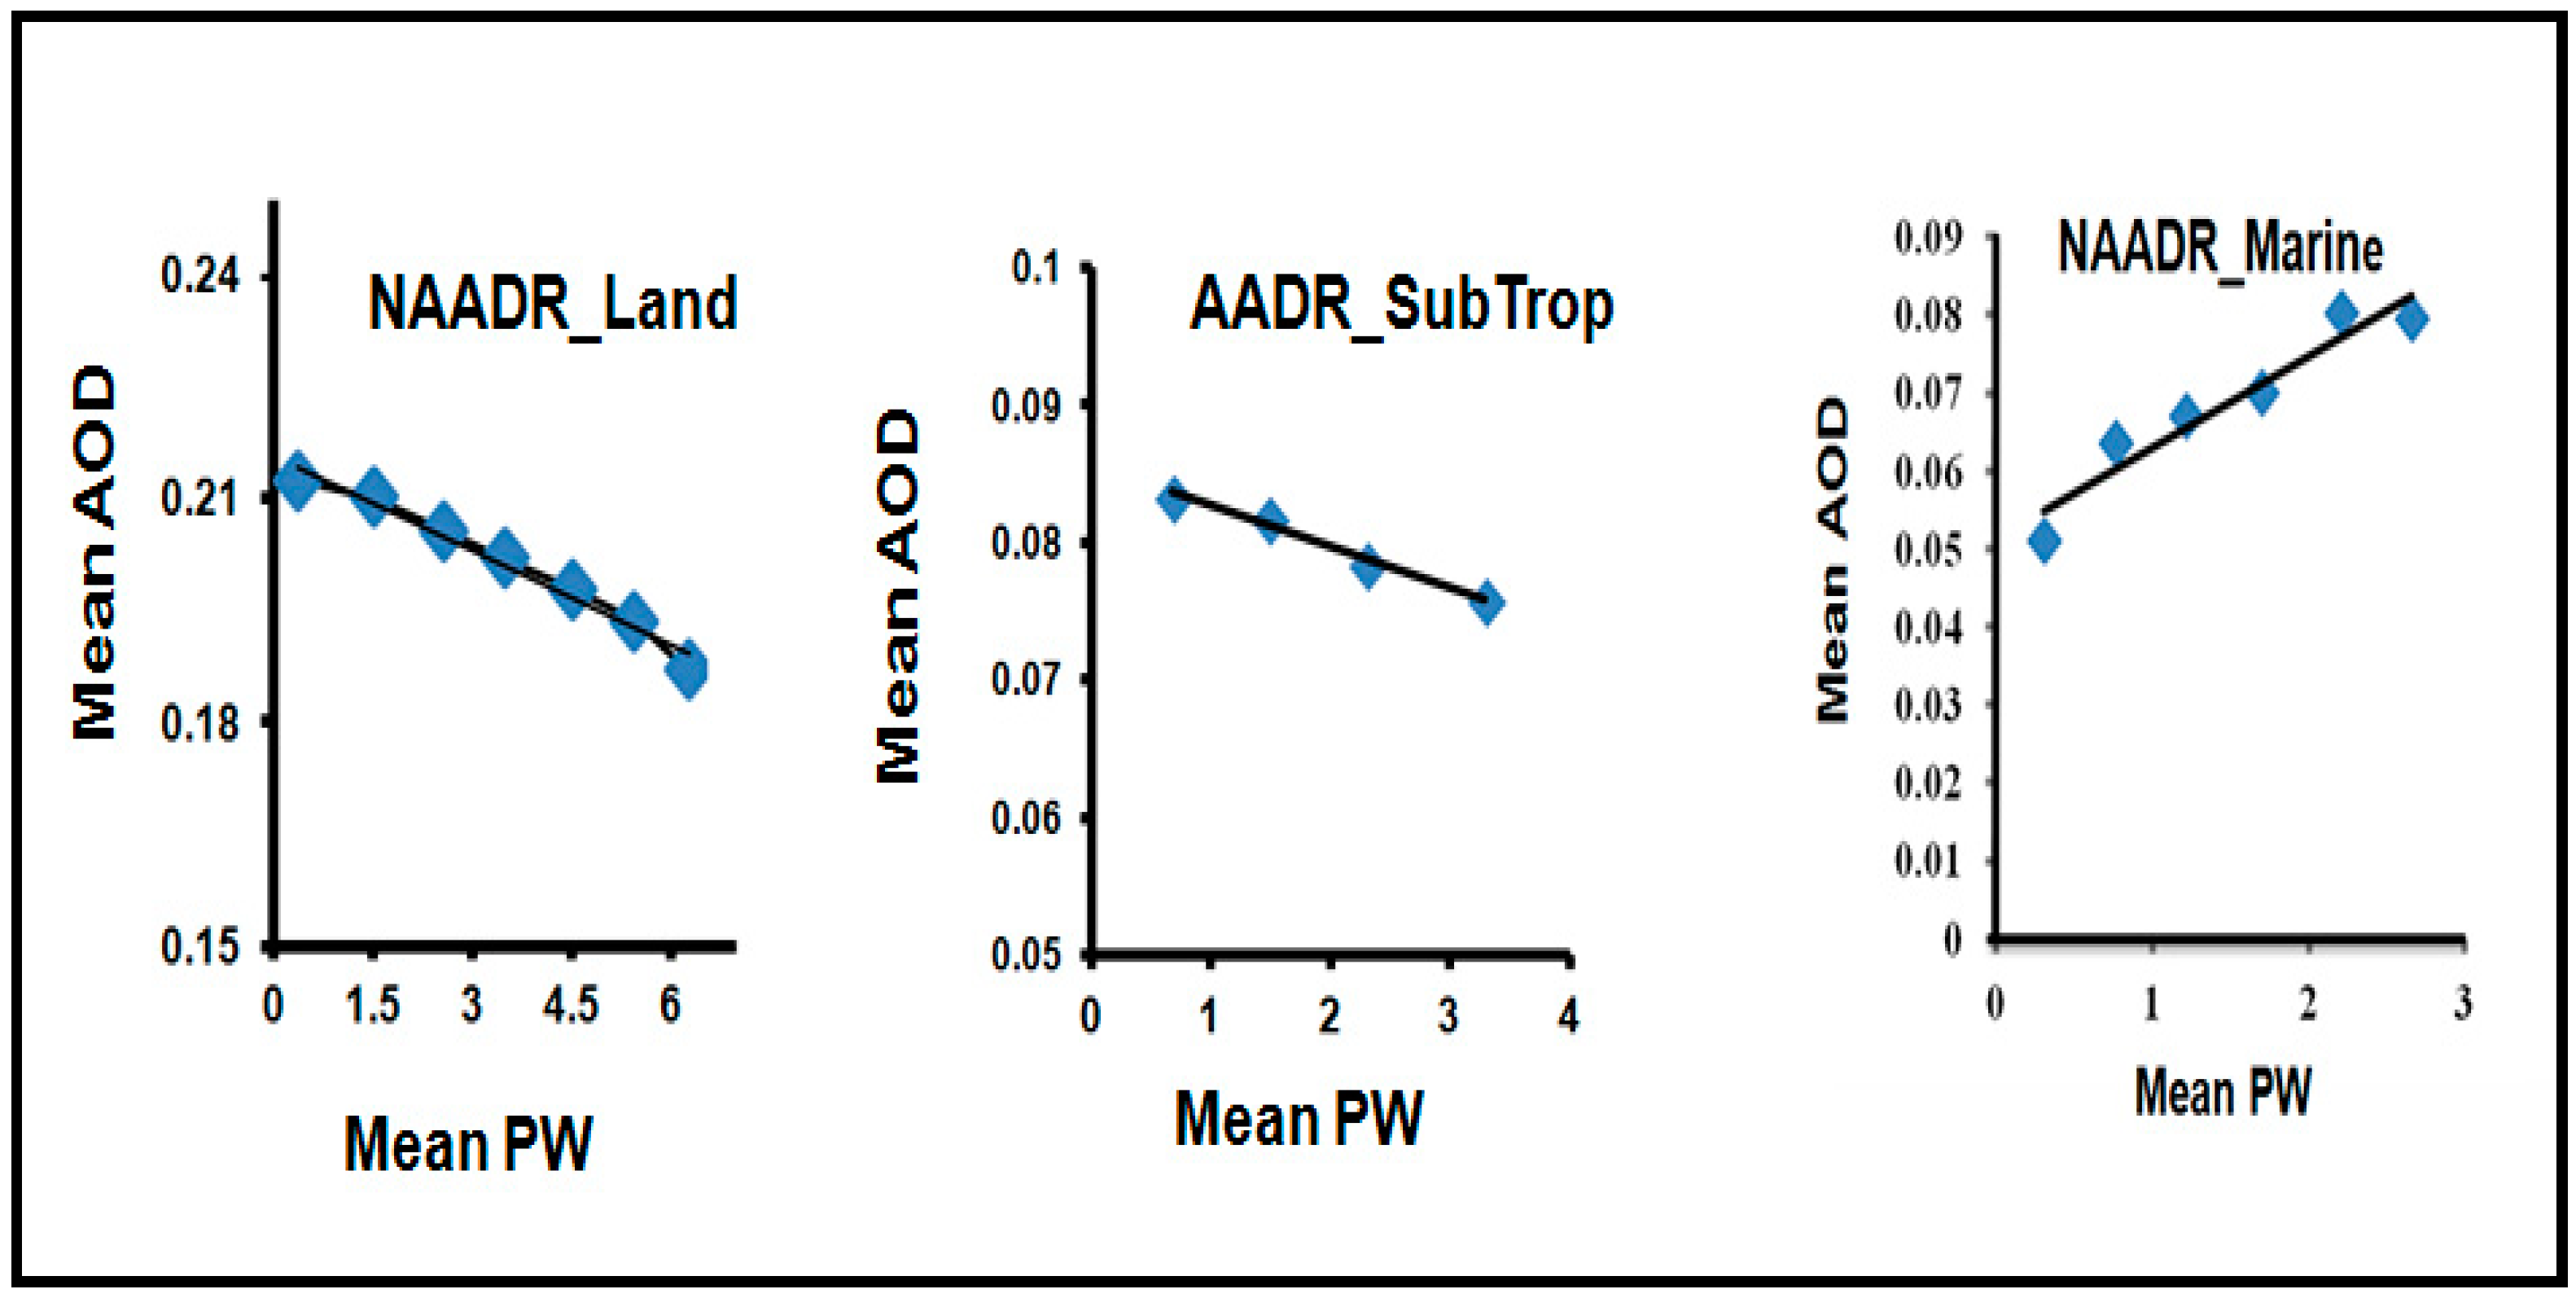
| NAADR_Marine | Non Absorbing Aerosol Dominated Region in the marine environment. This aerosol type has a strong sea salt component. |
| NAADR_Land | Non Absorbing Aerosol Dominated Region over land. This aerosol type has a strong sulfates component. |
| AADR_Sahara | Absorbing Aerosol Dominated Region in the Sahara environment. This aerosol type has a strong dust component. |
| AADR_Urban | Absorbing Aerosol Dominated Region in urban environment. This aerosol type has a strong soot component. |
| AADR_SubTrop | Absorbing Aerosol Dominated Region in Subtropical African biomass burning region. This aerosol type has a strong smoke component |
1. Introduction
1.1. Suggested Mechanisms Leading a Positive Correlation
1.2. Suggested Mechanisms Leading a Negative Correlation
1.3. Other Factors

2. Study Area and Satellite Data
2.1. Study Area
2.2. Satellite Data
3. Method
3.1. Mathematical Relationships and Definition
3.2. Data Preparation (Elimination of Outliers/Bins Averaging)
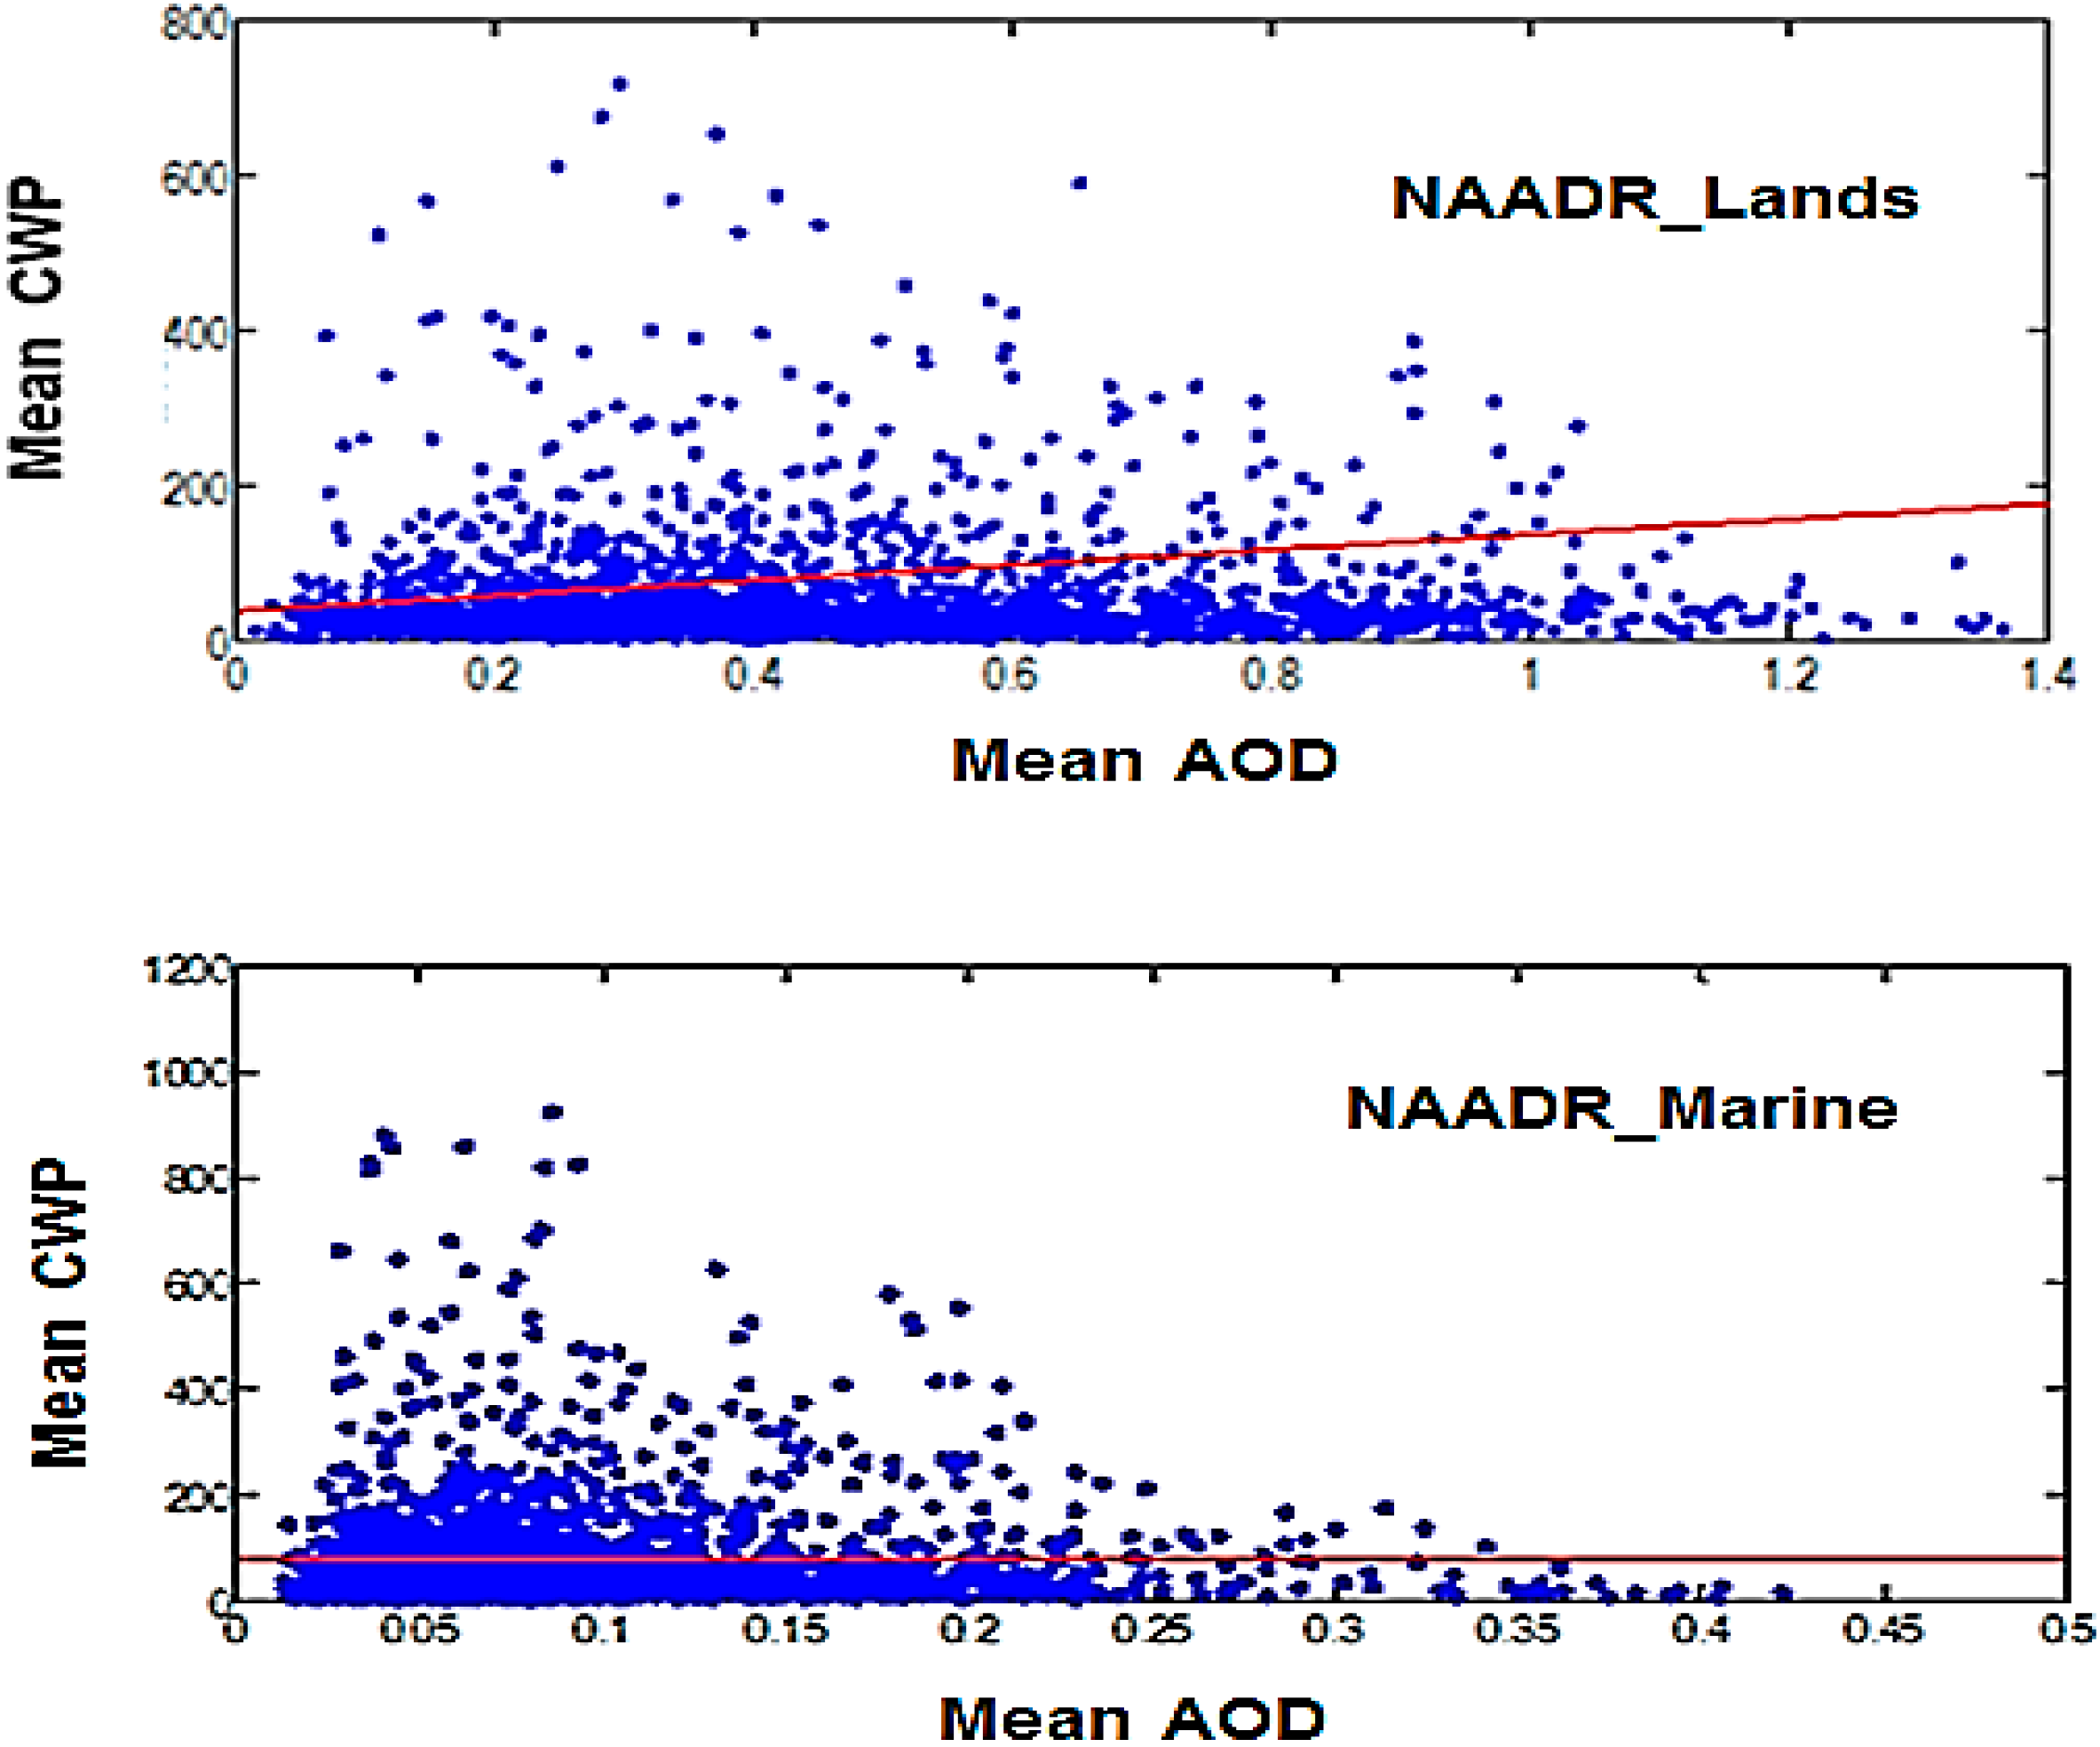
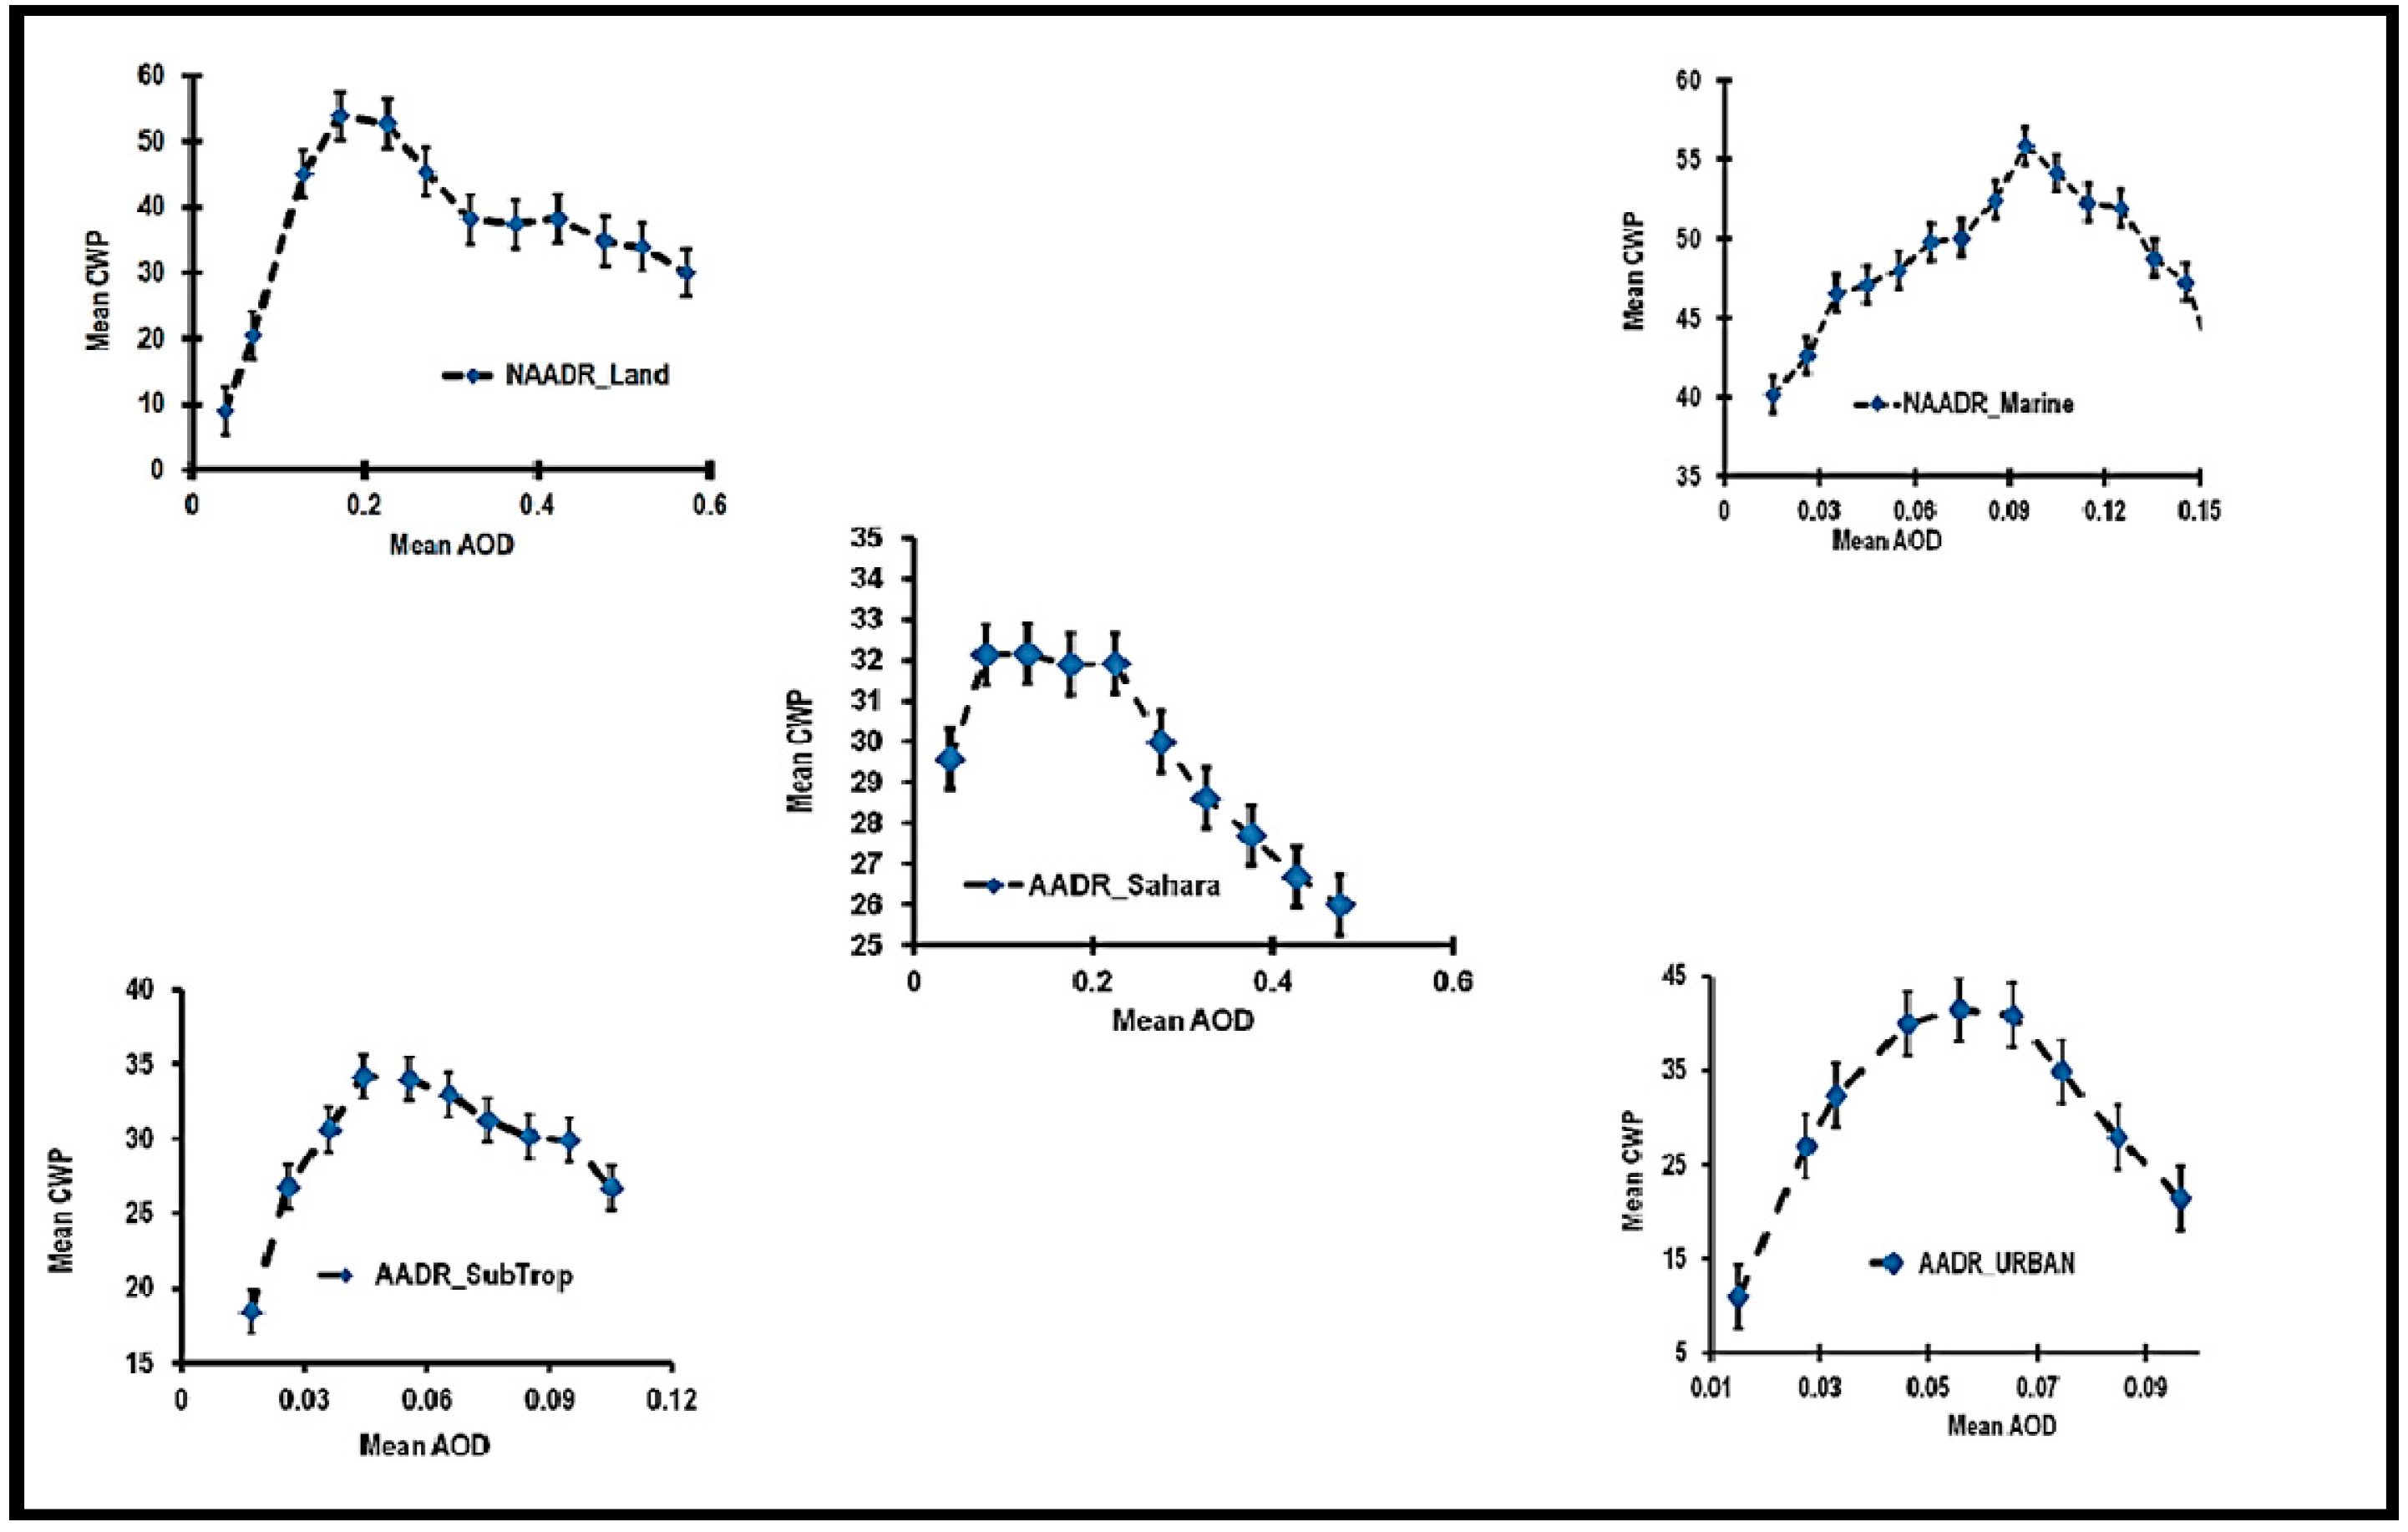
3.3. Description of Cloud Water Path (CWP) Response to Increasing Aerosol Optical Depth (AOD)


| Parameters | R2/β | R2/δ | R2/a * |
|---|---|---|---|
| NAADR_Land | -- | -- | -- |
| AOD Ranges | -- | -- | -- |
| [0.02, 0.172] | 0.991/1.22 ± 1.69 | 0.984/348.3 ± 1.74 | 0.183/180 ± 0.226 |
| [0.172, 0.6] | 0.916/−0.514 ± 1.69 | 0.844/−53.54 ± 1.74 | 0.05/−160 ± 0.226 |
| NAADR_Marine | -- | -- | -- |
| AOD Ranges | -- | -- | -- |
| [0, 0.095] | 0.950/0.16 ± 0.27 | 0.950/171.7 ± 1.88 | 0.003/130 ± 0.271 |
| [0.095, 0.15] | 0.860/−0.58 ± 0.27 | 0.911/−221 ± 1.88 | 0.0004/−270 ± 0.271 |
4. Effects of Varying Meteorological Parameters on Cloud Water Path (CWP) Response to Increasing Aerosol Optical Depth (AOD)
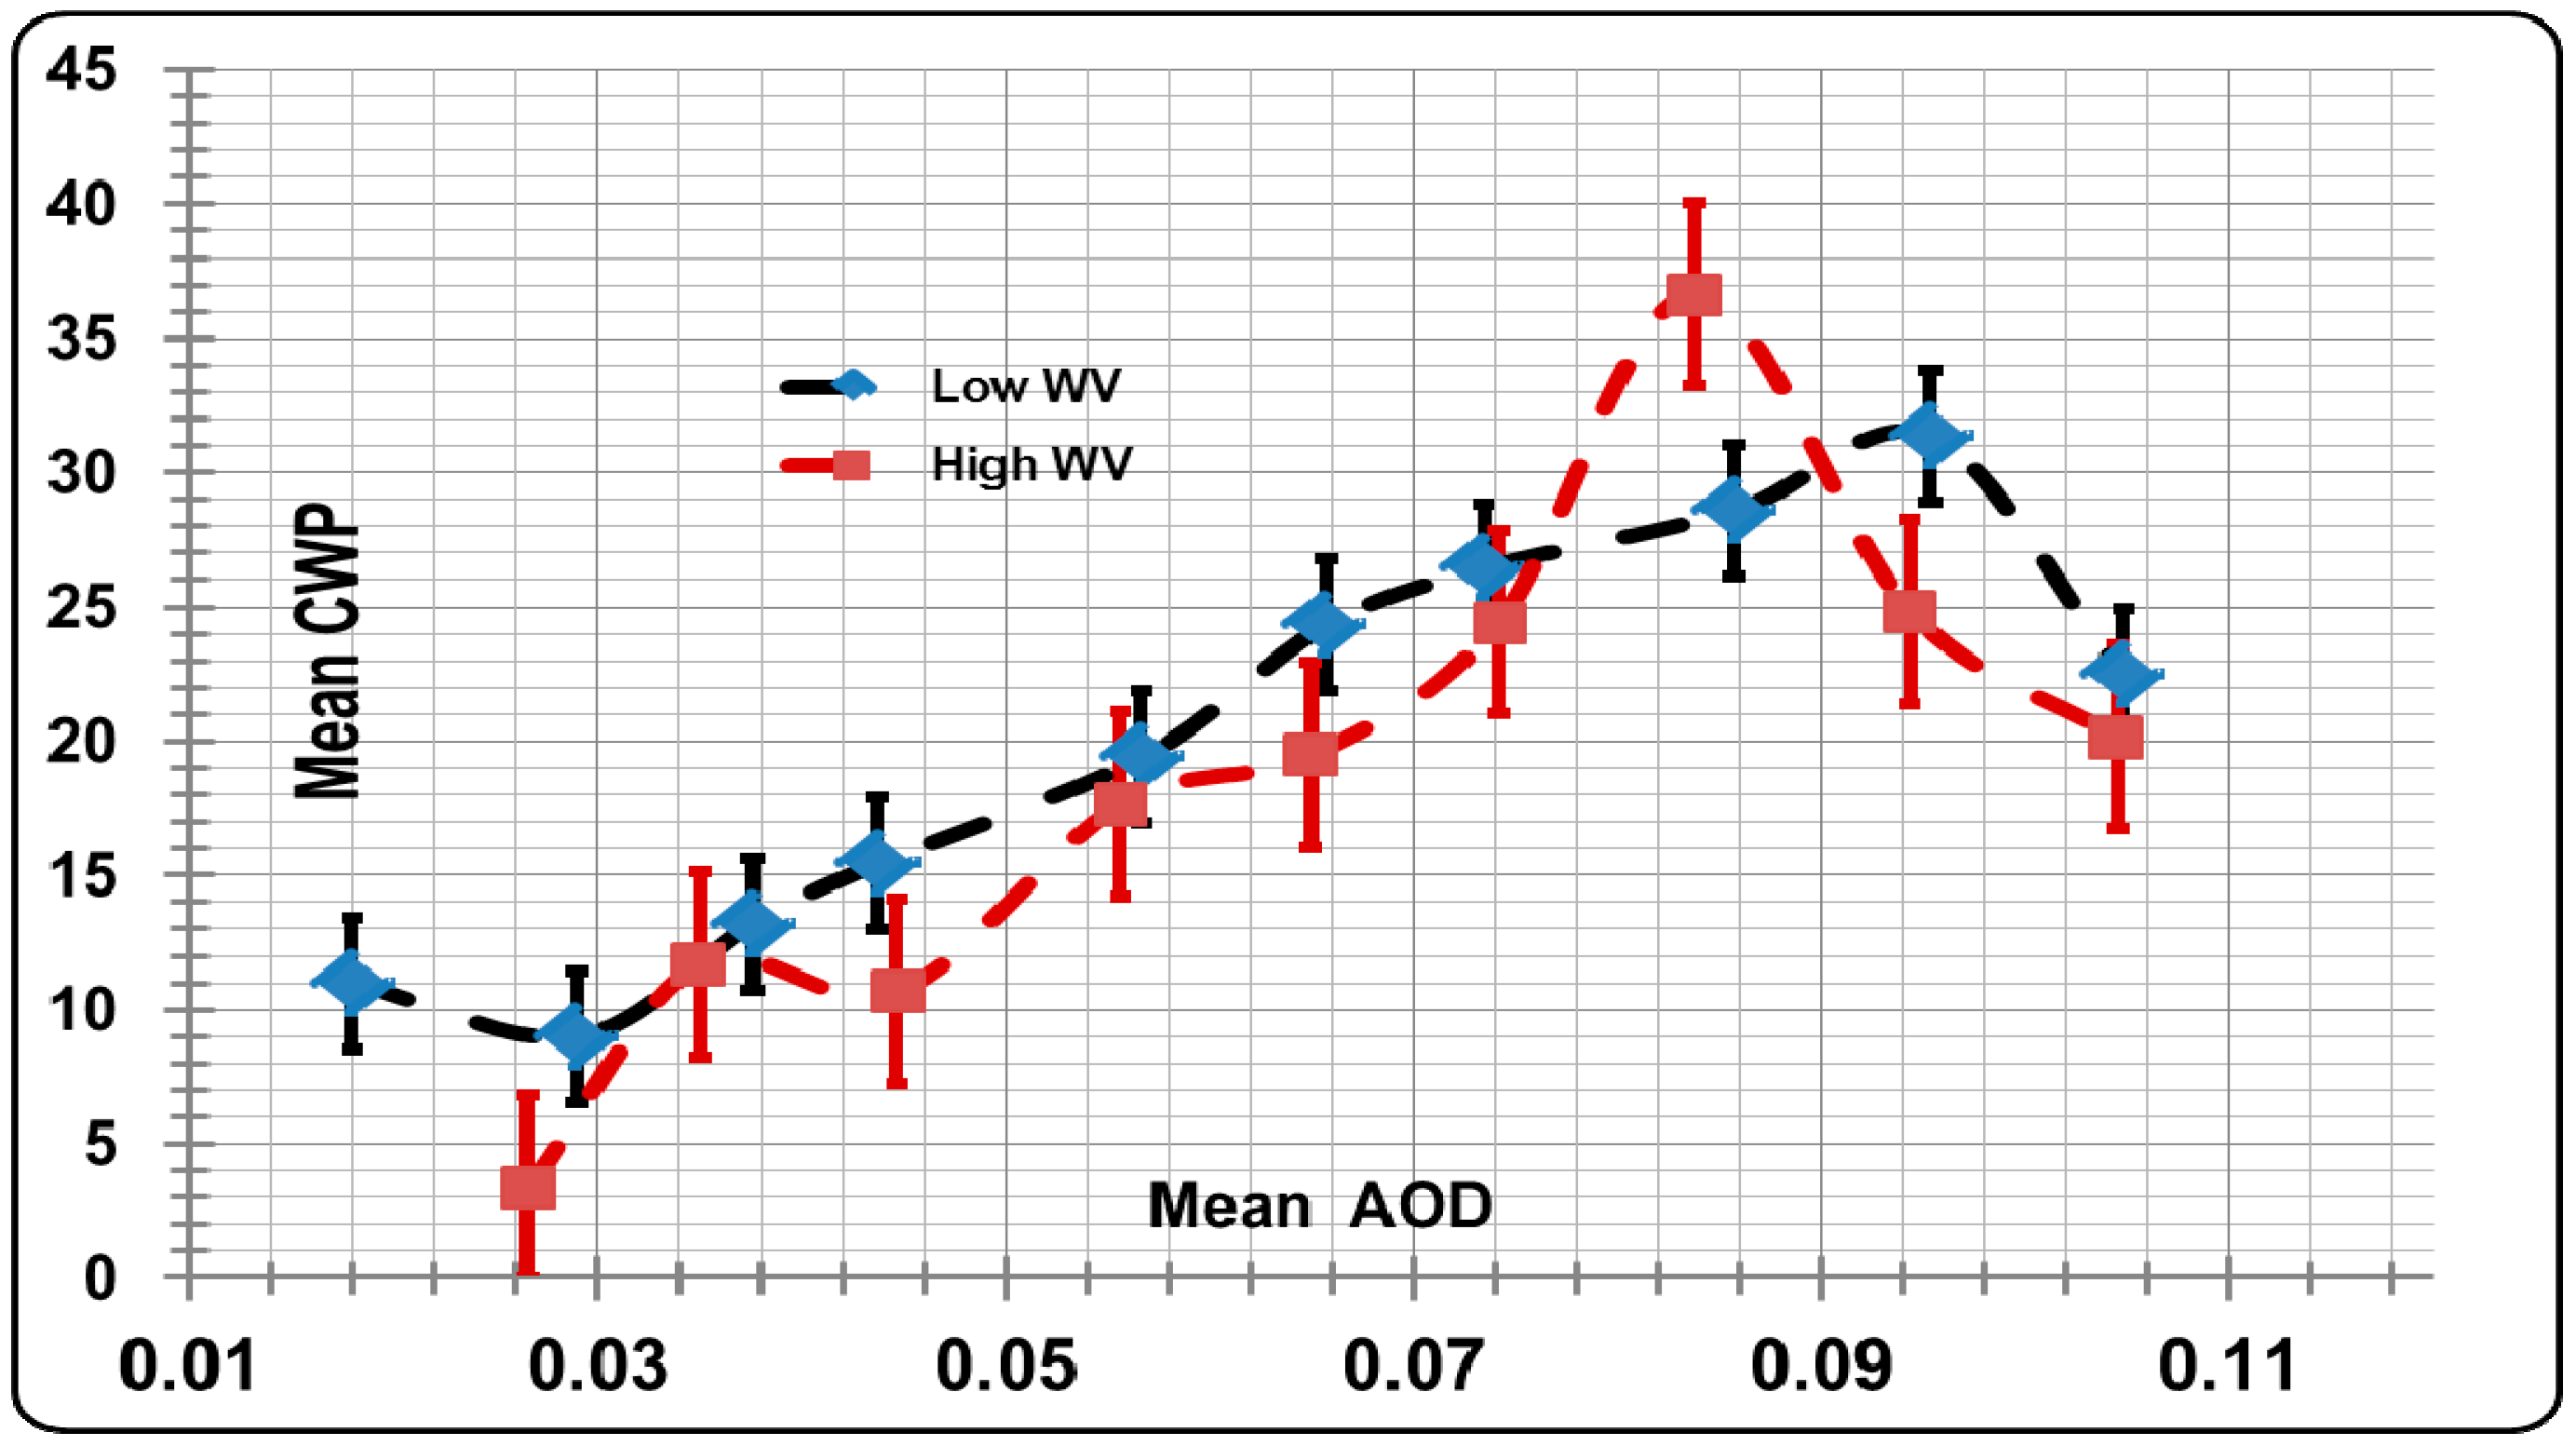
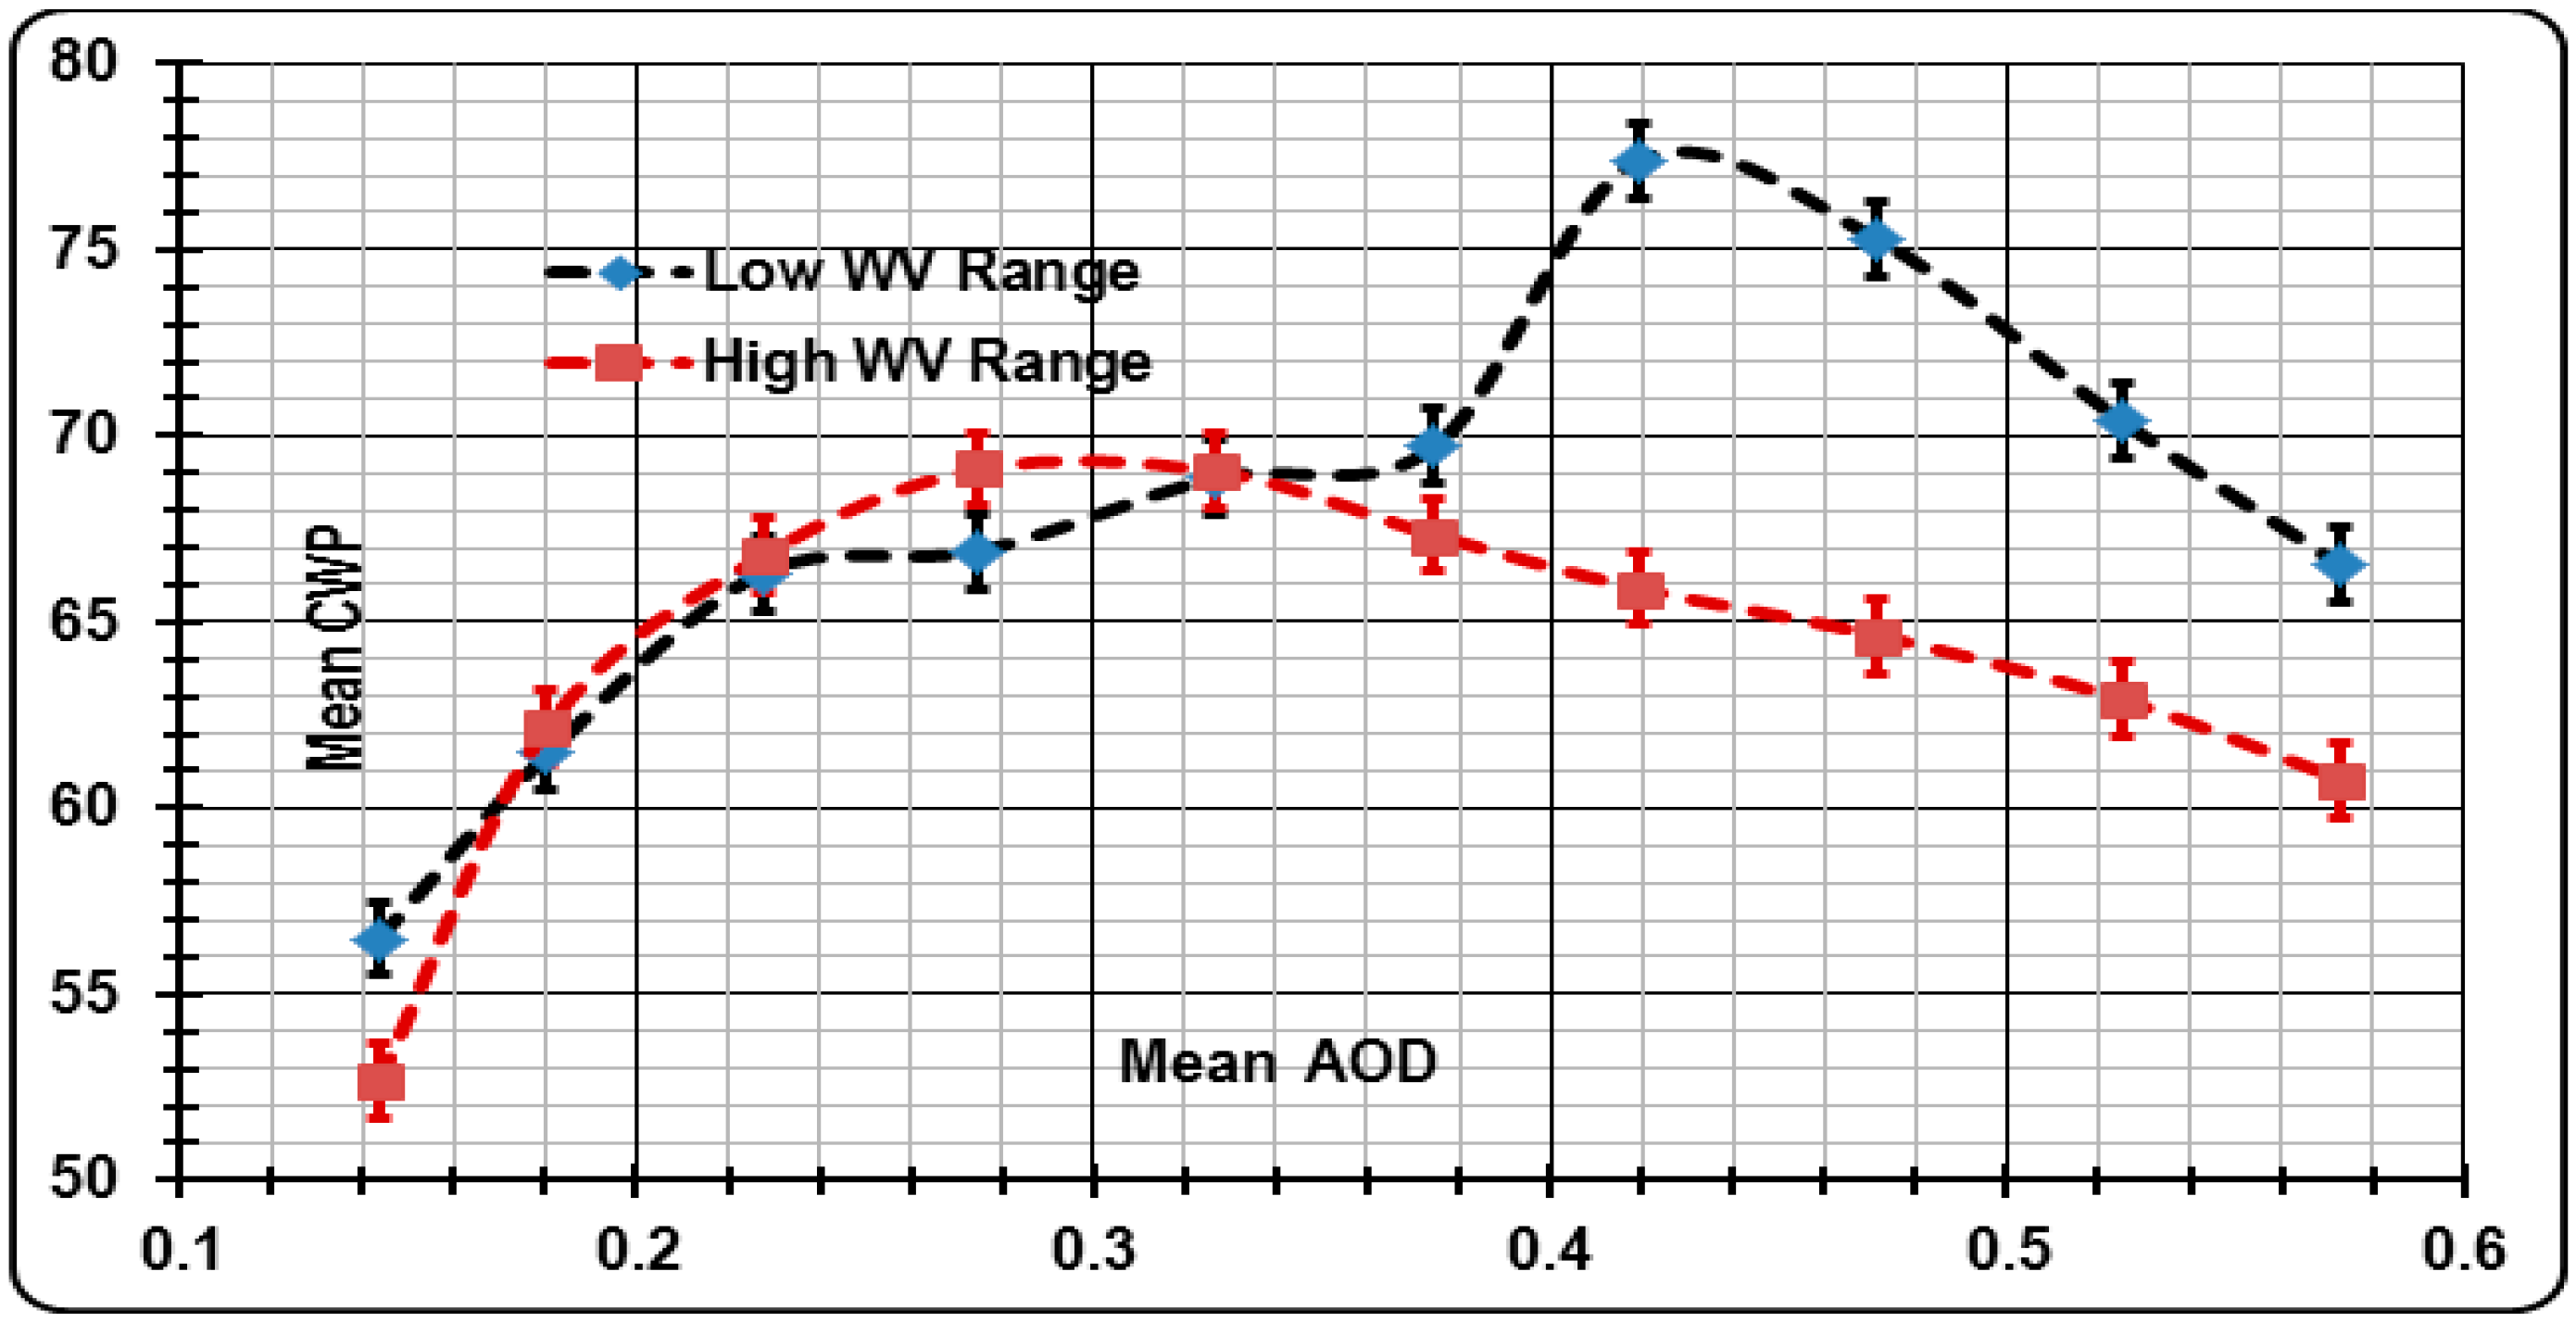
4.1. Evaluation by Atmospheric Water Vapor (WV) Statistical Compositing
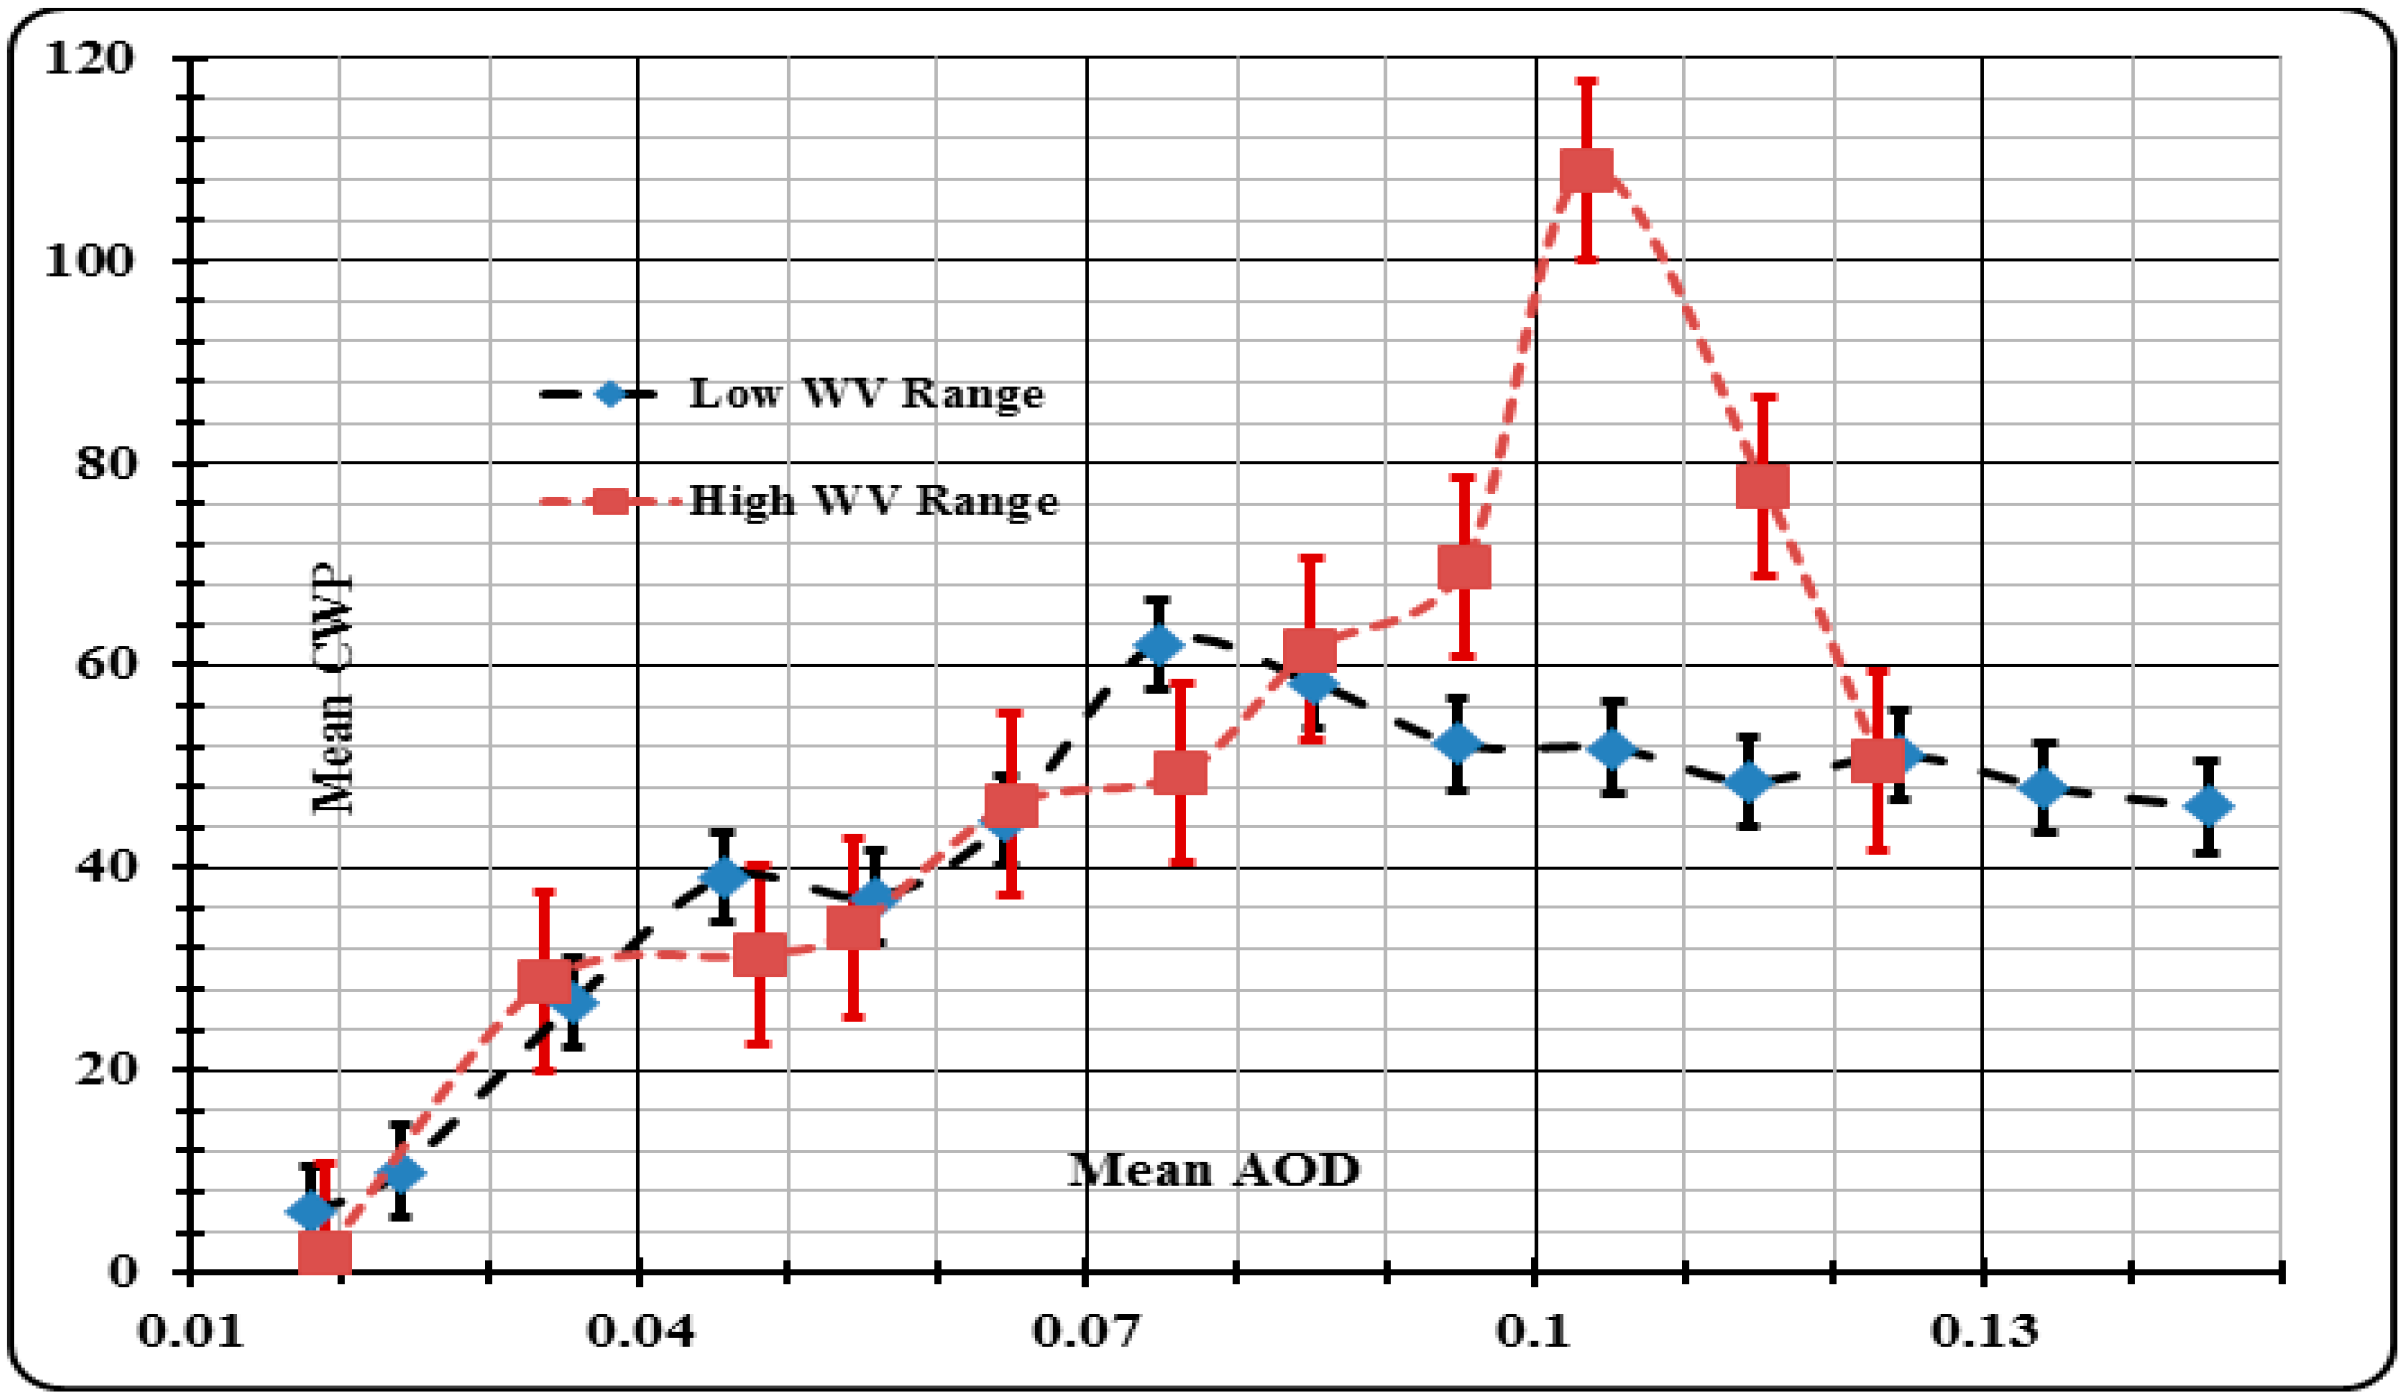
4.1.1. NAADR_Marine

| Moisture | AODpeak | CWPpeak | βmoistening | βdrying |
|---|---|---|---|---|
| Low WV | 0.074 ± 0.011 | 62.13 ± 1.74 | 1.59 ± 0.17 | –0.417 ± 0.17 |
| High WV | 0.104 ± 0.011 | 109 ± 1.74 | 2.050 ± 0.20 | –4.319 ± 0.20 |
| (ΔX/X Low WV) % | 40.5% ↑ | 75.4% ↑ | 29% ↑ | 936% ↑ |
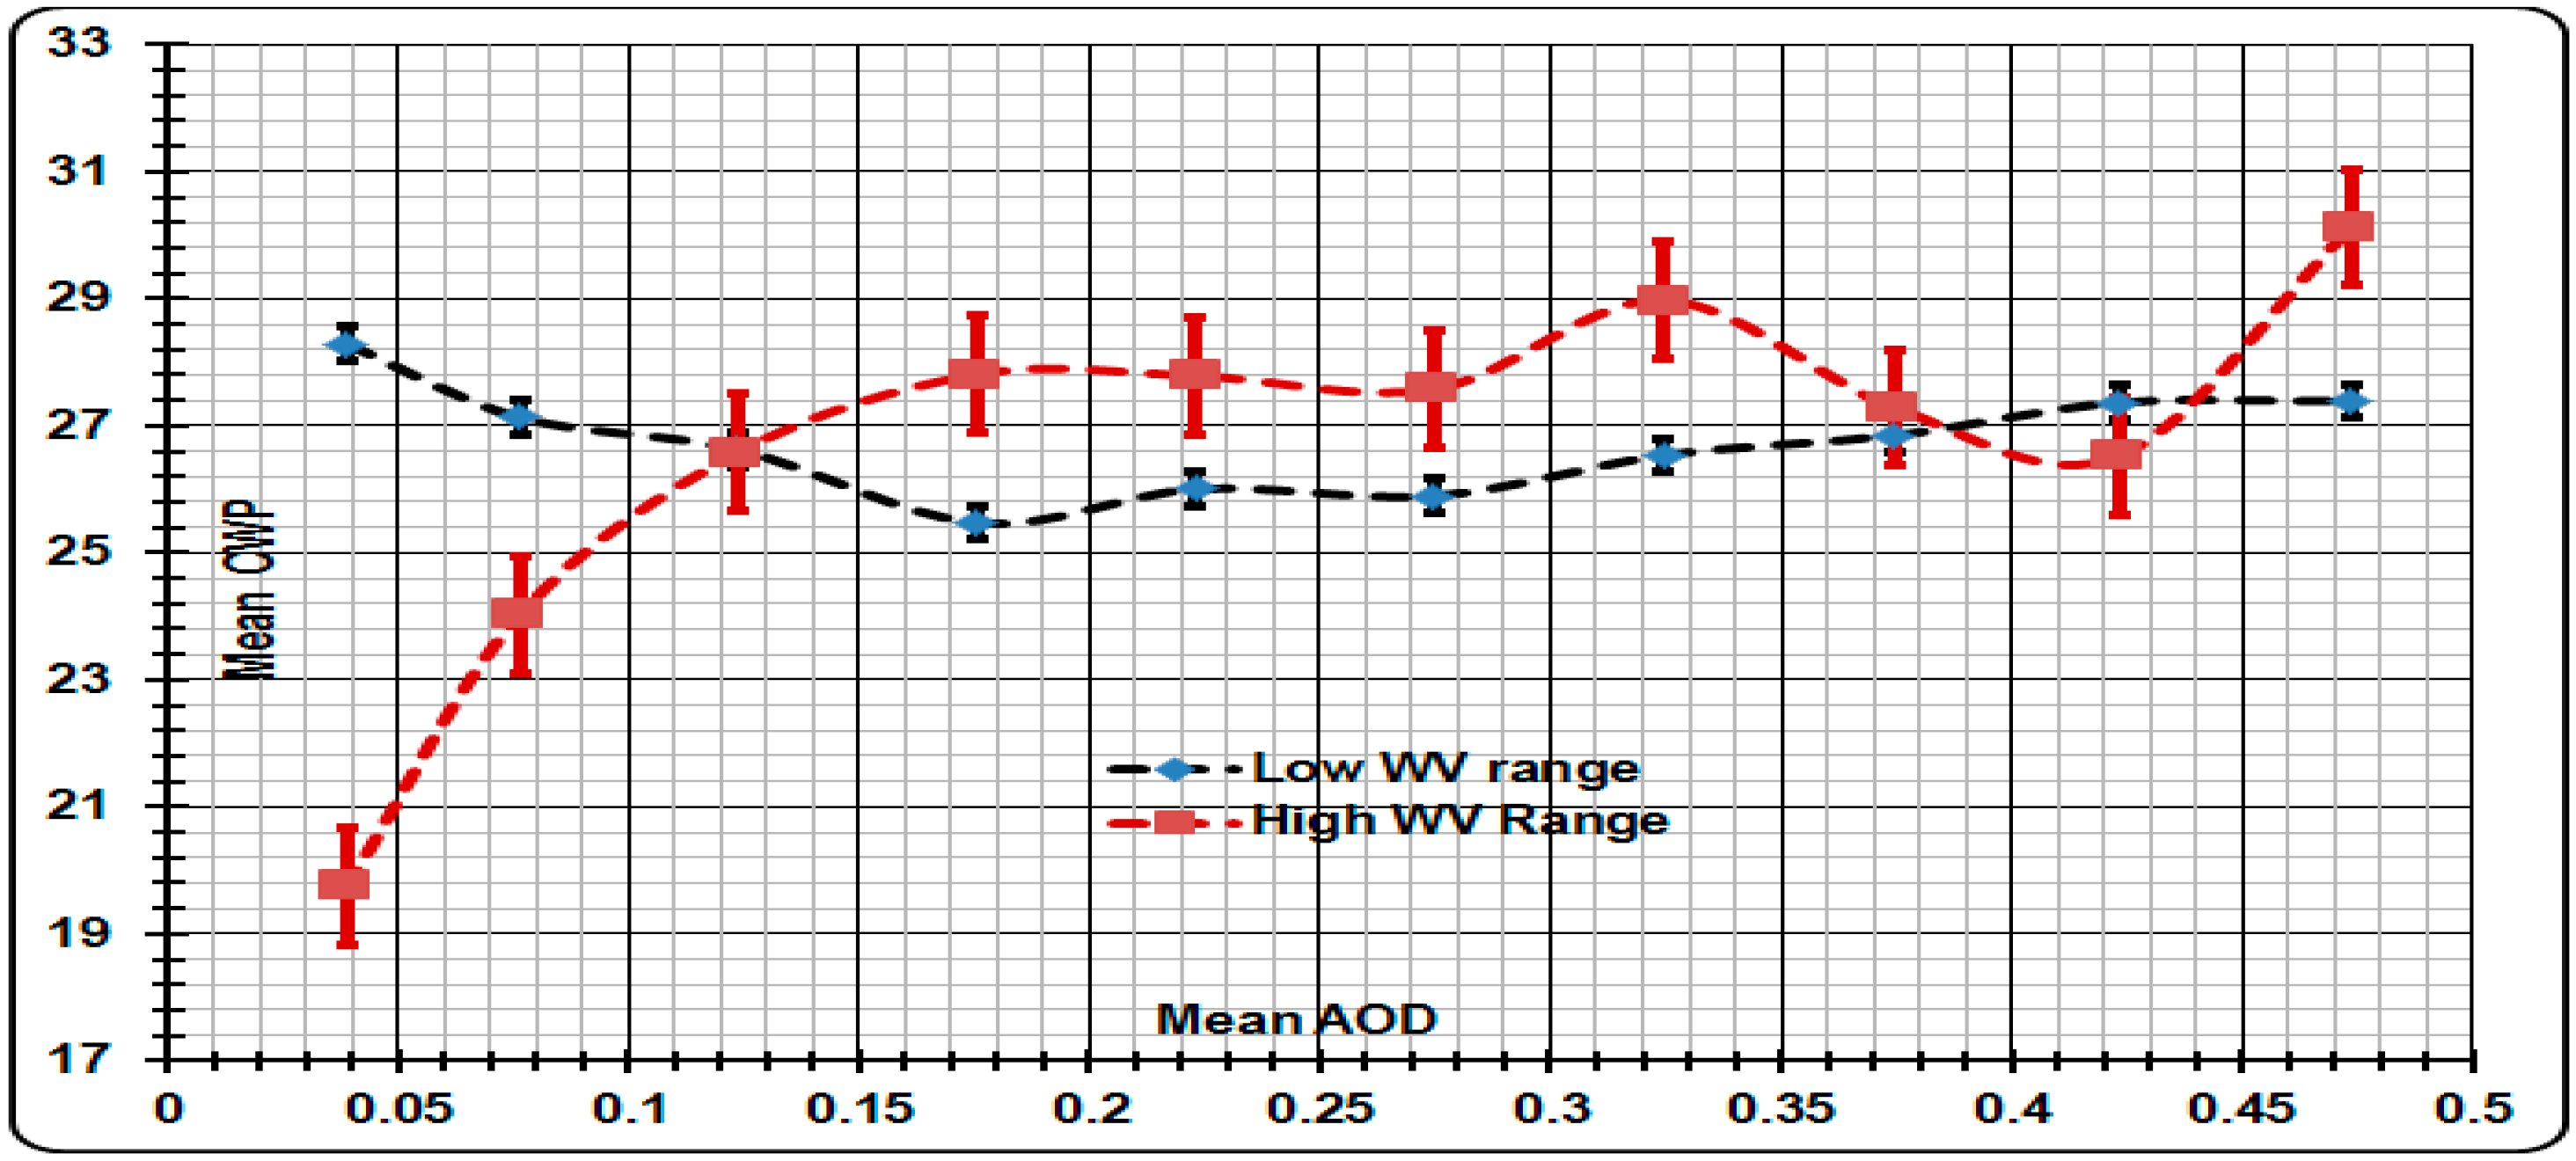
4.1.2. NAADR_Lands
| Moisture | AODpeak | CWPpeak | βmoistening | βdrying |
|---|---|---|---|---|
| Low WV | 0.419 ± 0.036 | 77.40 ± 2.84 | 0.212 ± 0.06 | –0.492 ± 0.180 |
| High WV | 0.275 ± 0.036 | 69.11 ± 2.84 | 0.515 ± 0.06 | –0.217 ± 0.01 |
| (ΔX/X Low WV) % | 34% ↓ | 11% ↓ | 143% ↑ | 56% ↓ |
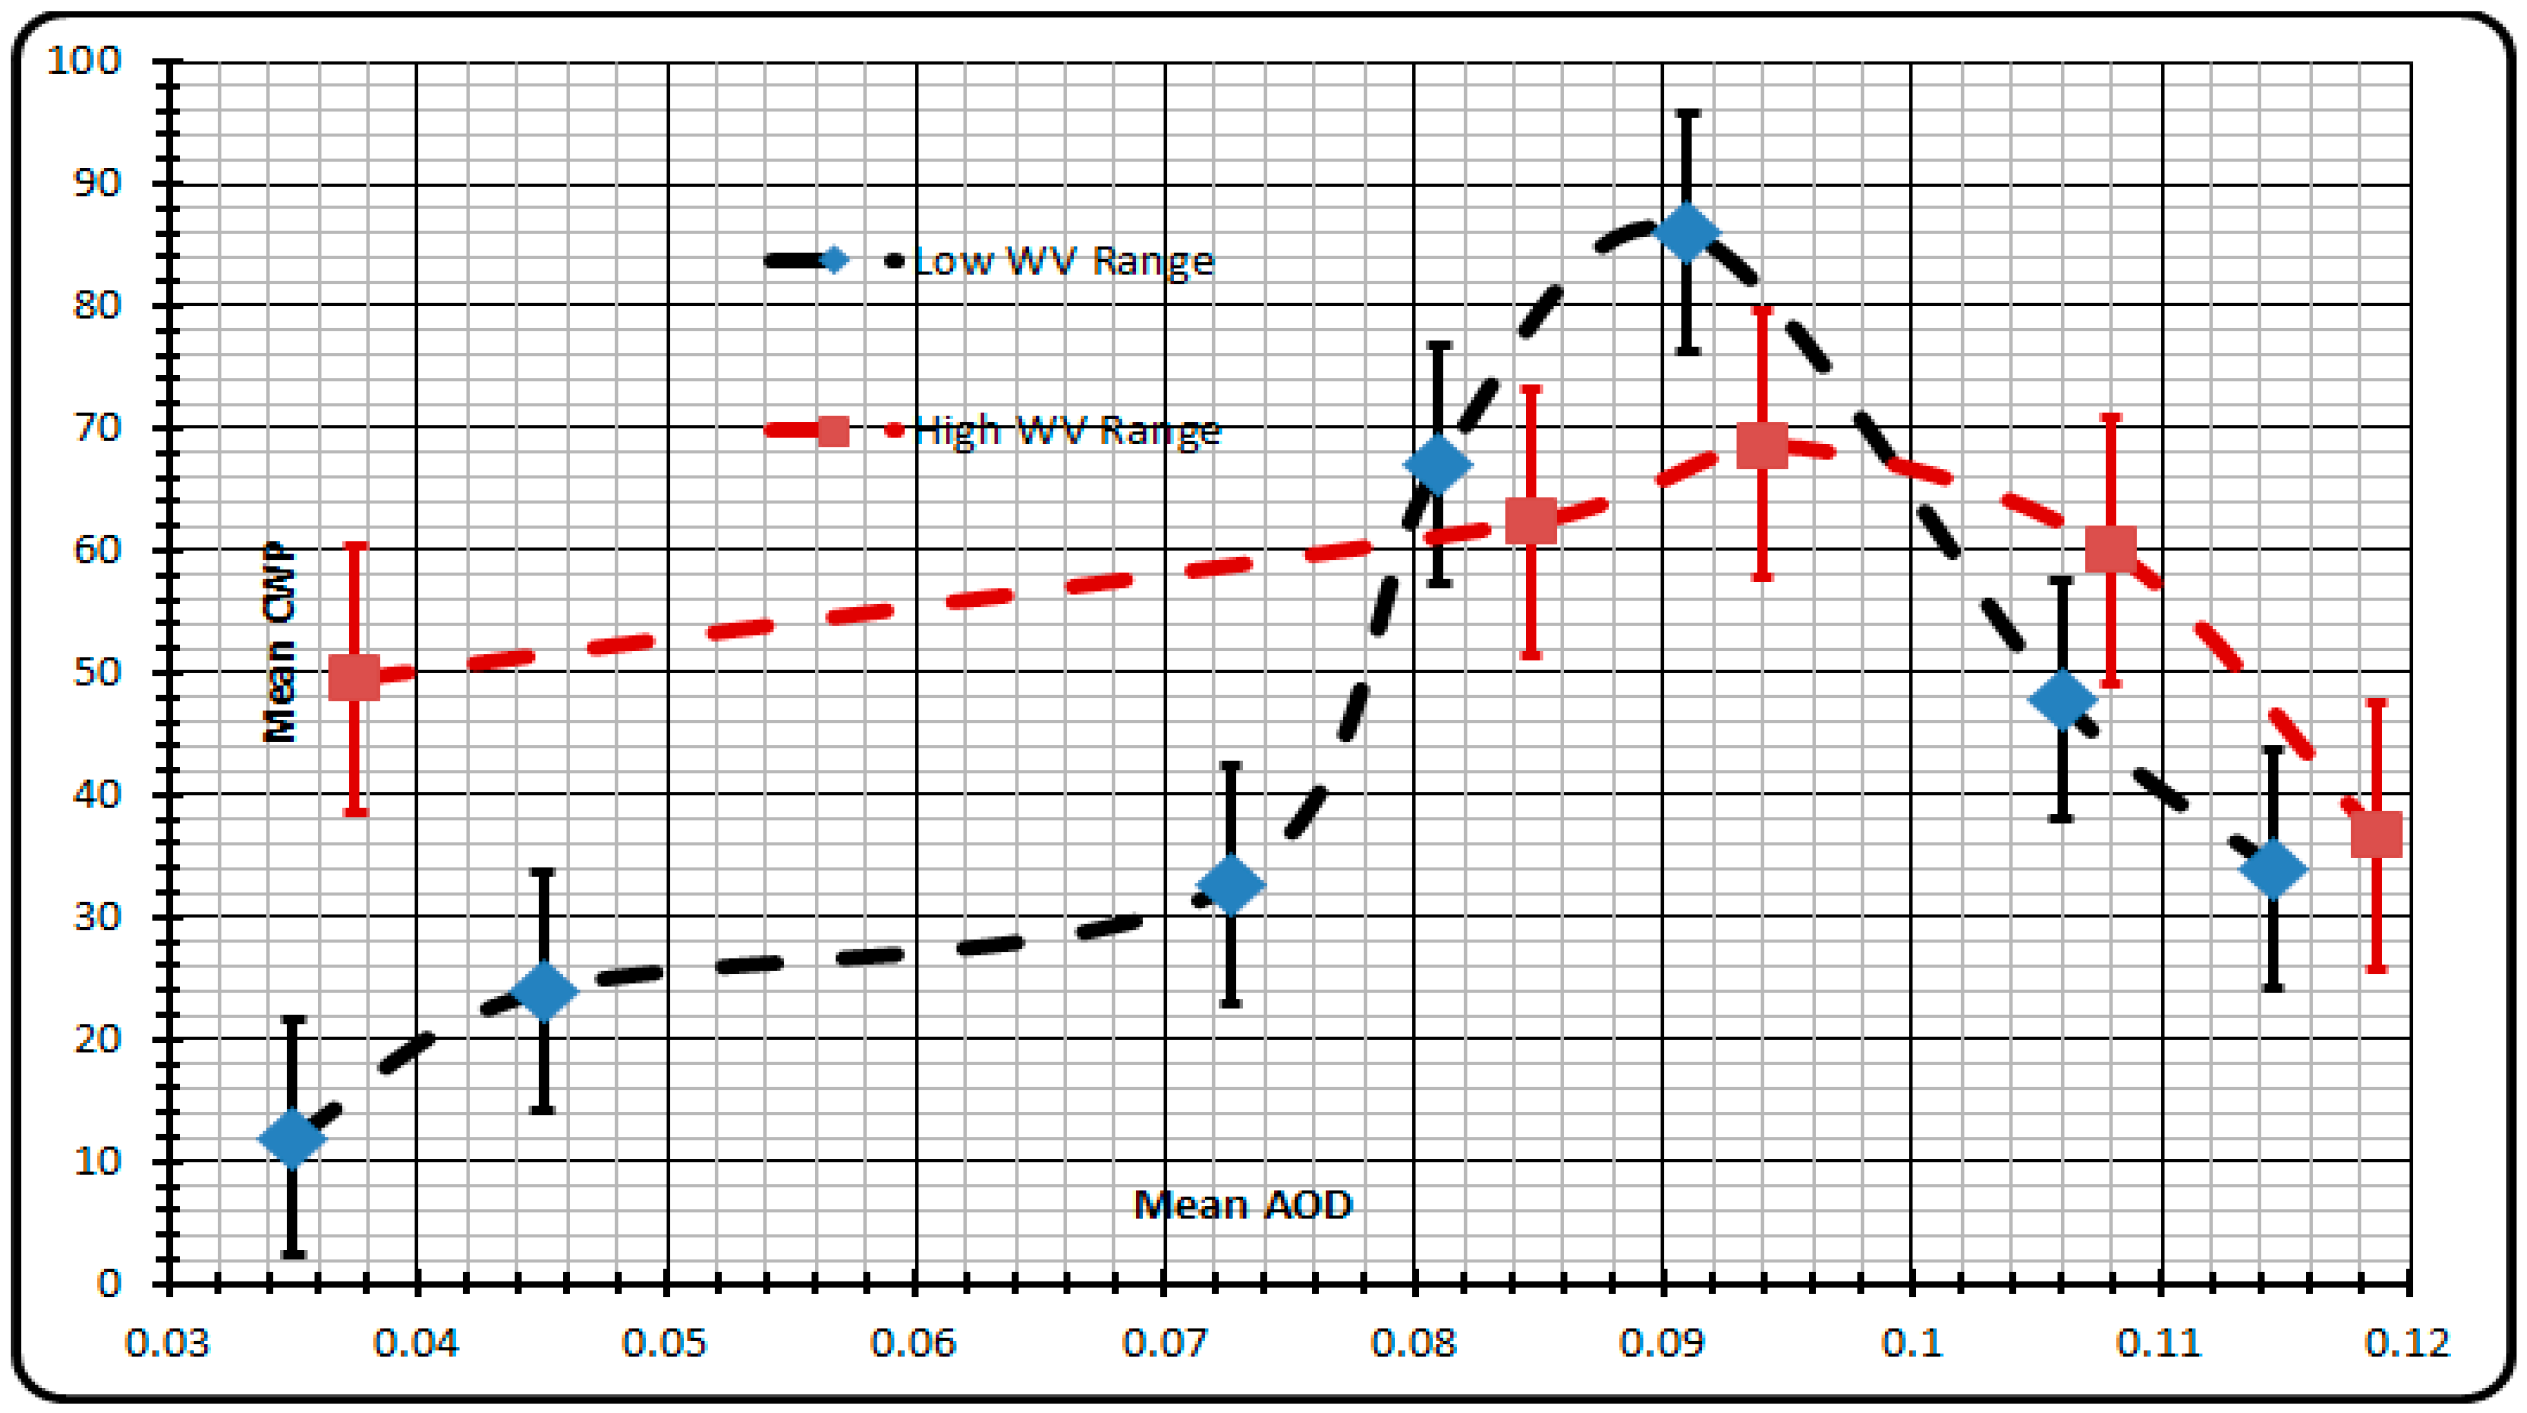
4.1.3. AADR_Urban

| Moisture | AODpeak | CWPpeak | βmoistening | βdrying |
|---|---|---|---|---|
| Low WV | 0.091 ± 0.031 | 86.0 ± 2.46 | 1.846 ± 0.180 | –4.014 ± 0.180 |
| High WV | 0.094 ± 0.031 | 68.67 ± 2.46 | 0.328 ± 0.122 | –2.563 ± 0.122 |
| (ΔX/X Low WV) % | 3.2% ↑ | 20.2% ↓ | 82.2% ↓ | 36.1% ↓ |
4.1.4. AADR_SubTrop (Southern Africa)

| Moisture | AODpeak | CWPpeak | βmoistening | βdrying |
|---|---|---|---|---|
| Low WV | 0.095 ± 0.028 | 31.35 ± 2.20 | 0.731 ± 0.238 | –3.512 ± 0.238 |
| High WV | 0.084 ± 0.028 | 36.60 ± 2.20 | 1.693 ± 0.173 | –2.719 ± 0.173 |
| (ΔX/X Low WV) % | 13.1% ↓ | 16.7% ↑ | 131.6% ↑ | 22.6% ↓ |
4.1.5. AADR_Sahara

| Moisture | AODpeak | CWPpeak | βmoistening | βdrying |
|---|---|---|---|---|
| Low WV | 0.04 ± 0.004 | 28.3 ± 2.20 | -- | –0.07 ± 0.238 |
| High WV | 0.04 ± 0.031 | 19.75 ± 2.20 | 0.230 ± 0.238 | -- |
| (ΔX/X Low WV) % | 0% ↓ | 30% ↓ | -- | -- |
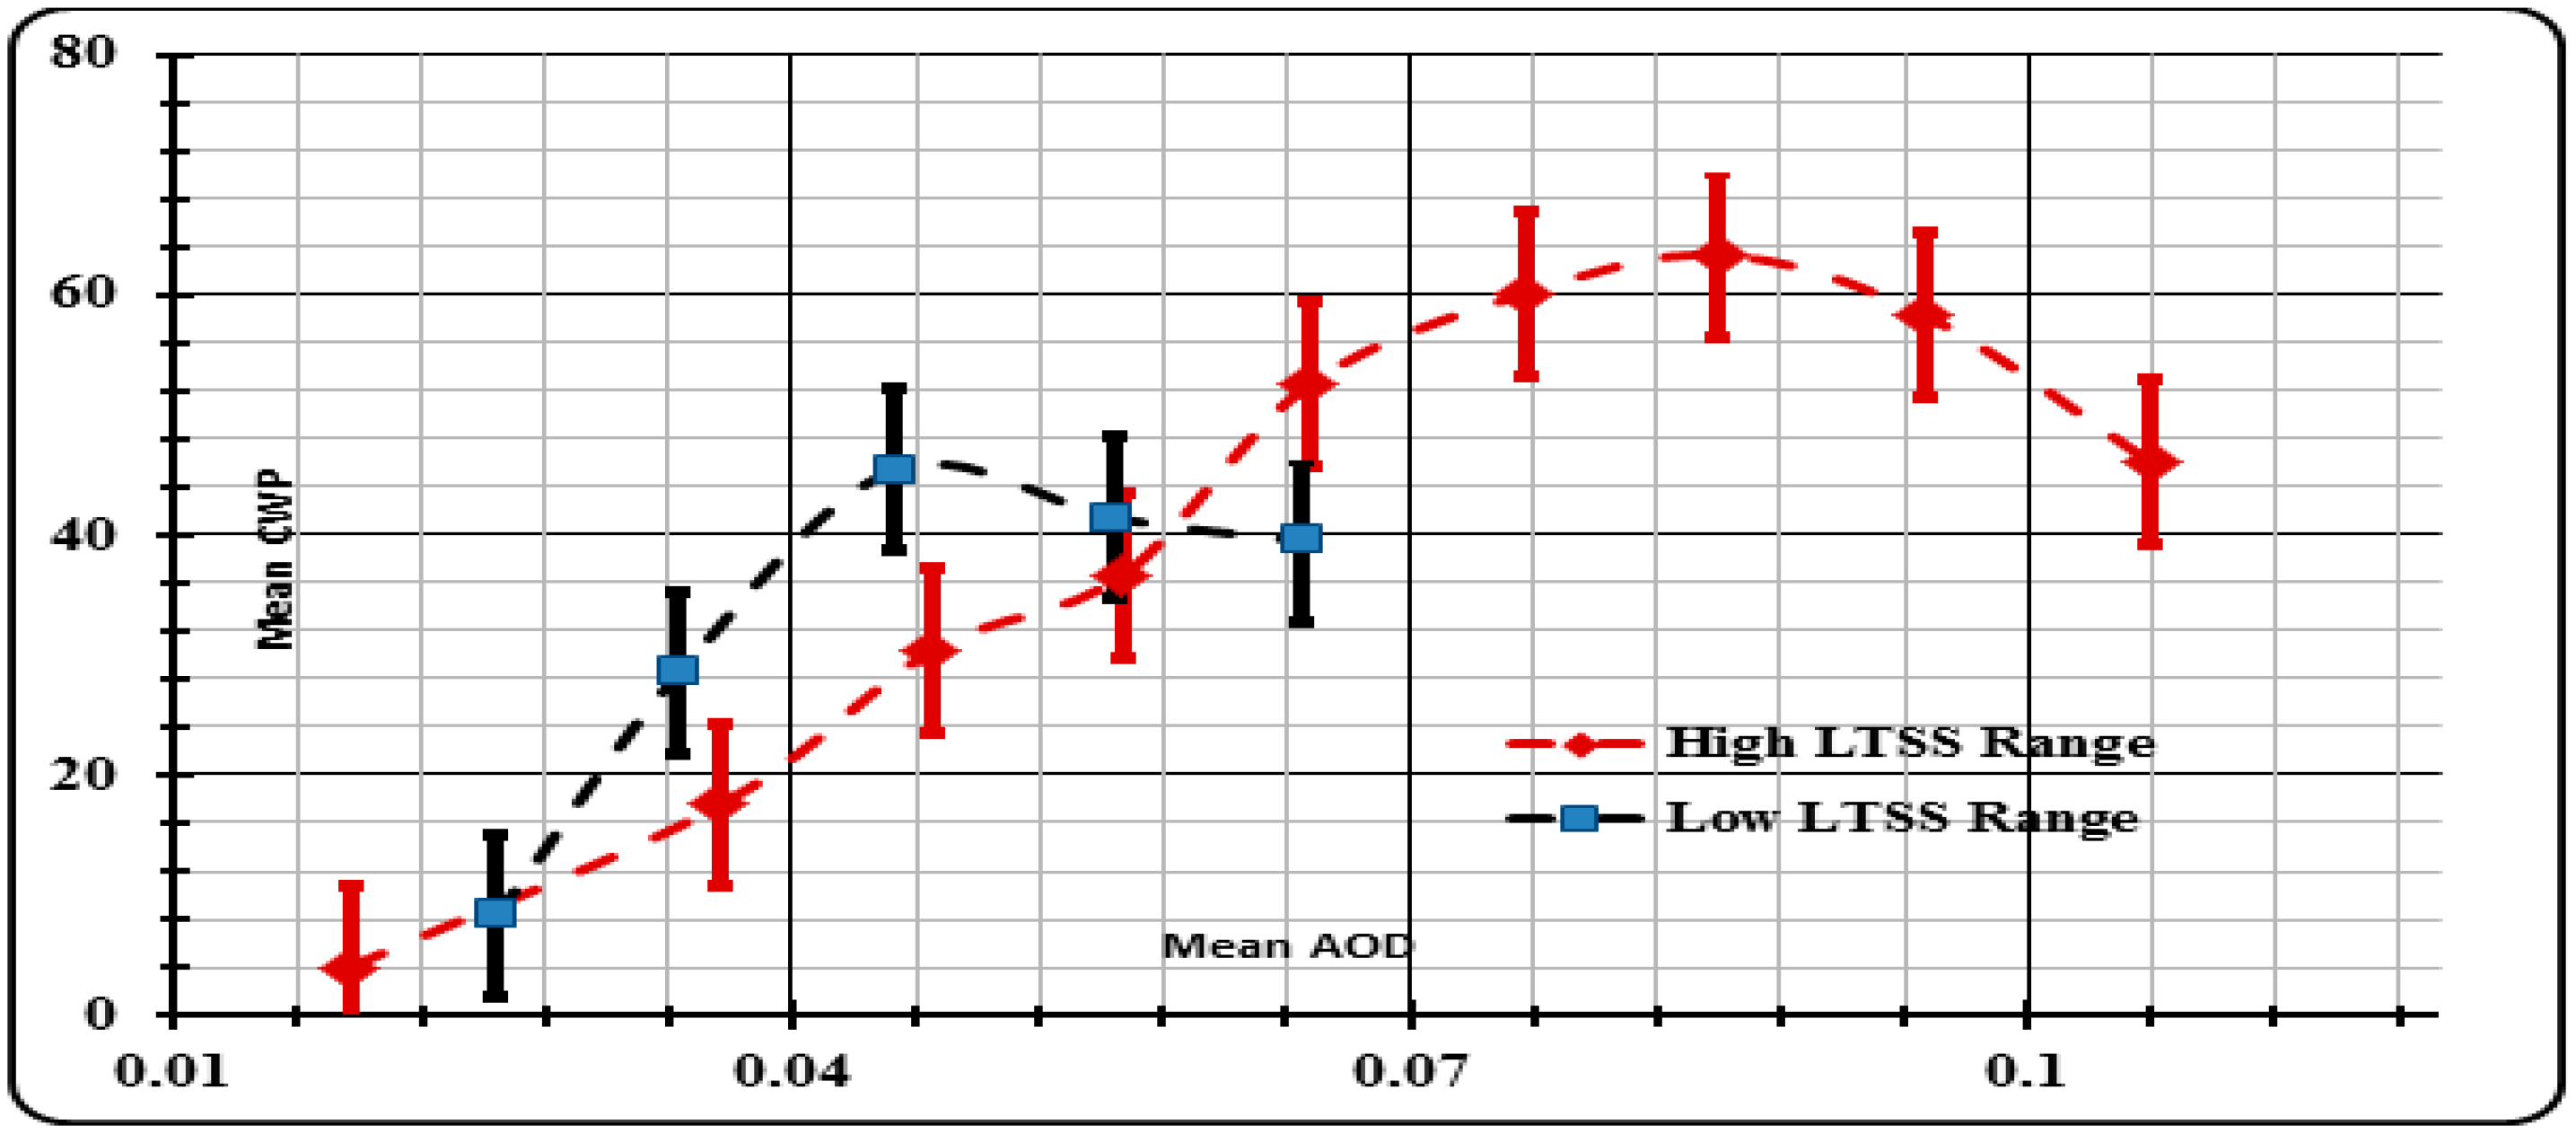
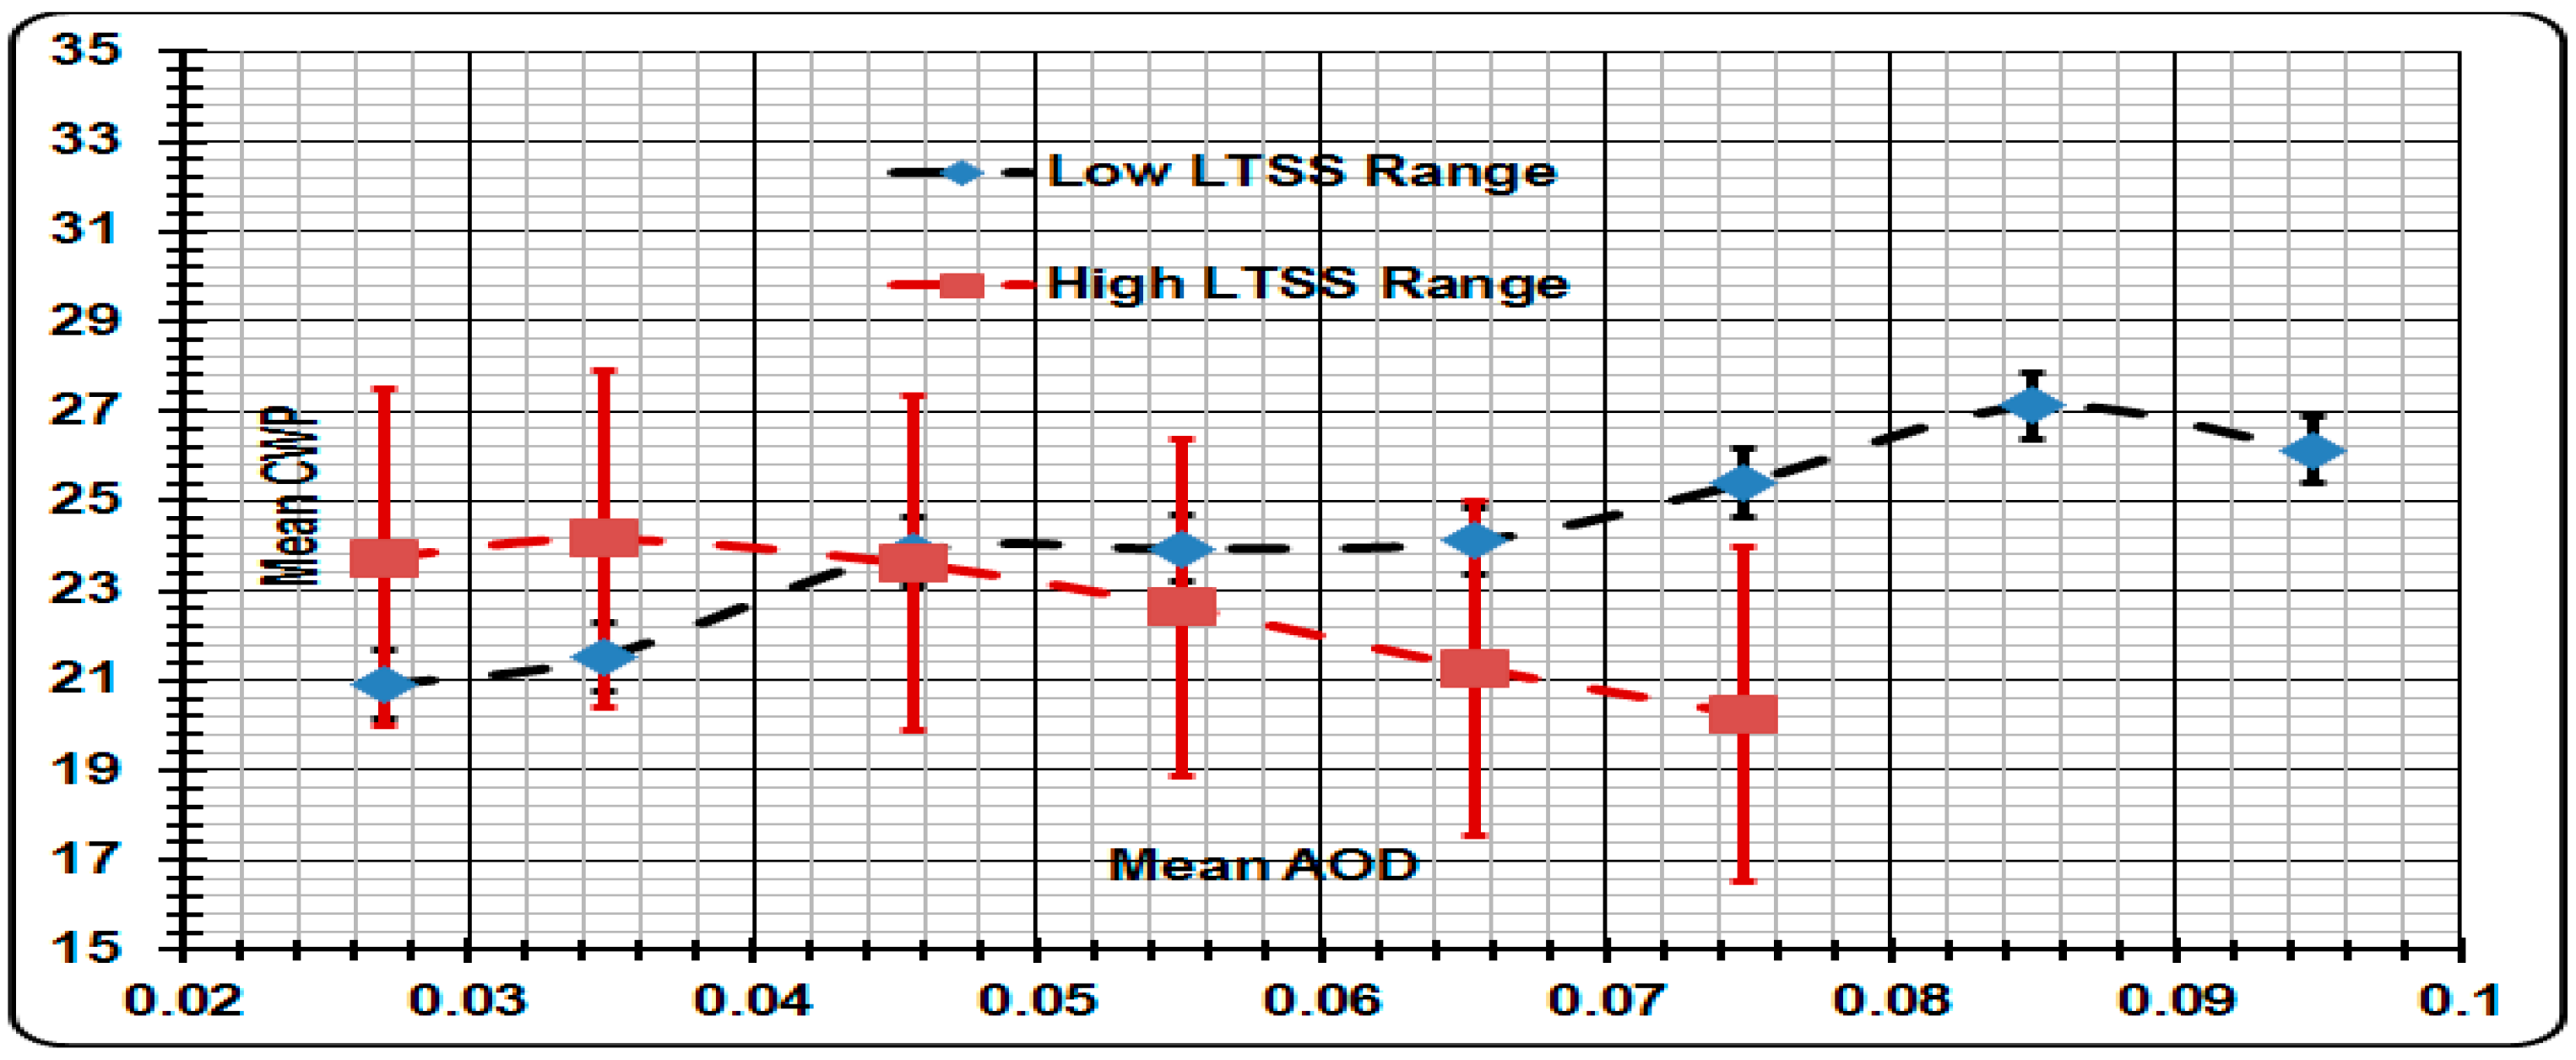
4.2. Evaluation by Lower Tropospheric Static Stability (LTSS) Statistical Compositing
4.2.1. NAADR_Marine

| Stability | AODpeak | CWPpeak | βmoistening | βdrying |
|---|---|---|---|---|
| Low LTSS | 0.045 ± 0.011 | 45.42 ± 1.74 | 3.041 ± 0.27 | –0.388 ± 0.27 |
| High LTSS | 0.085 ± 0.011 | 63.31 ± 1.74 | 1.958 ± 0.22 | –1.446 ± 0.22 |
| (ΔX/X Low LTSS) % | 88% ↑ | 39.4% ↑ | 35.6% ↓ | 273% ↑ |
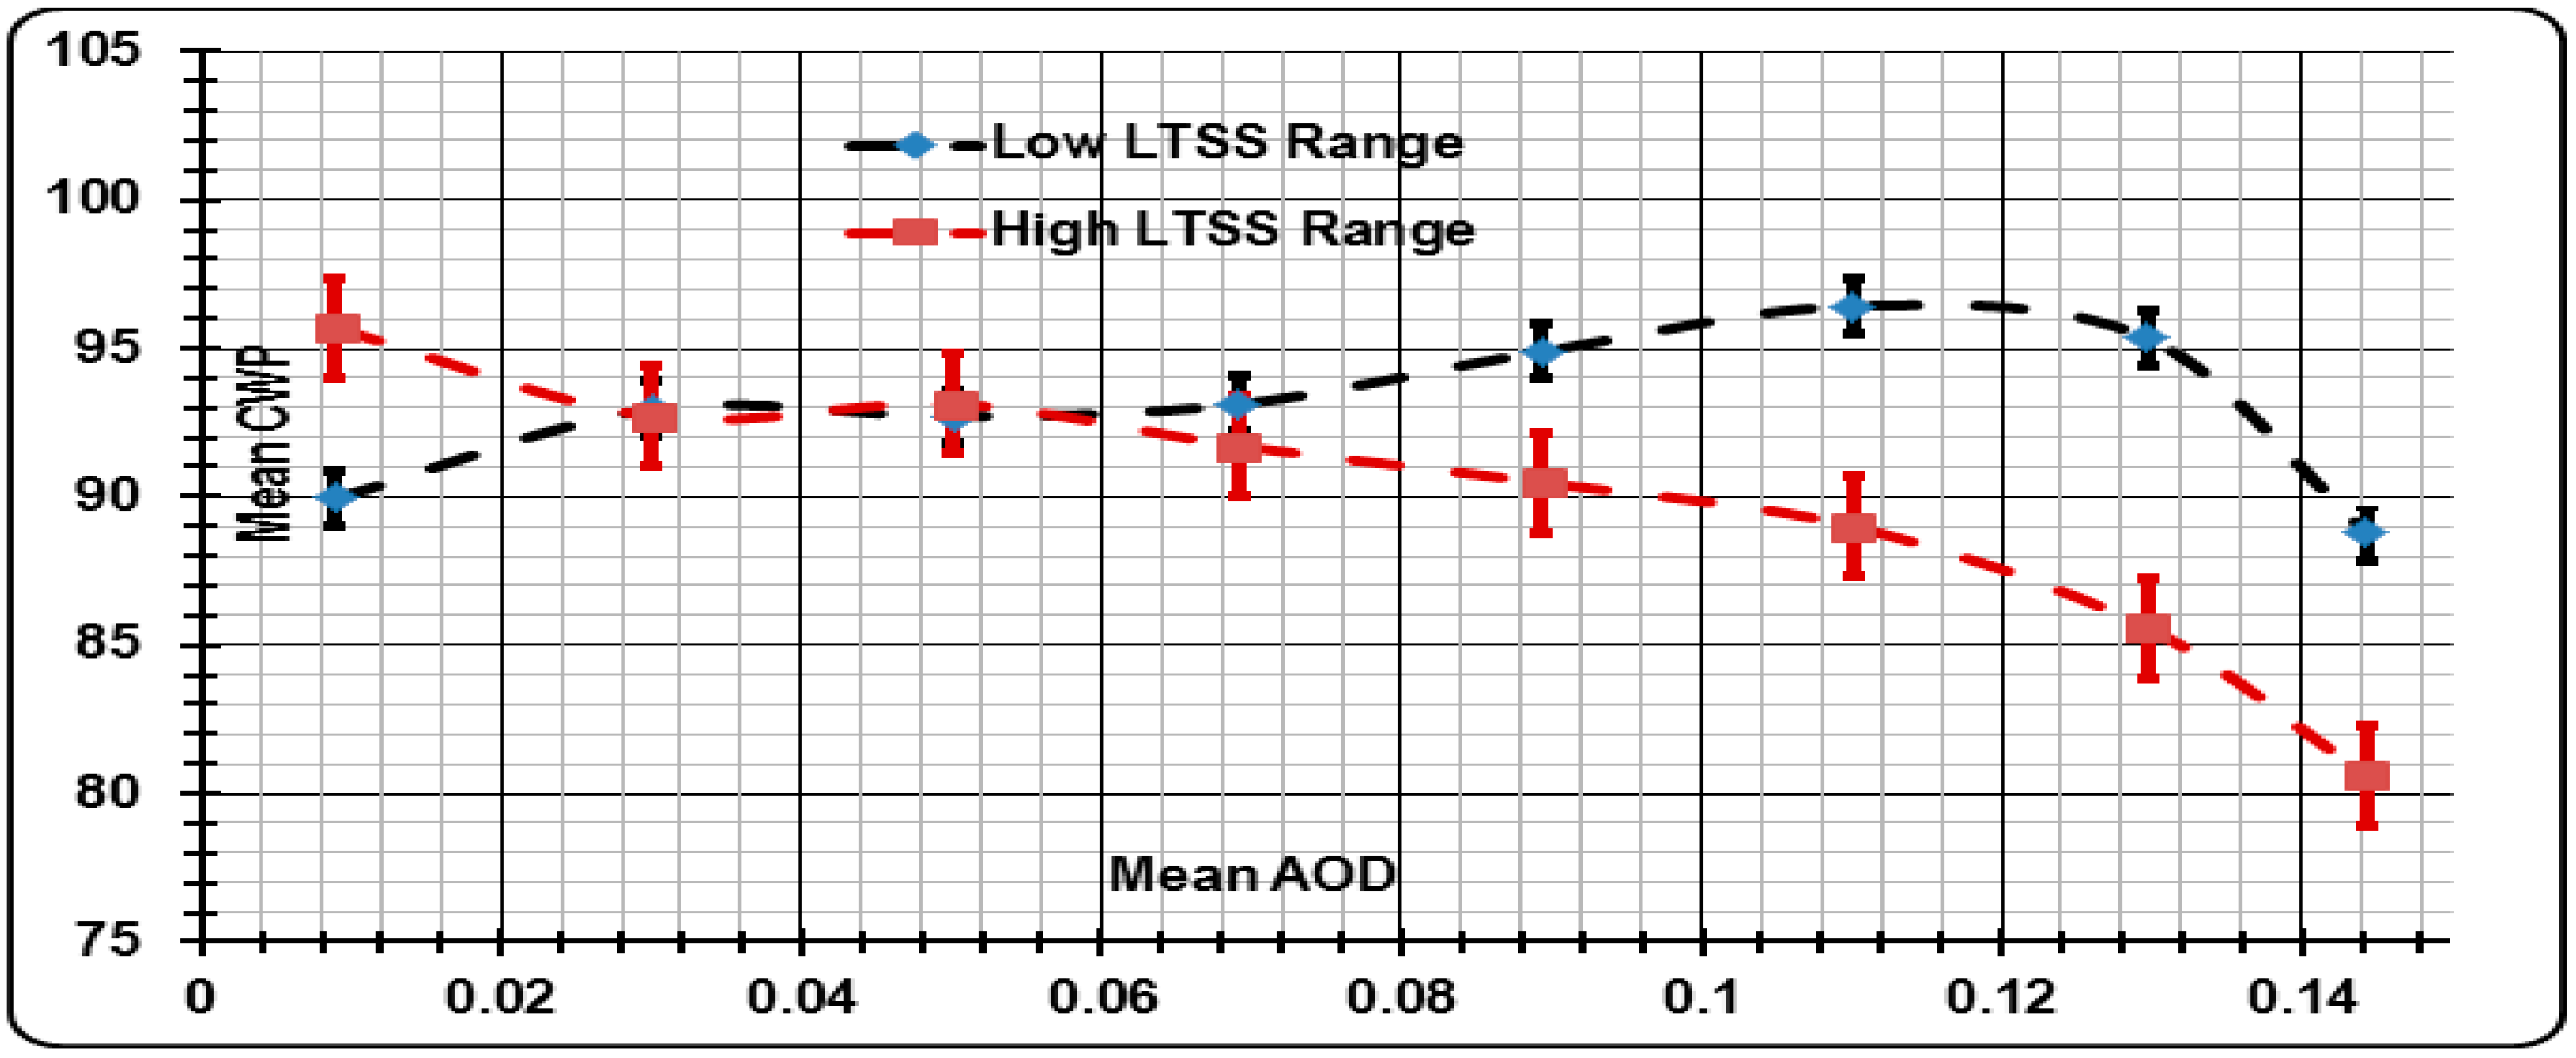
4.2.2. NAADR_Land (Continental US)
| Stability | AODpeak | CWPpeak | βmoistening | βdrying |
|---|---|---|---|---|
| Low LTSS | 0.243 ± 0.011 | 161 ± 1.74 | 11.15 ± 0.27 | –2.67 ± 0.27 |
| High LTSS | 0.354 ± 0.011 | 70.0 ± 1.74 | 1.24 ± 0.22 | –1.352 ± 0.22 |
| (ΔX/ X Low LTSS) % | 16.5% ↑ | 56.5% ↓ | 89% ↓ | 49.4% ↓ |

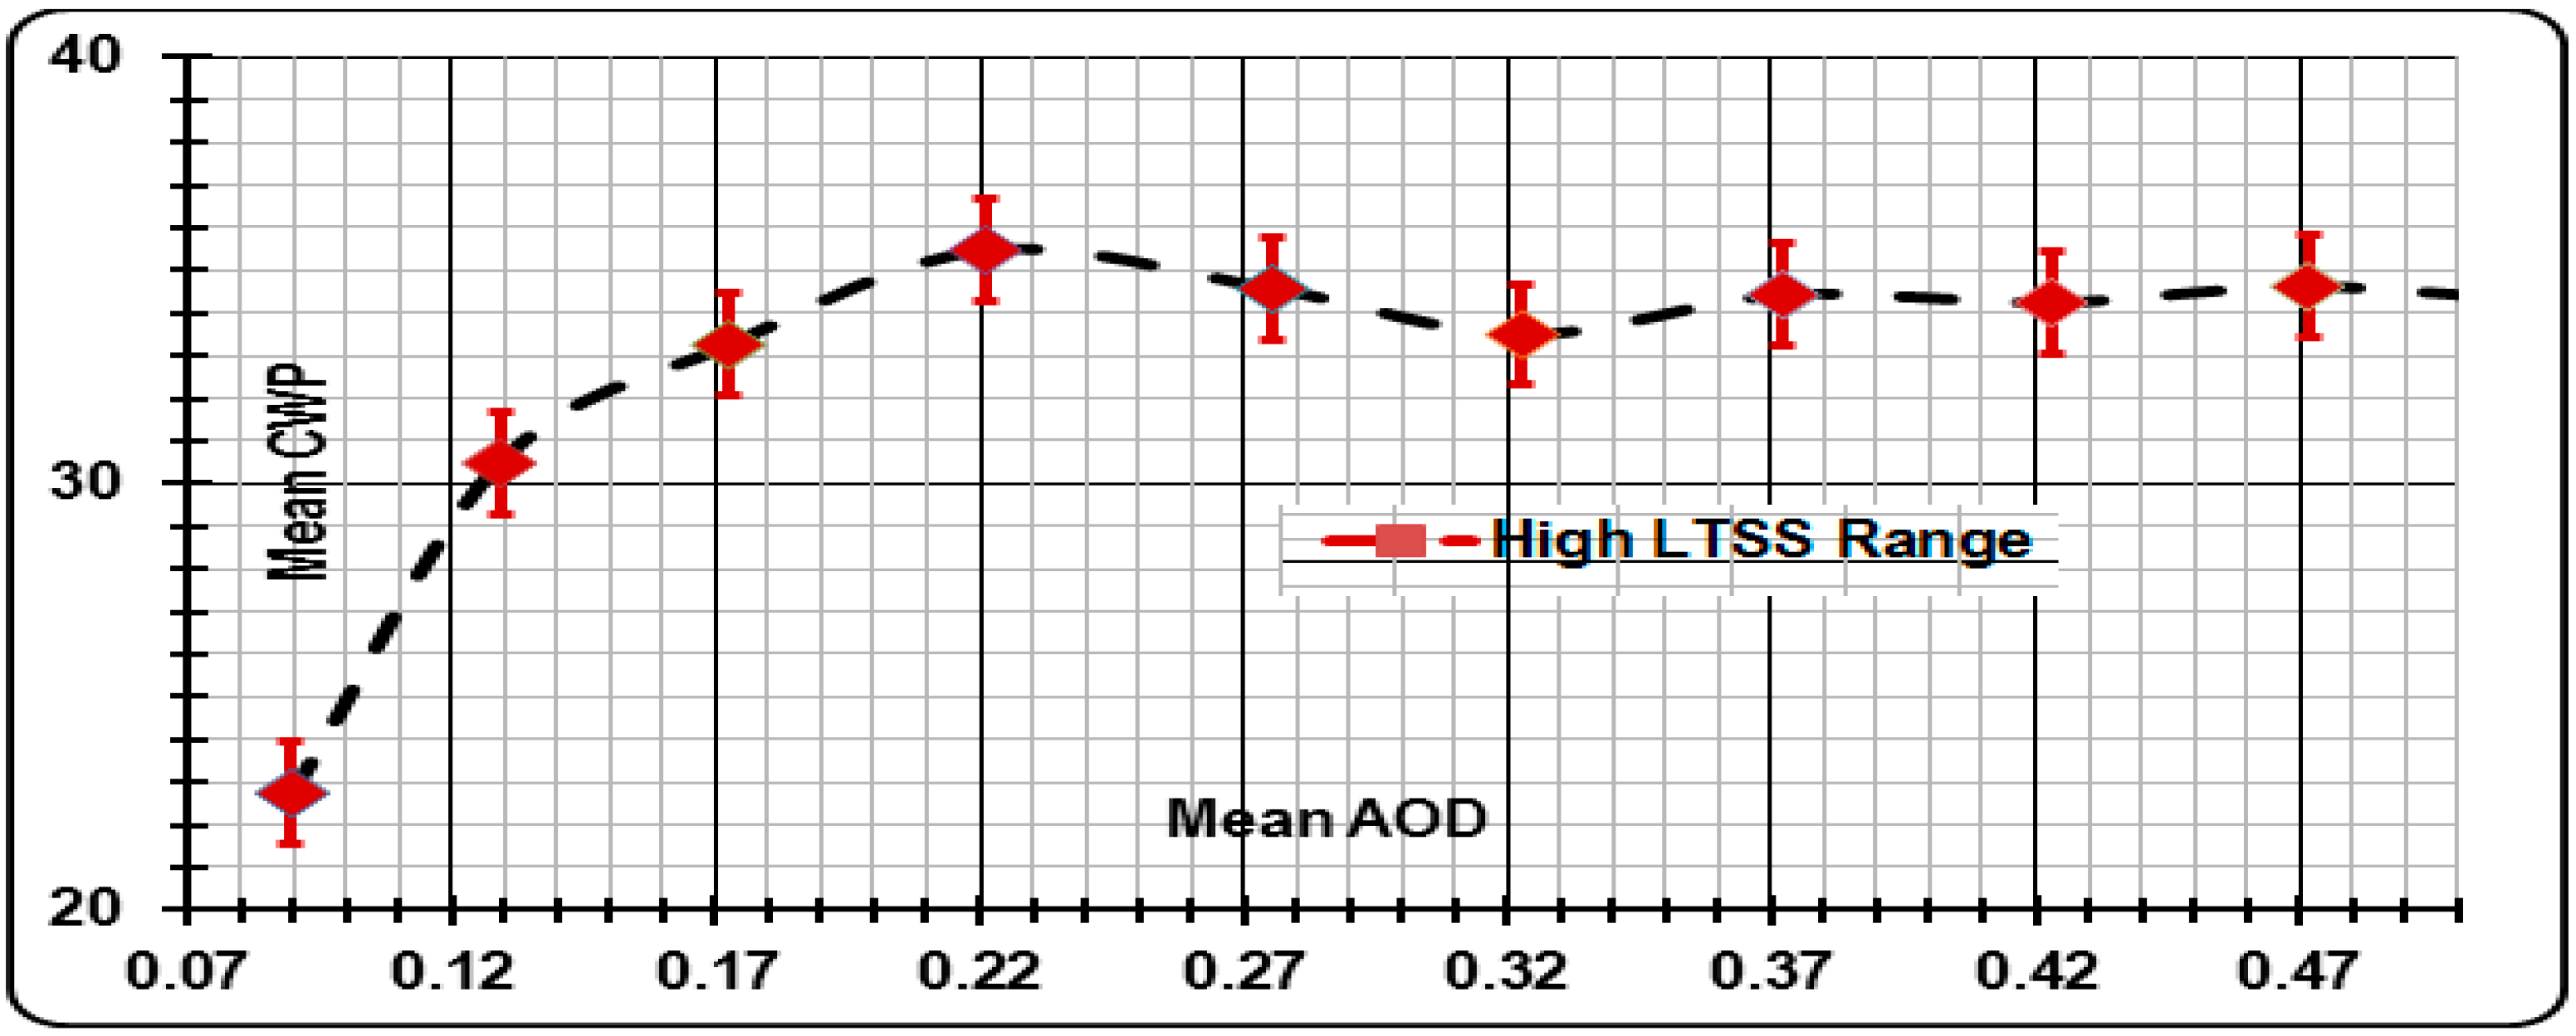
4.2.3. AADR_Sahara
| Stability | AODpeak | CWPpeak | βmoistening | βdrying |
|---|---|---|---|---|
| Low LTSS | -- | -- | -- | -- |
| High LTSS | 0.221 ± 0.12 | 35.48 ± 1.95 | 0.591 ± 0.245 | –0.026 ± 0.245 |
| (ΔX/ X Low LTSS) % | -- | -- | -- | -- |

4.2.4. AADR_SubTrop (off the coast of Southern African Agricultural Region).
| Stability | AODpeak | CWPpeak | βmoistening | βdrying |
|---|---|---|---|---|
| Low LTSS | 0.085 ± 0.004 | 27.12 ± 0.51 | 0.186 ± 0.29 | –0.311 ± 0.29 |
| High LTSS | 0.035 ± 0.004 | 24.76 ± 0.51 | 0.069 ± 0.29 | –0.337 ± 0.29 |
| (ΔX/X Low LTSS) % | 59% ↓ | 9.5% ↓ | 63% ↓ | 8.4% ↑ |

4.2.5. AADR_URBAN

| Stability | AODpeak | CWPpeak | βmoistening | βdrying |
|---|---|---|---|---|
| Low LTSS | 0.11± 0.012 | 96.43 ± 1.95 | 0.024 ± 0.103 | –0.285 ± 0.103 |
| High LTSS | 0.01 ± 0.012 | 95.68 ± 1.95 | -- | –0.047 ± 0.103 |
| (ΔX/ X Low LTSS) % | 91% ↓ | 0.7% ↓ | -- | 83.5% ↑ |
4.3. Evaluation by Multilinear Regression Analysis (MLRA)

| Region Type | Moistening (β > 0) | Drying (β < 0) | |||||
|---|---|---|---|---|---|---|---|
| Log (AOD) | LTSS | WV | Log (AOD) | LTSS | WV | ||
| NAADR_Marine | Low LTSS | –0.52 | 0.39 | 0.09 | 0.33 | 0.50 | 0.17 |
| High LTSS | –0.52 | –0.41 | 0.07 | 0.35 | –0.33 | –0.32 | |
| NAADR_Land | Low LTSS | 0.04 | 0.93 | –0.03 | –0.05 | 0.92 | 0.03 |
| High LTSS | 0.29 | 0.59 | 0.12 | 0.15 | 0.16 | –0.69 | |
| AADR_Sahara | Low LTSS | 0 | –0.04 | 0.96 | 0.94 | 0.01 | 0.05 |
| High LTSS | 0 | 0 | –1 | 0.78 | –0.18 | –0.04 | |
| AADR_SubTrop | Low LTSS | –0.50 | 0.24 | –0.26 | 0.69 | 0.26 | 0.05 |
| High LTSS | 0.42 | 0.30 | –0.28 | 0.36 | –0.39 | 0.25 | |
| AADR_Urban | Low LTSS | 0.39 | 0.11 | 0.5 | 0.21 | 0.36 | 0.43 |
| High LTSS | 0.20 | 0.47 | 0.33 | 0.33 | –0.6 | –0.07 | |
5. Discussion
6. Conclusion
Acknowledgments
Author Contributions
Conflicts of Interest
References
- Lebsock, M.D.; Stephens, G.L.; Kummerow, C. Multisensor satellite observations of aerosol effects on warm clouds. J. Geophys. Res. 2008. [Google Scholar] [CrossRef]
- Nakajima, T.; Higurashi, A.; Kawamoto, K.; Penner, J.E. A possible correlation between satellite-derived cloud and aerosol microphysical parameters. Geophys. Res. Lett. 2001, 28, 1171–1174. [Google Scholar] [CrossRef]
- Bréon, F.M.; Tanre, D.; Generoso, S. Aerosol effect on cloud droplet size monitored from satellite. Science 2002, 295, 834–838. [Google Scholar] [CrossRef]
- Sekiguchi, M.; Nakajima, T.; Suzuki, K.; Kawamoto, K.; Higurashi, A.; Rosenfeld, D.; Sano, I.; Mukai, S. A study of the direct and indirect effects of aerosols using global satellite datasets of aerosol and cloud parameters. J. Geophys. Res. 2003. [Google Scholar] [CrossRef]
- Matsui, T.; Masunaga, H.; Kreidenweis, S.M.; Pielke, R.A., Sr.; Tao, W.-K.; Chin, M.; Kaufman, Y.J. Satellite-based assessment of marine low cloud variability associated with aerosol, atmospheric stability, and the diurnal cycle. J. Geophys. Res. 2006. [Google Scholar] [CrossRef]
- Han, Q.; Rossow, W.B.; Zeng, J.; Welch, R. Three different behaviors of liquid water path of water clouds in aerosol-cloud interactions. J. Atmos. Sci. 2002, 59, 726–735. [Google Scholar] [CrossRef]
- Kaufman, Y.J.; Koren, I.; Remer, L.A.; Rosenfeld, D.; Rudich, Y. The effect of smoke, dust and pollution aerosol on shallow cloud development over the Atlantic Ocean. Proc. Natl. Acad. Sci. 2005, 102, 11207–11212. [Google Scholar] [CrossRef] [PubMed]
- Albrecht, B. Aerosols, Cloud microphysics, and fractional cloudiness. Science 1989, 245, 1227–1230. [Google Scholar] [CrossRef] [PubMed]
- Ferek, R.; Garrett, T.; Hobbes, P.V.; Strader, S.; Johnson, D.; Taylor, J.; Nielson, K.; Ackerman, A.; Kogan, Y.; Liu, Q.; et al. Drizzle suppression in ship tracks. J. Atmos. Sci. 2000, 57, 2707–2728. [Google Scholar]
- Vant-Hull, B.; Marshak, A.; Remer, L.; Li, Z. The effects of scattering angle and cumulus cloud geometry on satellite retrievals of cloud drop effective radius. Geosci. Rem. Sens. Lett. 2007, 45, 1039–1045. [Google Scholar] [CrossRef]
- Koren, I.; Kaufman, Y.J.; Remer, L.A.; Martins, V. Measurement of the effect of Amazon smoke on inhibition of cloud formation. Science 2004, 303, 1342–1345. [Google Scholar] [CrossRef] [PubMed]
- Taubman, B.A.; Marufu, L.; Vant-Hull, B.; Piety, C.; Doddridge, B.; Dickerson, R.; Li, Z. Smoke over haze: Aircraft observations of chemical and optical properties and the effects on heating rates and stability. J. Geophys. Res. 2004. [Google Scholar] [CrossRef]
- Ackerman, A.; Toon, O.B.; Stevens, D.E.; Heymsfield, A.J.; Ramanathan, V.; Welton, E.J. Reduction of tropical cloudiness by soot. Science 2000, 288, 1042–1047. [Google Scholar] [CrossRef] [PubMed]
- Koren, I.; Kaufman, Y.J.; Rosenfeld, D.; Remer, L.A.; Rudich, Y. Aerosol invigoration and restructuring of Atlantic convective clouds. Geophys. Res. Lett. 2005. [Google Scholar] [CrossRef]
- Burnet, F.; Brenguier, J.-L. Observational study of the entrainment-mixing process in warm convective clouds. J. Atmos. Sci. 2007, 64, 1995–2011. [Google Scholar] [CrossRef]
- Sinclair, V.A.; Gray, S.L.; Belcher, S.E. Controls on boundary layer ventilation: Boundary layer processes and large-scale dynamics. J. Geophys. Res. 2010. [Google Scholar] [CrossRef]
- Altaratz, O.; Bar-Or, R.Z.; Wollner, U.; Koren, I. Relative humidity and its effects on aerosol optical depth in the vicinity on convective clouds. Environ. Res. Lett. 2013, 8, 34025–34030. [Google Scholar] [CrossRef]
- Fan, J.; Leung, L.R.; Li, Z.; Morrison, H.; Qian, Y.; Zhou, Y.; Chen, H. Aerosol impacts on clouds and precipitation in southeast China–Results from bin and bulk microphysics for the 2008 AMF-China field campaign. J. Geophys. Res. 2012. [Google Scholar] [CrossRef]
- Lebo, Z.J.; Morrison, H.; Seinfeld, J.H. Are simulated aerosol induced effects on deep convective clouds strongly dependent on saturation adjustment? Atmos. Chem. Phys. Discuss. 2012, 12, 10059–10114. [Google Scholar] [CrossRef]
- Wang, H.; Feingold, G. Modeling mesoscale cellular structures and drizzle in marine stratocumulus. Part I: Impact of drizzle on the formation and evolution of open cells. J. Atmos. Sci. 2009, 66, 3237–3256. [Google Scholar] [CrossRef]
- Lebo, Z.J.; Feingold, G. On the relationship between responses in cloud water and precipitation to changes in aerosol. Atmos. Chem. Phys. 2014, 14, 11817–11831. [Google Scholar] [CrossRef]
- McComiskey, A.; Feingold, G. The scale problem in quantifying aerosol indirect effects. Atmos. Chem. Phys. 2012, 12, 1031–1049. [Google Scholar] [CrossRef]
- Storelvmo, T.; Kristjánsson, J.E.; Myhre, G.; Johnsrud, M.; Stordal, F. Combined observational and modeling based study of the aerosol indirect effect. Atmos. Chem. Phys. 2006, 6, 3583–3601. [Google Scholar] [CrossRef]
- Storer, R.L.; Van den Heever, S.C.; Stephens, G.L. Modeling aerosol impacts on convective storms in different environments. J. Atmos. Sci. 2010, 67, 3904–3915. [Google Scholar] [CrossRef]
- Ackerman, A.; Kirkpatrick, M.P.; Stevens, D.E.; Toon, O.B. The impact of humidity above stratiform clouds on indirect aerosol climate forcing. Nature 2004, 432, 1014–1017. [Google Scholar] [CrossRef] [PubMed]
- Ten Hoeve, J.E.; Remer, L.A.; Jacobson, M.Z. Biomass burning aerosol effects on clouds. Atmos. Chem. Phys. 2011, 11, 3021–3036. [Google Scholar] [CrossRef]
- Han, Q.Y.; Rossow, W.B.; Chou, J.; Welch, R. Global variation of cloud effective droplet concentration of low-level clouds. Geophys. Res. Letts. 1998, 25, 1419–1422. [Google Scholar] [CrossRef]
- Han, Q.; Rossow, W.B.; Welch, R.M.; White, A.; Chou, J. Validation of satellite retrievals of cloud microphysics and liquid water path using observations from FIRE. J. Atmos. Sci. 1995, 52, 4183–4195. [Google Scholar] [CrossRef]
- Andreae, M.O. Correlation between cloud condensation nuclei concentration and aerosol optical thickness in remote and polluted regions. Atmos. Chem. Phys. 2009, 9, 543–556. [Google Scholar] [CrossRef]
- Squires, P. The microstructure and colloidal stability of warm clouds. Tellus 1958, 10, 262–271. [Google Scholar] [CrossRef]
- Rosenfeld, D.; Lensky, I.M. Satellite-based insight into precipitation formation in continental and maritime convective clouds. Bull. Am. Meteorol. Soc. 1998, 79, 2457–2476. [Google Scholar]
- Wang, M.; Ghan, S.; Liu, X.; L’Ecuyer, T.S.; Zhang, K.; Morrison, H.; Ovchinnikov, M.; Easter, R.; Marchand, R.; Chand, D.; et al. Constraining cloud lifetime effects of aerosols using A-Train satellite measurements. Geophys. Res. Lett. 2012. [Google Scholar] [CrossRef]
- Terai, C.R.; Wood, R.; Leon, D.C.; Zuidema, P. Does precipitation susceptibility vary with increasing cloud thickness in marine stratocumulus? Atmos. Chem. Phys. 2012, 12, 4567–4583. [Google Scholar] [CrossRef]
- Mann, J.A.; Chiu, J.C.; Hogan, R.J.; O’Connor, E.J.; L’Ecuyer, T.S.; Stein, T.H.M.; Jefferson, A. Aerosol impacts on drizzle properties in warm clouds from ARM Mobile Facility maritime and continental deployments. J. Geophys. Res. 2014, 119, 4136–4148. [Google Scholar] [CrossRef]
- Duong, H.T.; Sorooshian, A.; Feingold, G. Investigating potential biases in observed and modeled metrics of aerosol-cloud precipitation interactions. Atmos. Chem. Phys. 2011, 11, 4027–4037. [Google Scholar] [CrossRef]
- Feingold, G.; McComiskey, A.; Rosenfeld, D.; Sorooshian, A. On the relationship between cloud contact time and precipitation susceptibility to aerosol. J. Geophys. Res. 2013, 118, 10544–10554. [Google Scholar]
- Wen, G.; Marshak, A.; Cahalan, R.F.; Remer, L.A.; Kleidman, R.G. 3D aerosol-cloud radiative interaction observed in collocated MODIS and ASTER images of cumulus cloud fields. J. Geophys. Res. 2007. [Google Scholar] [CrossRef]
- Mauger, G.S.; Norris, J.R. Meteorological bias in satellite estimates of aerosol cloud relationships. Geophys. Res. Lett. 2007. [Google Scholar] [CrossRef]
- Eilers, P.H.C.; Goeman, J.J. Enhancing scaterplots with smoothed densities. Bioinformatics 2004, 20, 623–628. [Google Scholar] [CrossRef] [PubMed]
- Xue, H.; Feingold, G. Large-eddy simulation of trade wind cumuli: Investigation of aerosol indirect effects. J. Atmos. Sci. 2006, 63, 1605–1622. [Google Scholar] [CrossRef]
- Bony, S.; Dufresne, J.-L. Marine boundary layer clouds at the heart of tropical cloud feedback uncertainties in climate models. Geophys. Res. Lett. 2006, 32, L20806. [Google Scholar] [CrossRef]
- Tao, W.K.; Chen, J.P.; Li, Z.Q.; Wang, C.; Zhang, C.D. Impact of aerosols on convective clouds and precipitation. Rev. Geophys. 2012. [Google Scholar] [CrossRef]
© 2015 by the authors; licensee MDPI, Basel, Switzerland. This article is an open access article distributed under the terms and conditions of the Creative Commons Attribution license (http://creativecommons.org/licenses/by/4.0/).
Share and Cite
Savane, O.S.; Vant-Hull, B.; Mahani, S.; Khanbilvardi, R. Effects of Aerosol on Cloud Liquid Water Path: Statistical Method a Potential Source for Divergence in Past Observation Based Correlative Studies. Atmosphere 2015, 6, 273-298. https://doi.org/10.3390/atmos6030273
Savane OS, Vant-Hull B, Mahani S, Khanbilvardi R. Effects of Aerosol on Cloud Liquid Water Path: Statistical Method a Potential Source for Divergence in Past Observation Based Correlative Studies. Atmosphere. 2015; 6(3):273-298. https://doi.org/10.3390/atmos6030273
Chicago/Turabian StyleSavane, Ousmane Sy, Brian Vant-Hull, Shayesteh Mahani, and Reza Khanbilvardi. 2015. "Effects of Aerosol on Cloud Liquid Water Path: Statistical Method a Potential Source for Divergence in Past Observation Based Correlative Studies" Atmosphere 6, no. 3: 273-298. https://doi.org/10.3390/atmos6030273
APA StyleSavane, O. S., Vant-Hull, B., Mahani, S., & Khanbilvardi, R. (2015). Effects of Aerosol on Cloud Liquid Water Path: Statistical Method a Potential Source for Divergence in Past Observation Based Correlative Studies. Atmosphere, 6(3), 273-298. https://doi.org/10.3390/atmos6030273