
Investigations of the Diurnal Variation of Vertical HCHO Profiles Based on MAX-DOAS Measurements in Beijing: Comparisons with OMI Vertical Column Data

 ,
, 
 ,
,
Abstract
:1. Introduction
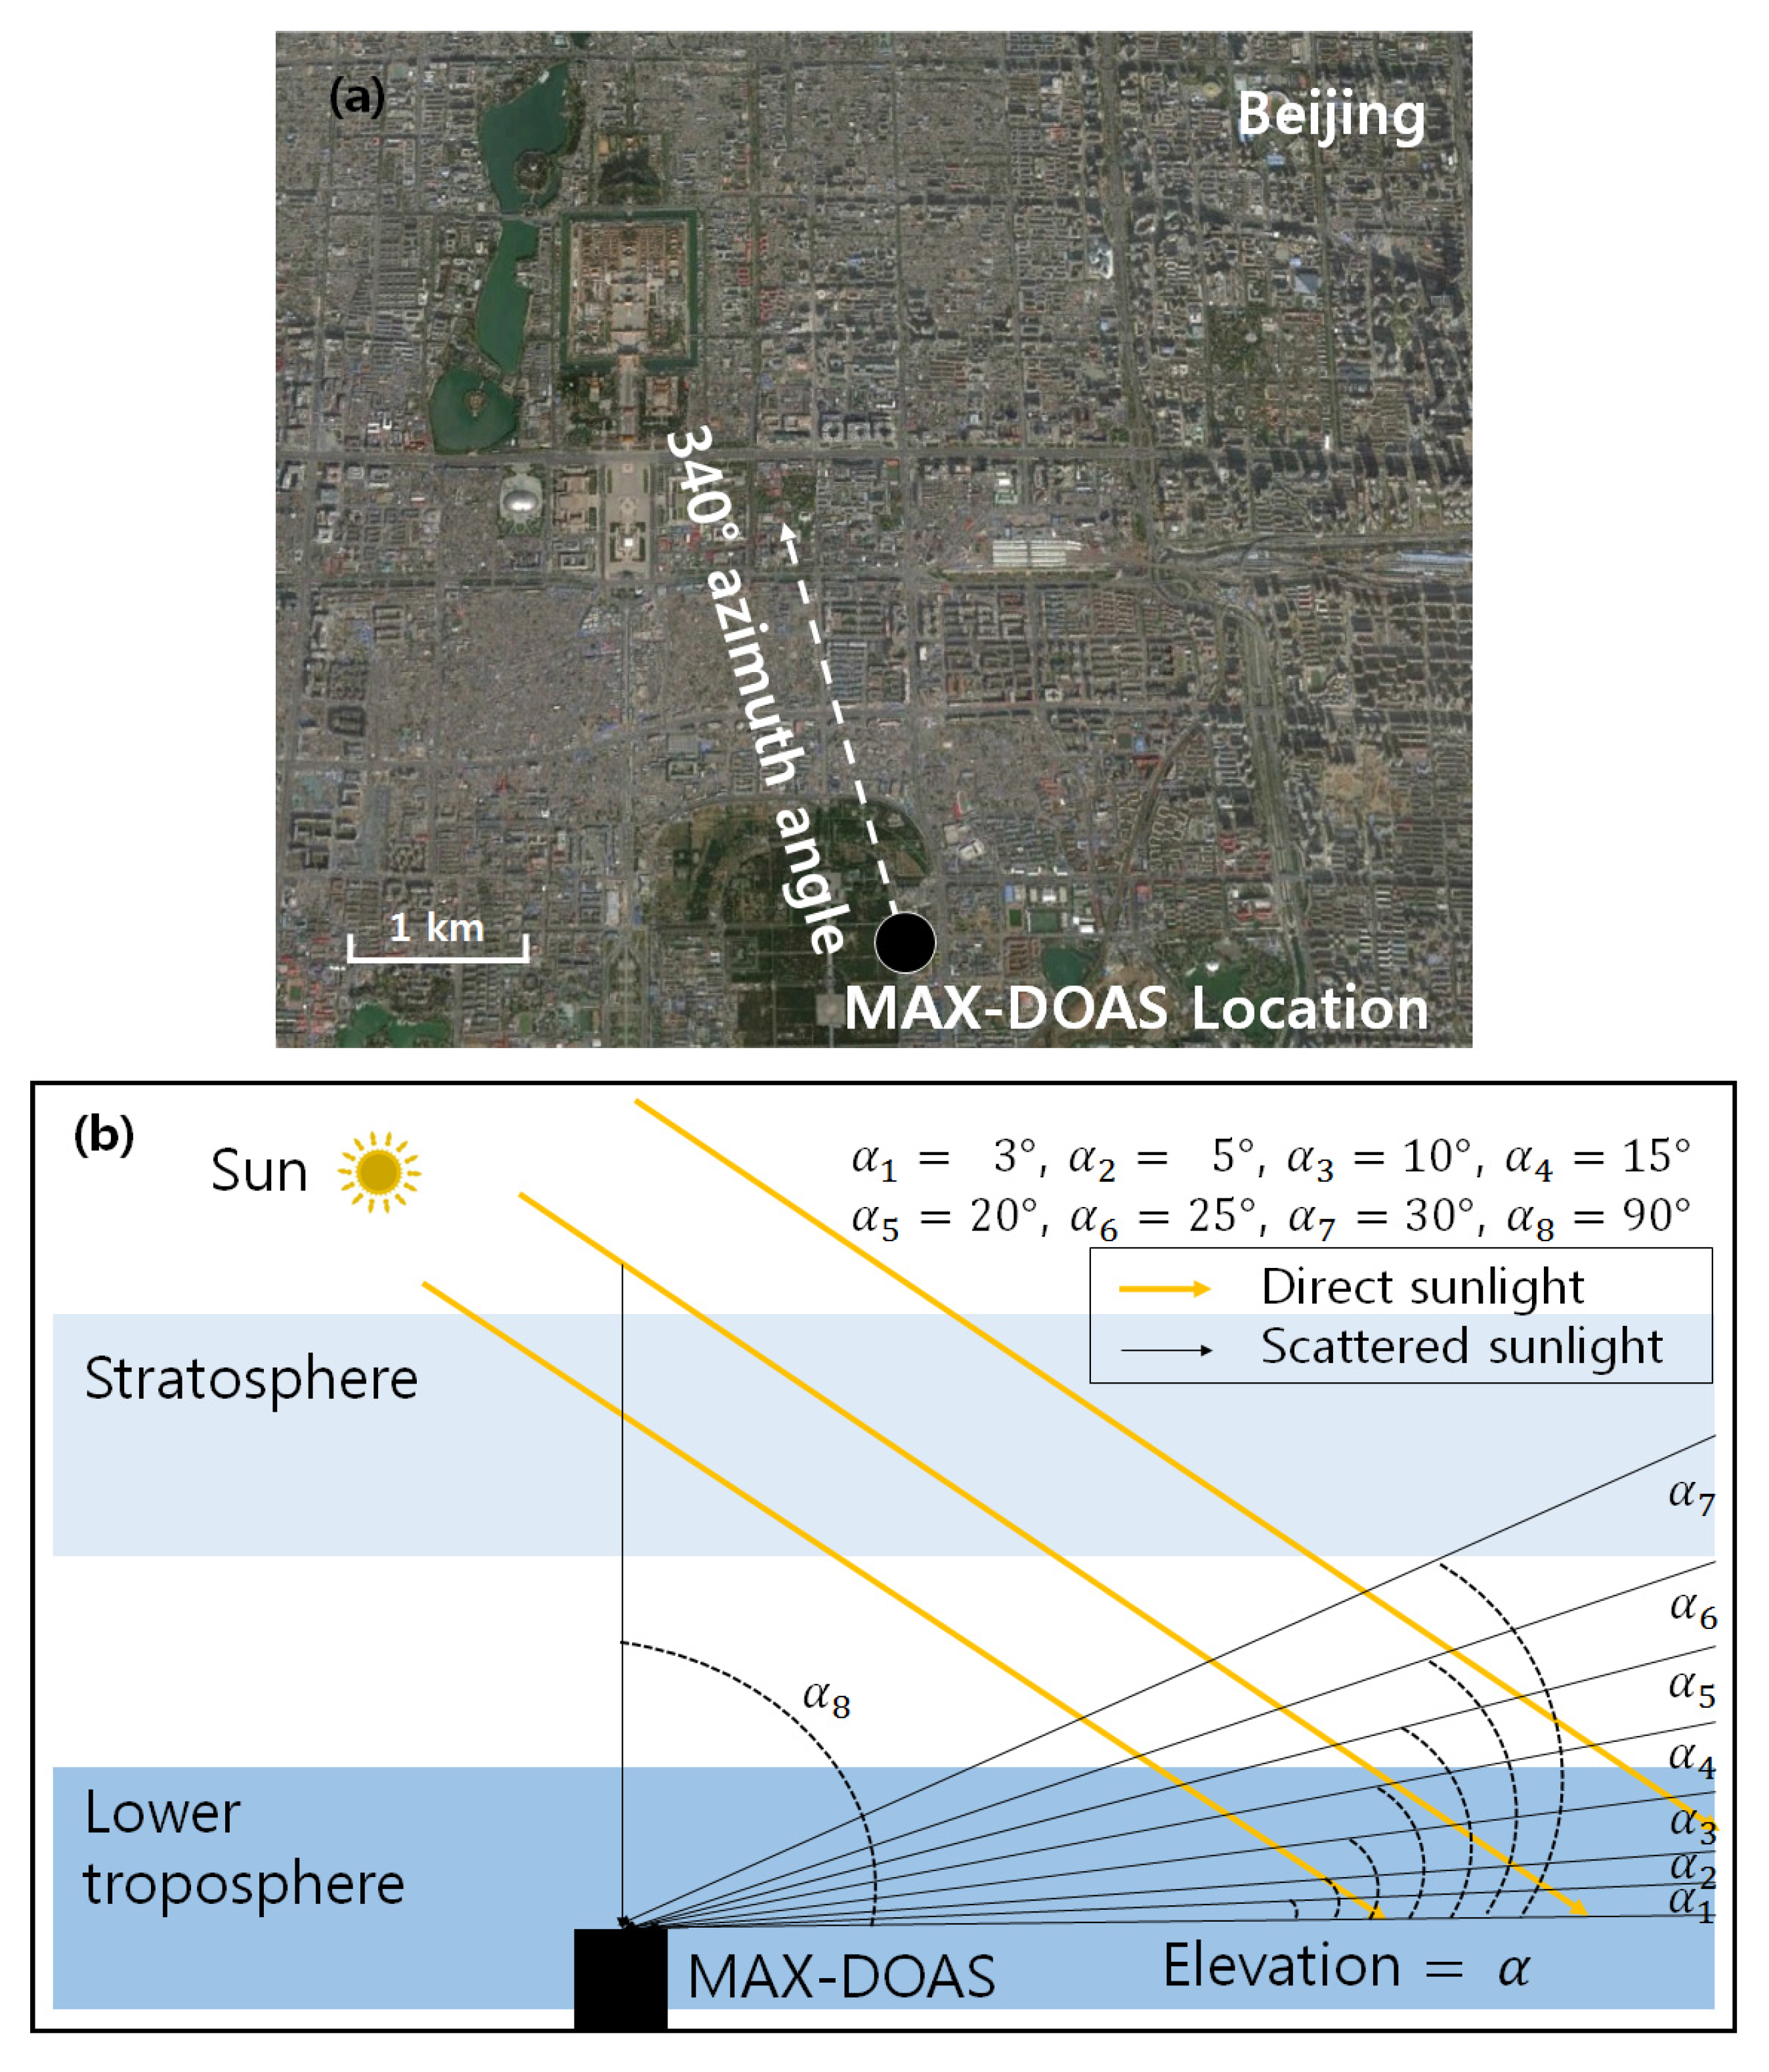
2. Measurements

3. MAX-DOAS Data Analysis
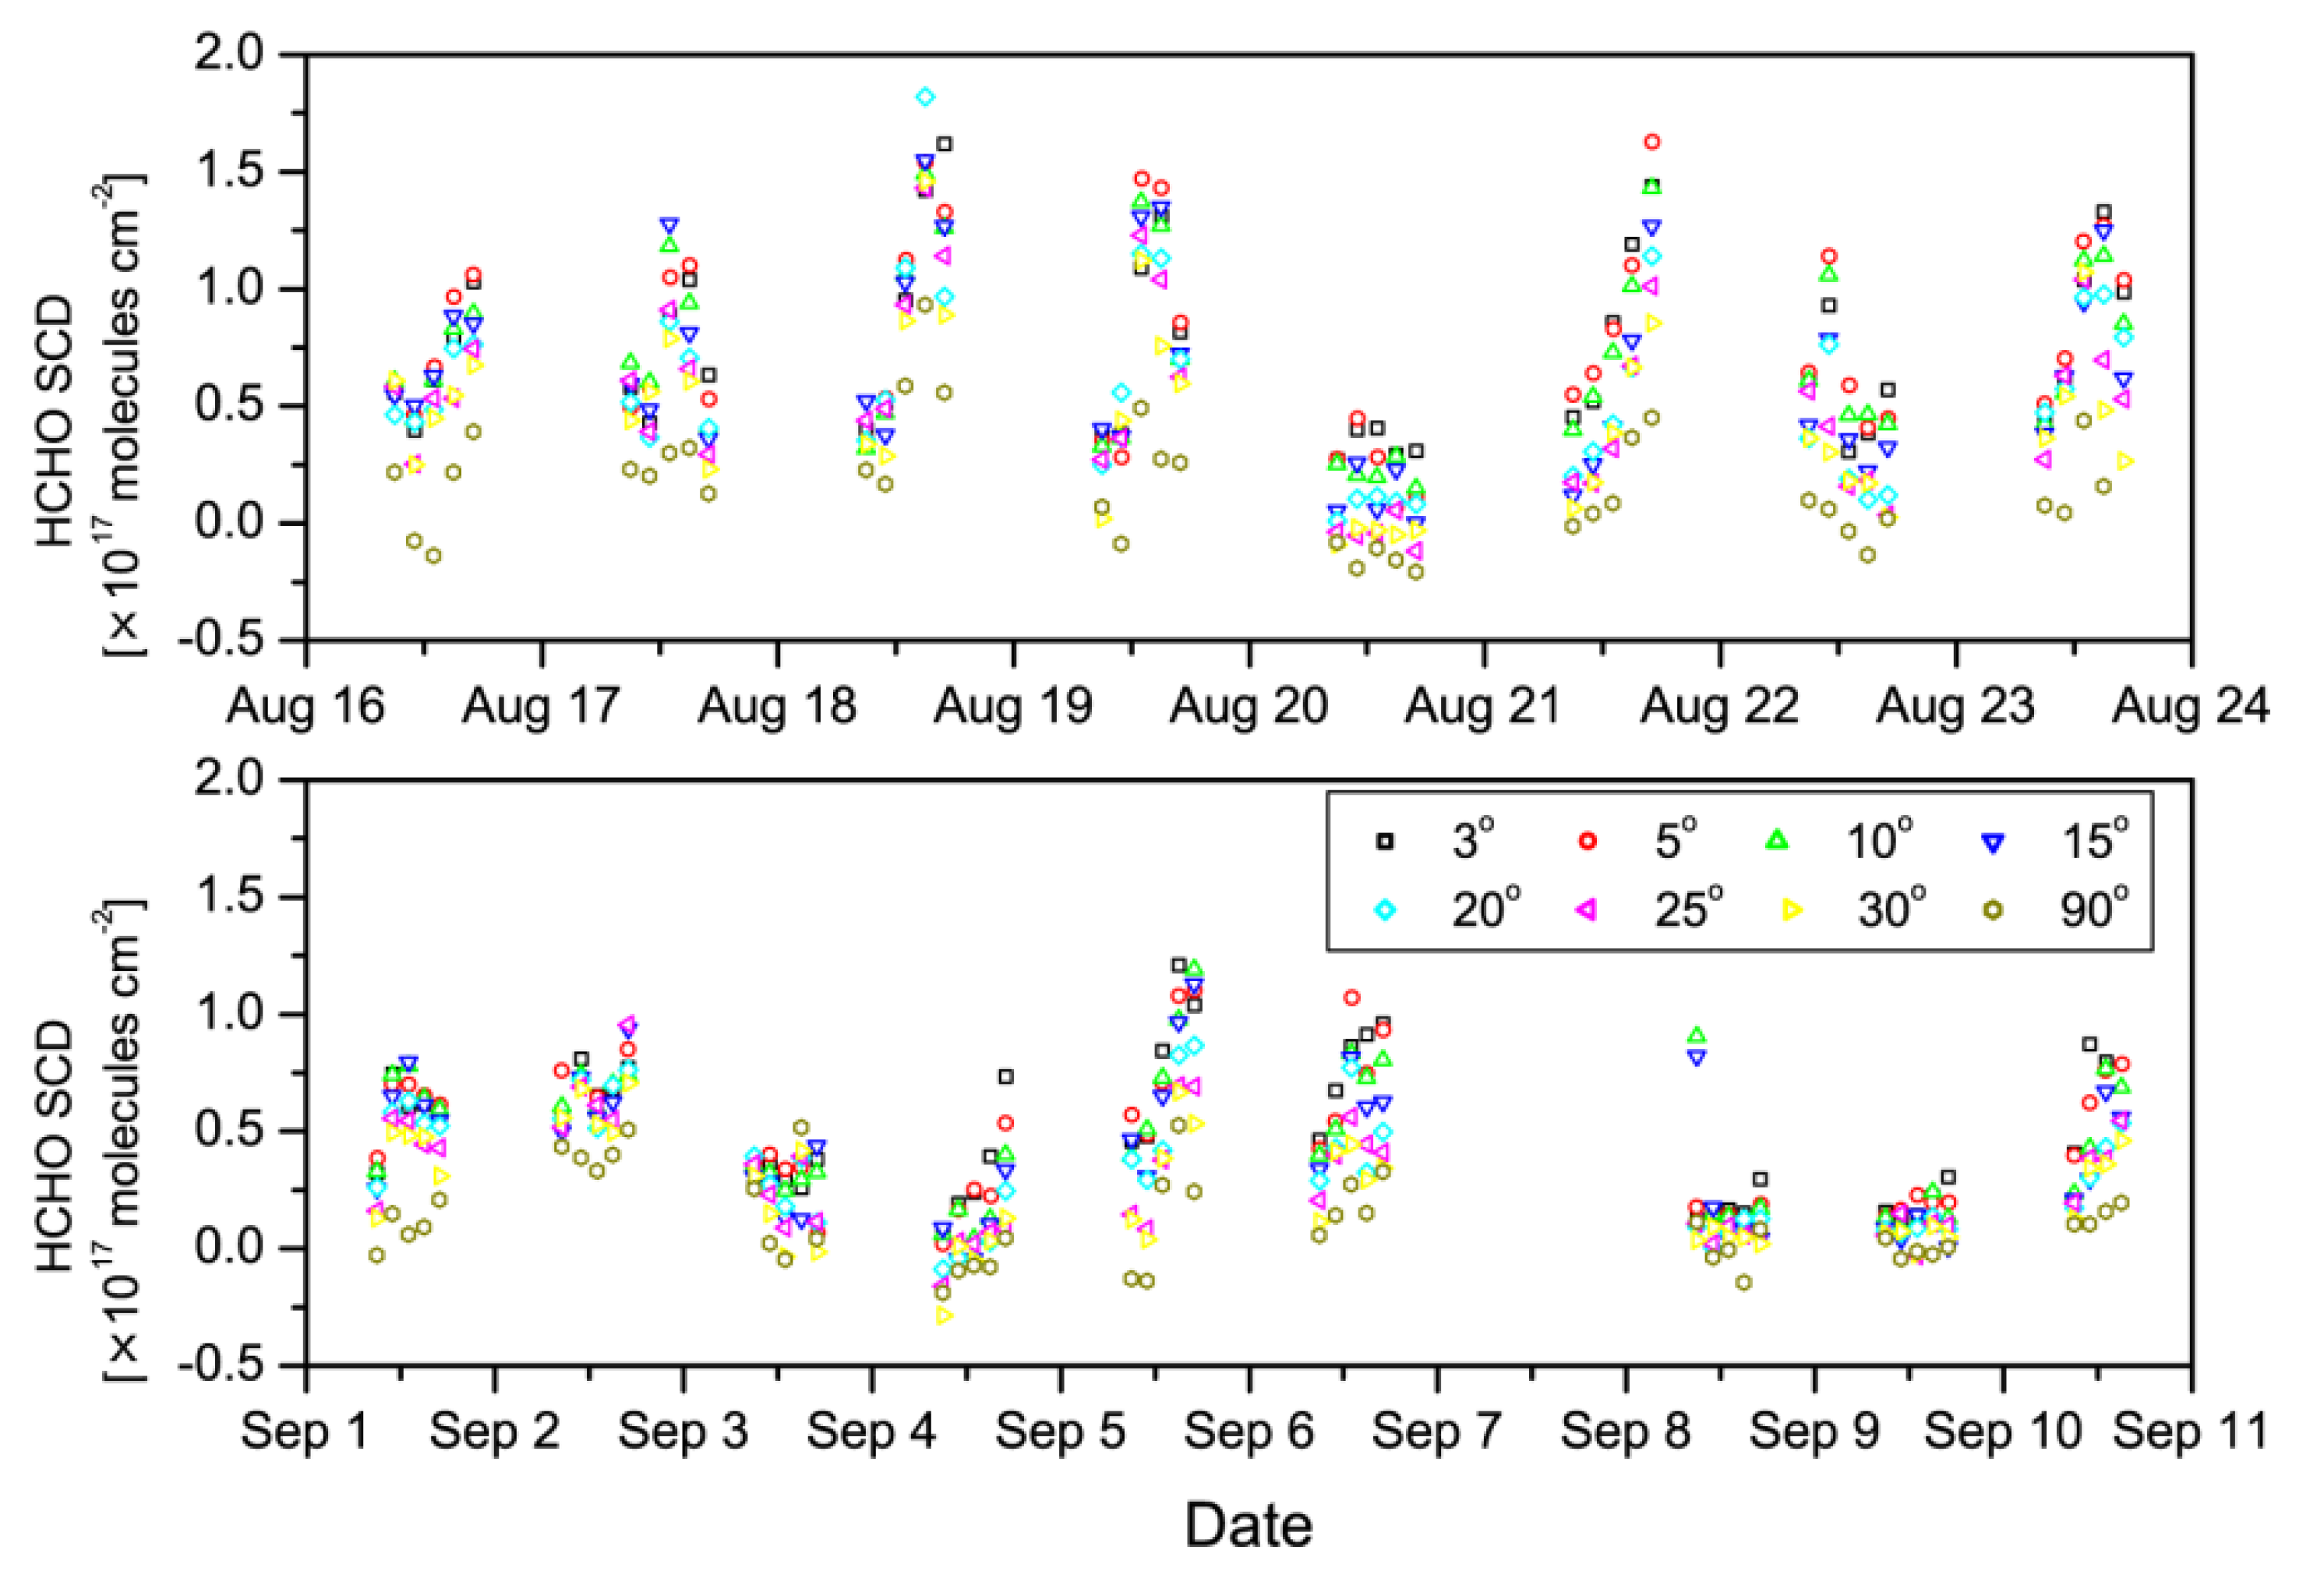
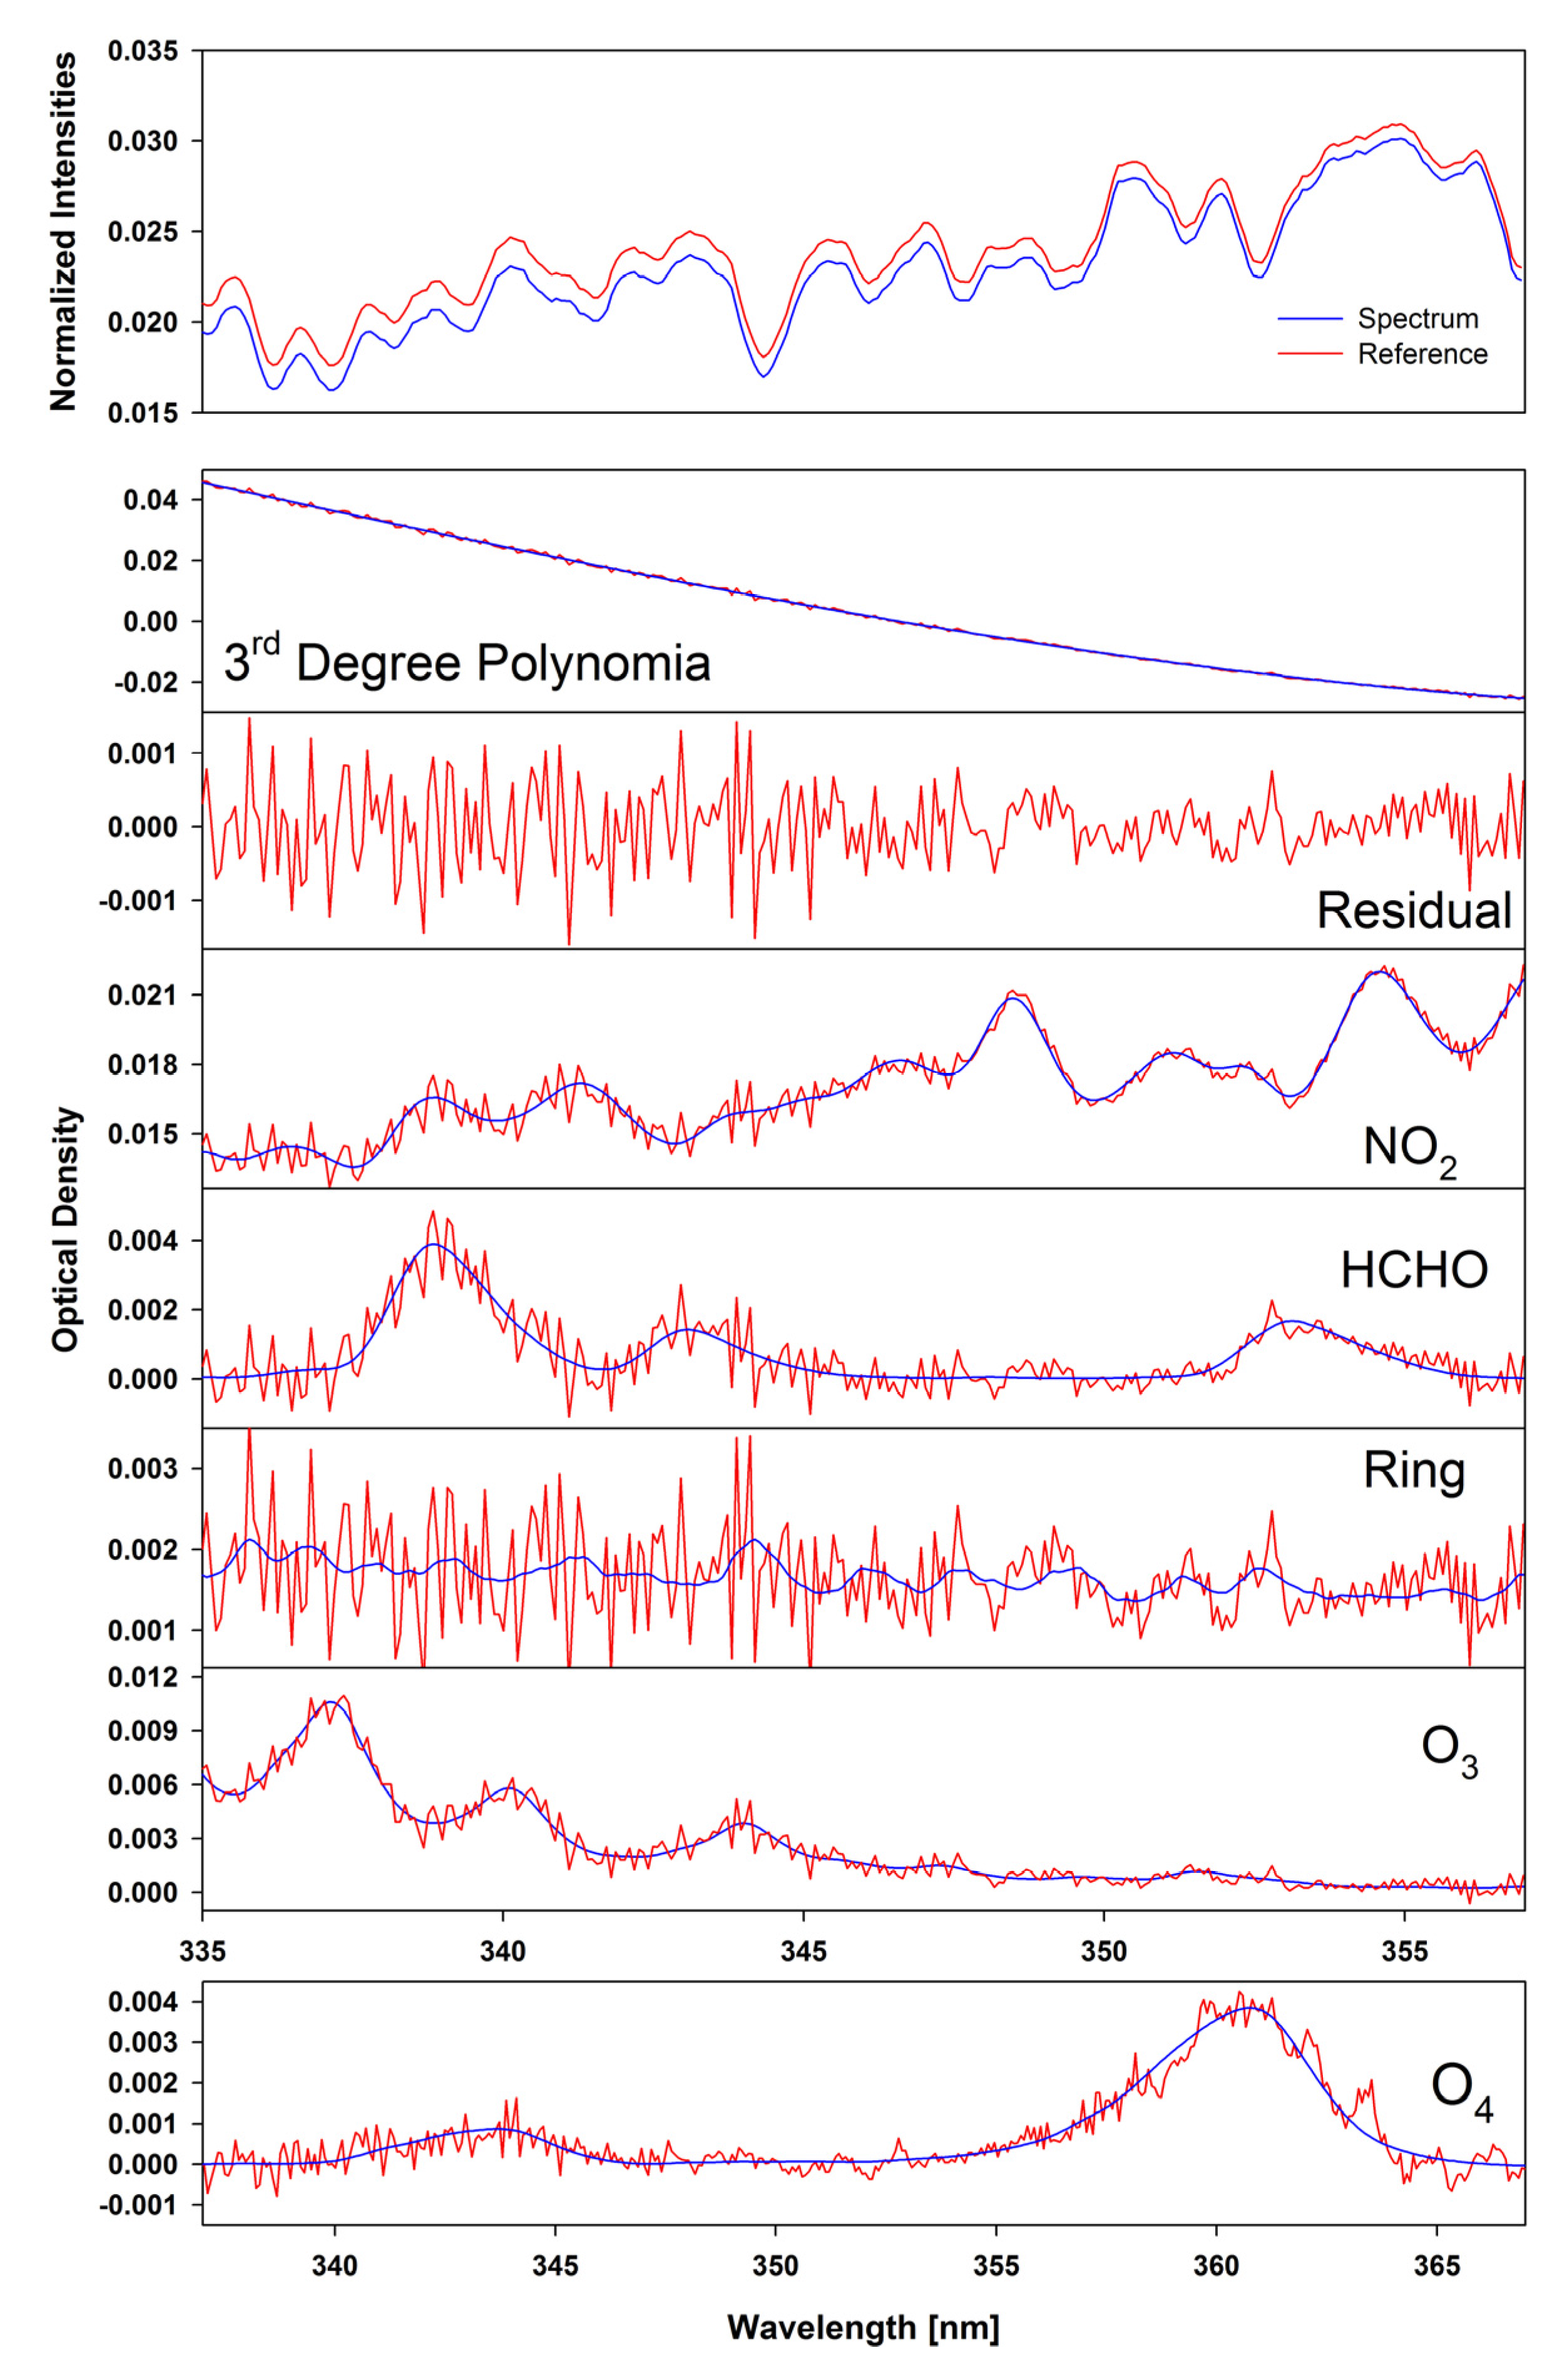
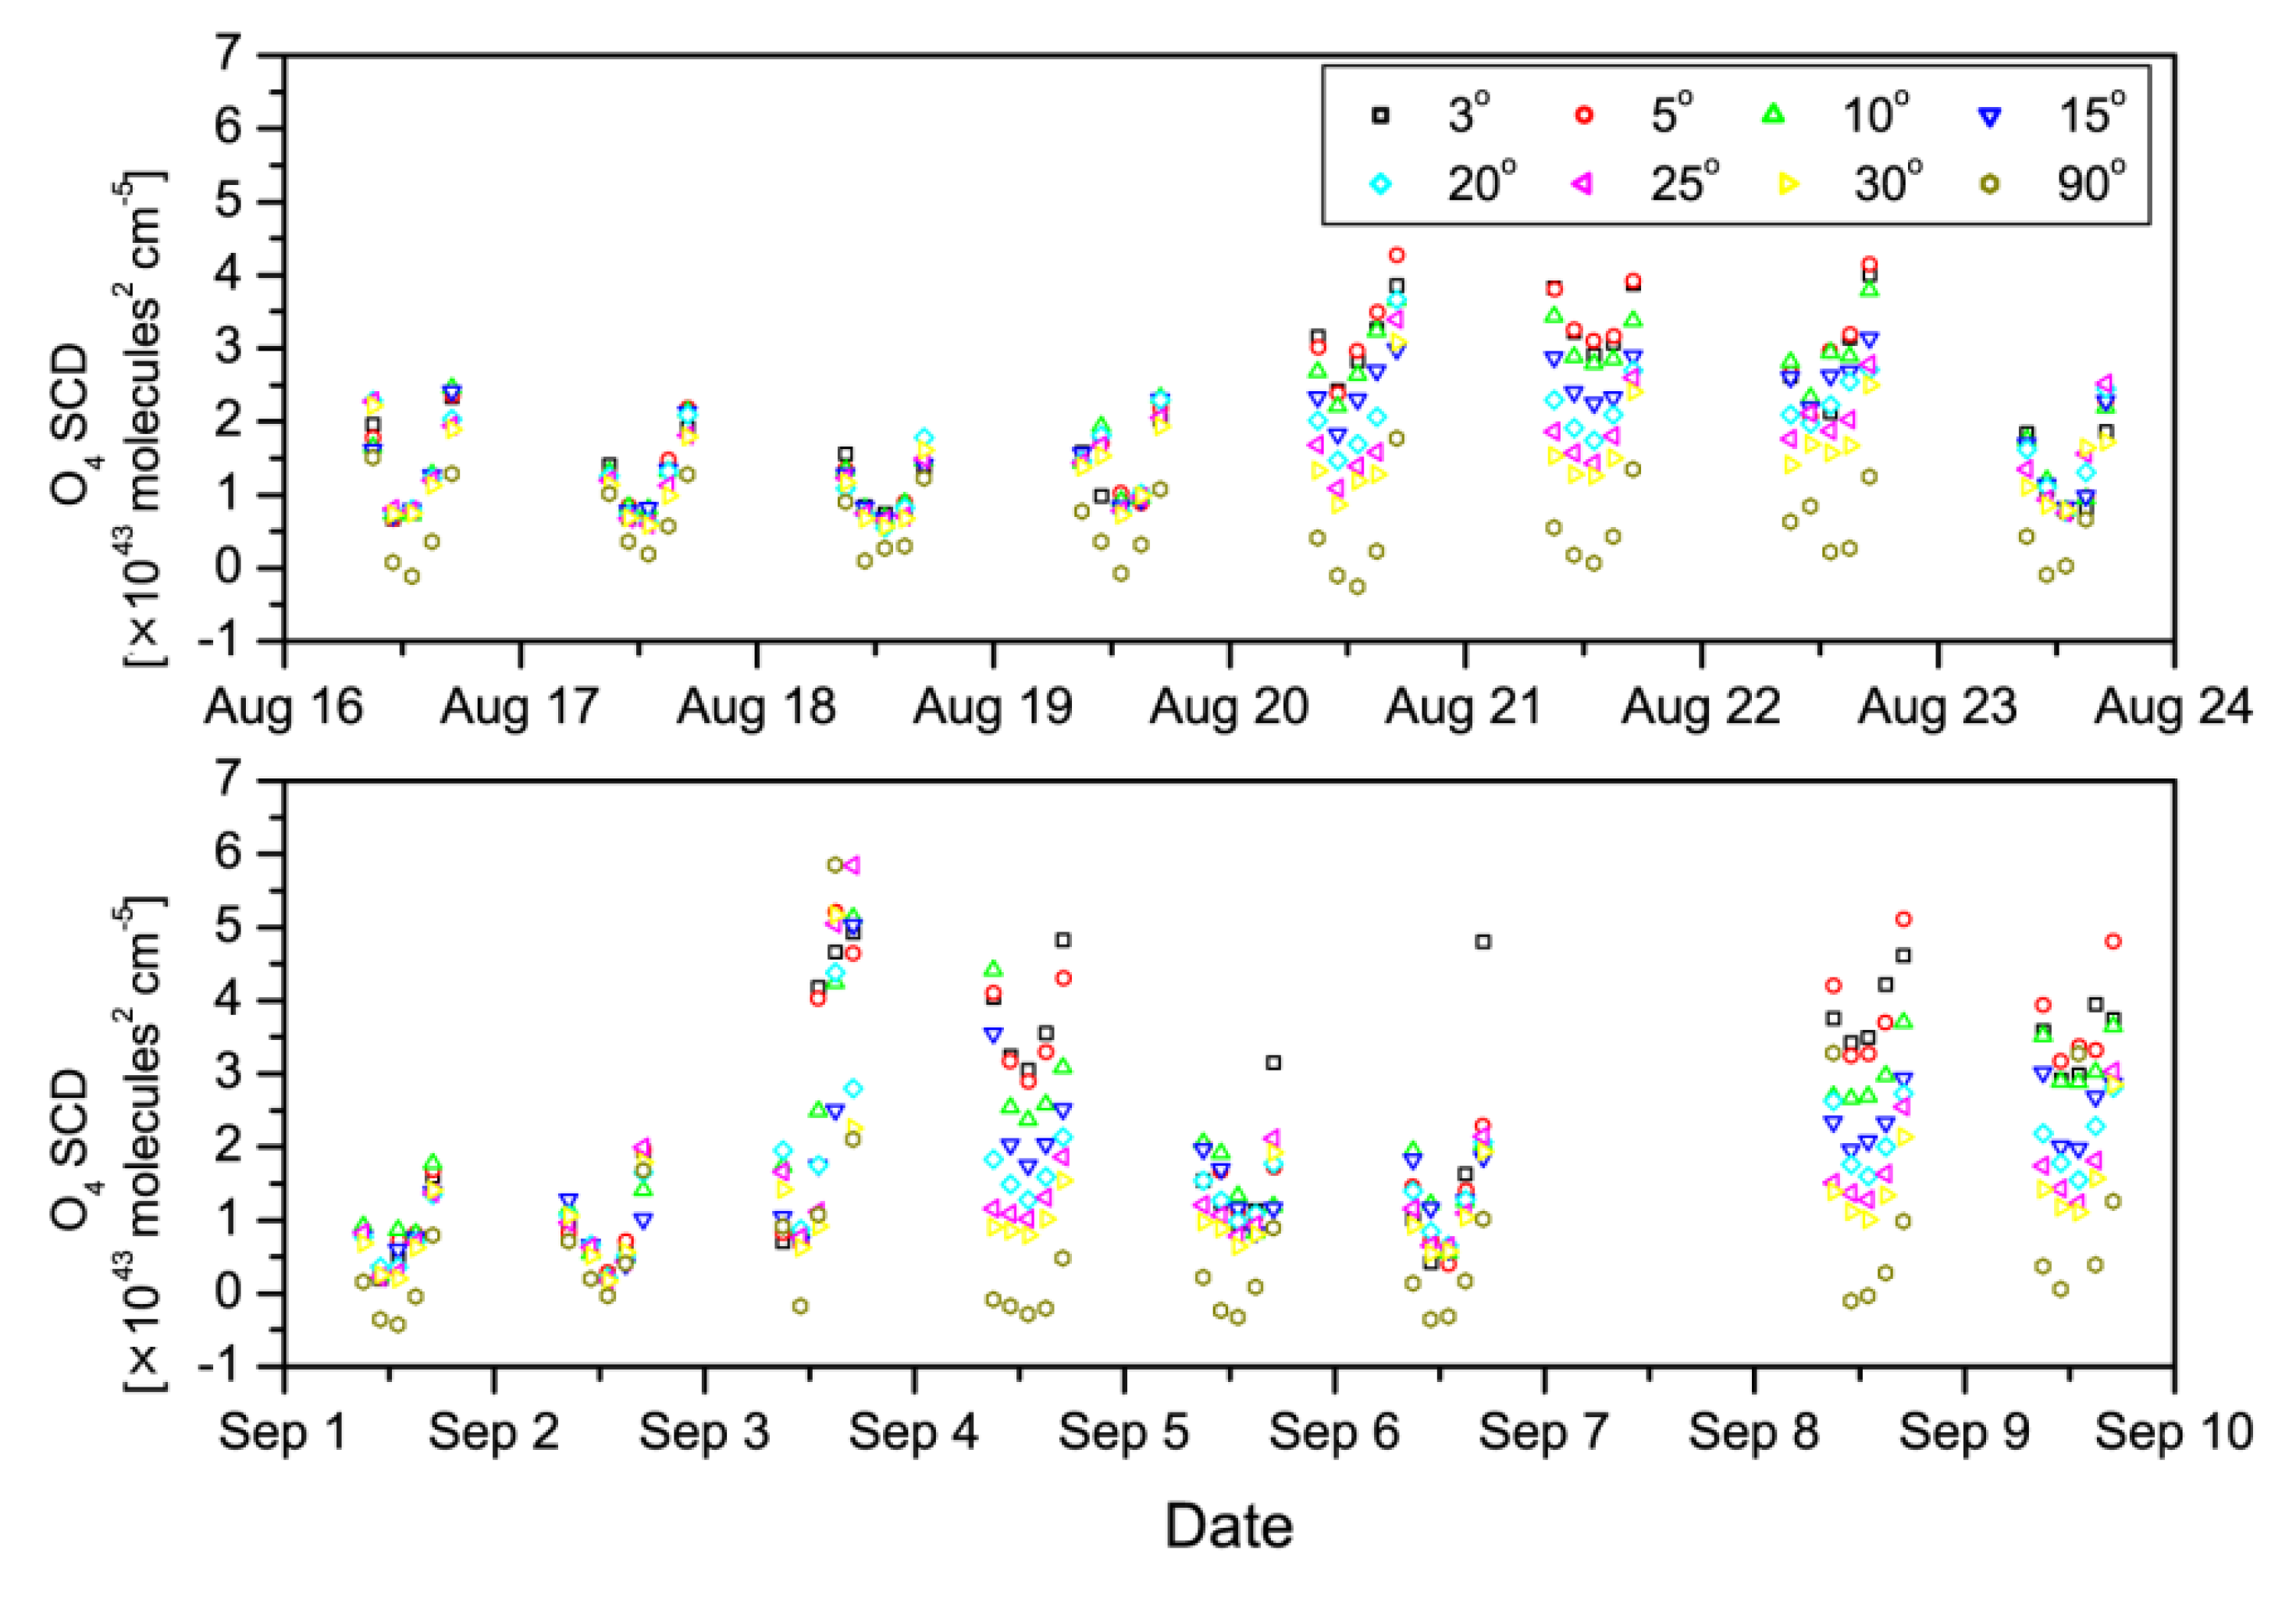
3.1. Retrieval of HCHO and O4 SCDs

| Target Species | Wavelength Range (nm) | Polynomial Order | Absorption Cross-Sections Included in the Spectral Fitting Routine |
|---|---|---|---|
| HCHO | 335–357 | 3rd | HCHO [29], O3 [34], O4 [35], NO2 [36], Ring spectra |
| O4 | 338–367 |


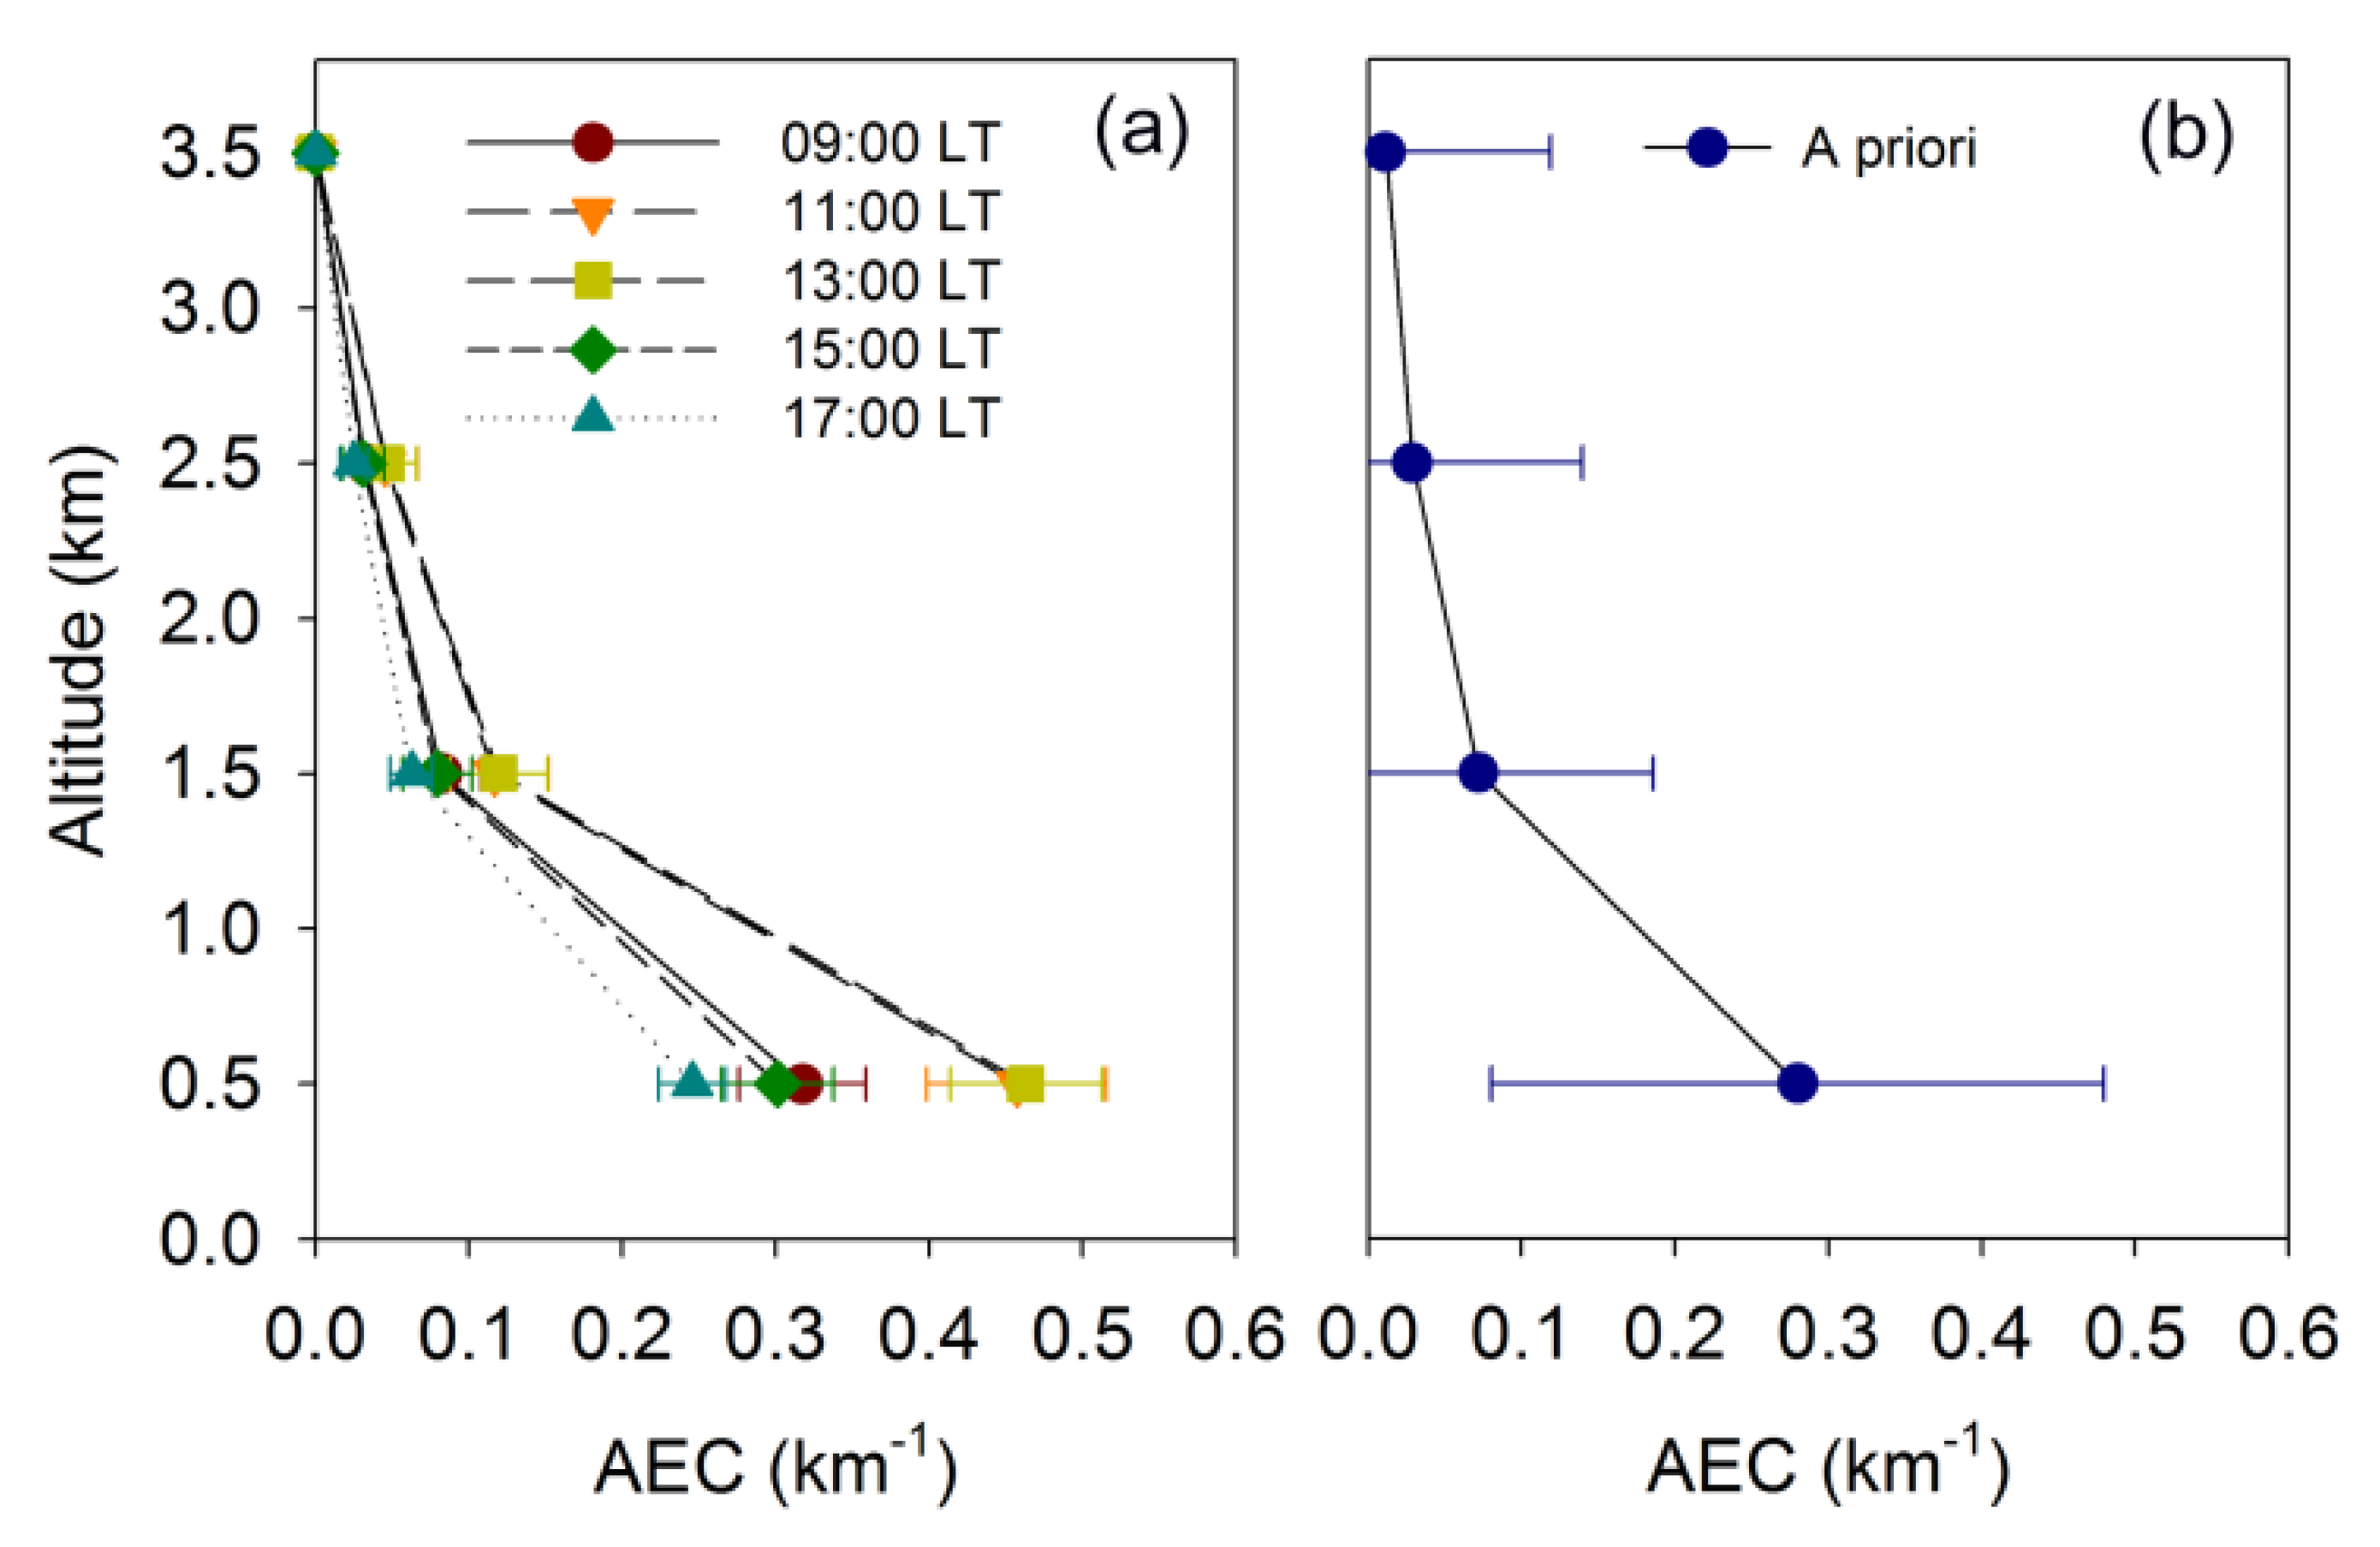
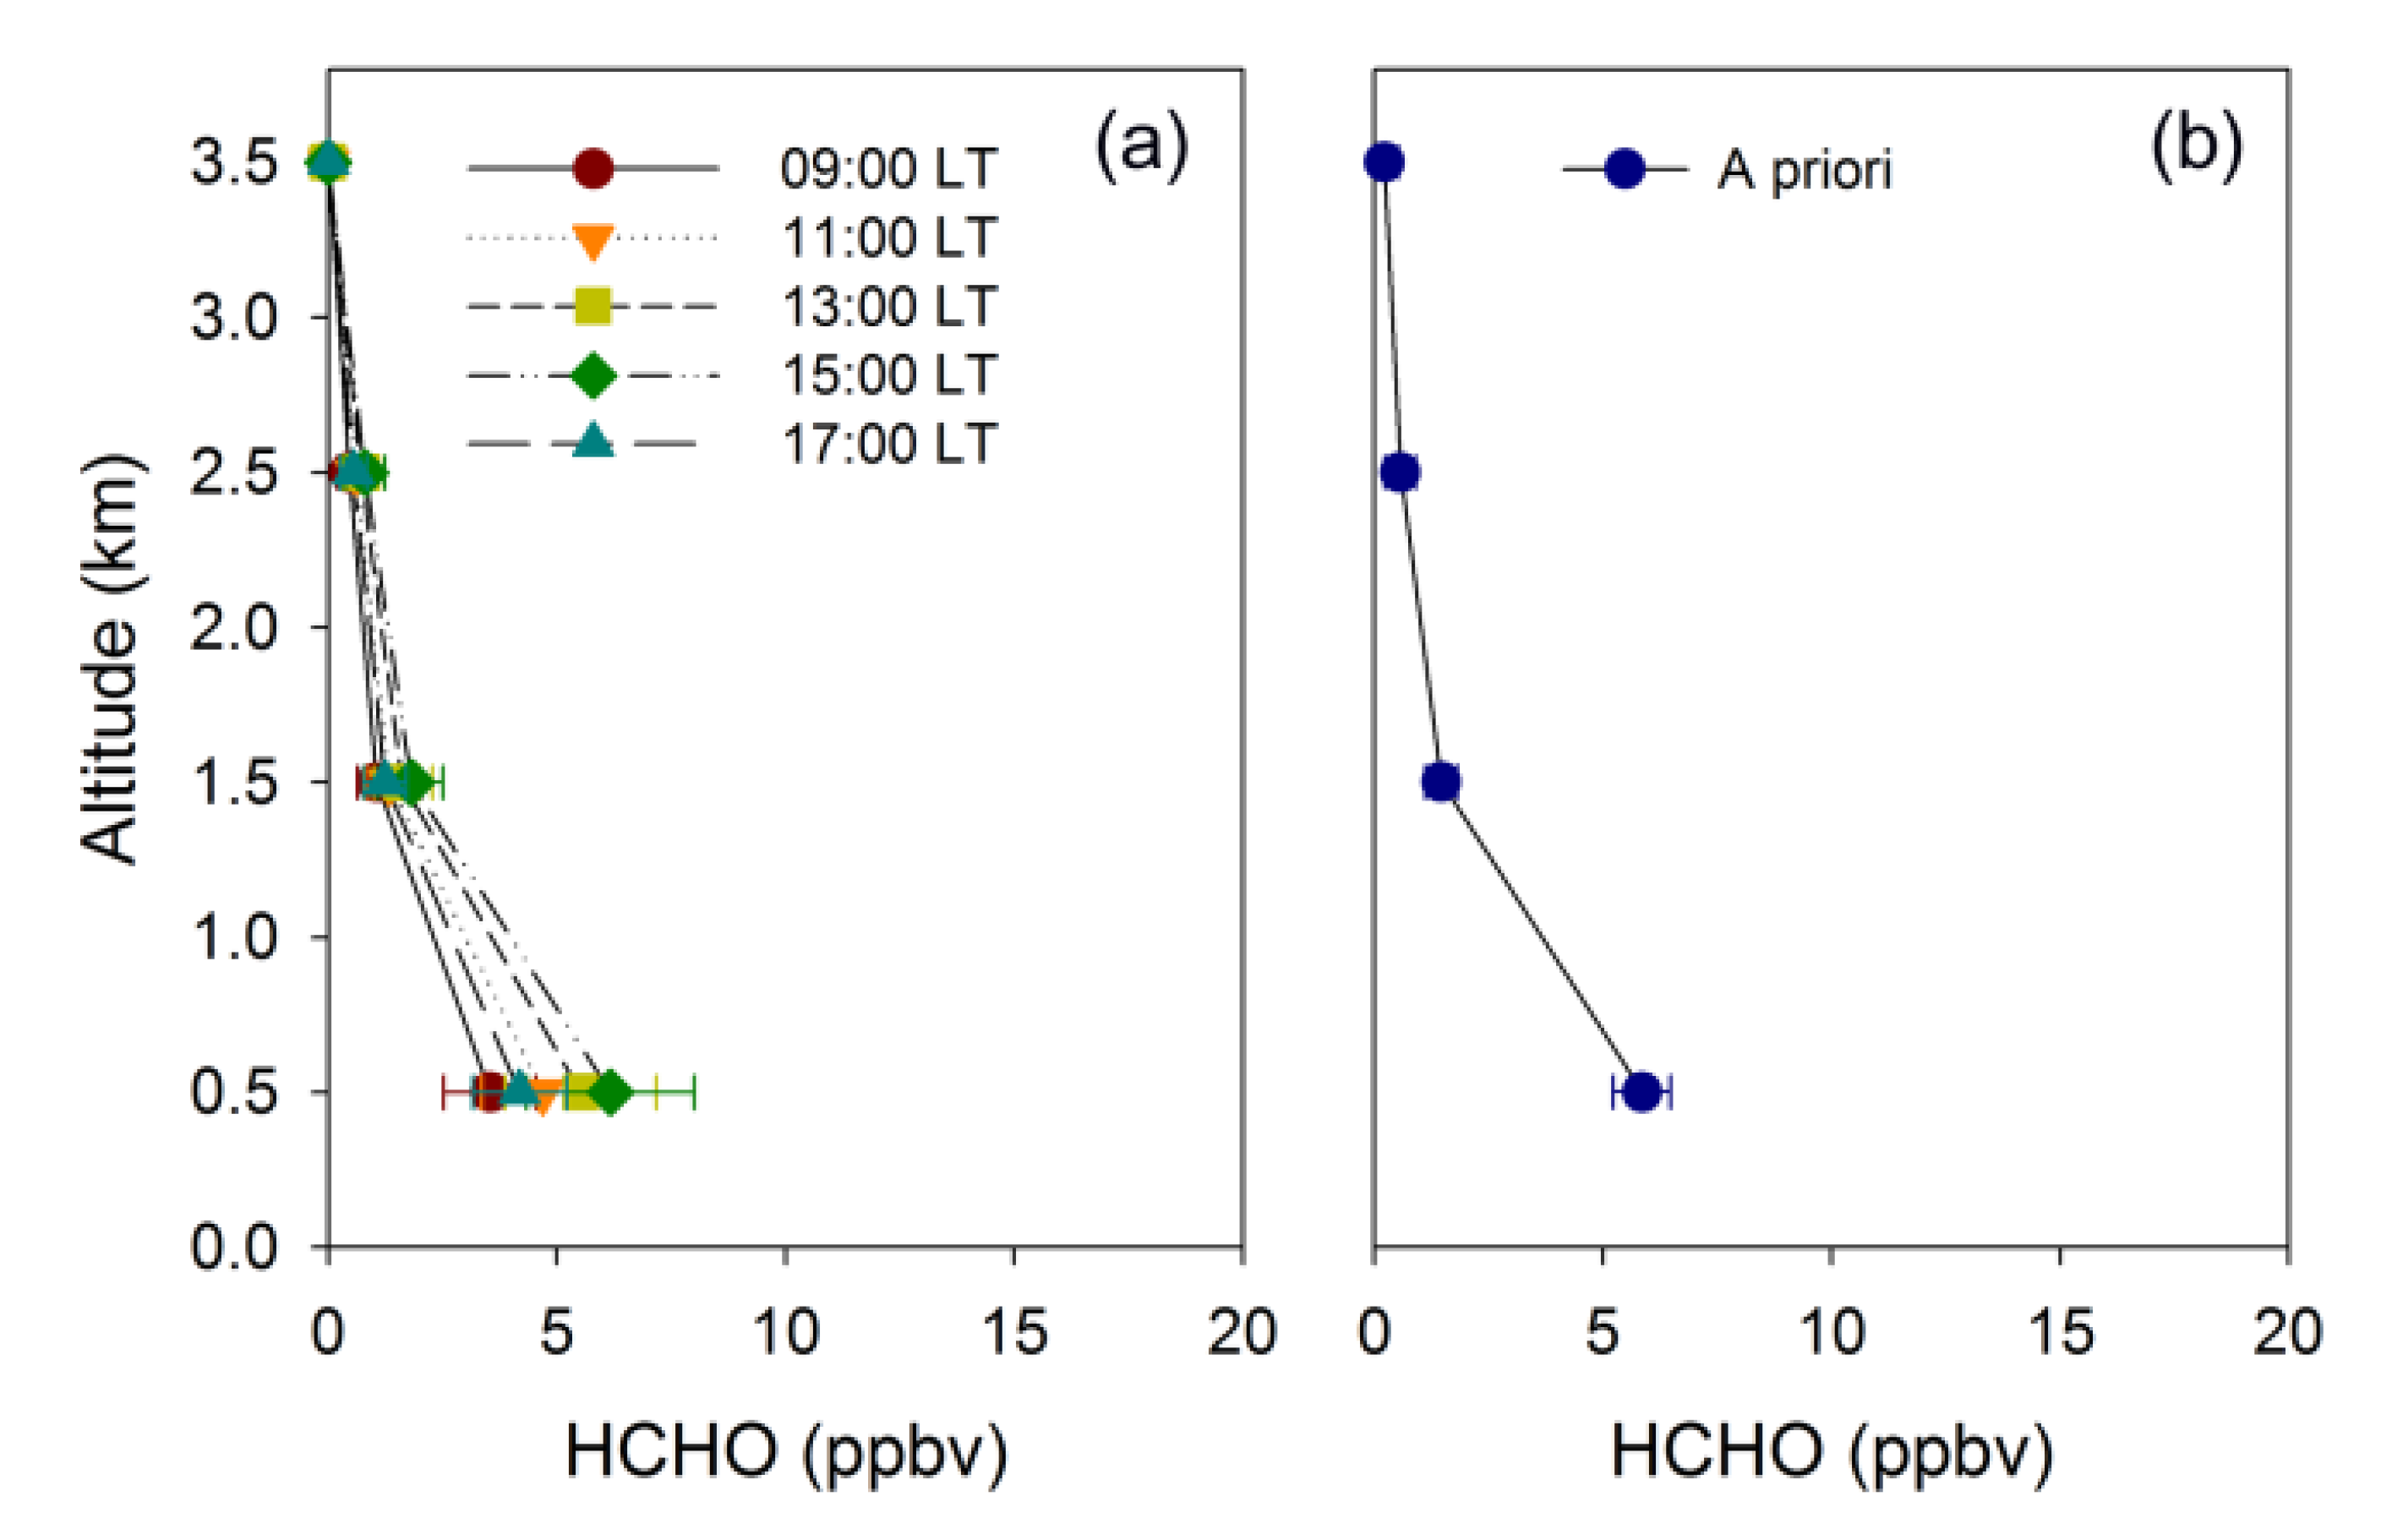
3.2. Derivation of Vertical HCHO Profiles
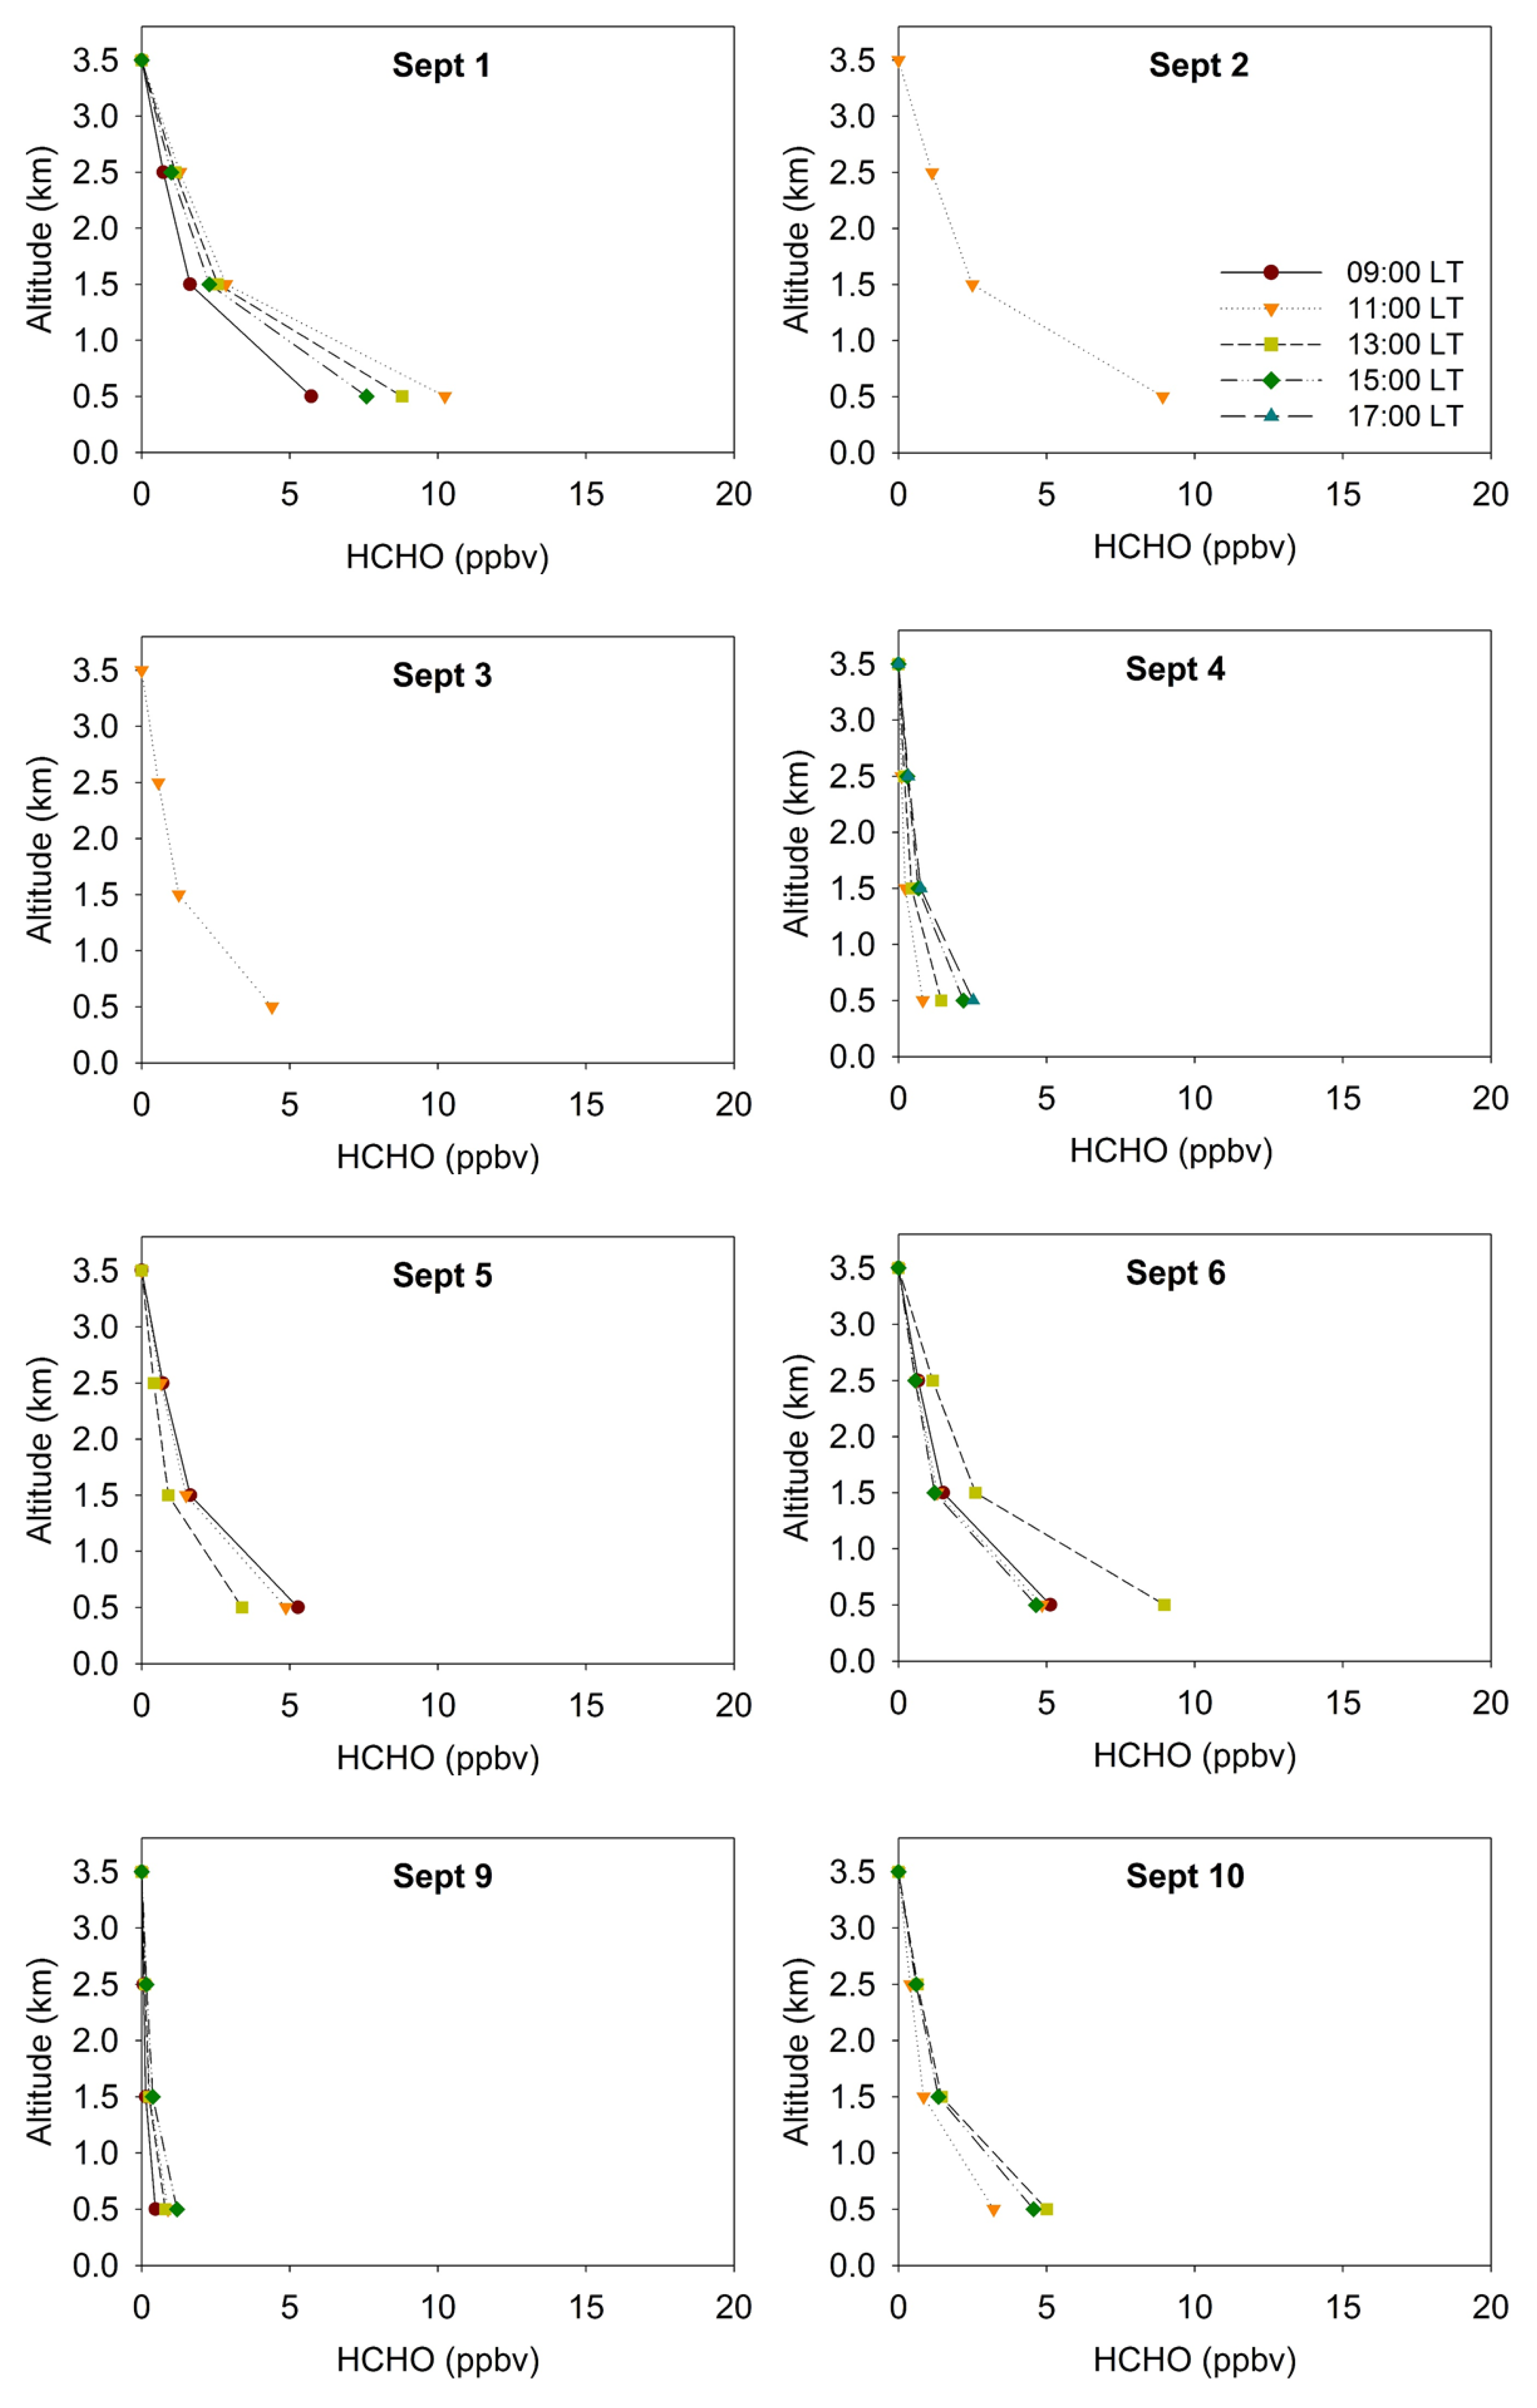
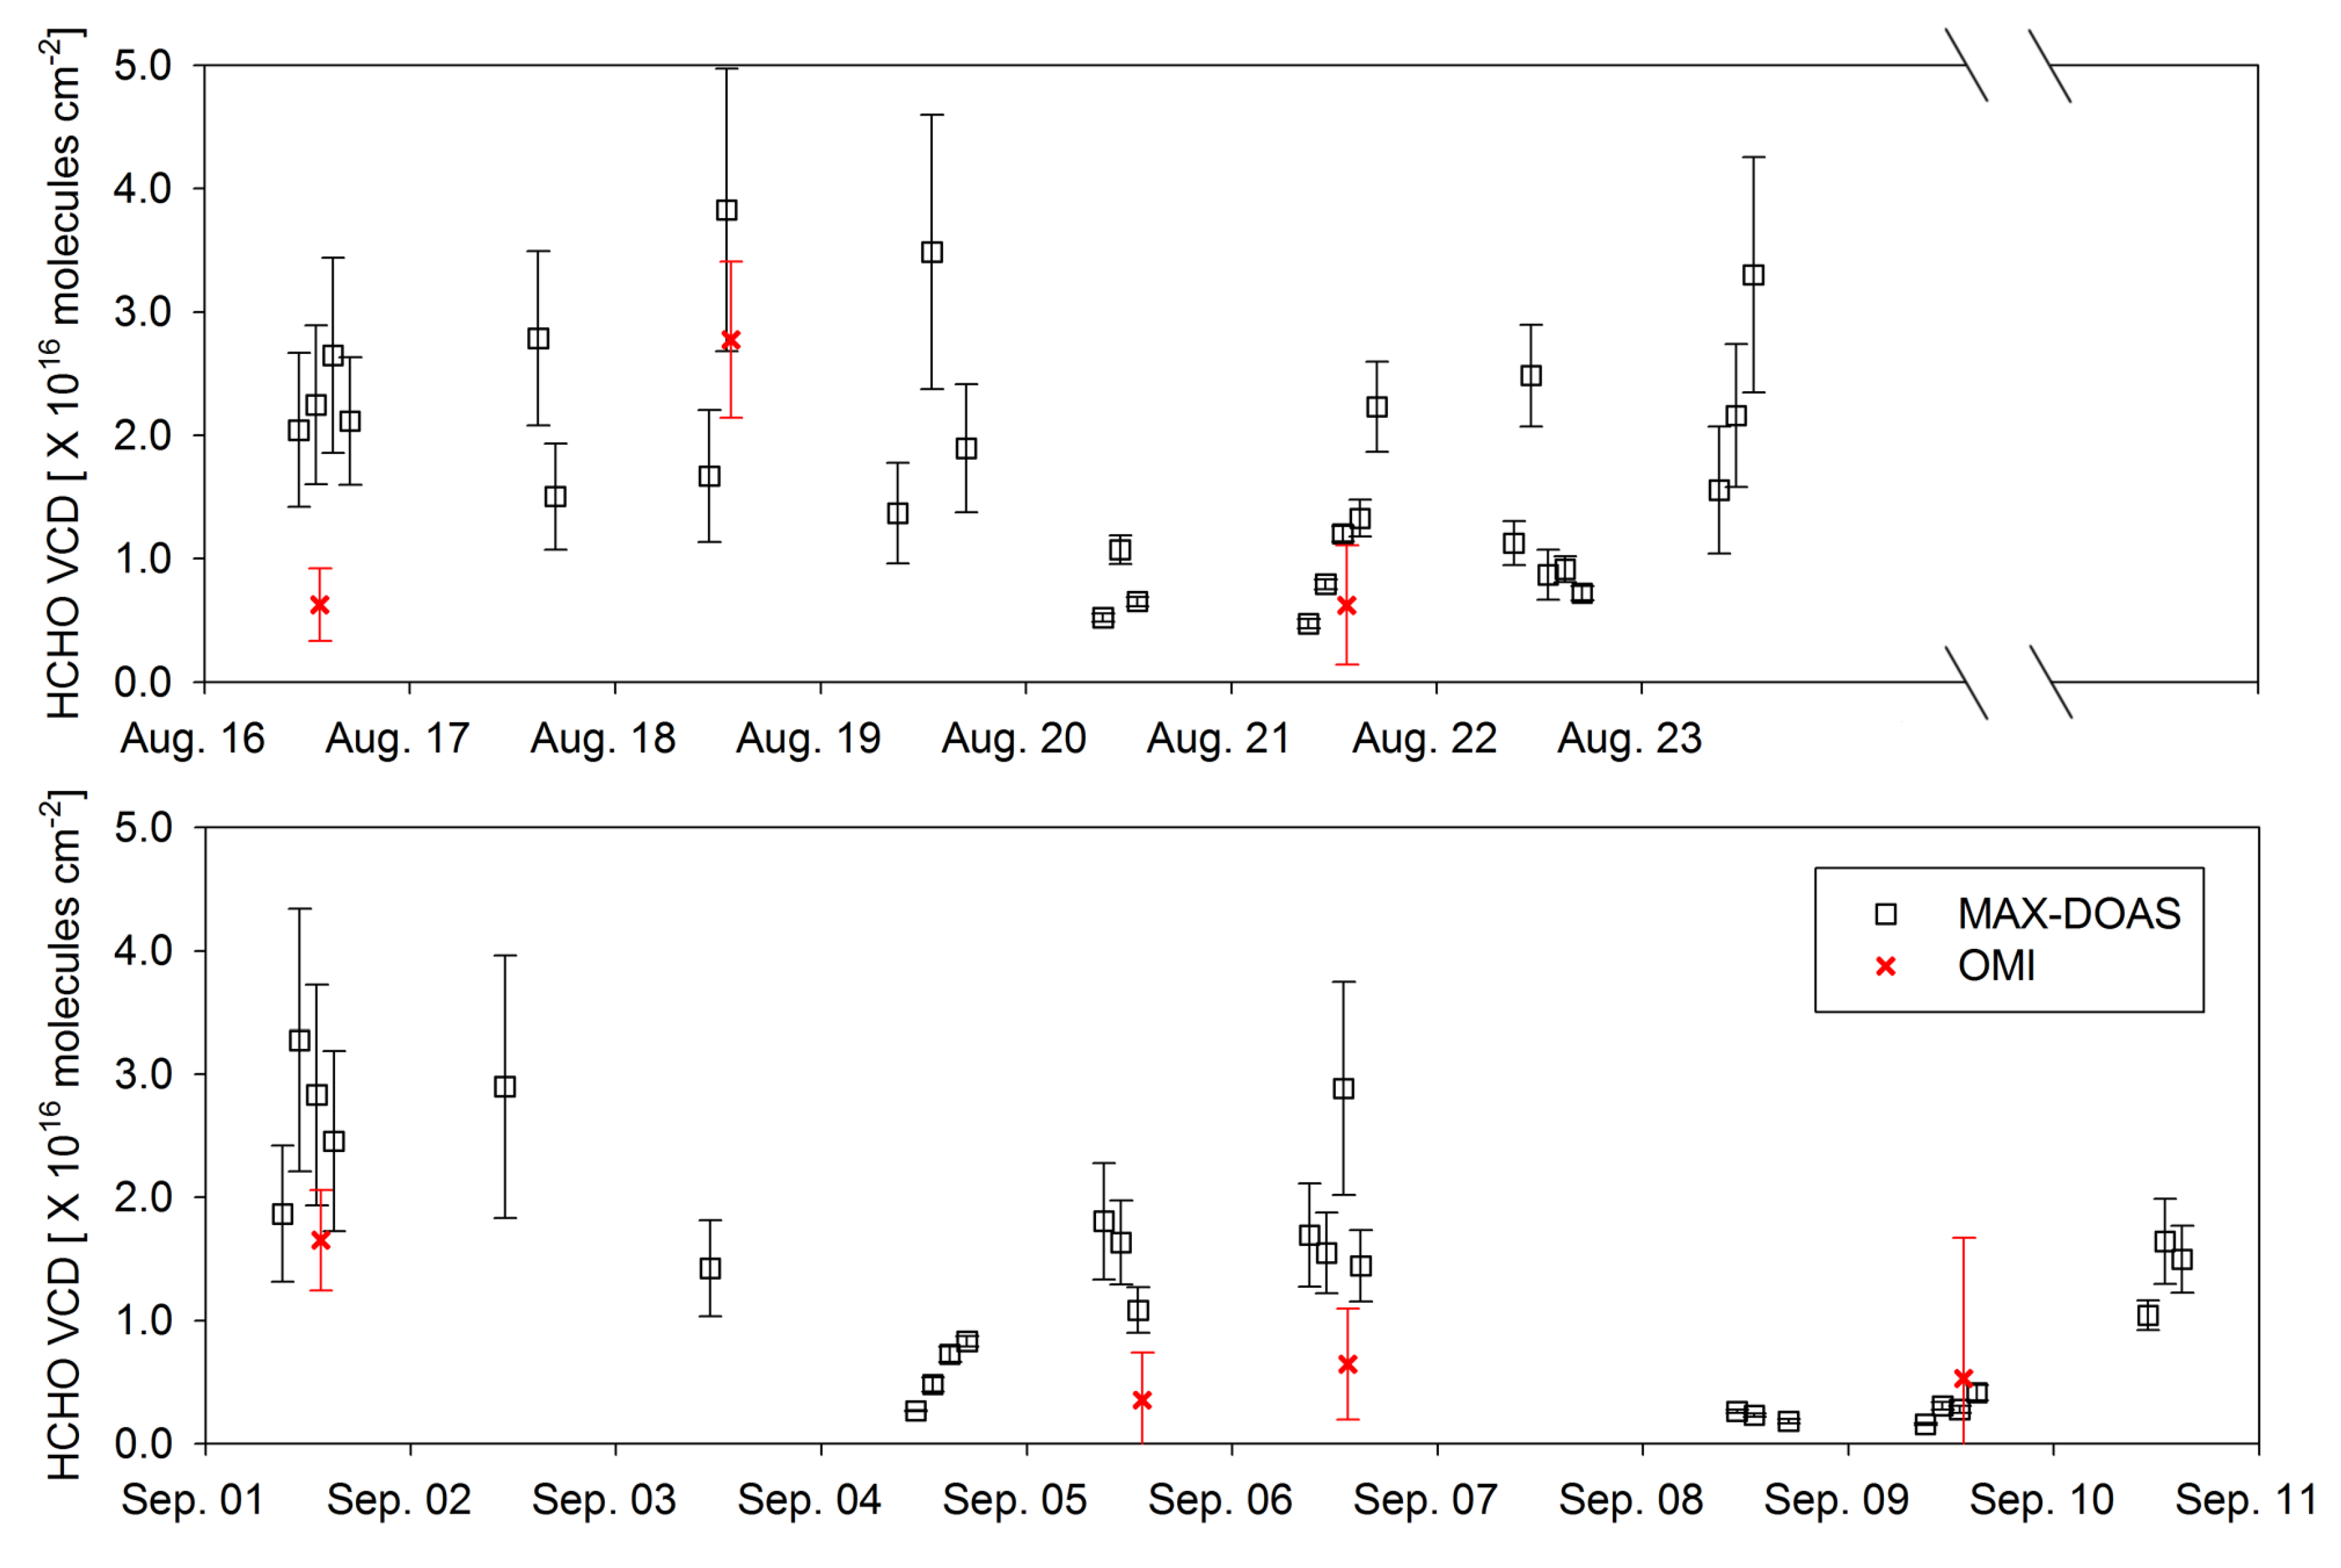
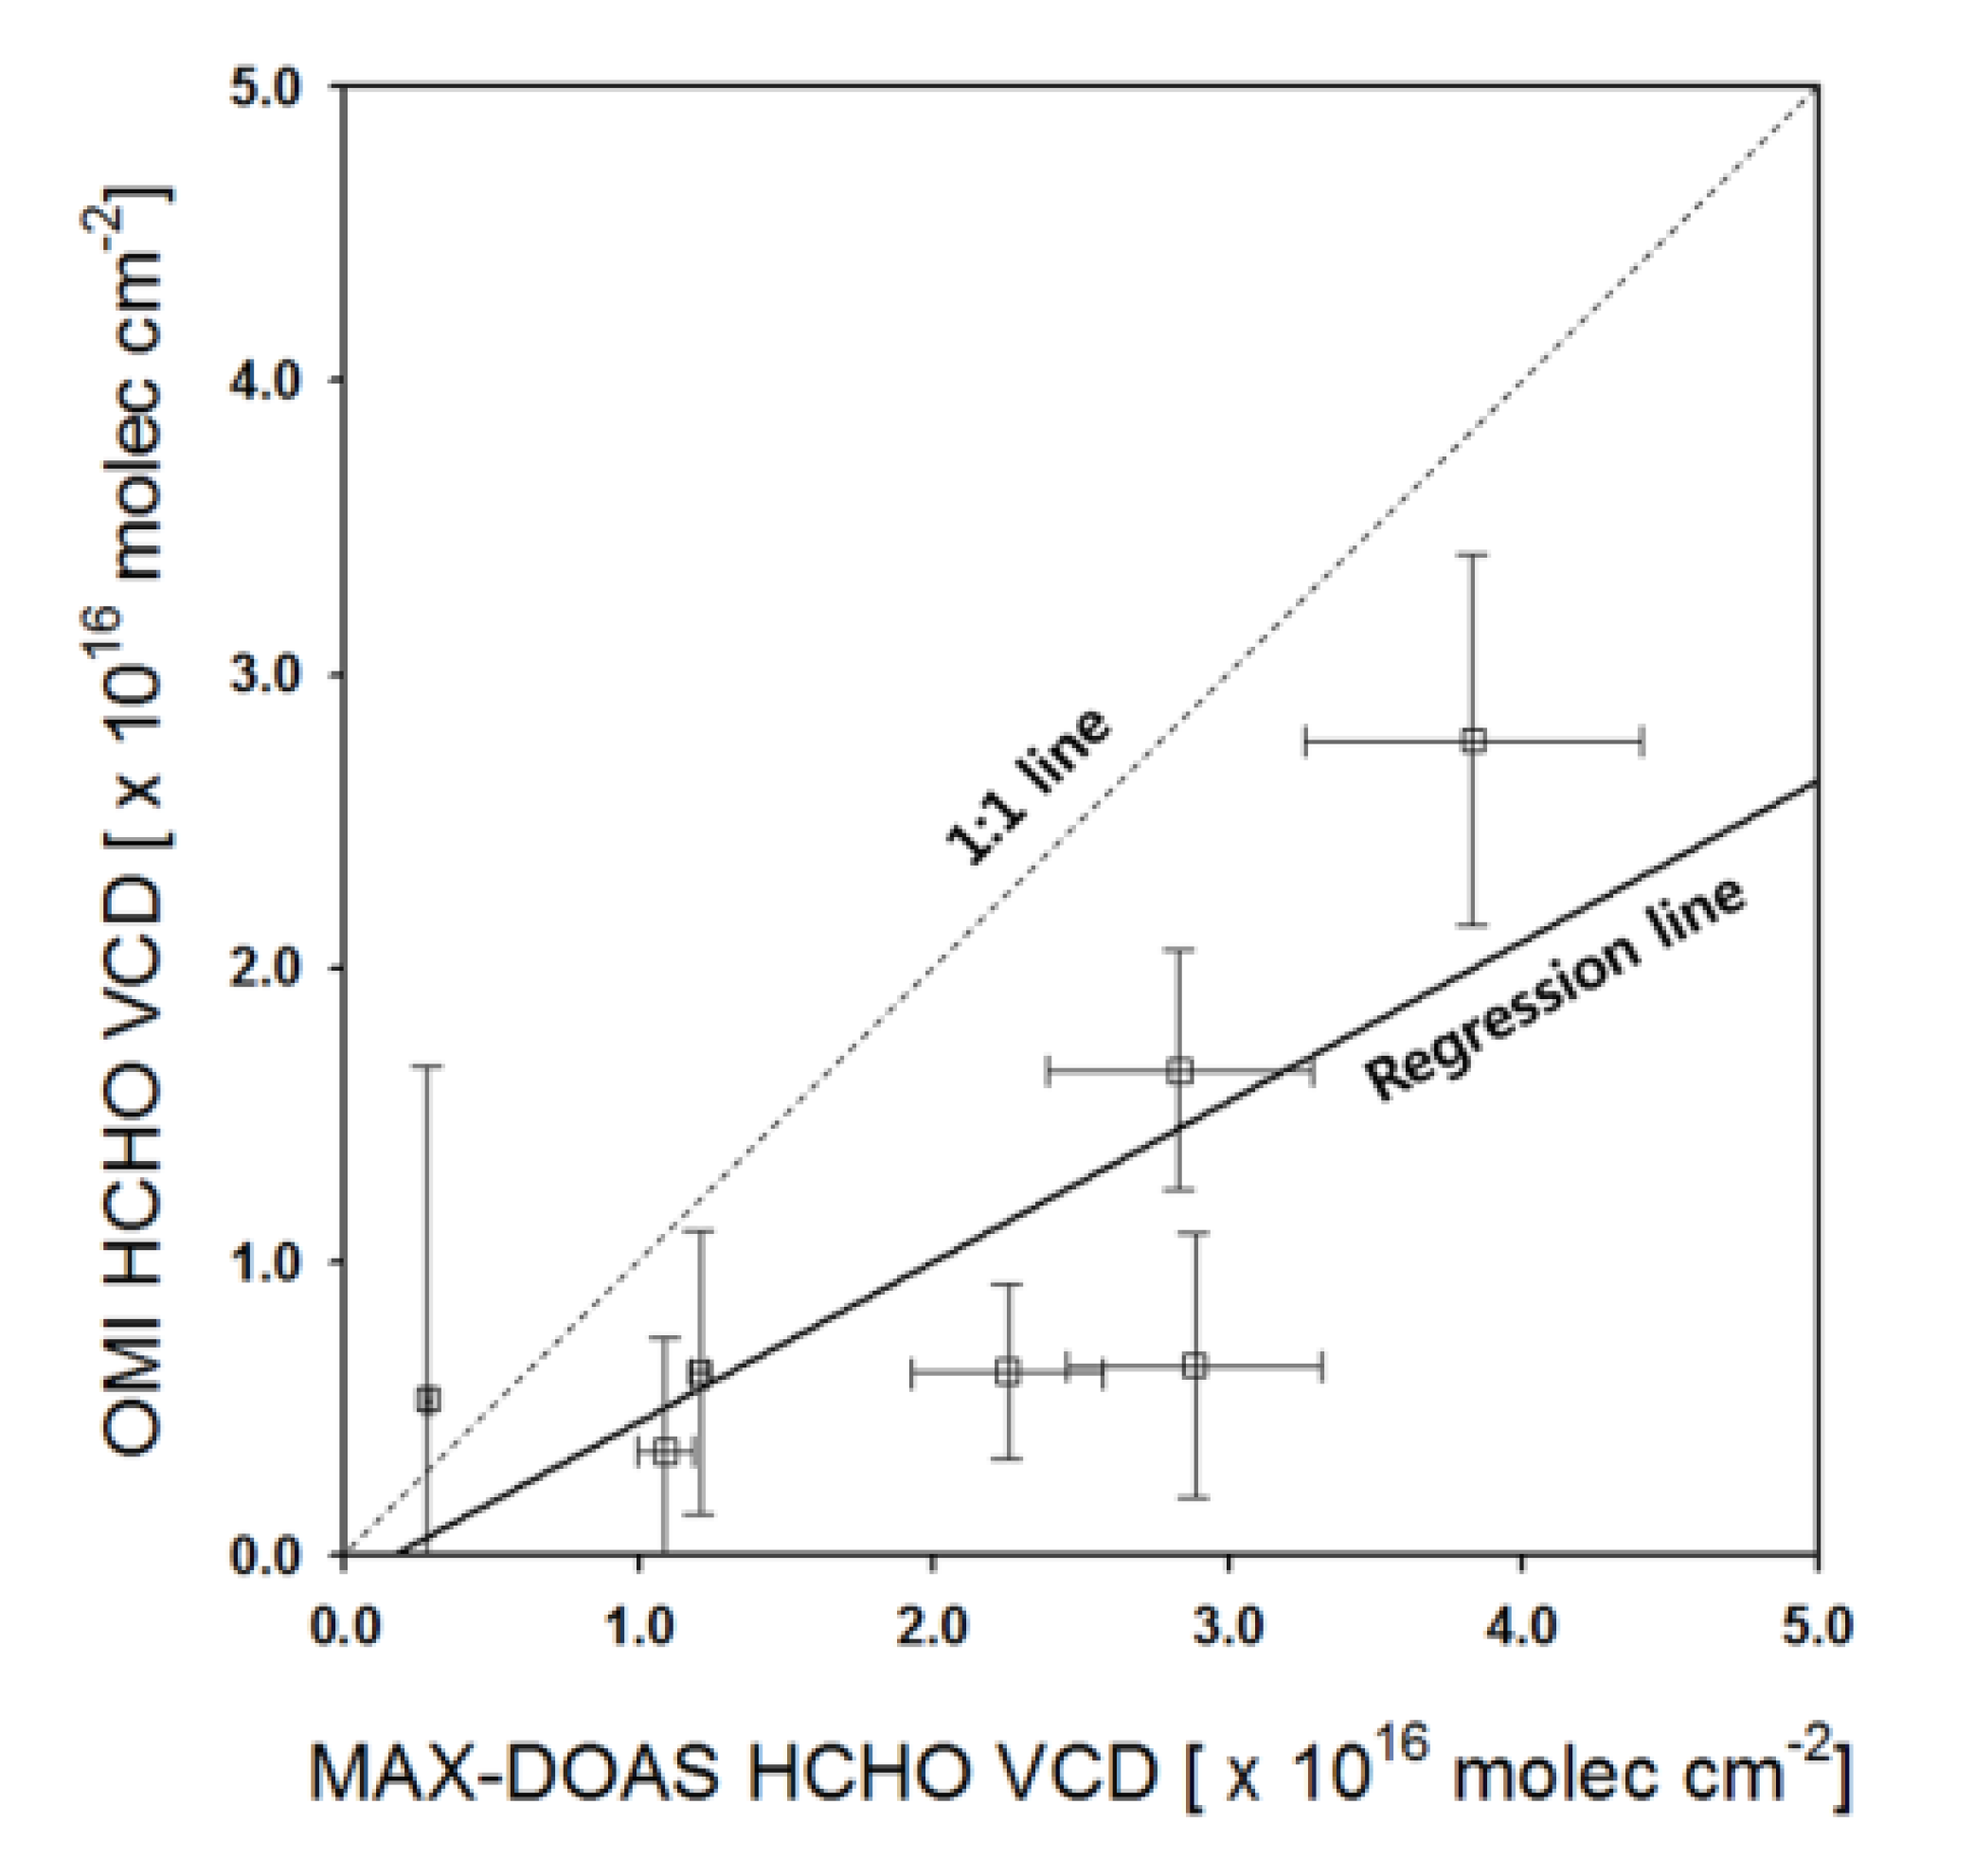
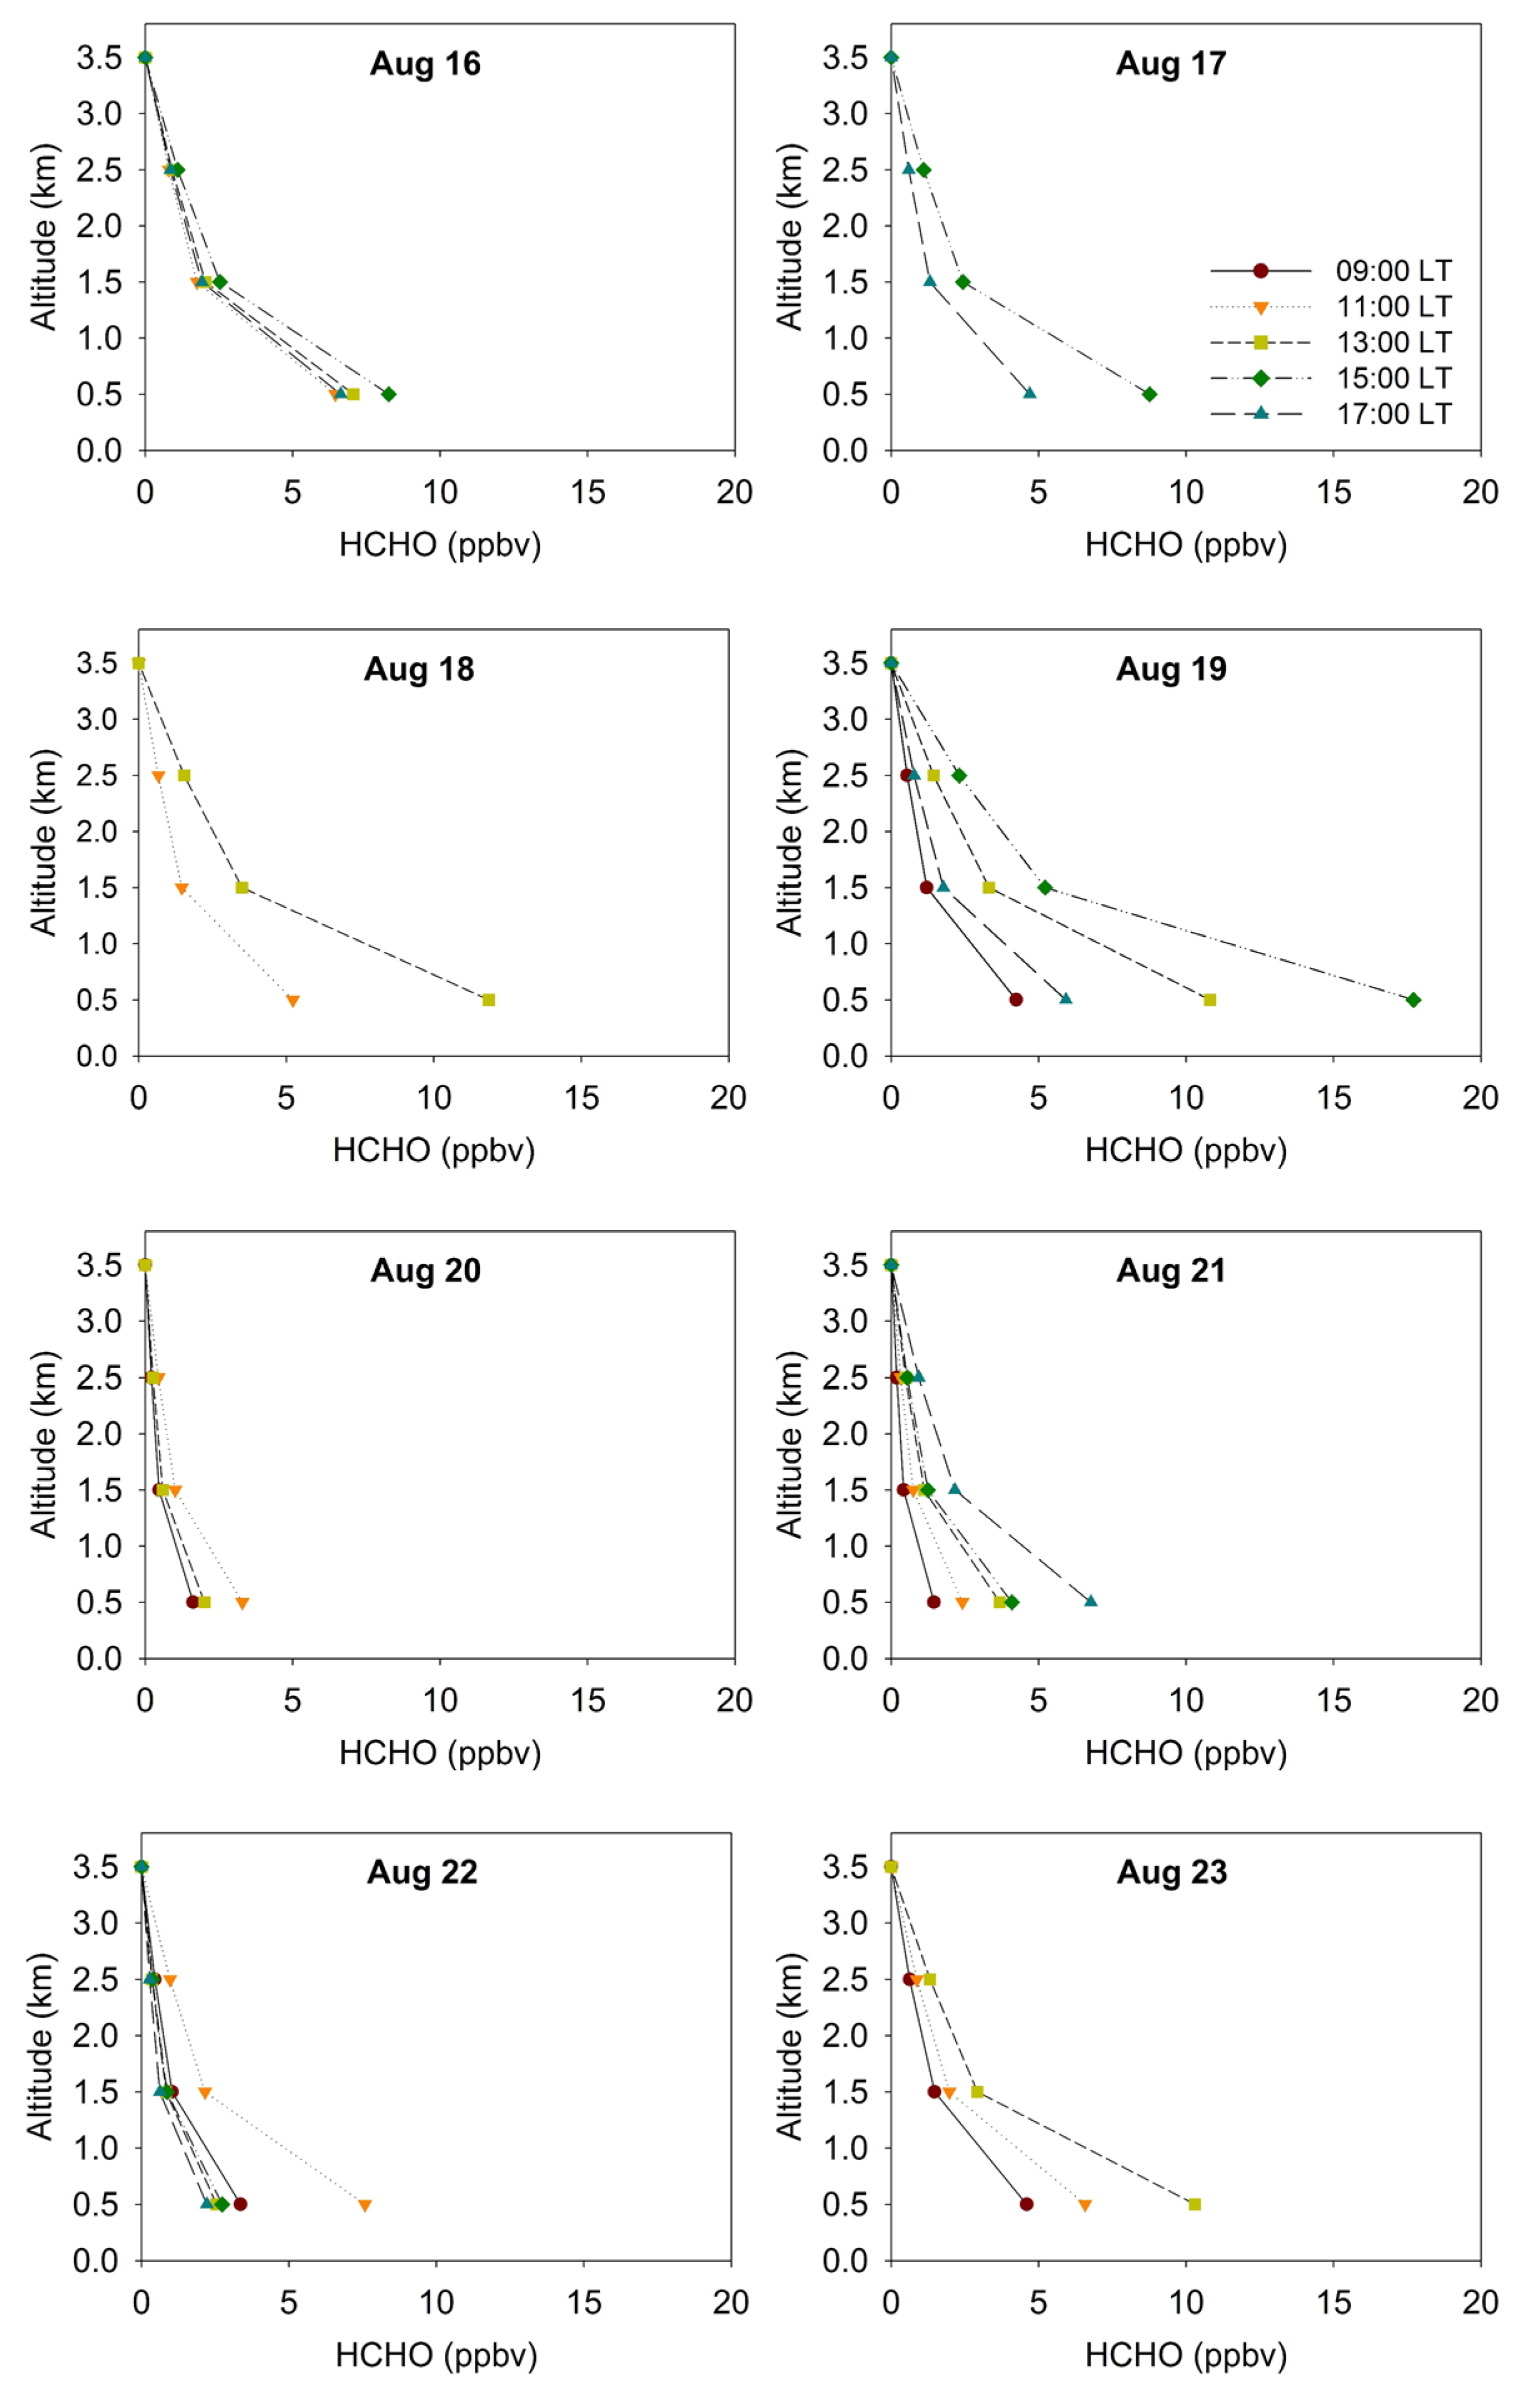
4. Results and Discussion


5. Conclusions
Acknowledgements
Author Contributions
Conflicts of Interest
References
- Nilsson, J.; Zheng, X.; Sundqvist, K.; Liu, Y.; Atzori, L.; Elfwing, A.; Arvidson, K.; Grafström, R. Toxicity of formaldehyde to human oral fibroblasts and epithelial cells: Influences of culture conditions and role of thiol status. J. Dent. Res. 1998, 77, 1896–1903. [Google Scholar] [CrossRef] [PubMed]
- De Smedt, I.; Stavrakou, T.; Müller, J.F.; van der A, R.; Van Roozendael, M. Trend detection in satellite observations of formaldehyde tropospheric columns. Geophys. Res. Lett. 2010, 37, L18808. [Google Scholar] [CrossRef]
- Dodge, M.C. Formaldehyde production in photochemical smog as predicted by three state-of-the-science chemical oxidant mechanisms. J. Geophys. Res-Atmos. (1984–2012) 1990, 95, 3635–3648. [Google Scholar] [CrossRef]
- Reis, S.; Friedrich, R. Emissions of ozone precursors. In Tropospheric Ozone Abatement; Springer: Berlin, Germany, 2000; pp. 25–33. [Google Scholar]
- Heikes, B.; Snow, J.; Egli, P.; O’Sullivan, D.; Crawford, J.; Olson, J.; Chen, G.; Davis, D.; Blake, N.; Blake, D. Formaldehyde over the central pacific during PEM-Tropics B. J. Geophys. Res-Atmos. (1984–2012) 2001, 106, 32717–32731. [Google Scholar] [CrossRef]
- Shim, C.; Wang, Y.; Choi, Y.; Palmer, P.I.; Abbot, D.S.; Chance, K. Constraining global isoprene emissions with global ozone monitoring experiment (GOME) formaldehyde column measurements. J. Geophys. Res-Atmos. (1984–2012) 2005, 110, D24. [Google Scholar] [CrossRef]
- Singh, H.; Salas, L.; Chatfield, R.; Czech, E.; Fried, A.; Walega, J.; Evans, M.; Field, B.; Jacob, D.; Blake, D. Analysis of the atmospheric distribution, sources, and sinks of oxygenated volatile organic chemicals based on measurements over the pacific during TRACE-P. J. Geophys. Res-Atmos. (1984–2012) 2004, 109, D15. [Google Scholar] [CrossRef]
- Arlander, D.; Brüning, D.; Schmidt, U.; Ehhalt, D. The tropospheric distribution of formaldehyde during TROPOZ-II. J. Atmos. Chem. 1995, 22, 251–269. [Google Scholar] [CrossRef]
- Hak, C.; Pundt, I.; Trick, S.; Kern, C.; Platt, U.; Dommen, J.; Ordónez, C.; Prévôt, A.; Junkermann, W.; Astorga-Lloréns, C. Intercomparison of four different in-situ techniques for ambient formaldehyde measurements in urban air. Atmos. Chem. Phys. 2005, 5, 2881–2900. [Google Scholar] [CrossRef]
- Junkermann, W.; Burger, J. A new portable instrument for continuous measurement of formaldehyde in ambient air. J. atmos. Oceanic Technol. 2006, 23, 38–45. [Google Scholar] [CrossRef]
- Lawson, D.; Biermann, H.; Tuazon, E.; Winer, A.; Mackay, G.; Schiff, H.; Kok, G.; Dasgupta, P.; Fung, K. Formaldehyde measurement methods evaluation and ambient concentrations during the carbonaceous species methods comparison study. Aerosol Sci. Tech. 1990, 12, 64–76. [Google Scholar] [CrossRef]
- Warneke, C.; Veres, P.; Holloway, J.; Stutz, J.; Tsai, C.; Alvarez, S.; Rappenglueck, B.; Fehsenfeld, F.; Graus, M.; Gilman, J. Airborne formaldehyde measurements using PTR-MS: Calibration, humidity dependence, intercomparison and initial results. Atmos. Meas. Tech. 2011, 4, 2345–2358. [Google Scholar] [CrossRef]
- Cardenas, L.; Brassington, D.; Allan, B.; Coe, H.; Alicke, B.; Platt, U.; Wilson, K.; Plane, J.; Penkett, S. Intercomparison of formaldehyde measurements in clean and polluted atmospheres. J. Atmos. Chem. 2000, 37, 53–80. [Google Scholar] [CrossRef]
- Fried, A.; Wert, B.P.; Walega, J.G.; Richter, D.A.; Potter, W.T. Airborne measurements of formaldehyde employing a high-performance tunable diode laser absorption system. In Proceedings of International Symposium on Optical Science and Technology, Seattle, WA, USA, 24 September 2002; pp. 177–183.
- Jones, N.; Riedel, K.; Allan, W.; Wood, S.; Palmer, P.; Chance, K.; Notholt, J. Long-term tropospheric formaldehyde concentrations deduced from ground-based fourier transform solar infrared measurements. Atmos. Chem. Phys. 2009, 9, 7131–7142. [Google Scholar] [CrossRef]
- Vigouroux, C.; Hendrick, F.; Stavrakou, T.; Dils, B.; Smedt, I.D.; Hermans, C.; Merlaud, A.; Scolas, F.; Senten, C.; Vanhaelewyn, G. Ground-based FTIR and MAX-DOAS observations of formaldehyde at réunion island and comparisons with satellite and model data. Atmos. Chem. Phys. 2009, 9, 9523–9544. [Google Scholar] [CrossRef]
- Heckel, A.; Richter, A.; Tarsu, T.; Wittrock, F.; Hak, C.; Pundt, I.; Junkermann, W.; Burrows, J. MAX-DOAS measurements of formaldehyde in the Po-Valley. Atmos. Chem. Phys. 2005, 5, 909–918. [Google Scholar] [CrossRef]
- Pikelnaya, O.; Hurlock, S.C.; Trick, S.; Stutz, J. Intercomparison of multiaxis and long-path differential optical absorption spectroscopy measurements in the marine boundary layer. J. Geophys. Res-Atmos. (1984–2012) 2007, 112, D10. [Google Scholar] [CrossRef]
- Wittrock, F.; Richter, A.; Oetjen, H.; Burrows, J.P.; Kanakidou, M.; Myriokefalitakis, S.; Volkamer, R.; Beirle, S.; Platt, U.; Wagner, T. Simultaneous global observations of glyoxal and formaldehyde from space. Geophys. Res. Lett. 2006, 33, L16804. [Google Scholar] [CrossRef]
- Hönninger, G.; von Friedeburg, C.; Platt, U. Multi-axis differential optical absorption spectroscopy (MAX-DOAS). Atmos. Chem. Phys. 2004, 4, 231–254. [Google Scholar] [CrossRef]
- Fayt, C.; De Smedt, I.; Letocart, V.; Merlaud, A.; Pinardi, G.; Van Roozendael, M.; Roozendael, M. Qdoas Software User Manual; Belgian Institute for Space Aeronomy: Brussels, Belgium, 2011. [Google Scholar]
- Vlemmix, T.; Hendrick, F.; Pinardi, G.; Smedt, I.D.; Fayt, C.; Hermans, C.; Piters, A.; Wang, P.; Levelt, P.; Roozendael, M.V. MAX-DOAS observations of aerosols, formaldehyde and nitrogen dioxide in the Beijing area: Comparison of two profile retrieval approaches. Atmos. Meas. Tech. 2015, 8, 941–963. [Google Scholar] [CrossRef]
- Wagner, T.; Beirle, S.; Brauers, T.; Deutschmann, T.; Frieß, U.; Hak, C.; Halla, J.; Heue, K.; Junkermann, W.; Li, X. Inversion of tropospheric profiles of aerosol extinction and HCHO and NO2 mixing ratios from MAX-DOAS observations in Milano during the summer of 2003 and comparison with independent data sets. Atmos. Meas. Tech. 2011, 4, 2685–2715. [Google Scholar] [CrossRef]
- Lee, H.; Irie, H.; Gu, M.; Kim, J.; Hwang, J. Remote sensing of tropospheric aerosol using UV MAX-DOAS during hazy conditions in winter: Utilization of O4 absorption bands at wavelength intervals of 338–368 and 367–393 nm. Atmos. Environ. 2011, 45, 5760–5769. [Google Scholar] [CrossRef]
- Lee, H.; Ryu, J.; Kim, J.; Noh, Y.; Yoon, Y. Combined measurements of a UV mini MAX-DOAS system and a TX for retrieval of ambient trace gas mixing ratio: Comparisons with combined RTM and MAX-DOAS methods. Atmos. Environ. 2011, 45, 7218–7226. [Google Scholar] [CrossRef]
- Platt, U.; Stutz, J. Differential Absorption Spectroscopy; Springer: Berlin, Germany, 2008. [Google Scholar]
- Kurucz, R.L.; Furenlid, I.; Brault, J.; Testerman, L. Solar Flux Atlas from 296 to 1300 nm; National Solar Observatory Atlas: New Mexico, NM, USA, 1984. [Google Scholar]
- Stutz, J.; Platt, U. Numerical analysis and estimation of the statistical error of differential optical absorption spectroscopy measurements with least-squares methods. Appl. Optics 1996, 35, 6041–6053. [Google Scholar] [CrossRef] [PubMed]
- Cantrell, C.A.; Davidson, J.A.; McDaniel, A.H.; Shetter, R.E.; Calvert, J.G. Temperature-dependent formaldehyde cross sections in the near-ultraviolet spectral region. J. Phys. Chem. 1990, 94, 3902–3908. [Google Scholar] [CrossRef]
- Chance, K. OMI algorithm theoretical basis document, volume IV: OMI trace gas algorithms. Accessed 2002, 12, 2009. [Google Scholar]
- Chance, K.; Orphal, J. Revised ultraviolet absorption cross sections of H2CO for the HITRAN database. J. Quant. Spectrosc. Radiat. 2011, 112, 1509–1510. [Google Scholar] [CrossRef]
- Fish, D.; Jones, R. Rotational Raman scattering and the ring effect in zenith-sky spectra. Geophys. Res. Lett. 1995, 22, 811–814. [Google Scholar] [CrossRef]
- Kraus, S. DOASIS - A Framework Design for DOAS; Shaker: Herzogenrath, Germany, 2006. [Google Scholar]
- Burrows, J.; Richter, A.; Dehn, A.; Deters, B.; Himmelmann, S.; Voigt, S.; Orphal, J. Atmospheric remote-sensing reference data from GOME—2. Temperature-dependent absorption cross sections of O3 in the 231–795nm range. J. Quant. Spectrosc. Radiat. Transf. 1999, 61, 509–517. [Google Scholar] [CrossRef]
- Hermans, C.; Vandaele, A.C.; Carleer, M.; Fally, S.; Colin, R.; Jenouvrier, A.; Coquart, B.; Mérienne, M.-F. Absorption cross-sections of atmospheric constituents: NO2, O2 and H2O. Environ. Sci. Pollut. Res. 1999, 6, 151–158. [Google Scholar] [CrossRef] [PubMed]
- Vandaele, A.C.; Hermans, C.; Simon, P.C.; Carleer, M.; Colin, R.; Fally, S.; Merienne, M.-F.; Jenouvrier, A.; Coquart, B. Measurements of the NO2 absorption cross-section from 42,000 cm−1 to 10,000 cm−1 (238–1000 nm) at 220 K and 294 K. J. Quant. Spectrosc. Radiat. Transf. 1998, 59, 171–184. [Google Scholar] [CrossRef]
- Lee, H.; Irie, H.; Kim, Y.J.; Noh, Y.; Lee, C.; Kim, Y.; Chun, K.J. Retrieval of aerosol extinction in the lower troposphere based on UV MAX-DOAS measurements. Aerosol Sci. Tech. 2009, 43, 502–509. [Google Scholar] [CrossRef]
- Wagner, T.; Deutschmann, T.; Platt, U. Determination of aerosol properties from MAX-DOAS observations of the ring effect. Atmos. Meas. Tech. 2009, 2, 495–512. [Google Scholar] [CrossRef]
- Clémer, K.; Van Roozendael, M.; Fayt, C.; Hendrick, F.; Hermans, C.; Pinardi, G.; Spurr, R.; Wang, P.; De Maziére, M. Multiple wavelength retrieval of tropospheric aerosol optical properties from MAXDOAS measurements in Beijing. Atmos. Meas. Tech. 2010, 3, 863–878. [Google Scholar] [CrossRef]
- Irie, H.; Nakayama, T.; Shimizu, A.; Yamazaki, A.; Nagai, T.; Uchiyama, A.; Zaizen, Y.; Kagamitani, S.; Matsumi, Y. Evaluation of MAX-DOAS aerosol retrievals by coincident observations using CRDS, lidar, and sky radiometer in Tsukuba, Japan. Atmos. Meas. Tech. 2015, 8, 1013–1054. [Google Scholar] [CrossRef]
- Irie, H.; Takashima, H.; Kanaya, Y.; Boersma, K.; Gast, L.; Wittrock, F.; Brunner, D.; Zhou, Y.; Roozendael, M.V. Eight-component retrievals from ground-based MAX-DOAS observations. Atmos. Meas. Tech. 2011, 4, 1027–1044. [Google Scholar] [CrossRef]
- Wagner, T.; Dix, B.; Friedeburg, C.v.; Frieß, U.; Sanghavi, S.; Sinreich, R.; Platt, U. MAX-DOAS O4 measurements: A new technique to derive information on atmospheric aerosols—principles and information content. J. Geophys. Res-Atmos. (1984–2012) 2004, 109, D22. [Google Scholar]
- Rodgers, C.D. Inverse Methods for Atmospheric Sounding: Theory and Practice; World Scientific Singapore: Singapore, 2000. [Google Scholar]
- Irie, H.; Kanaya, Y.; Akimoto, H.; Iwabuchi, H.; Shimizu, A.; Aoki, K. First retrieval of tropospheric aerosol profiles using MAX-DOAS and comparison with lidar and sky radiometer measurements. Atmos. Chem. Phys. 2008, 8, 341–350. [Google Scholar] [CrossRef]
- Frieß, U.; Monks, P.S.; Remedios, J.J.; Rozanov, A.; Sinreich, R.; Wagner, T.; Platt, U. MAX-DOAS O4 measurements: A new technique to derive information on atmospheric aerosols: 2. Modeling studies. J. Geophys. Res. 2006, 111, D14203. [Google Scholar] [CrossRef]
- Palmer, P.I.; Jacob, D.J.; Chance, K.; Martin, R.V.; Spurr, R.J.; Kurosu, T.P.; Bey, I.; Yantosca, R.; Fiore, A.; Li, Q. Air mass factor formulation for spectroscopic measurements from satellites: Application to formaldehyde retrievals from the global ozone monitoring experiment. J. Geophys. Res-Atmos. (1984–2012) 2001, 106, 14539–14550. [Google Scholar] [CrossRef]
© 2015 by the authors; licensee MDPI, Basel, Switzerland. This article is an open access article distributed under the terms and conditions of the Creative Commons Attribution license (http://creativecommons.org/licenses/by/4.0/).
Share and Cite
Lee, H.; Ryu, J.; Irie, H.; Jang, S.-H.; Park, J.; Choi, W.; Hong, H. Investigations of the Diurnal Variation of Vertical HCHO Profiles Based on MAX-DOAS Measurements in Beijing: Comparisons with OMI Vertical Column Data. Atmosphere 2015, 6, 1816-1832. https://doi.org/10.3390/atmos6111816
Lee H, Ryu J, Irie H, Jang S-H, Park J, Choi W, Hong H. Investigations of the Diurnal Variation of Vertical HCHO Profiles Based on MAX-DOAS Measurements in Beijing: Comparisons with OMI Vertical Column Data. Atmosphere. 2015; 6(11):1816-1832. https://doi.org/10.3390/atmos6111816
Chicago/Turabian StyleLee, Hanlim, Jaeyong Ryu, Hitoshi Irie, Seong-Ho Jang, Junsung Park, Wonei Choi, and Hyunkee Hong. 2015. "Investigations of the Diurnal Variation of Vertical HCHO Profiles Based on MAX-DOAS Measurements in Beijing: Comparisons with OMI Vertical Column Data" Atmosphere 6, no. 11: 1816-1832. https://doi.org/10.3390/atmos6111816
APA StyleLee, H., Ryu, J., Irie, H., Jang, S.-H., Park, J., Choi, W., & Hong, H. (2015). Investigations of the Diurnal Variation of Vertical HCHO Profiles Based on MAX-DOAS Measurements in Beijing: Comparisons with OMI Vertical Column Data. Atmosphere, 6(11), 1816-1832. https://doi.org/10.3390/atmos6111816