
On the Importance of Aerosol Composition for Estimating Incoming Solar Radiation: Focus on the Western African Stations of Dakar and Niamey during the Dry Season


Abstract
:1. Introduction
2. Case Study
2.1. Ground Stations and Period of Study
2.2. Selection of Dates and Classification into Day Types Based on Aerosol Activity

| Parameter | Symbol | Use | Source |
|---|---|---|---|
| Ångström coefficient 440–870 nm | α440–870 | Day type classification | AERONET |
| Aerosol optical depth at 550 nm | δ | Day type classification | AERONET |
| Cloud mask | CMa | Determination of clear sky days | Lidar + Radar or AERONET |
- A day was classified as clean if the total AOD was less than or equal to 0.15, regardless of the value of the Ångström coefficient.
- A day was classified as standard if the AOD was between 0.2 and 0.5 and the Ångström coefficient was lower than 0.4. Statistically speaking, standard days represent the average and most frequent aerosol conditions in this region of Africa.
- A day was called dusty if the total AOD was beyond 0.5 and the Ångström coefficient was lower than 0.4. Fouquart et al. in [28] consider the latter value as the upper limit for mineral dust aerosols.
- A day was classified as mixture if the Ångström coefficient was greater than or equal to 0.4 and the AOD was greater than 0.15. The higher value of Ångström coefficient indicated the presence of fine particles in addition to the common middle-sized aerosols [29].
| DAKAR | ||||||||||||||||||||
| Day Type | Clean | Standard | Mixture | Dusty | ||||||||||||||||
| Date | 06 | 06 | 06 | 06 | 06 | 06 | 06 | 06 | 06 | 06 | 06 | 06 | 06 | 06 | 06 | 06 | 06 | 06 | 06 | 06 |
| 02 | 02 | 02 | 02 | 03 | 02 | 02 | 03 | 03 | 04 | 01 | 02 | 02 | 02 | 05 | 03 | 03 | 03 | 03 | 04 | |
| 16 | 22 | 25 | 28 | 01 | 23 | 24 | 15 | 31 | 01 | 21 | 01 | 03 | 04 | 03 | 10 | 11 | 12 | 13 | 05 | |
| δ | 0.12 | 0.10 | 0.15 | 0.13 | 0.09 | 0.19 | 0.23 | 0.51 | 0.50 | 0.45 | 0.91 | 0.25 | 0.42 | 0.30 | 0.44 | 1.93 | 2.46 | 1.69 | 0.91 | 0.73 |
| δc | 0.07 | 0.06 | 0.10 | 0.07 | 0.06 | 0.11 | 0.13 | 0.35 | 0.33 | 0.32 | 0.26 | 0.08 | 0.11 | 0.08 | 0.09 | 1.41 | 1.62 | 1.24 | 0.66 | 0.52 |
| δf | 0.05 | 0.04 | 0.05 | 0.06 | 0.03 | 0.08 | 0.10 | 0.16 | 0.17 | 0.13 | 0.65 | 0.17 | 0.31 | 0.22 | 0.35 | 0.52 | 0.84 | 0.45 | 0.25 | 0.21 |
| α440–870 | 0.38 | 0.30 | 0.13 | 0.41 | 0.27 | 0.57 | 0.38 | 0.15 | 0.20 | 0.15 | 0.85 | 0.86 | 0.91 | 0.92 | 1.14 | 0.11 | 0.12 | 0.10 | 0.12 | 0.16 |
| SSA | 0.91 | 0.88 | 0.93 | 0.87 | 0.90 | 0.89 | 0.89 | 0.92 | 0.92 | 0.92 | 0.83 | 0.80 | 0.85 | 0.82 | 0.88 | 0.94 | 0.95 | 0.95 | 0.94 | 0.94 |
| NIAMEY | ||||||||||||||||||||
| Day Type | Clean | Standard | Mixture | Dusty | ||||||||||||||||
| Date | 06 | 06 | 06 | 06 | 06 | 06 | 06 | 06 | 06 | 06 | 06 | 06 | 06 | 06 | 06 | 06 | 06 | 06 | 06 | 06 |
| 01 | 02 | 11 | 11 | 11 | 02 | 02 | 04 | 04 | 05 | 01 | 01 | 01 | 01 | 12 | 03 | 03 | 03 | 04 | 06 | |
| 16 | 25 | 05 | 25 | 26 | 04 | 06 | 06 | 29 | 23 | 01 | 09 | 11 | 22 | 15 | 10 | 12 | 21 | 19 | 13 | |
| δ | 0.13 | 0.14 | 0.09 | 0.06 | 0.08 | 0.27 | 0.32 | 0.22 | 0.27 | 0.57 | 0.32 | 0.44 | 0.34 | 0.34 | 0.27 | 1.54 | 0.83 | 1.01 | 1.68 | 1.50 |
| δc | 0.03 | 0.08 | 0.05 | 0.02 | 0.04 | 0.15 | 0.20 | 0.14 | 0.17 | 0.20 | 0.09 | 0.09 | 0.08 | 0.08 | 0.12 | 0.99 | 0.55 | 0.64 | 1.07 | 1.04 |
| δf | 0.10 | 0.06 | 0.04 | 0.04 | 0.04 | 0.12 | 0.12 | 0.08 | 0.09 | 0.37 | 0.23 | 0.35 | 0.26 | 0.26 | 0.15 | 0.55 | 0.28 | 0.37 | 0.61 | 0.46 |
| α440–870 | 0.92 | 0.47 | 0.49 | 0.73 | 0.52 | 0.40 | 0.37 | 0.27 | 0.21 | 0.14 | 1.01 | 1.12 | 0.99 | 1.04 | 0.66 | 0.16 | 0.19 | 0.20 | 0.19 | 0.16 |
| SSA | 0.79 | 0.87 | 0.86 | 0.92 | 0.92 | 0.88 | 0.91 | 0.92 | 0.90 | 0.95 | 0.80 | 0.84 | 0.78 | 0.80 | 0.88 | 0.96 | 0.95 | 0.94 | 0.97 | 0.95 |
3. Estimation of Surface Fluxes
3.1. Experimental Design
3.2. Data Base of Aerosol Properties
3.2.1. OPAC Desert Aerosol Model
| MINM | MIAM | MICM | SSAM | SOOT | |
|---|---|---|---|---|---|
| SSA | 0.95 | 0.83 | 0.62 | 1.00 | 0.23 |
| Mode radius (μm) | 0.07 | 0.39 | 1.90 | 0.209 | 0.0118 |
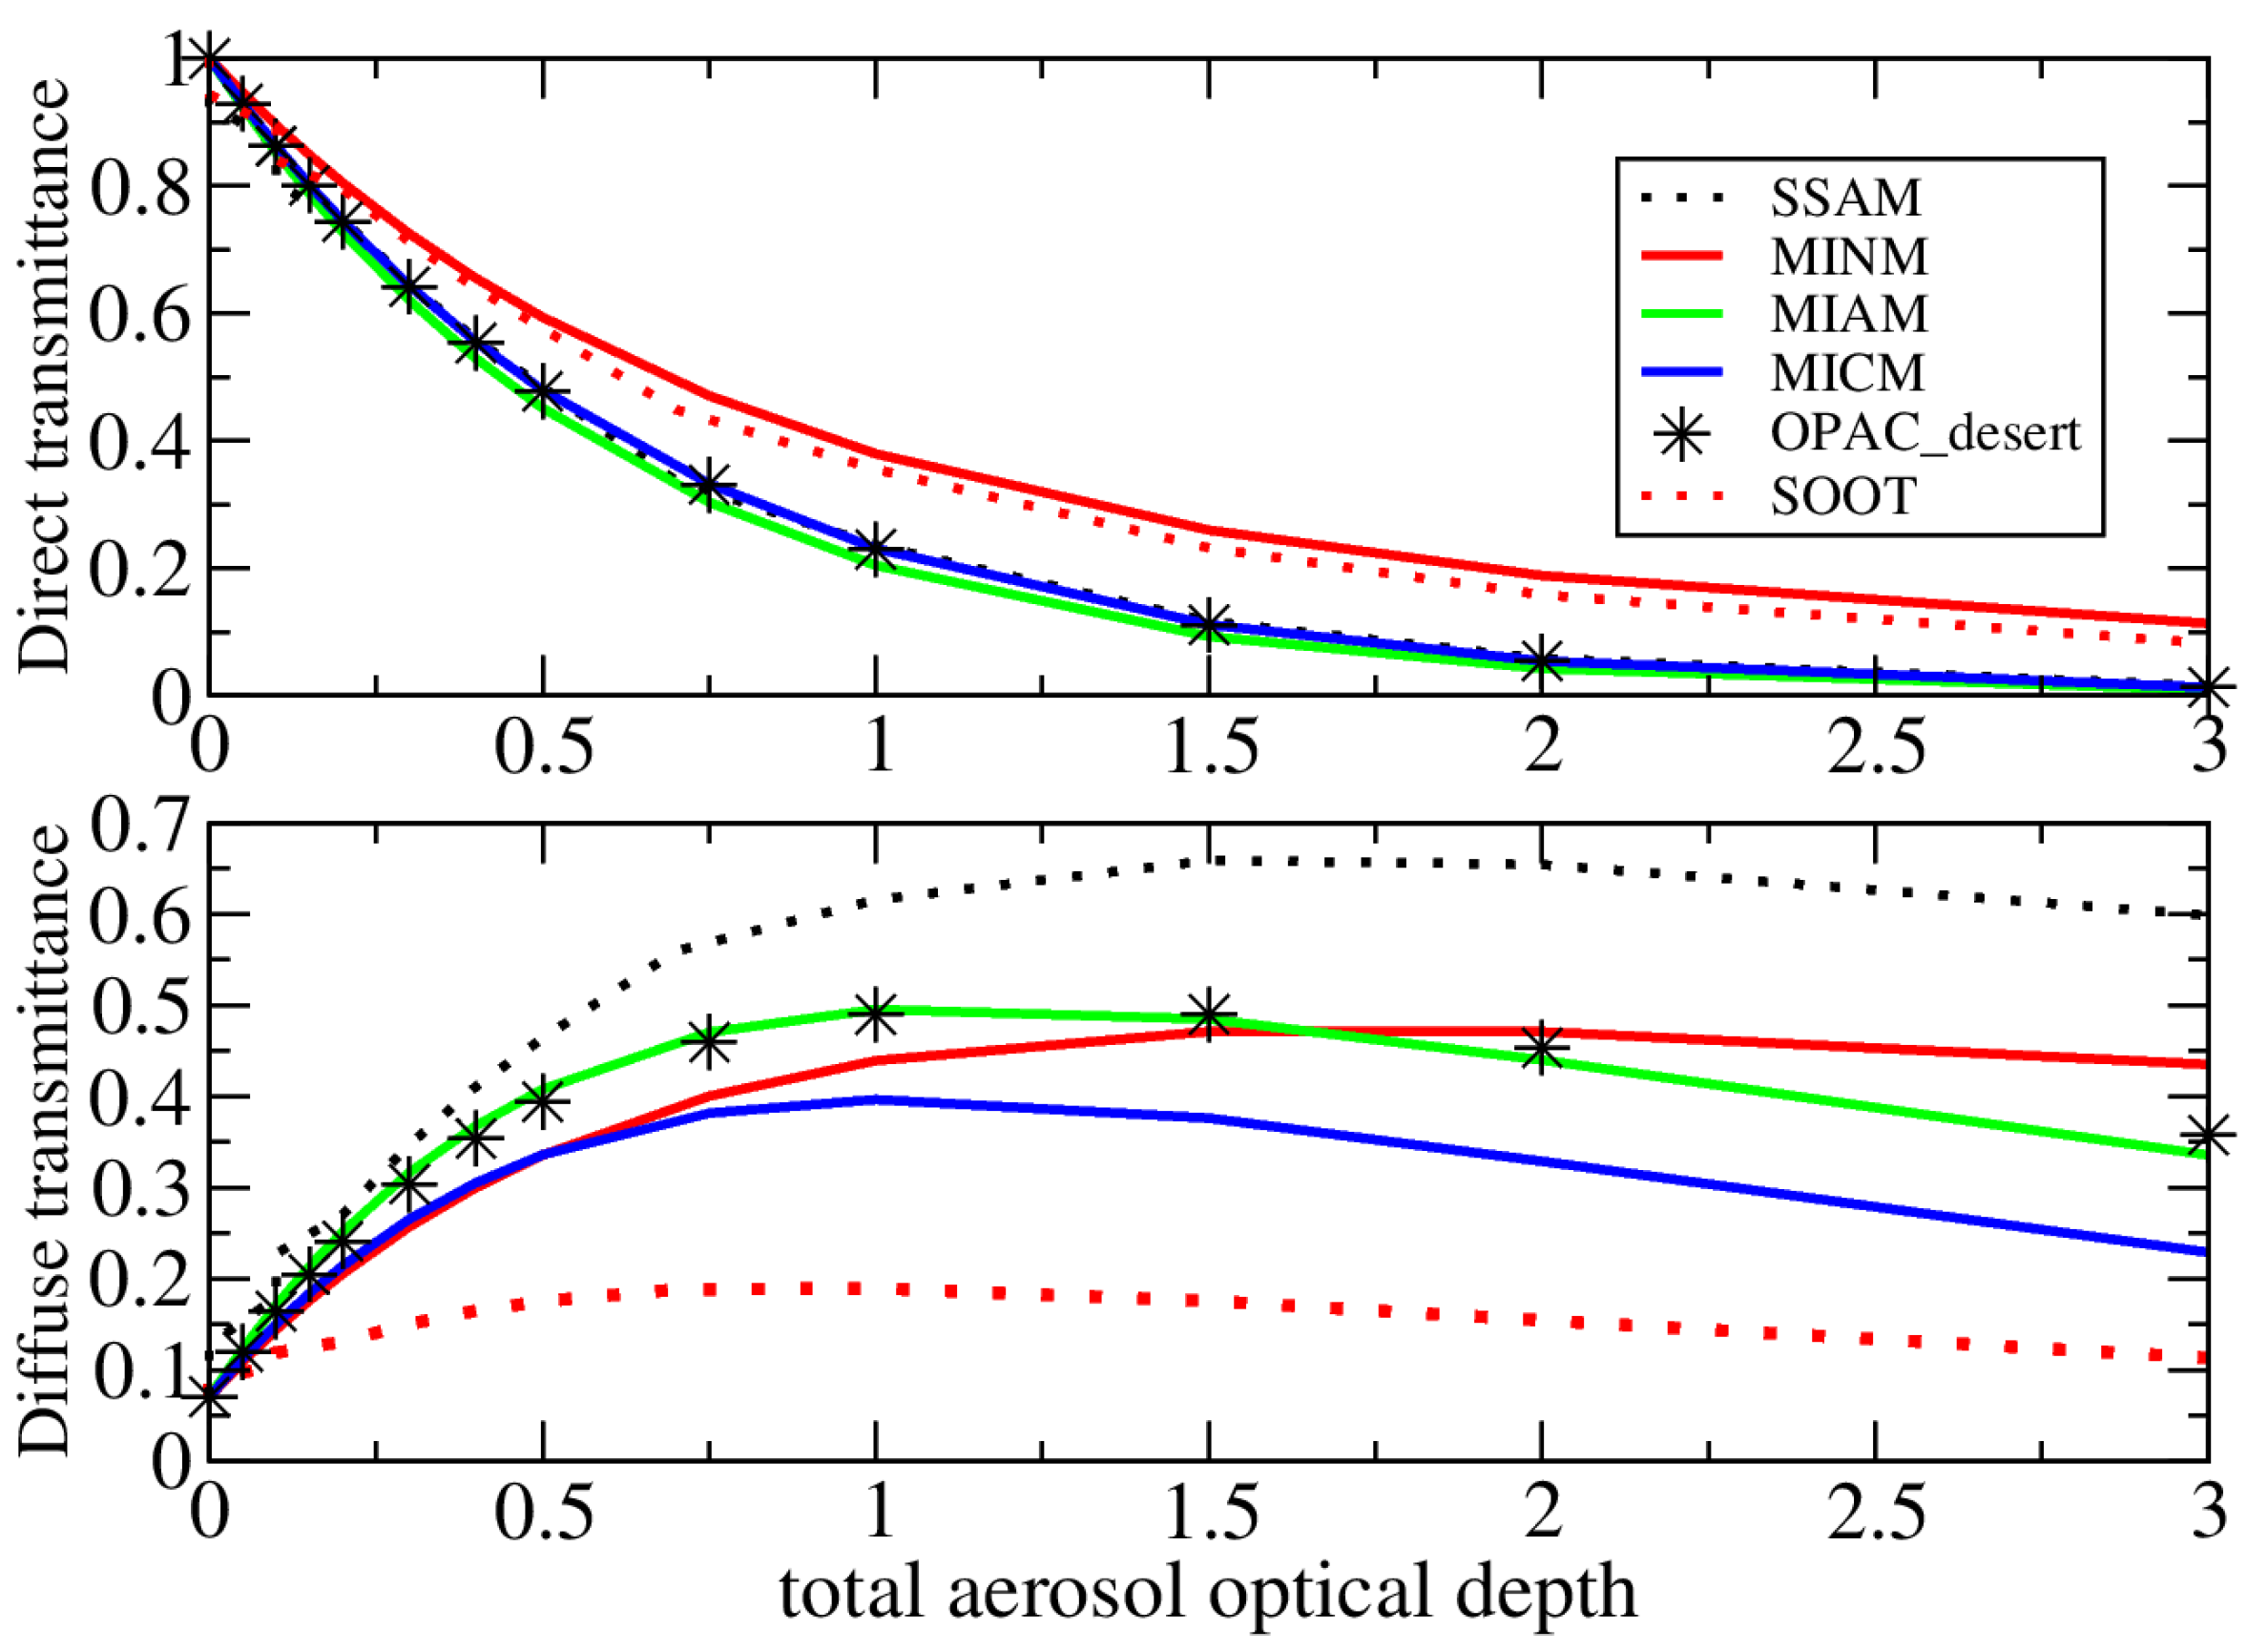
3.2.2. OPAC Elementary Aerosol Components
3.3. Methods for Estimation of Surface Fluxes
3.4. Inputs for Estimation of Surface Fluxes
| Parameter | Symbol | Used in Methods | Source |
|---|---|---|---|
| Solar zenith angle | θ0 | LSA-SAF, SIRAMix1, SIRAMix2 | AERONET |
| Precipitable water in cm−1 | uH2O | LSA-SAF, SIRAMix1, SIRAMix2 | AERONET |
| Total ozone column in Dobson units | uO3 | LSA-SAF, SIRAMix1, SIRAMix2 | AERONET |
| Surface albedo | α | LSA-SAF, SIRAMix1, SIRAMix2 | LSA-SAF |
| Aerosol optical depth at 550 nm | δ | SIRAMix1 | AERONET |
| Coarse mode AOD at 550 nm | δc | SIRAMix2 | AERONET |
| Fine mode AOD at 550 nm | δf | SIRAMix2 | AERONET |
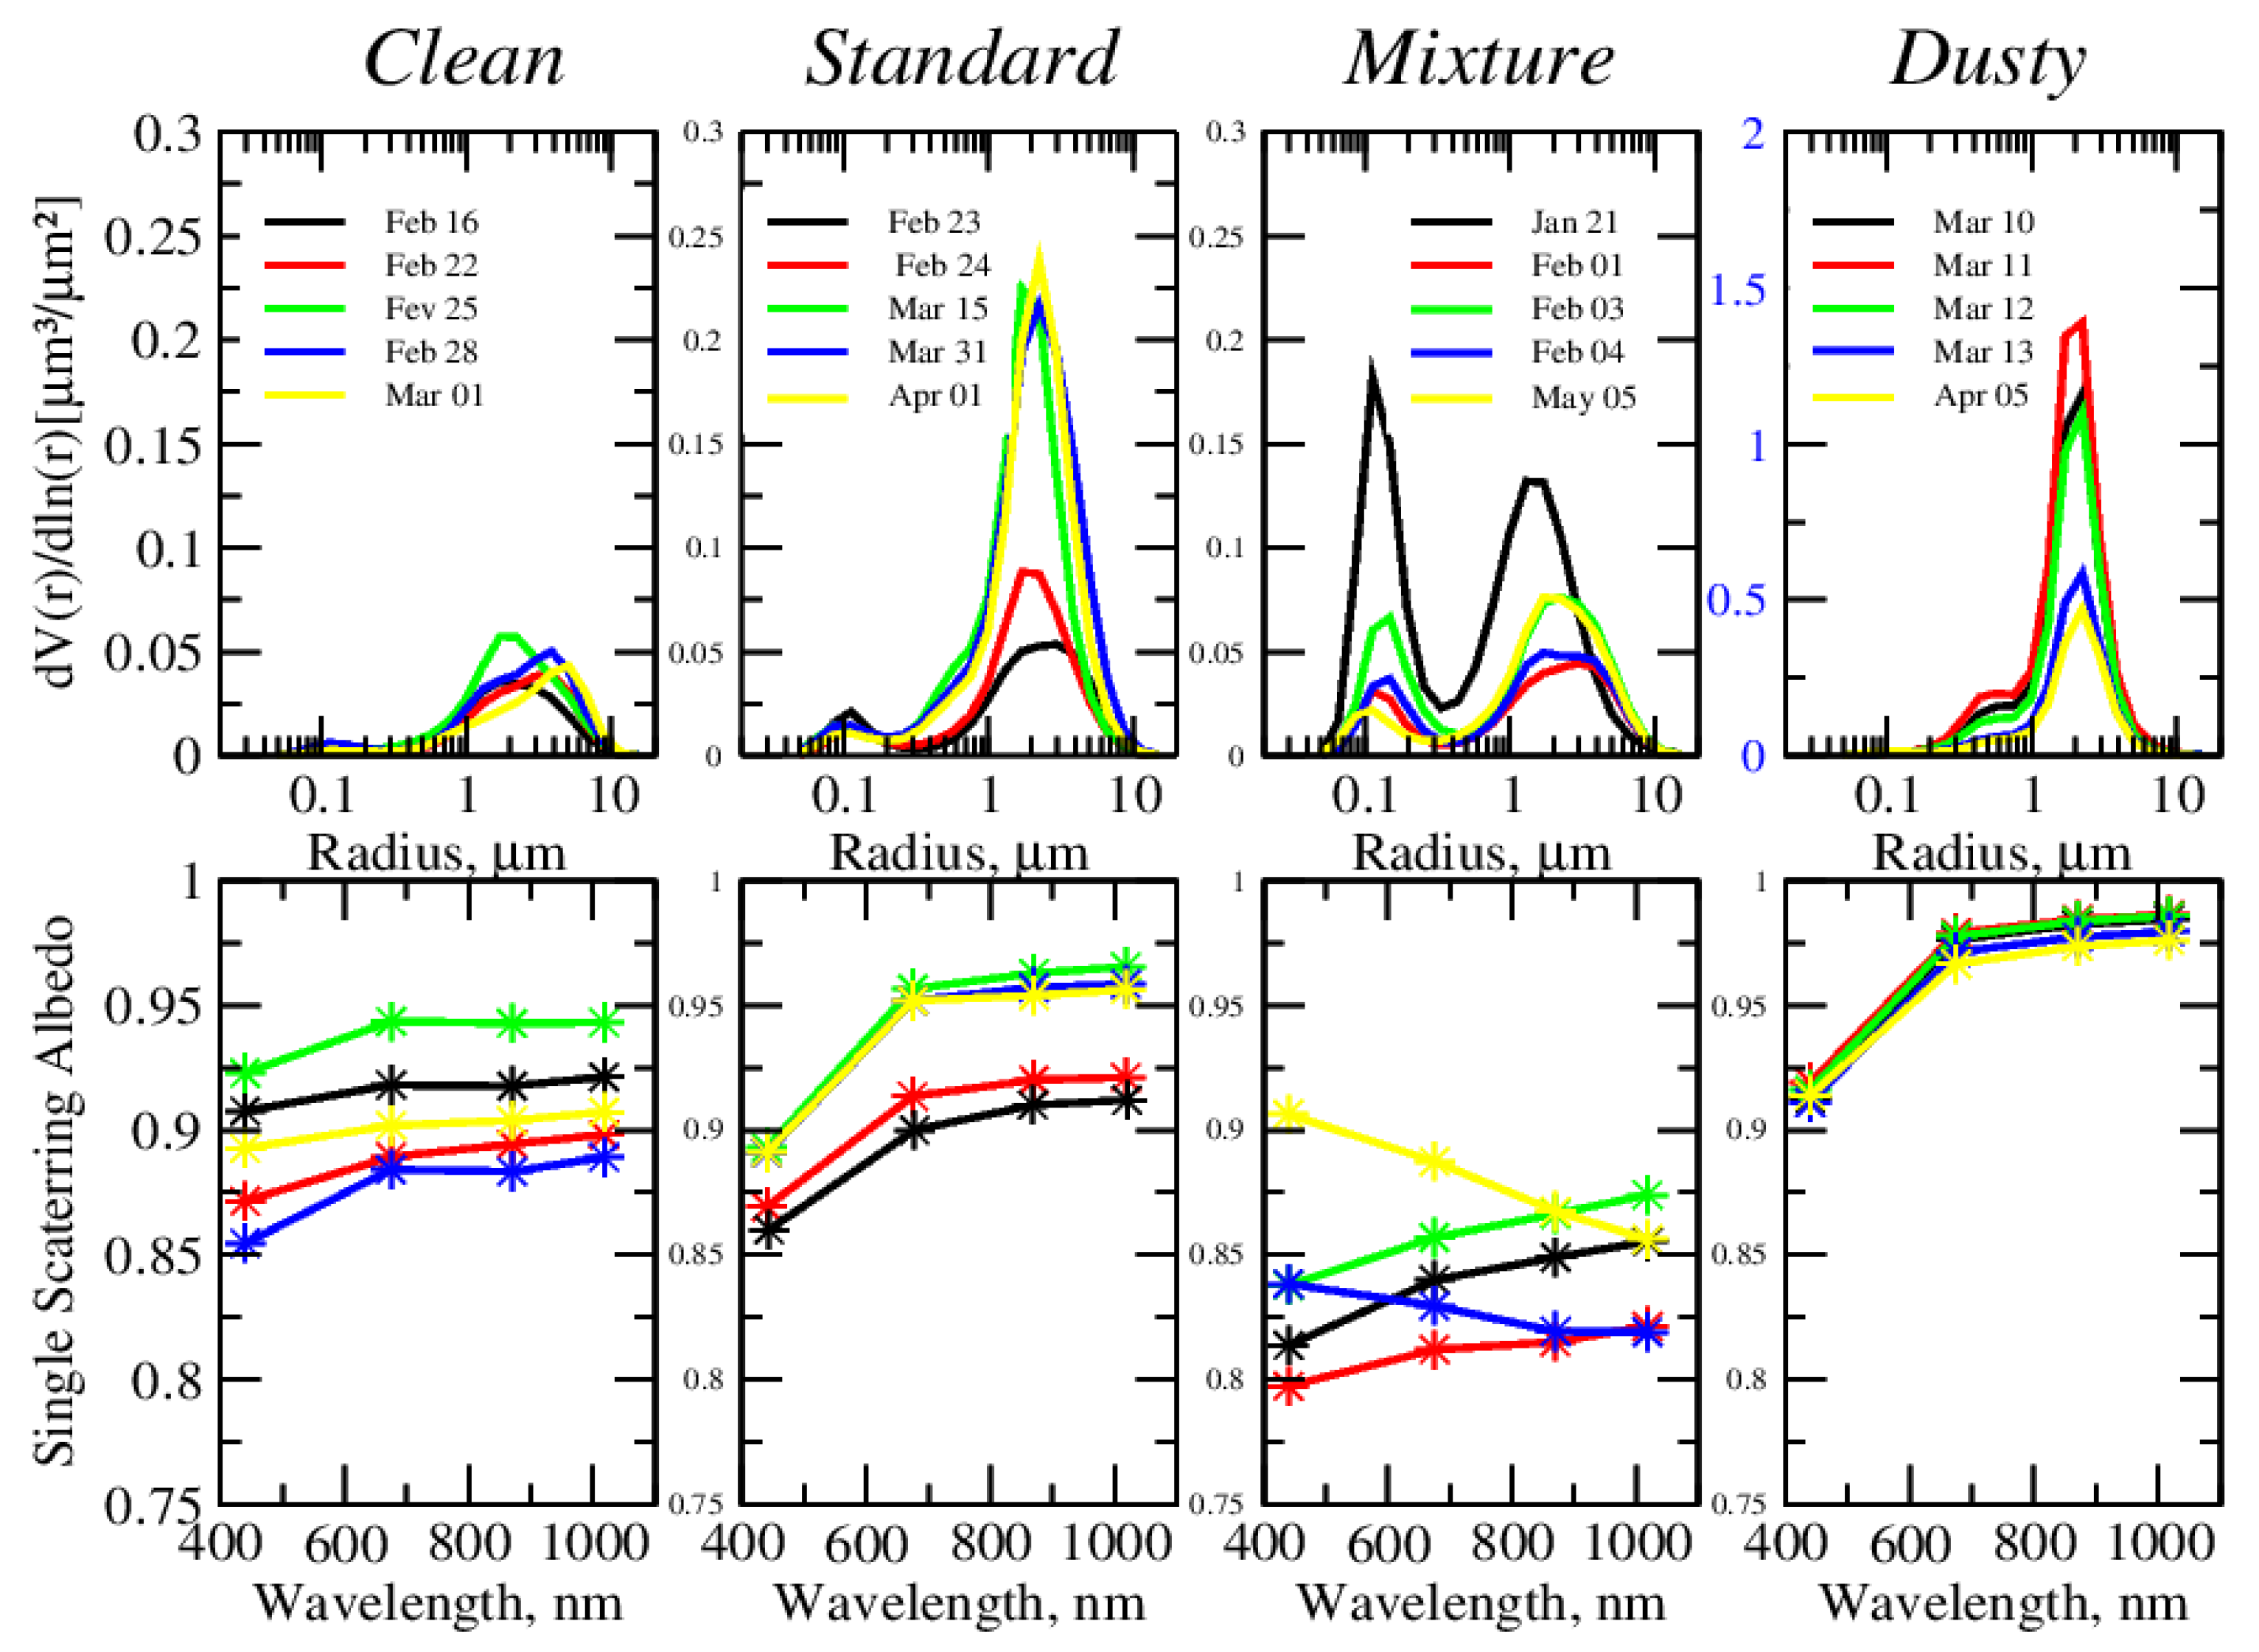
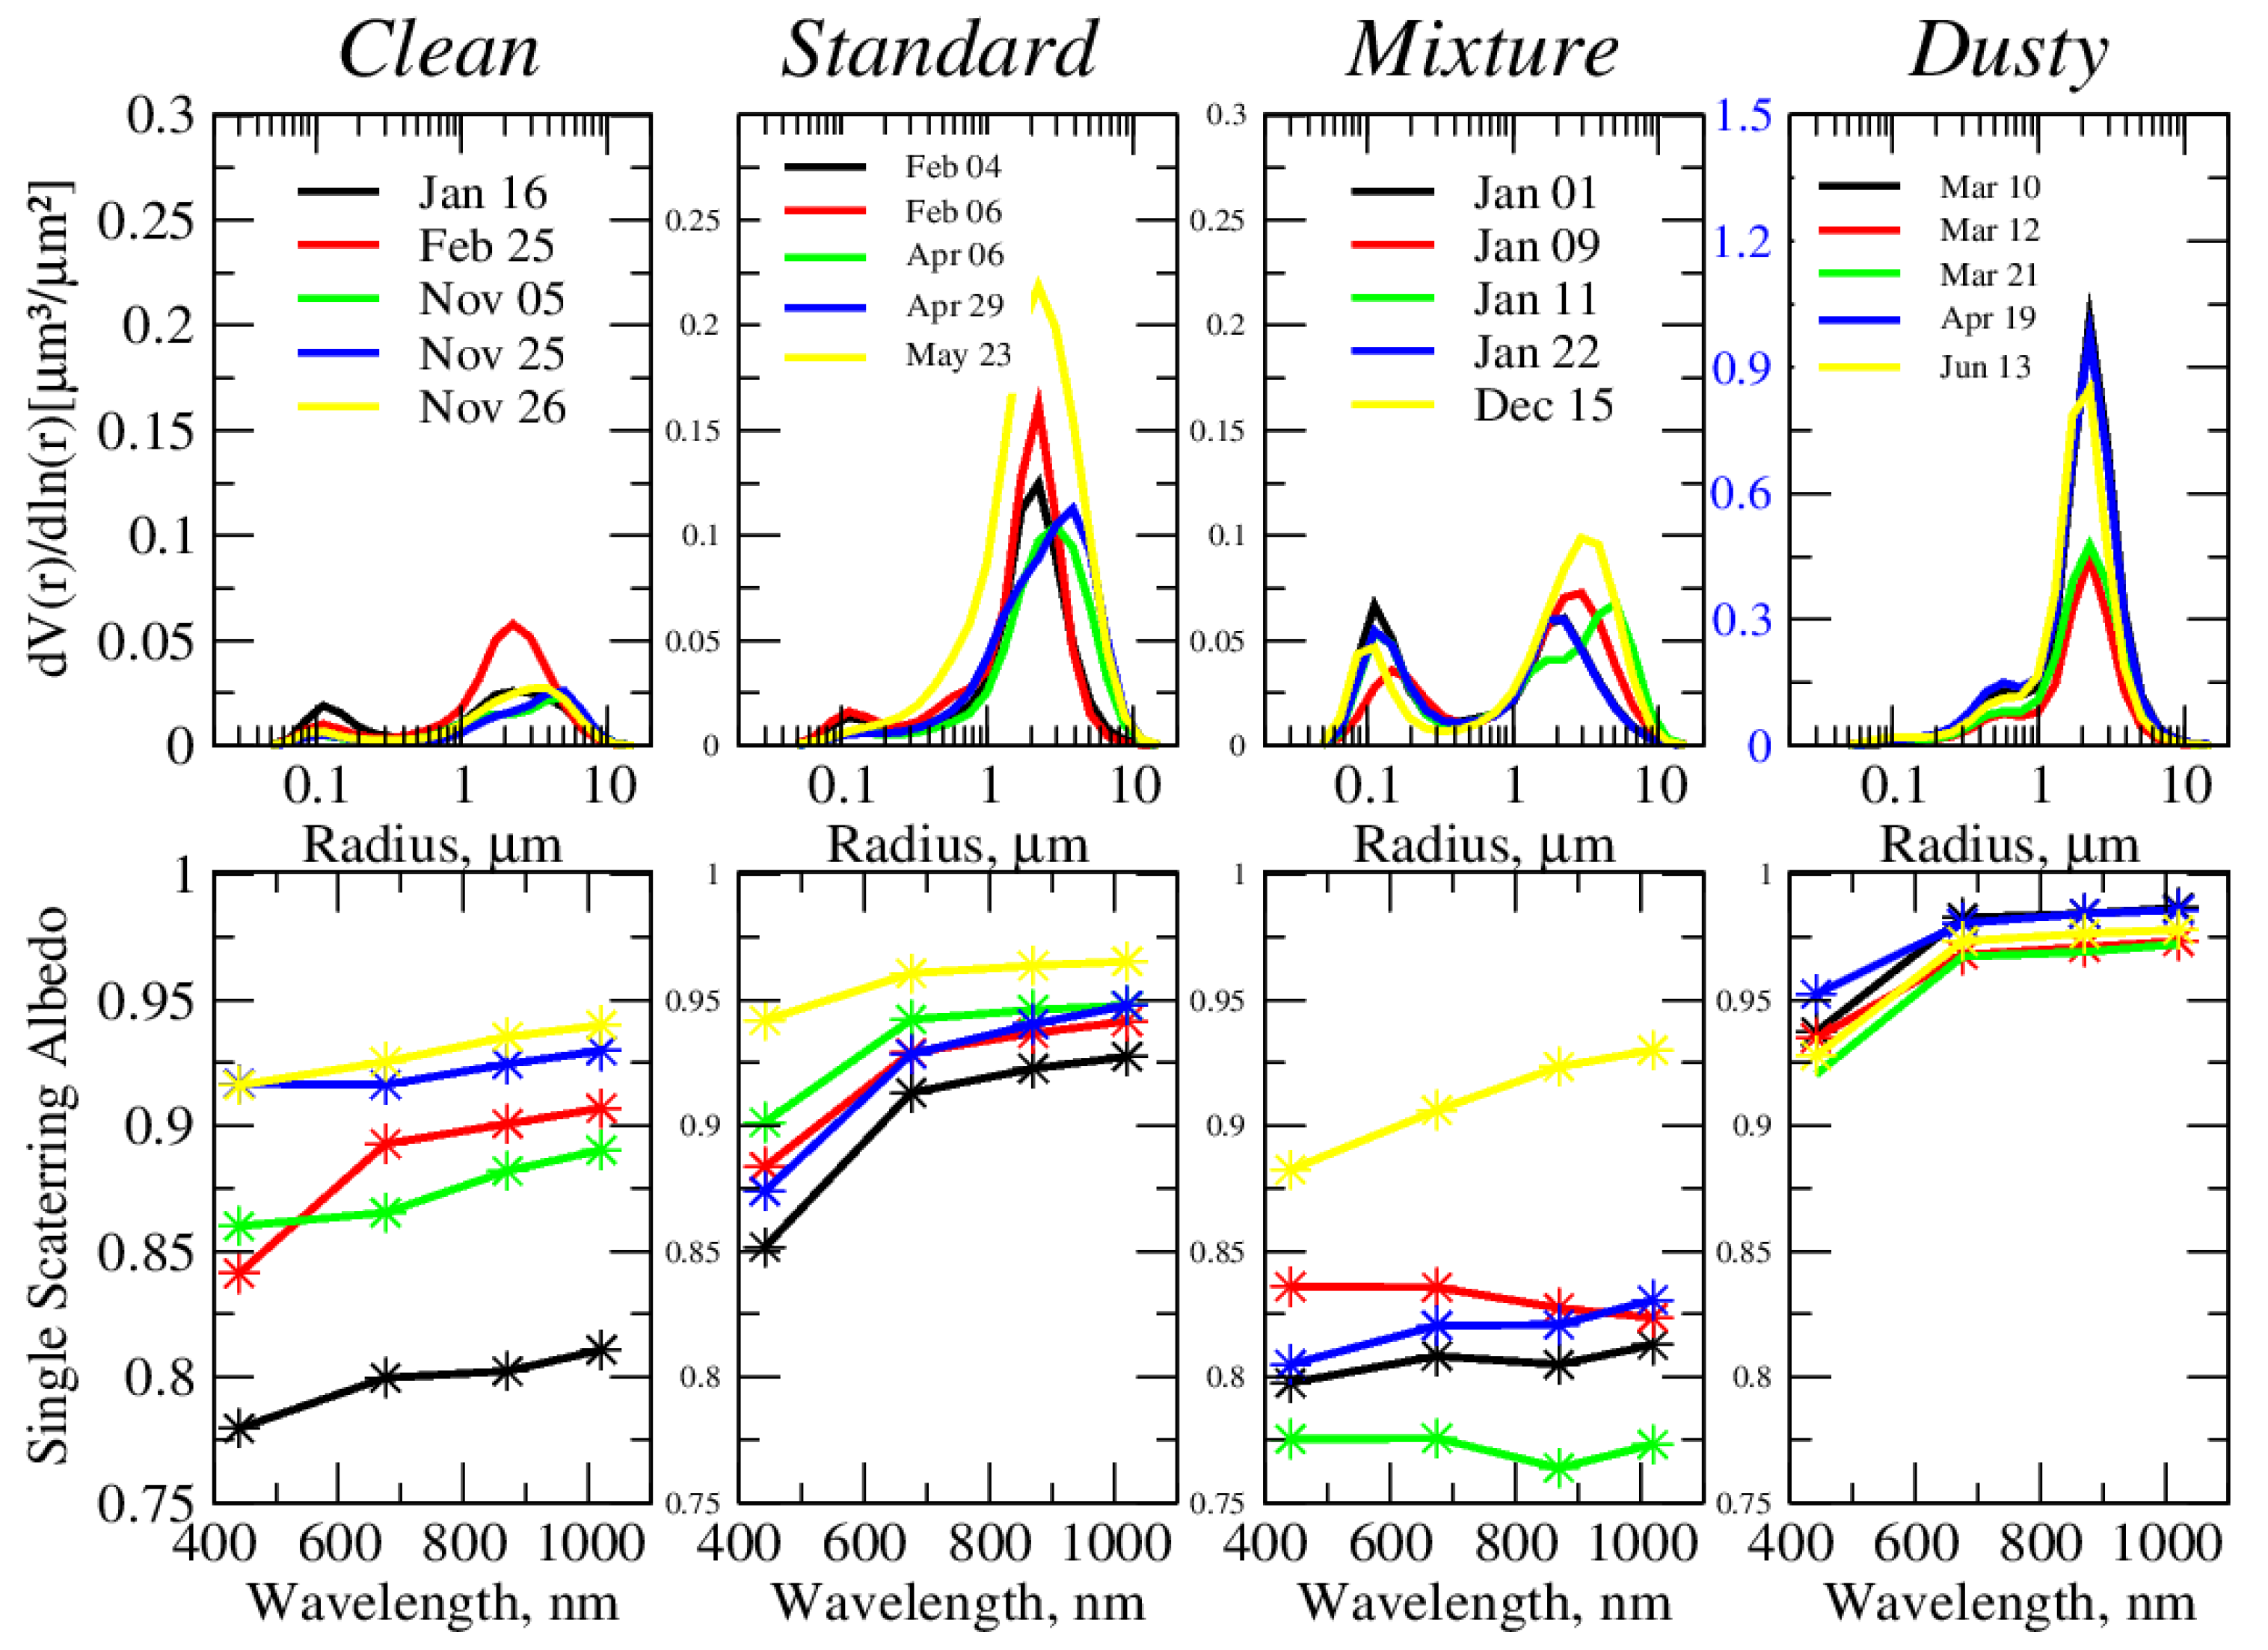
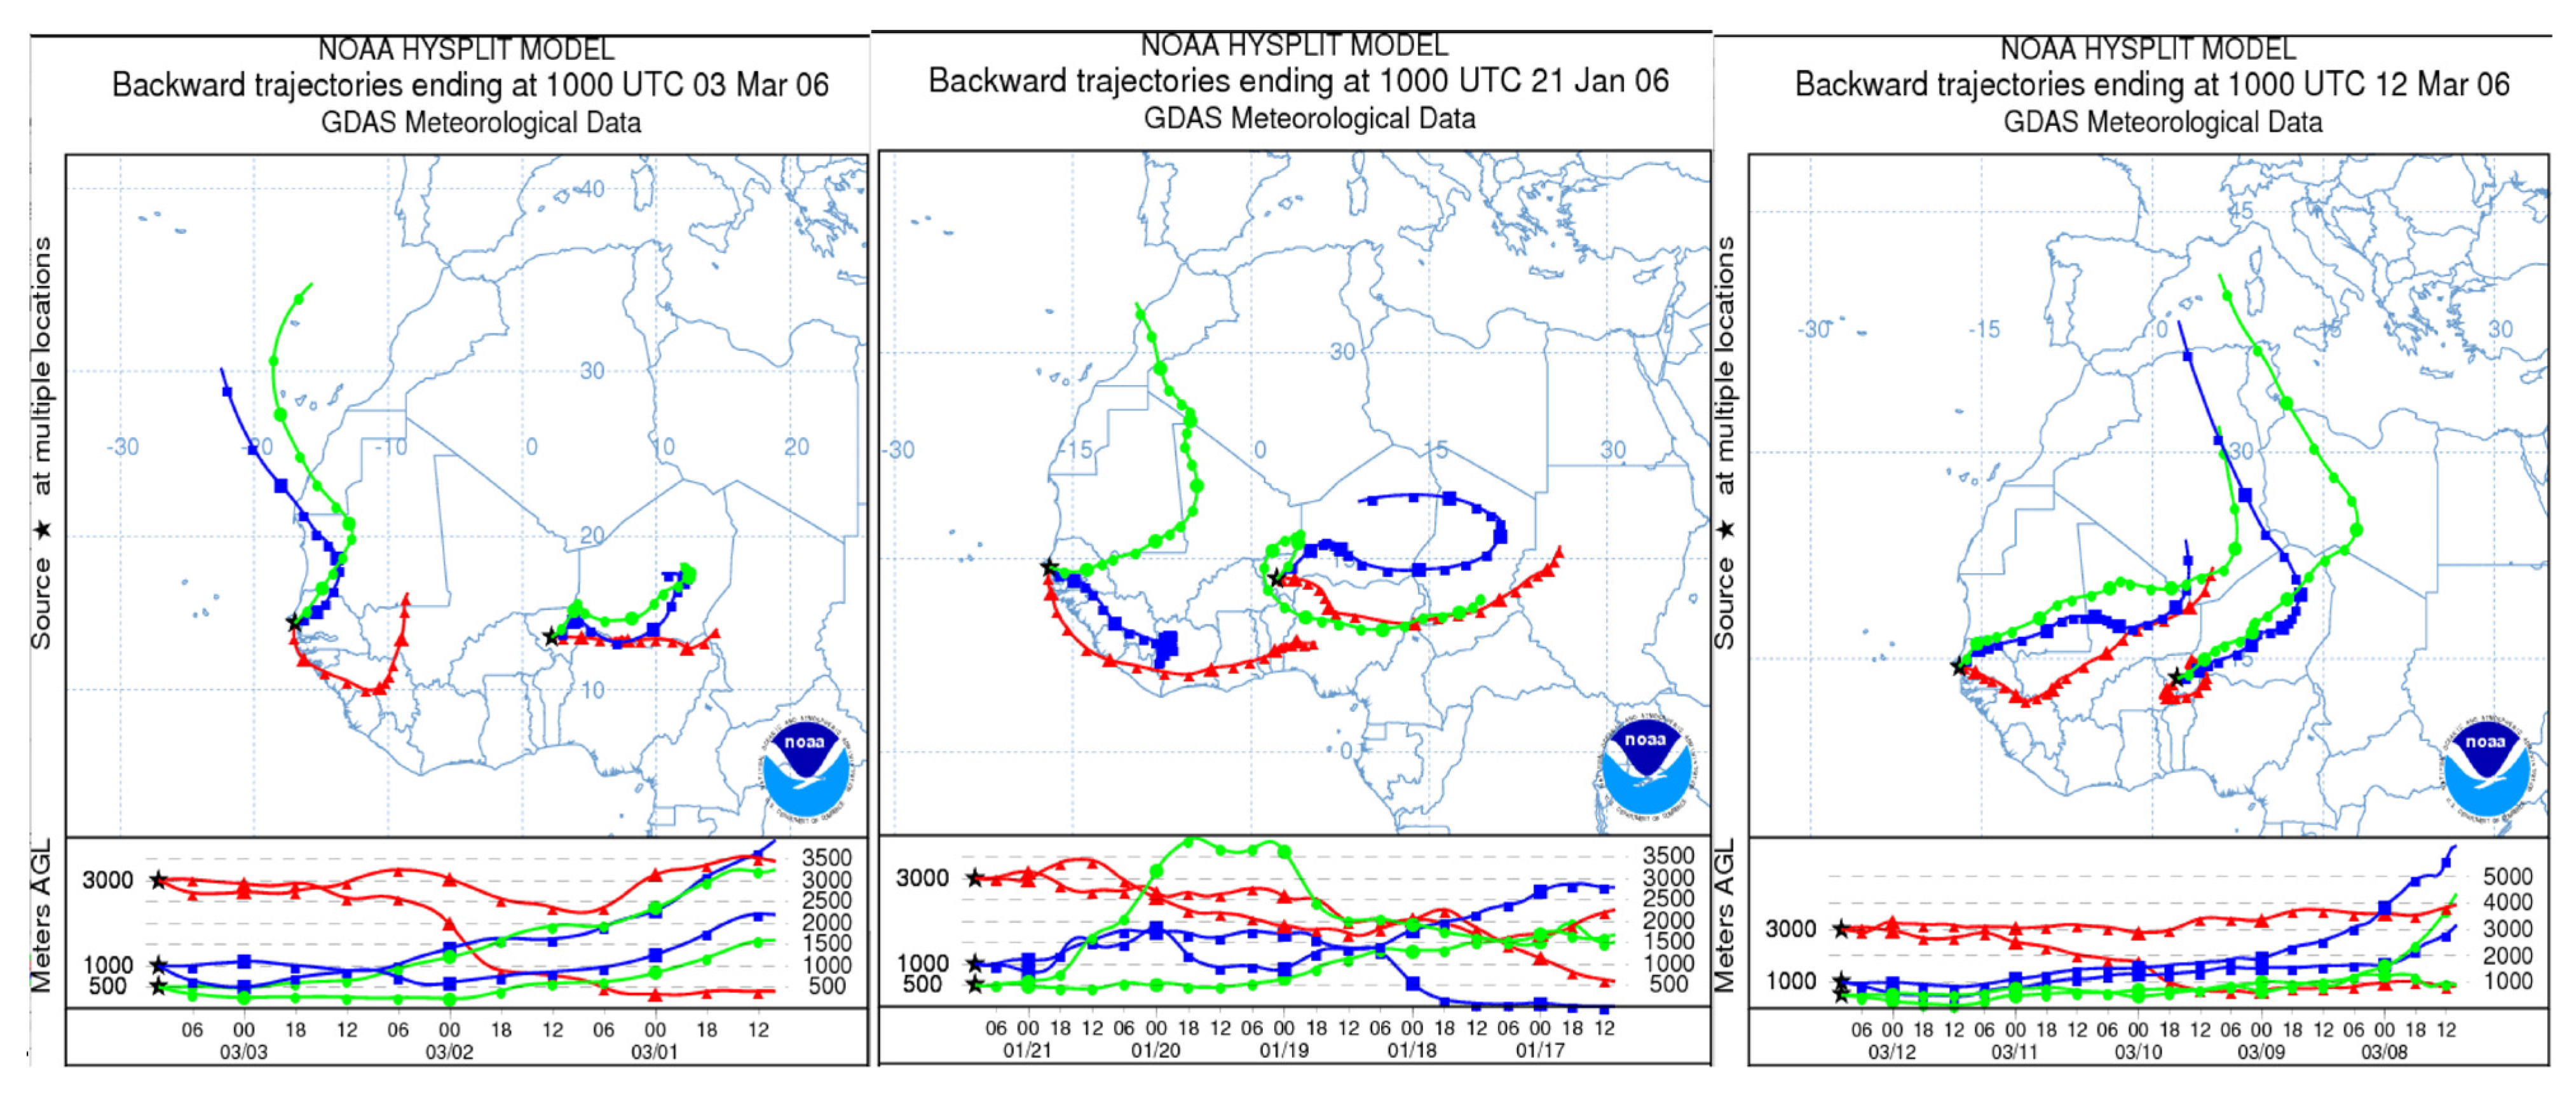
3.5. Determination of Predominant Aerosol Types for Each Selected Day
| Parameter | Symbol | Source |
|---|---|---|
| Back-trajectories | - | NOAA HYSPLIT |
| Spectral aerosol single scattering albedo | ω0(λ) | AERONET |
| Aerosol size distribution of the particle volume in SIRAMix2 | dV(r)/dlnr | AERONET |
| Lidar | - | Dakar |


3.5.1. Aerosol Characterization for Clean Days
3.5.2. Aerosol Characterization for Standard Days
3.5.3. Aerosol Characterization for Mixture Days
3.5.4. Aerosol Characterization for Dusty Days
4. Results
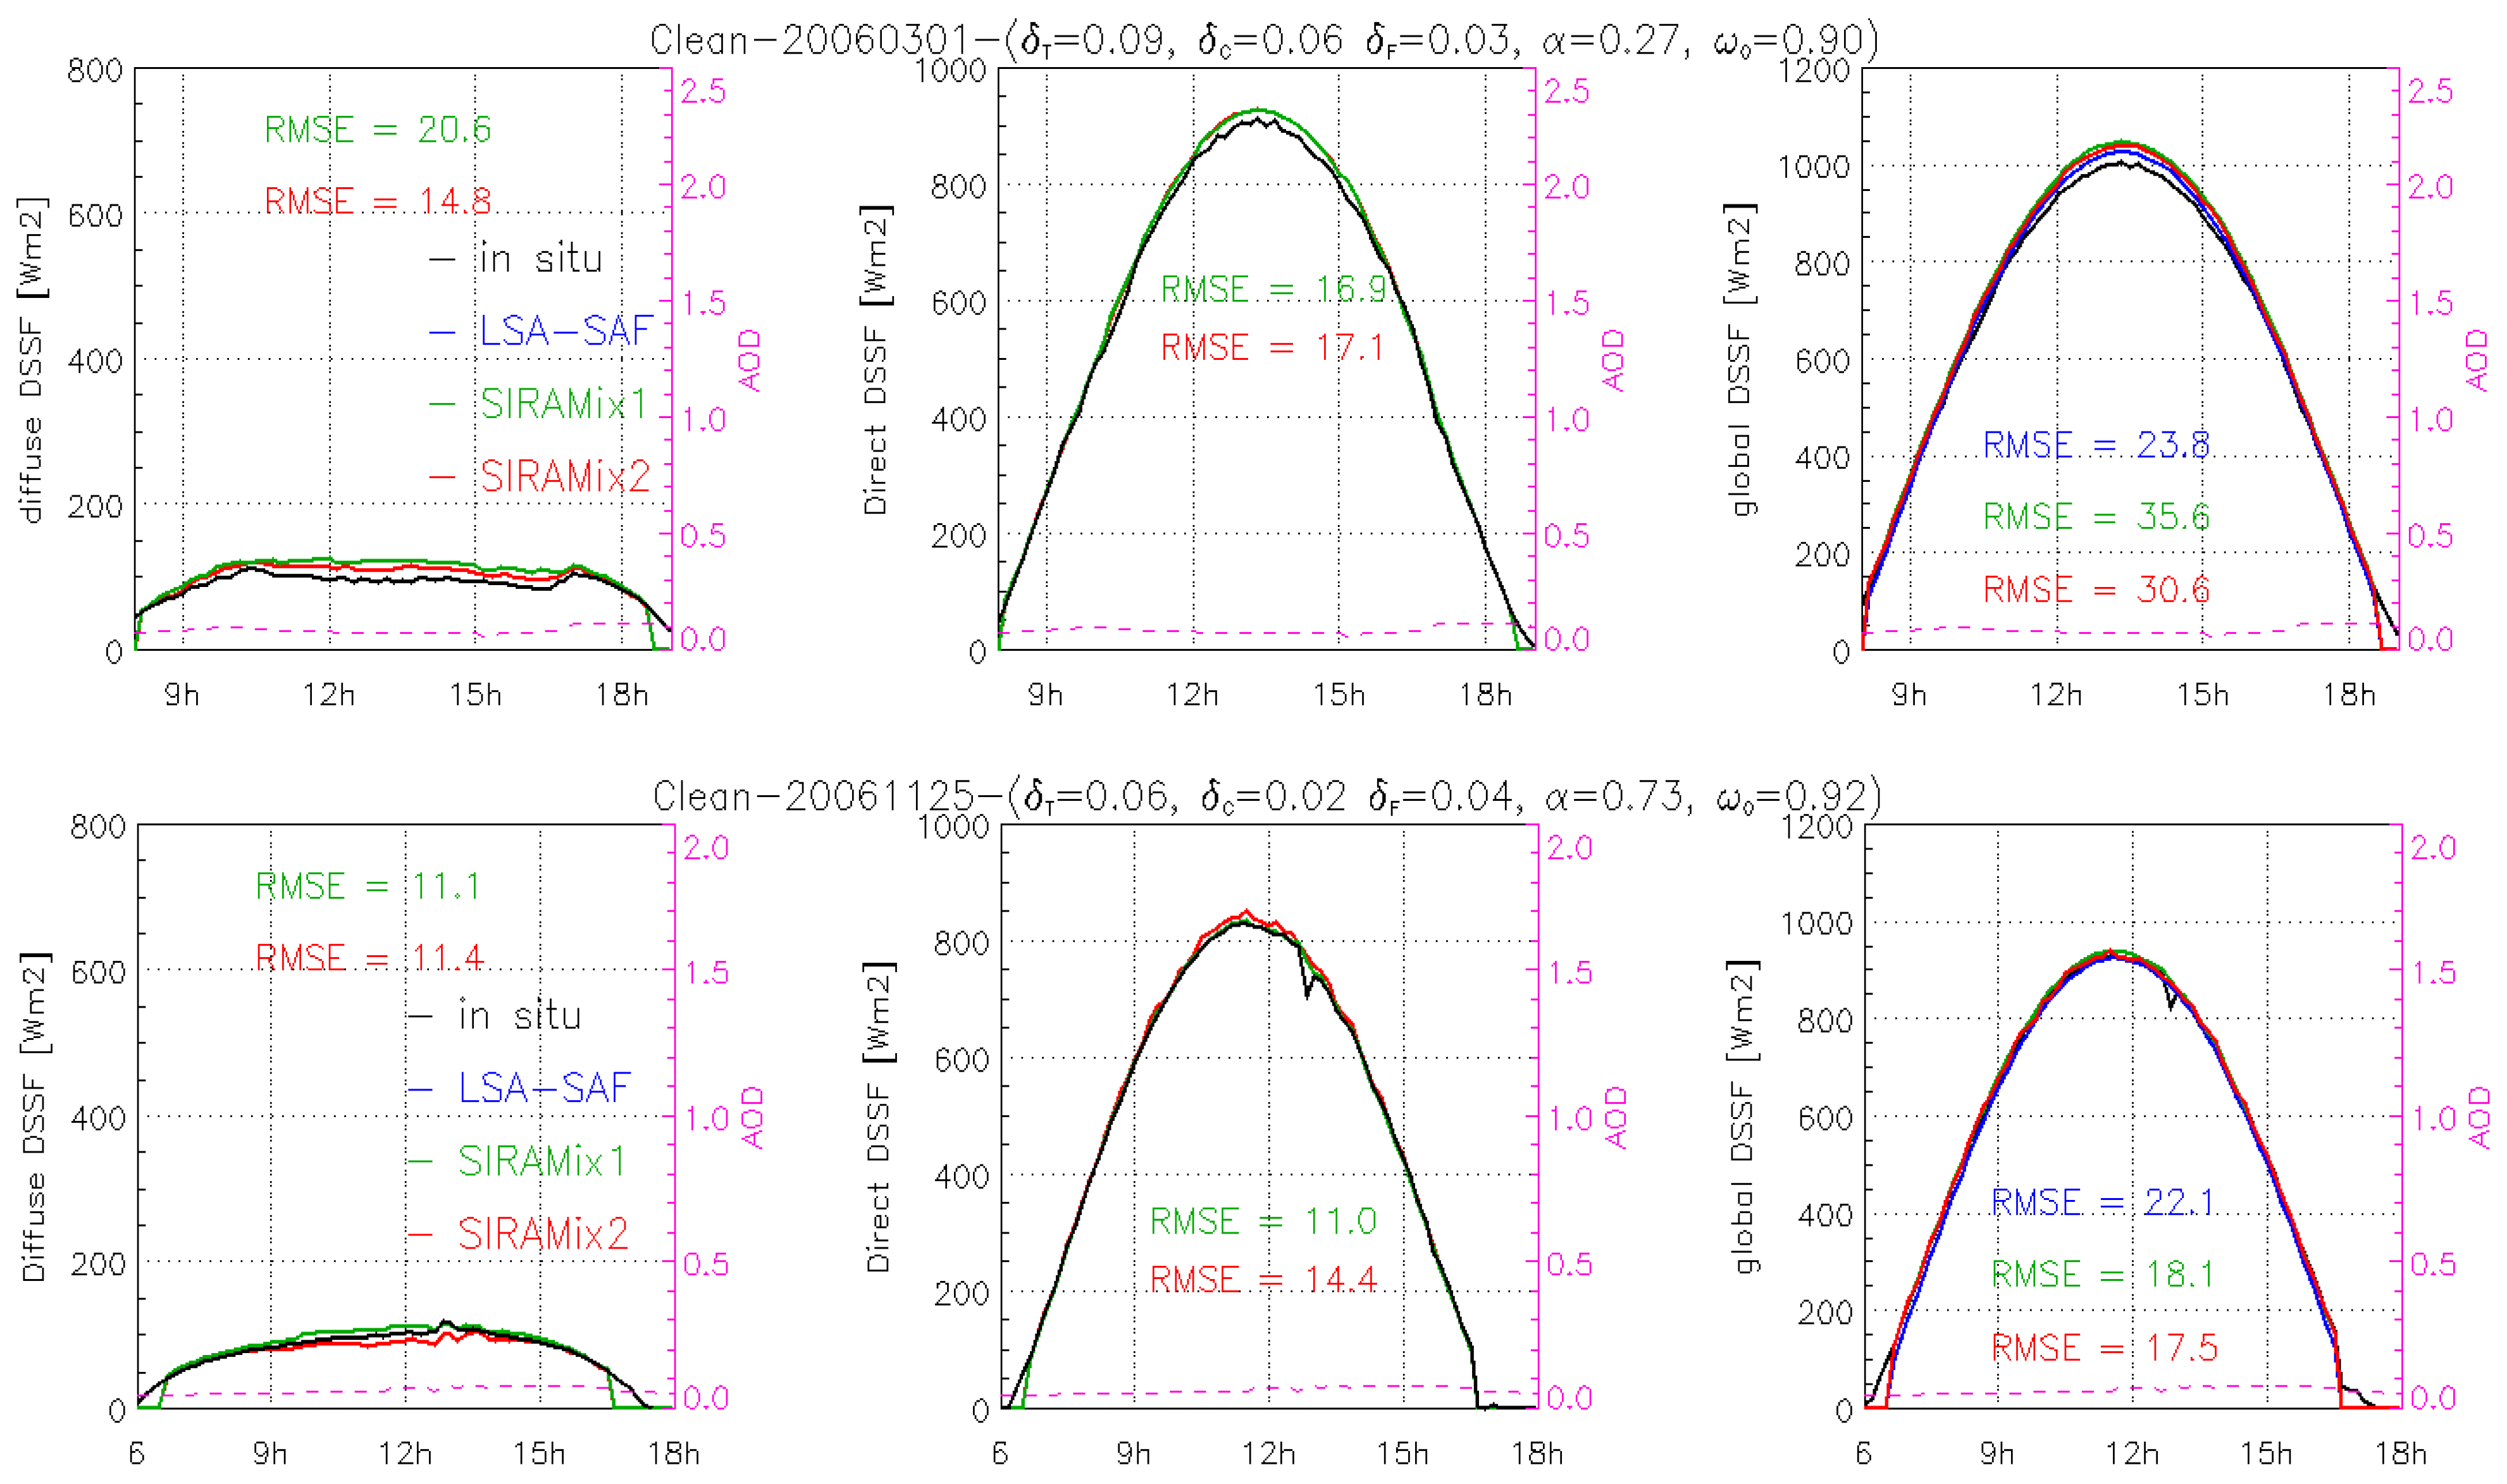
4.1. Diurnal Evolution of Surface Fluxes for Selected Dates
4.1.1. Clean Days
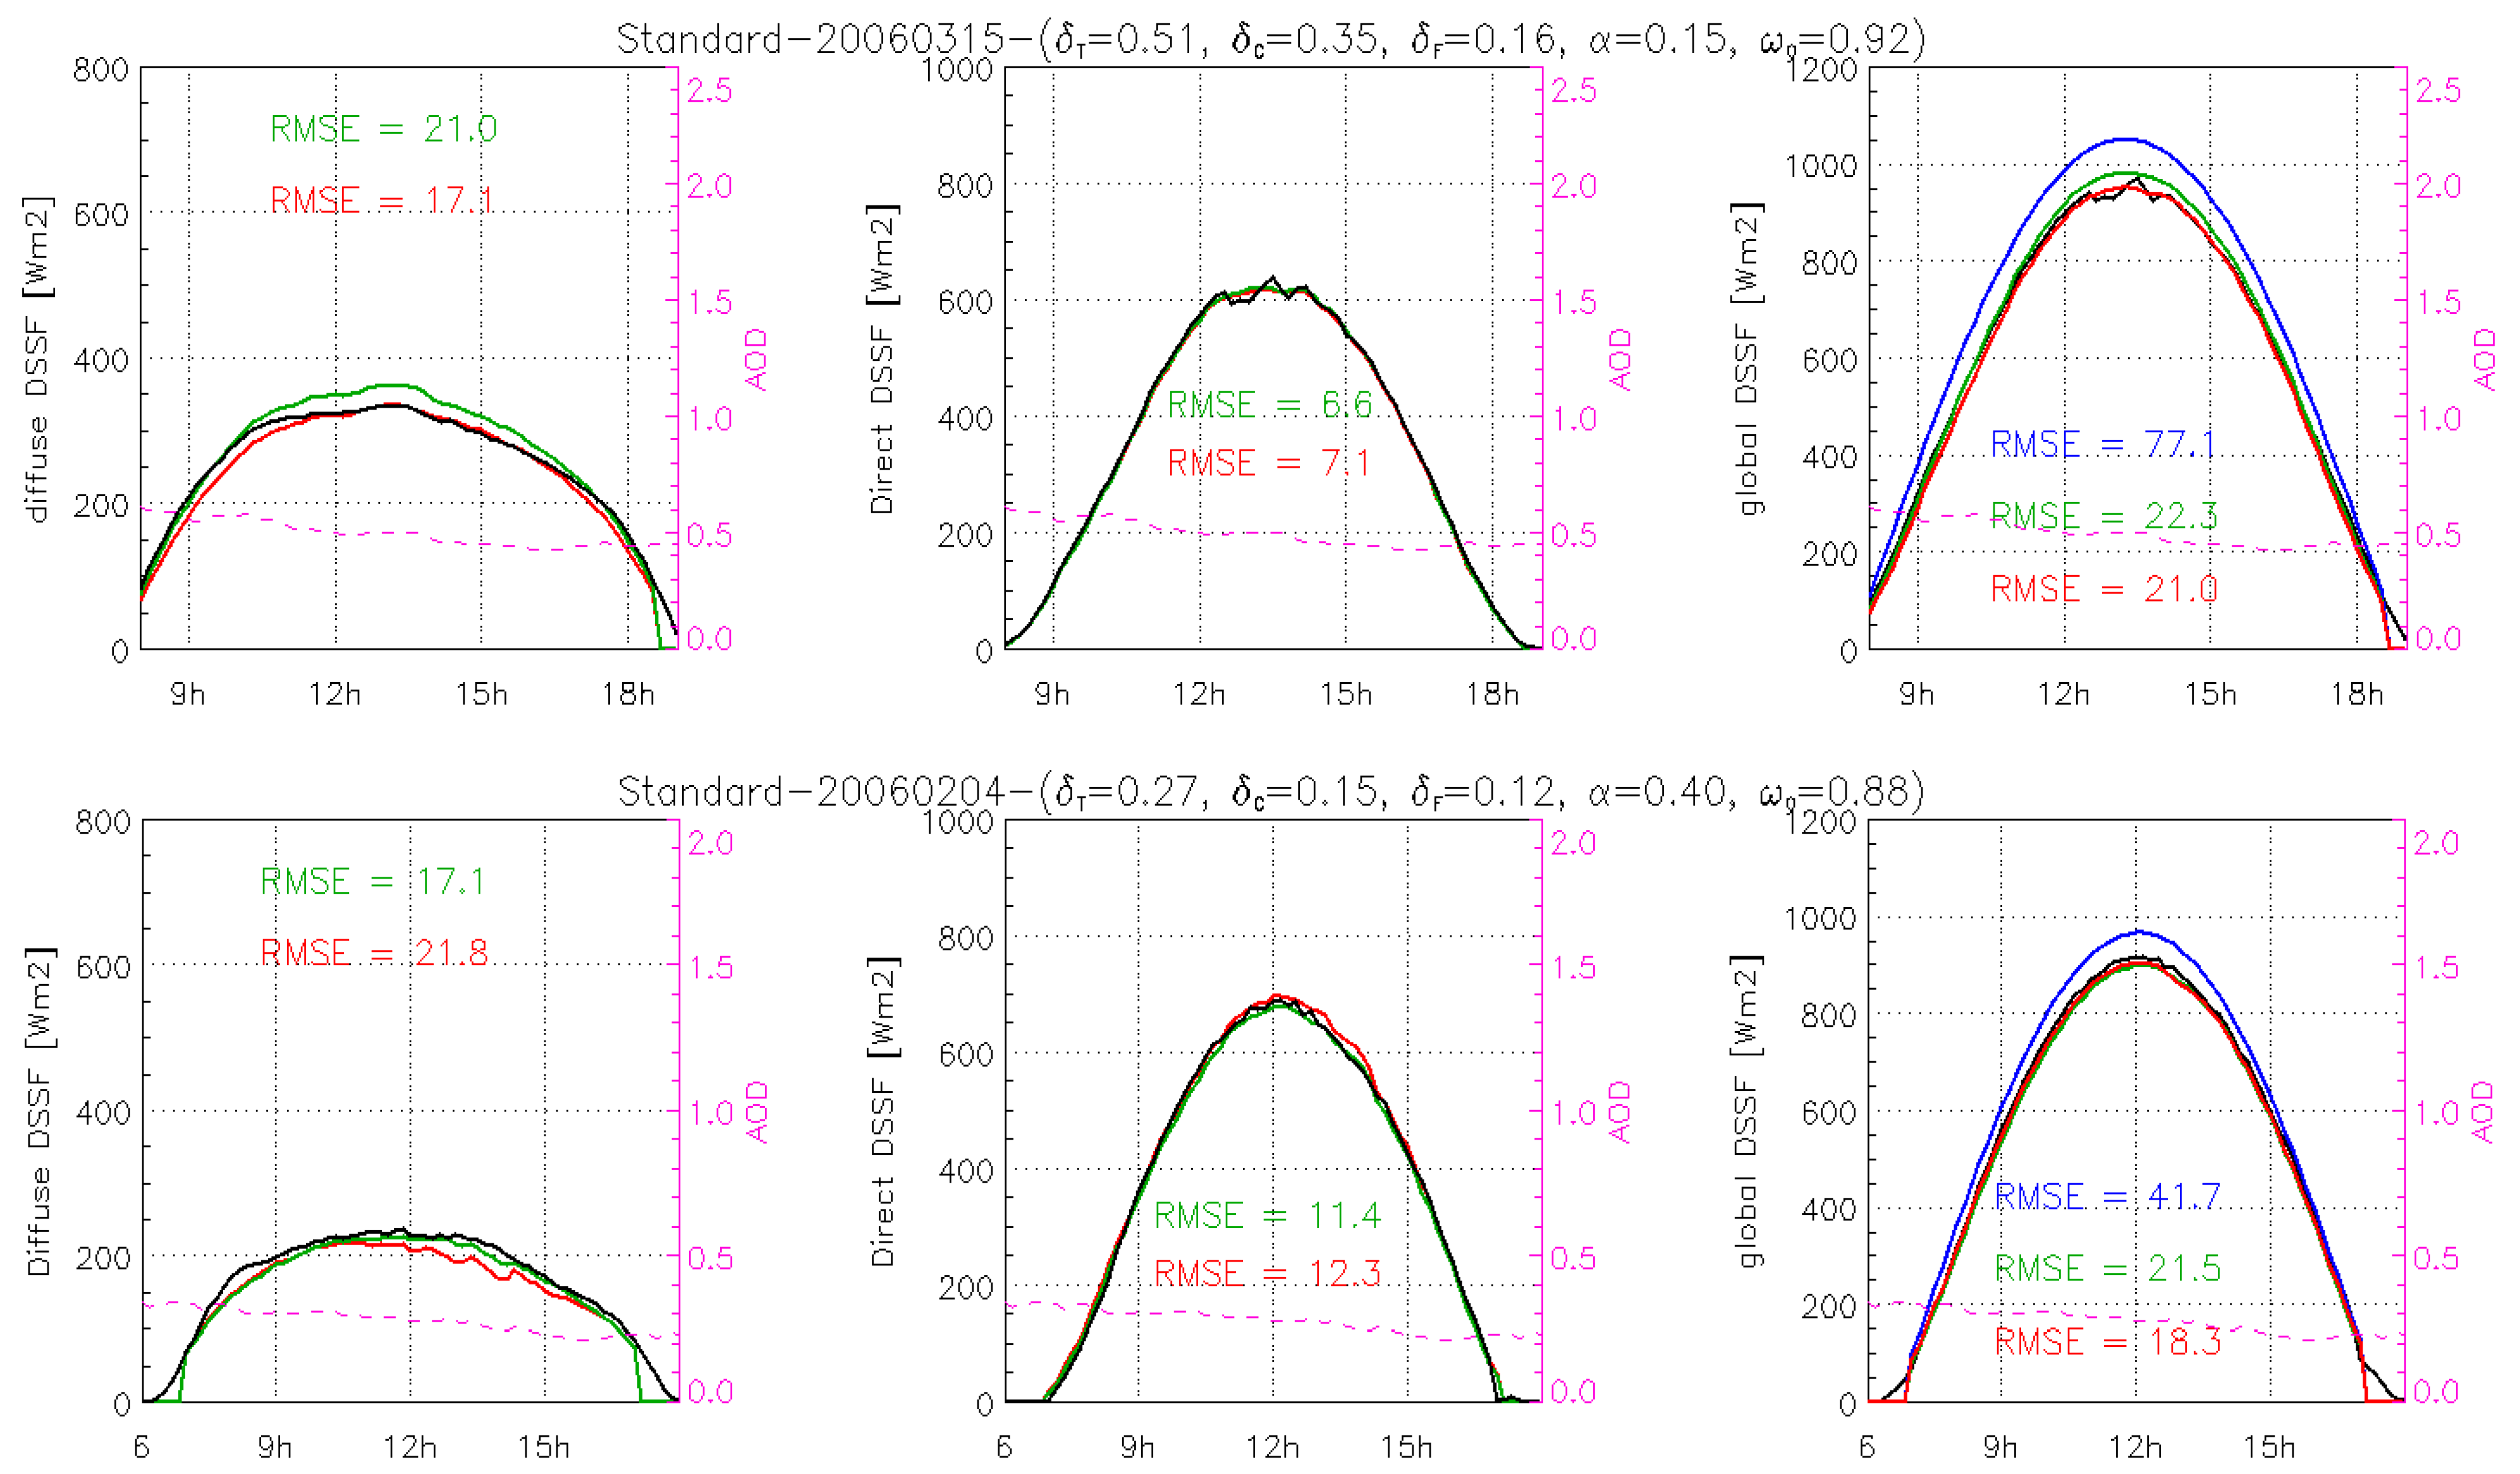
4.1.2. Standard Days
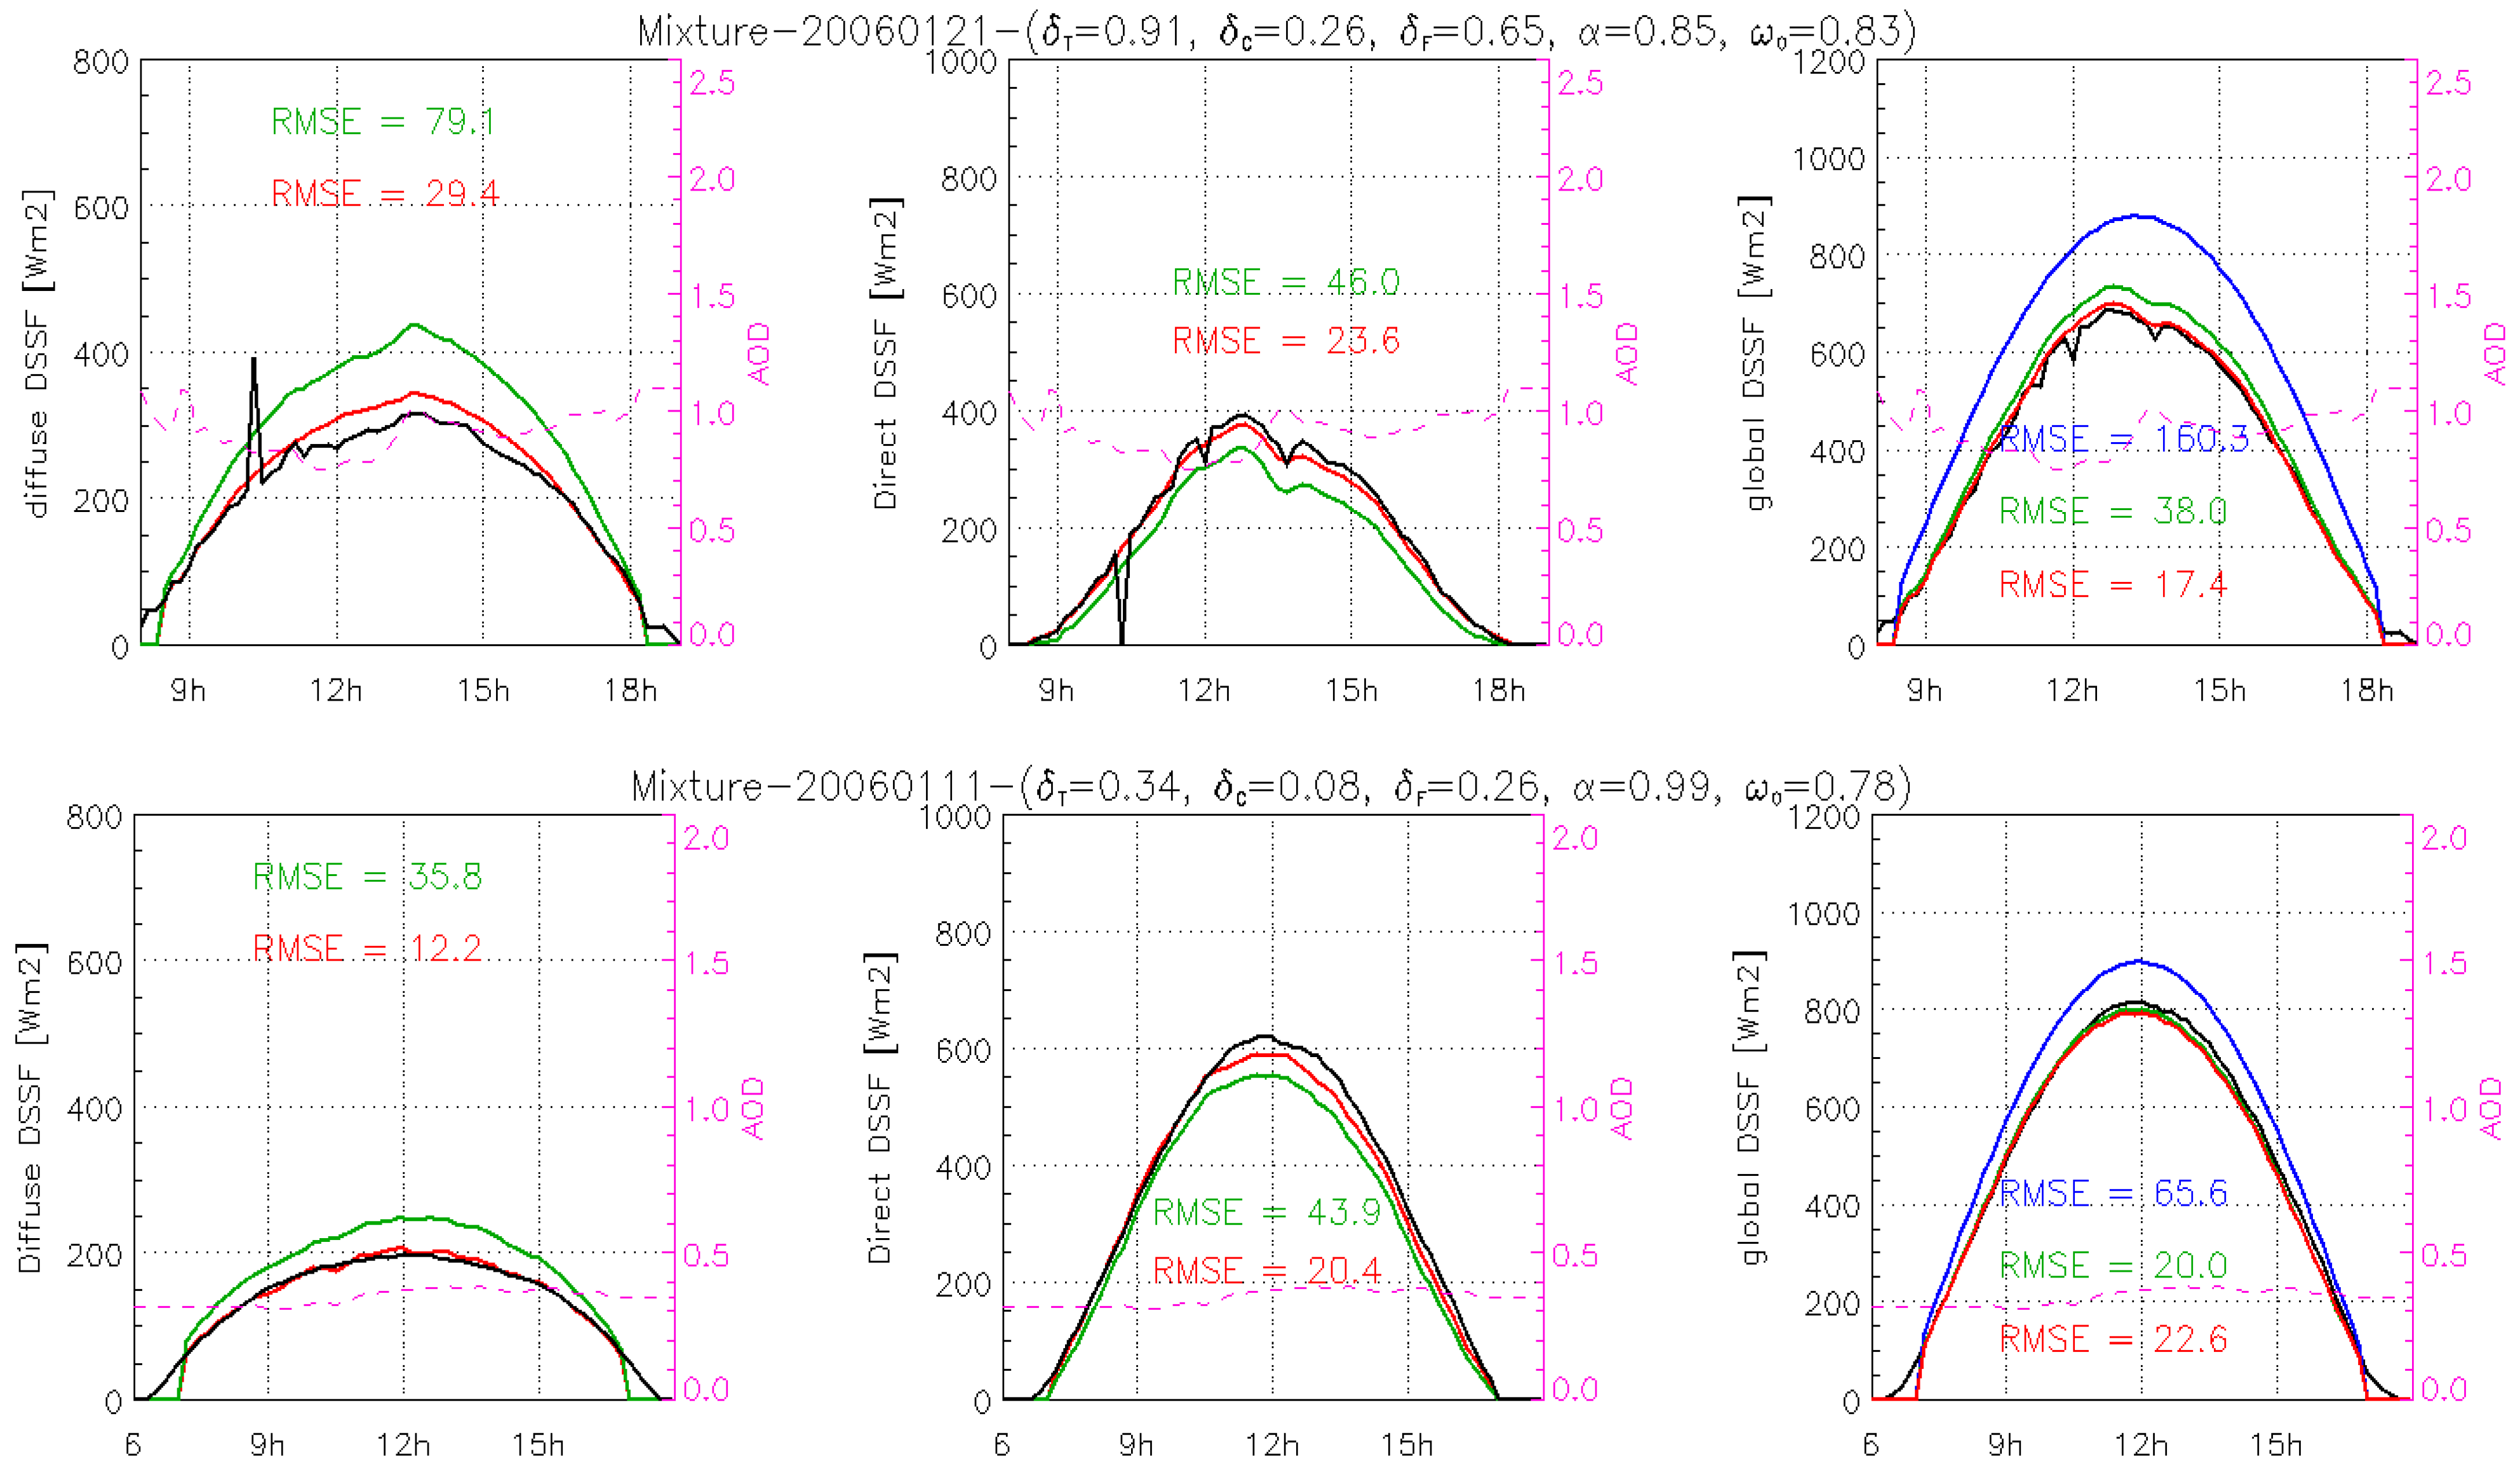
4.1.3. Mixture Days

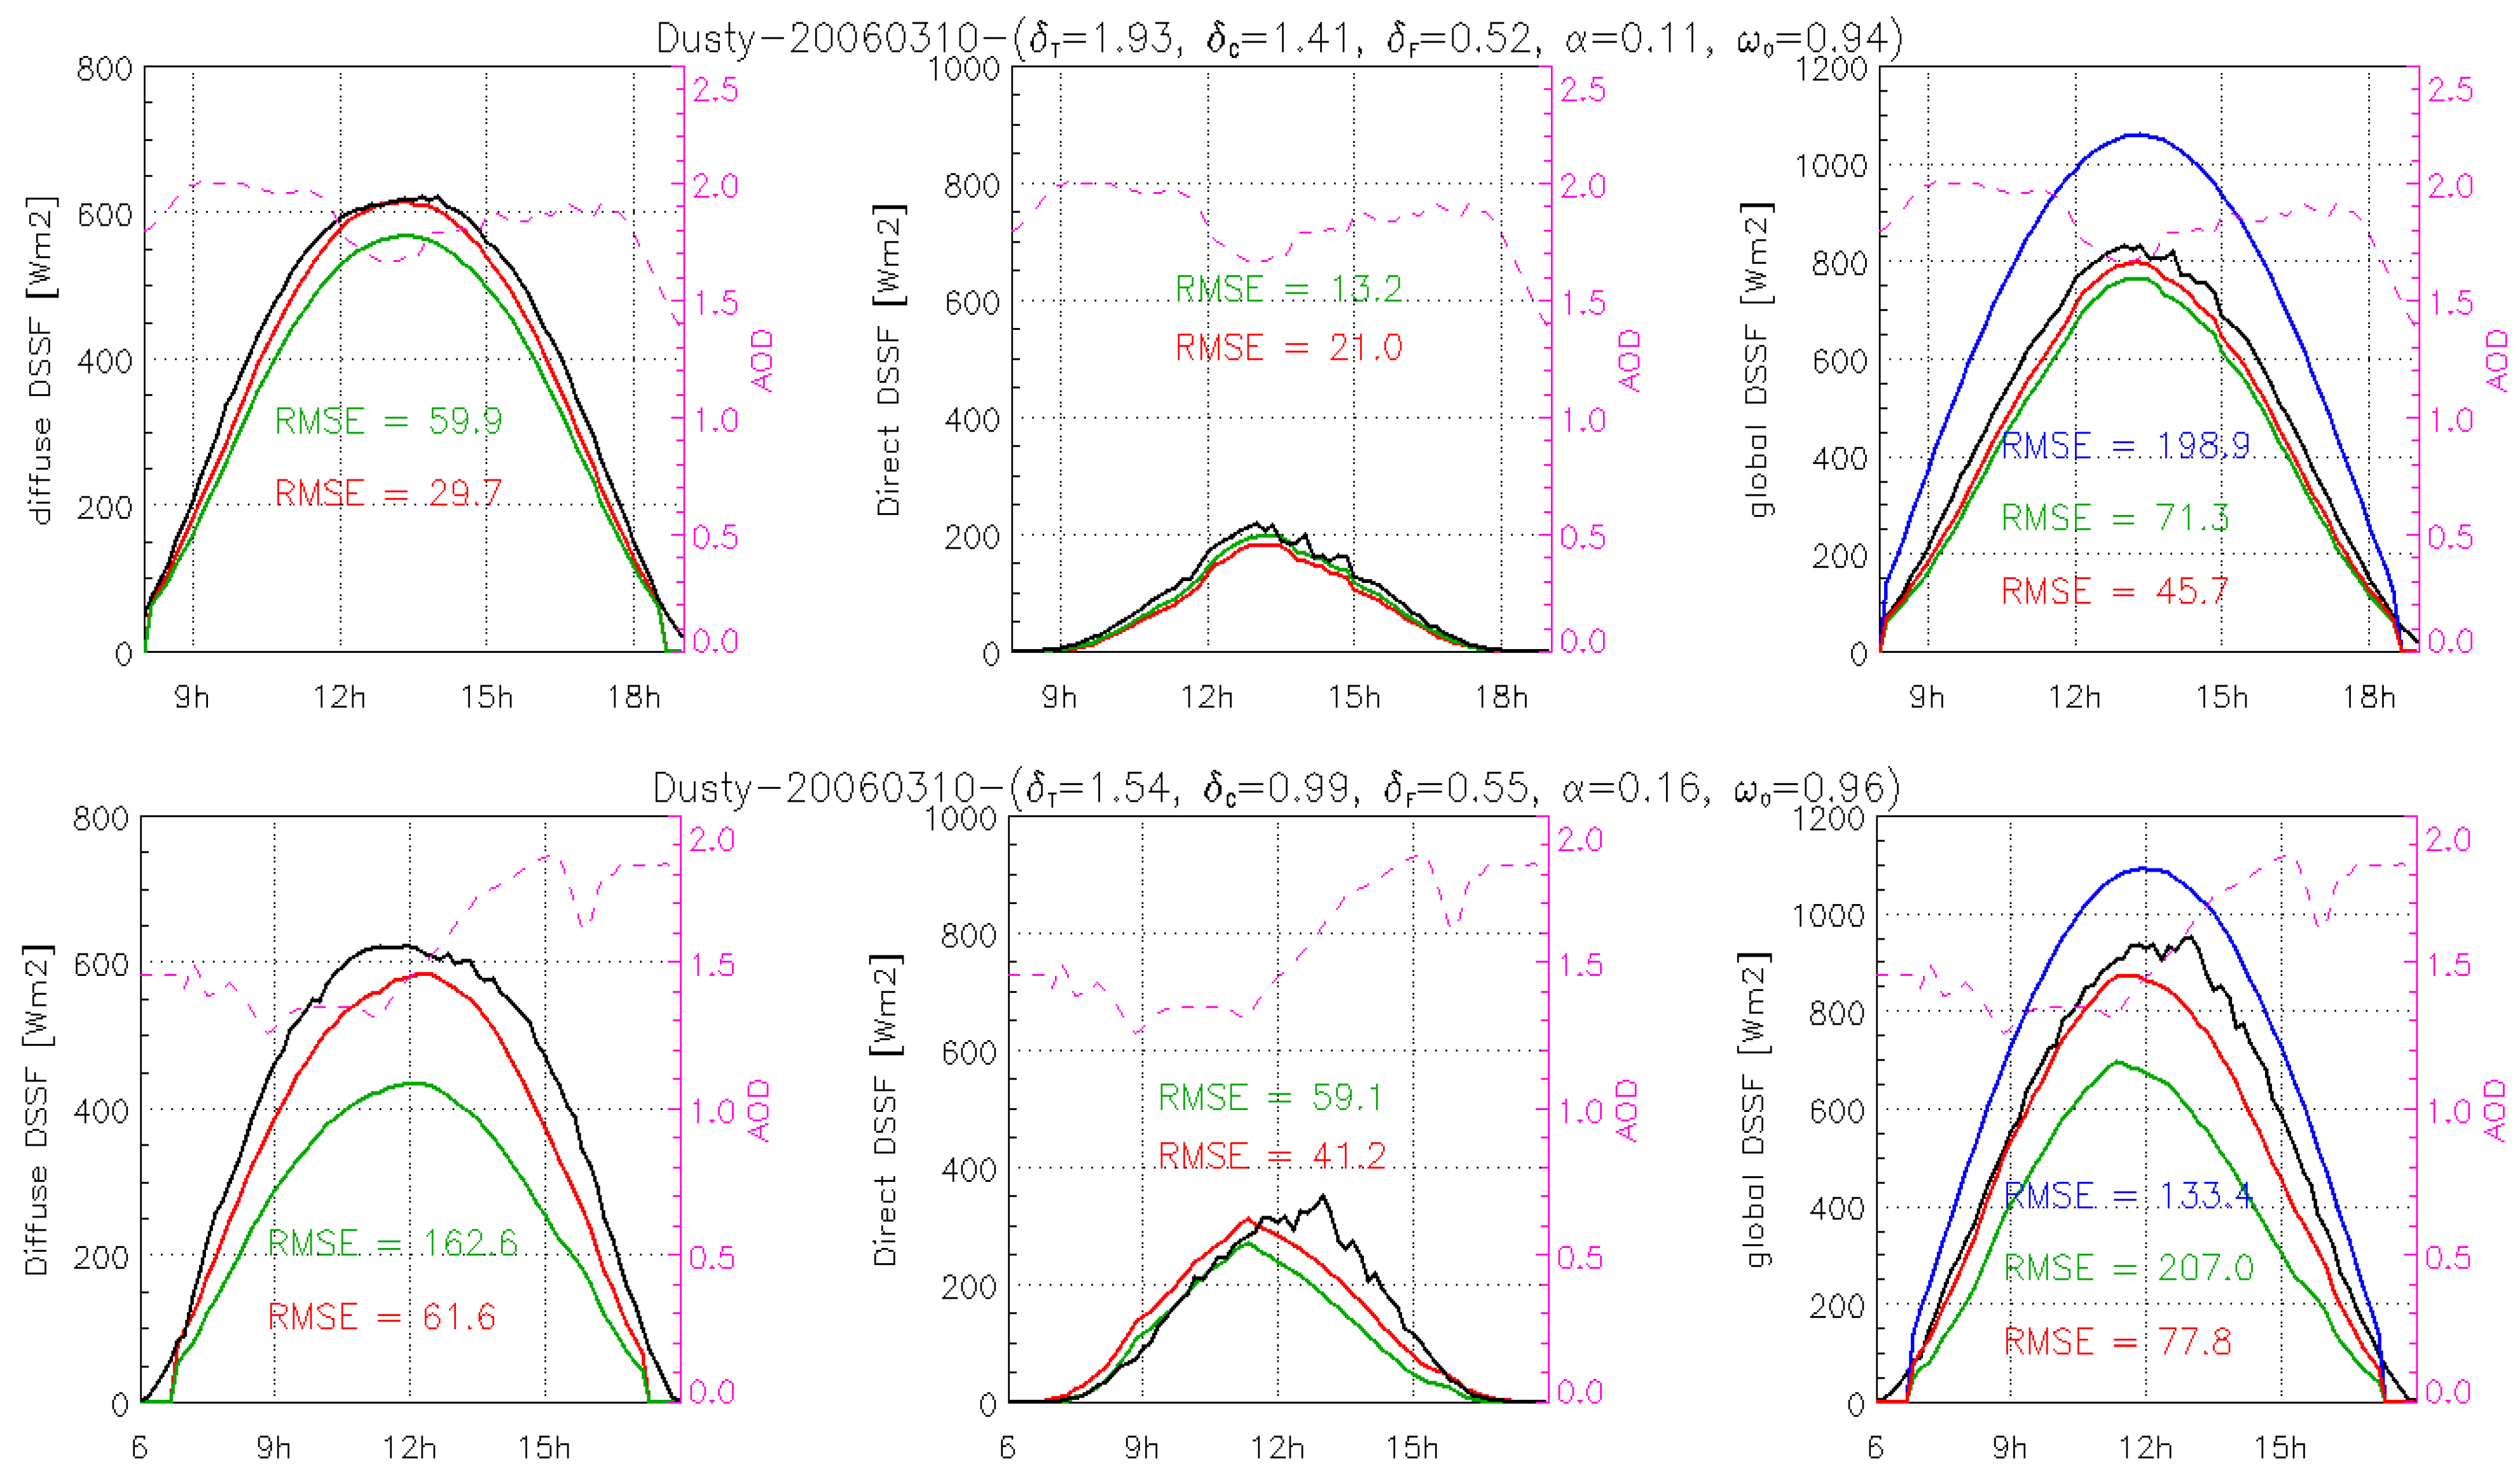
4.1.4. Dusty Days

4.2. Scores for All Selected Days
| DAKAR | ||||||
| Clean | Standard | Mixture | Dusty | All | ||
| Global DSSF | LSA-SAF | 24.9 | 83.8 | 92.1 | 170.2 | 92.7 |
| SIRAMix1 | 29.3 | 48.8 | 42.8 | 50.7 | 42.9 | |
| SIRAMix2 | 28.1 | 37.7 | 31.2 | 33.5 | 32.6 | |
| Direct DSSF | SIRAMix1 | 15.3 | 32.1 | 60.5 | 11.2 | 29.8 |
| SIRAMix2 | 17.5 | 31.2 | 53.2 | 20.6 | 30.6 | |
| Diffuse DSSF | SIRAMix1 | 22.1 | 36.87 | 79.6 | 45.3 | 45.9 |
| SIRAMix2 | 15.8 | 25.19 | 49.4 | 32.3 | 30.7 | |
| NIAMEY | ||||||
| Clean | Standard | Mixture | Dusty | All | ||
| Global DSSF | LSA-SAF | 29.6 | 37.8 | 73.2 | 94.9 | 58.9 |
| SIRAMix1 | 21.8 | 28.3 | 21.2 | 111.8 | 45.8 | |
| SIRAMix2 | 20.0 | 28.3 | 20.2 | 34.4 | 25.7 | |
| Direct DSSF | SIRAMix1 | 10.9 | 12.6 | 43.85 | 43.9 | 27.8 |
| SIRAMix2 | 15.1 | 13.7 | 21.2 | 38.4 | 22.1 | |
| Diffuse DSSF | SIRAMix1 | 16.91 | 22.77 | 29.86 | 131.94 | 50.37 |
| SIRAMix2 | 13.10 | 21.06 | 15.16 | 51.22 | 25.13 | |
5. Conclusions
Acknowledgments
Author Contributions
Conflicts of Interest
Appendix
References
- Marticorena, B.; Haywood, J.; Coe, H.; Formenti, P.; Liousse, C.; Mallet, M.; Pelon, J. Tropospheric aerosols over West Africa: Highlights from the AMMA international program. Atmos. Sci. Lett. 2011, 12, 19–23. [Google Scholar] [CrossRef]
- IPCC. Climate Change 2001: The Scientific Basis. Contribution of Working Group I to the Third Assessment Report of the Intergovernmental Panel on Climate Change. Houghton, J.T., Ding, Y., Griggs, D.J., Noguer, M., van der Linden, P.J., Dai, X., Maskell, K., Johnson, C.A., Eds.; Cambridge University Press: Cambridge, United Kingdom and New York, NY, USA; p. 881.
- Andreae, M.O.; Gelencser, A. Black carbon or brown carbon? The nature of light-absorbing carbonaceous aerosols. Atmos. Chem. Phys. 2006, 6, 3131–3148. [Google Scholar] [CrossRef]
- Derimian, Y.; Léon, J.-F.; Dubovik, O.; Chiapello, I.; Tanré, D.; Sinyuk, A.; Auriol, F.; Podvin, T.; Brogniez, G.; Holben, B.N. Radiative properties of aerosol mixture observed during the dry season 2006 over M’Bour, Senegal (African Monsoon Multidisciplinary Analysis campaign). J. Geophys. Res. 2008, 113, D00C09. [Google Scholar] [CrossRef]
- Dramé, M.; Bilal, B.O.; Camara, M.; Sambou, V.; Gaye, A. Impacts of aerosols on available solar energy at Mbour, Senegal. J. Renew. Sustain. Energy 2012, 4, 013105. [Google Scholar] [CrossRef]
- Liousse, C.; Penner, J.E.; Chuang, C.; Walton, J.J.; Eddleman, H.; Cachier, H. A global three-dimensional model study of carbonaceous aerosols. J. Geophys. Res. 1996, 101, 19411–19432. [Google Scholar] [CrossRef]
- D’Almeida, G.A. On the variability of desert aerosol radiative characteristics. J. Geophys. Res. 1997, 92, 3017–3026. [Google Scholar] [CrossRef]
- Dramé, M.; Jenkins, G.; Camara, M.; Robjhon, M. Observations and Simulation of a Saharan Air Layer Event with a Mid-Tropospheric Dust Layer at Dakar, Senegal, 6–7 July 2010. J. Geophys. Res. 2011, 116, D21204. [Google Scholar] [CrossRef]
- Trigo, I.F.; DaCamara, C.C.; Viterbo, P.; Roujean, J.L.; Olesen, F.; Barroso, C.; Camacho de Coca, F.; Carrer, D.; Freitas, S.C.; García-Haro, J.; et al. The Satellite Application Facility on Land Surface Analysis. Int. J. Remote Sens. 2011, 32, 2725. [Google Scholar] [CrossRef]
- Ramier, D.; Guichard, F.; Cappelaere, B.; Kergoat, L.; Galle, S.; Timouk, F.; Boulain, N.; Boucher, M.; Taylor, C.M.; Boone, A. Impact of the monsoon on downwelling surface radiative fluxes across West Africa: An evaluation of ECMWF-IFS and satellite estimates with ground measurements. In Proceedings of EGU General Assembly 2009, Vienna, Austria, 19–24 April 2009.
- Kocha, C.; Lafore, J.-P.; Tulet, P. High resolution simulation of a major West African dust storm: Comparison with observations and impact of dusts. Q. J. R. Meteorol. Soc. 2012, 138, 455–470. [Google Scholar] [CrossRef]
- Kocha, C.; Tulet, P.; Lafore, J.-P.; Flamant, C. The importance of the diurnal cycle of Aerosol Optical Depth in West Africa. Geophys. Res. Lett. 2013, 40, 785–790. [Google Scholar] [CrossRef]
- Redelsperger, J.-L.; Thorncroft, C.D.; Diedhiou, A.; Lebel, T.; Parker, D.J.; Polcher, J. African Monsoon Multidisciplinary Analysis: An International Research Project and Field Campaign. Bull. Am. Meteorol. Soc. 2006, 87, 1739–1746. [Google Scholar] [CrossRef]
- Ceamanos, X.; Carrer, D.; Roujean, J.-L. Improved retrieval of direct and diffuse downwelling surface shortwave flux in cloudless atmosphere using dynamic estimates of aerosol content and type: Application to the LSA-SAF project. Atmos. Chem. Phys. 2014, 14, 8209–8232. [Google Scholar] [CrossRef]
- Ceamanos, X.; Carrer, D.; Roujean, J.-L. An efficient approach to estimate the transmittance and reflectance of a mixture of aerosol components. Atmos. Res. 2014, 137, 125–135. [Google Scholar] [CrossRef]
- Morcrette, J.-J.; Boucher, O.; Jones, L.; Salmond, D.; Bechtold, P.; Beljaars, A.; Benedetti, A.; Bonet, A.; Kaiser, J.W.; Razinger, M.; et al. Aerosol analysis and forecast in the European Centre for Medium-Range Weather Forecasts Integrated Forecast System: Forward modeling. J. Geophys. Res. 2009, 114, D06206. [Google Scholar] [CrossRef]
- Chiapello, I.; Bergametti, G.; Gomes, L.; Chatenet, B.; Duac, F.; Pimenta, J.; Suares, E.S. An additional low layer transport of Sahelien and Saharan dust over the north-eastern tropical Atlantic. Geophys. Res. Lett. 1995, 22, 3191–3194. [Google Scholar] [CrossRef]
- Fomba, K.W.; Müller, K.; van Pinxteren, D.; Poulain, L.; van Pinxteren, M.; Herrmann, H. Long-term chemical characterization of tropical and marine aerosols at the CVAO: Field studies (2007 to 2011). Atmos. Chem. Phys. Discuss. 2014, 14, 3917–3971. [Google Scholar] [CrossRef]
- Heinold, B.; Tegen, I.; Schepanski, K.; Tesche, M.; Esselborn, M.; Freudenthaler, V.; Gross, S.; Kandler, K.; Knippertz, P.; Müller, D.; et al. Regional modelling of Saharan dust and biomass burning smoke—Part 1: Model description and evaluation. Tellus B 2011, 63, 781–799. [Google Scholar] [CrossRef] [Green Version]
- Müller, T.; Henzing, J.S.; de Leeuw, G.; Wiedensohler, A.; Alastuey, A.; Angelov, H.; Bizjak, M.; Collaud Coen, M.; Engström, J.E.; Gruening, C.; et al. Characterization and intercomparison of aerosol absorption photometers: Result of two intercomparison workshops. Atmos. Meas. Tech. 2011, 4, 245–268. [Google Scholar] [CrossRef]
- Holben, B.N.; Eck, T.F.; Slutsker, I.; Tanré, D.; Buis, J.P.; Setzer, A.; Vermote, E.; Reagan, J.A.; Kaufman, Y.J.; Nakajima, T. AERONET-A federated instrument network and data archive for aerosol characterization. Remote Sens. Environ. 1998, 66, 1–16. [Google Scholar] [CrossRef]
- Dubovik, O.; King, M.D. A flexible inversion algorithm for retrieval of aerosol optical properties from sun and sky radiance measurements. J. Geophys. Res. 2000, 105, 20673–20696. [Google Scholar] [CrossRef]
- Ackerman, P.; Stokes, G. The atmospheric Radiation Measurement Program. Phys. Today 2003, 56, 38–44. [Google Scholar] [CrossRef]
- Lebel, T.; Parker, D.J.; Flamant, C.; Bourles, B.; Marticorena, M.; Mougin, E.; Peugeot, C.; Diedhiou, A.; Haywood, J.M.; Ngamini, J. The AMMA field campaigns: Multiscale and multidisciplinary observations in the West African region. QJRMS 2009, 136, 8–33. [Google Scholar] [CrossRef]
- Milton, S.F.; Greed, G.; Brooks, M.E.; Haywood, J.; Johnson, B.; Allan, R.P.; Grey, W.M.F. Modelled and observed atmospheric radiation balance during West Africa dry season: Role of mineral dust, biomass burning aerosol; surface albedo. J. Geophys. Res. 2008, 113, D00C02. [Google Scholar] [CrossRef]
- Bouniol, D.; Couvreux, F.; Kamsu-Tamo, P.-H.; Leplay, M.; Guichard, F.; Favot, F.; O’Connor, E.J. Diurnal and Seasonal Cycles of Cloud Occurrences, Types, and Radiative Impact over West Africa. J. Appl. Meteorol. Climatol. 2012, 51, 534–553. [Google Scholar] [CrossRef]
- Ångström, A. The parameters of atmospheric turbidity. Tellus 1964, 16, 64–75. [Google Scholar] [CrossRef]
- Fouquart, Y.; Bonnel, B.; Roquai, M.C.; Santer, R.; Cerf, A. Observations of Saharan aerosols: Results of ECLATS field experiment: Optical thicknesses and aerosol size distribution. J. Clim. Appl. Meteorol. 1987, 26, 28–37. [Google Scholar] [CrossRef]
- Dubovik, O.; Holben, B.; Eck, T.F.; Smirnov, A.; Kaufman, Y.J.; King, M.D.; Tanré, D.; Slutsker, I. Variability of absorption and optical properties of key aerosol types observed in worldwide locations. J. Atmos. Sci. 2002, 59, 590–608. [Google Scholar] [CrossRef]
- Shettle, E.P.; Fenn, R.W. Models for the Aerosols of the Lower Atmosphere and the Effects of Humidity Variations of Their Optical Properties; AFGL-TR-790214; Air Force Geophysics Laboratory: Hanscom AFB, MA, USA, 1979. [Google Scholar]
- WMO. Radiation Commission of IAMAP Meeting of Experts on Aerosol and Their Climatic Effects; WCP55; World Meteorological Organization: Williamsburg, VA, USA, 1983; pp. 28–30. [Google Scholar]
- Koepke, P.; Hess, M.; Schult, I.; Shettle, E.P. Global Aerosol Data Set; Report No. 243; Max-Planck-Institut für Meteorologie: Hamburg, Germany, 1997; p. 44. [Google Scholar]
- Hess, M.; Koepke, P.; Schult, I. Optical Properties of Aerosols and Clouds: The Software Package OPAC. Bull. Am. Meteorol. Soc. 1998, 79, 831–844. [Google Scholar] [CrossRef]
- Tanré, D.; Kaufman, Y.J.; Holben, B.N.; Chatenet, B.; Karnieli, A.; Lavenu, F.; Blarel, L.; Dubovik, O.; Remer, L.A.; Smirnov, A. Climatology of dust aerosol size distribution and optical properties derived from remotely sensed data in the solar spectrum. J. Geophys. Res. 2001, 106, 18205–18217. [Google Scholar] [CrossRef]
- Kim, J.; Gu, Y.; Liou, K.N. The Impact of Direct Aerosol Radiative Forcing on Surface Insolation and Spring Snowmelt in the Southern Sierra Nevada. J. Hydrometeorol. 2006, 7, 976–983. [Google Scholar] [CrossRef]
- Mayer, B.; Kylling, A. Technical note: The LibRadtran software package for radiative transfer calculations—Description and examples of use. Atmos. Chem. Phys. 2005, 5, 1855–1877. [Google Scholar] [CrossRef]
- Kaufman, Y.J.; Tanré, D.; Dubovik, O.; Karnieli, A.; Remer, L.A. Absorption of sunlight by dust as inferred from satellite and ground-based remote sensing. Geophys. Res. Lett. 2001, 28, 1479–1482. [Google Scholar] [CrossRef]
- Colarco, P.R.; Toon, O.B.; Torres, O.; Rasch, P.J. Determining the UV imaginary part of refractive index of Saharan dust particles from TOMS data and a three dimensional model of dust transport. J. Geophys. Res. 2002, 107, 4289. [Google Scholar] [CrossRef]
- Haywood, J.M.; Allan, R.P.; Culverwell, I.; Slingo, A.; Milton, S.; Edwards, J.; Clerbaux, N. Can desert dust explain the outgoing longwave radiation anomaly over the Sahara during July 2003? J. Geophys. Res. 2005, 110, D05105. [Google Scholar] [CrossRef]
- Petzold, A.; Rasp, K.; Weinzierl, B.; Esselborn, M.; Hamburger, T.; Durnbrack, A.; Kandler, K.; Schutz, L.; Knippertz, P.; Fiebig, M.; Virkkula, A. Saharan dust refractive index and optical properties from aircraft-based observations during SAMUM 2006. Tellus B 2009, 61, 118–130. [Google Scholar] [CrossRef]
- McConnell, C.L.; Formenti, P.; Highwood, E.J.; Harrison, M.A.J. Using aircraft measurements to determine the refractive index of Saharan dust during the DODO Experiments. Atmos. Chem. Phys. 2010, 10, 3081–3098. [Google Scholar] [CrossRef]
- Ackerman, P.; Toon, O.B. Absorption of visible radiation in atmosphere containing mixtures of absorbing and nonabsorbing particles. Appl. Opt. 1981, 20, 3661–3668. [Google Scholar] [CrossRef] [PubMed]
- Martins, J.V.; Artaxo, P.; Liousse, C.; Reid, J.S.; Hobbs, P.V.; Kaufman, Y.J. Effects of black carbon content, particle size, and mixing on light absorption by aerosol from biomass burning in Brazil. J. Geophys. Res. 1998, 103, 32041–32050. [Google Scholar] [CrossRef]
- Geiger, B.; Meurey, C.; Lajas, D.; Franchistéguy, L.; Carrer, D.; Roujean, J.-L. Near real-time provision of downwelling short-wave radiation estimates derived from satellite observations. Meteorol. Appl. 2008, 15, 411–420. [Google Scholar] [CrossRef]
- Remer, L.A.; Kaufman, Y.J. Dynamic aerosol model: Urban/industrial aerosol. J. Geophys. Res. 1998, 103, 13859–13871. [Google Scholar] [CrossRef]
- Ginoux, P. Effects of nonsphericity on mineral dust modeling. J. Geophys. Res. 2003, 108, 4052. [Google Scholar] [CrossRef]
- Geiger, B.; Carrer, D.; Franchistéguy, L.; Roujean, J.L.; Meurey, C. Land surface albedo derived on a daily basis from Meteosat Second Generation observations. IEEE Trans. Geosci. Remote. Sens. 2008, 46, 3841–3856. [Google Scholar] [CrossRef]
- Draxler, R.R.; et Hess, G.D. An overview of the HYSPLIT-4 modelling system for trajectories, dispersion and deposition. Aust. Meteorol. Mag. 1998, 47, 295–308. [Google Scholar]
- Léon, J.F.; Derimian, Y.; Chiapello, I.; Tanré, D.; Podvin, T.; Chatenet, B.; Diallo, A.; Deroo, C. Aerosol vertical distribution and optical properties over Mbour (16.96°W, 14.39°N), Senegal from 2000 to 2008. Atmos. Chem. Phys. 2009, 9, 9249–9261. [Google Scholar] [CrossRef]
- Semou, N. Etude de la Variabilité des Flux D’humidité sur Dakar en Période Pré-Installation de la Mousson. Master’s Thesis, École Supérieure Polytechnique, Université Cheikh Anta Diop de Dakar, Dakar Sénégal, 2012; p. 50. [Google Scholar]
- Xu, H.; Ceamanos, X.; Roujean, J.-L.; Carrer, D.; Xue, Y. Can satellite-derived aerosol optical depth quantify the surface aerosol radiative forcing? Atmos. Res. 2014, 150, 151–167. [Google Scholar] [CrossRef]
- Patterson, E.M.; Gillete, D.A.; Stockton, B.H. Complex index of refraction between 300 and 700 nm for Saharan aerosol. J. Geophys. Res. 1977, 82, 3153–3160. [Google Scholar] [CrossRef]
- Haywood, J.M.; Francis, P.N.; Geogdzhayev, I.; Mishchenko, M.; Frey, R. Comparison of Saharan dust aerosol optical depth retrieved using aircraft mounted pyranometers and 2-channel AVHRR algorithms. Geophys. Res. Lett. 2001, 28, 2393–2396. [Google Scholar] [CrossRef]
- Fouquart, Y.; Brogniez, C.; Buriez, L.; Smith, L.; Morcrette, J.J. Observations of Saharan aerosols: Results of ECLATS Field experiment. Part II: Broadband radiative characteristics of the aerosols and vertical radiative flux divergence. J. Clim. Appl. Meteorol. 1987, 26, 38–52. [Google Scholar] [CrossRef]
- Otterman, J.; Fraser, R.S.; Bahethi, O.P. Characterization of tropospheric desert aerosols at solar wavelengths by multispectral radiometry from Landsat. J. Geophys. Res. 1982, 87, 1270–1278. [Google Scholar] [CrossRef]
- Claquin, T.; Schulz, M.; Balkanski, Y.; Boucher, O. Uncertainties in assessing radiative forcing by mineral dust. Tellus 1998, 50, 491–505. [Google Scholar] [CrossRef]
- Sokolik, I.N.; Toon, O.B. Incorporation of mineralogical composition into models of the radiative properties of mineral aerosol from UV to IR wavelengths. J. Geophys. Res. 1999, 104, 9423–9444. [Google Scholar] [CrossRef]
- Remer, L.A.; Kaufman, Y.J.; Tanré, D.; Mattoo, S.; Chu, D.A.; Martins, J.V.; Li, R.-R.; Ichoku, C.; Levy, R.C.; Kleidman, R.G.; et al. The MODIS aerosol algorithm, products, and validation. J. Atmos. Sci. 2005, 62, 947–973. [Google Scholar] [CrossRef]
- Carrer, D.; Ceamanos, X.; Six, B.; Roujean, J.-L. AERUS-GEO: A newly available satellite-derived aerosol optical depth product over Europe and Africa. Geophys. Res. Lett. 2014, 41. [Google Scholar] [CrossRef]
© 2015 by the authors; licensee MDPI, Basel, Switzerland. This article is an open access article distributed under the terms and conditions of the Creative Commons Attribution license (http://creativecommons.org/licenses/by/4.0/).
Share and Cite
Drame, M.S.; Ceamanos, X.; Roujean, J.L.; Boone, A.; Lafore, J.P.; Carrer, D.; Geoffroy, O. On the Importance of Aerosol Composition for Estimating Incoming Solar Radiation: Focus on the Western African Stations of Dakar and Niamey during the Dry Season. Atmosphere 2015, 6, 1608-1632. https://doi.org/10.3390/atmos6111608
Drame MS, Ceamanos X, Roujean JL, Boone A, Lafore JP, Carrer D, Geoffroy O. On the Importance of Aerosol Composition for Estimating Incoming Solar Radiation: Focus on the Western African Stations of Dakar and Niamey during the Dry Season. Atmosphere. 2015; 6(11):1608-1632. https://doi.org/10.3390/atmos6111608
Chicago/Turabian StyleDrame, Mamadou Simina, Xavier Ceamanos, Jean Louis Roujean, Aaron Boone, Jean Philippe Lafore, Dominique Carrer, and Olivier Geoffroy. 2015. "On the Importance of Aerosol Composition for Estimating Incoming Solar Radiation: Focus on the Western African Stations of Dakar and Niamey during the Dry Season" Atmosphere 6, no. 11: 1608-1632. https://doi.org/10.3390/atmos6111608
APA StyleDrame, M. S., Ceamanos, X., Roujean, J. L., Boone, A., Lafore, J. P., Carrer, D., & Geoffroy, O. (2015). On the Importance of Aerosol Composition for Estimating Incoming Solar Radiation: Focus on the Western African Stations of Dakar and Niamey during the Dry Season. Atmosphere, 6(11), 1608-1632. https://doi.org/10.3390/atmos6111608