Abstract
Satellite measurements of the spatiotemporal distributions of atmospheric CO2 concentrations are a key component for better understanding global carbon cycle characteristics. Currently, several satellite instruments such as the Greenhouse gases Observing SATellite (GOSAT), SCanning Imaging Absorption Spectrometer for Atmospheric CHartographY (SCIAMACHY), and Orbiting Carbon Observatory-2 can be used to measure CO2 column-averaged dry air mole fractions. However, because of cloud effects, a single satellite can only provide limited CO2 data, resulting in significant uncertainty in the characterization of the spatiotemporal distribution of atmospheric CO2 concentrations. In this study, a new physical data fusion technique is proposed to combine the GOSAT and SCIAMACHY measurements. On the basis of the fused dataset, a gap-filling method developed by modeling the spatial correlation structures of CO2 concentrations is presented with the goal of generating global land CO2 distribution maps with high spatiotemporal resolution. The results show that, compared with the single satellite dataset (i.e., GOSAT or SCIAMACHY), the global spatial coverage of the fused dataset is significantly increased (reaching up to approximately 20%), and the temporal resolution is improved by two or three times. The spatial coverage and monthly variations of the generated global CO2 distributions are also investigated. Comparisons with ground-based Total Carbon Column Observing Network (TCCON) measurements reveal that CO2 distributions based on the gap-filling method show good agreement with TCCON records despite some biases. These results demonstrate that the fused dataset as well as the gap-filling method are rather effective to generate global CO2 distribution with high accuracies and high spatiotemporal resolution.
1. Introduction
Atmospheric carbon dioxide (CO2) is the most important anthropogenic greenhouse gas, and since the industrial revolution, the CO2 concentration in the Earth’s atmosphere has increased significantly from 280 to 379 ppm in 2005 [1]. Currently, global warming caused by atmospheric CO2 has attracted the attention of scientists around the world. Predicting and mitigating climate change due to increased CO2 depends on the accurate quantification of distribution and variability for CO2 sources and sinks, which have been derived from atmospheric CO2 concentration measurements by using inverse modeling [2,3,4]. For this purpose, globally distributed measurements of atmospheric CO2 concentrations with high accuracy and precision as well as high measurement density are required. In fact, the utility of CO2 concentrations has been demonstrated in most carbon cycle-related studies. For example, Rayner and O’Brien [5] demonstrated that global column-averaged CO2 concentrations (precision ≤1%) can help to reduce the uncertainties in regional CO2 source and sink estimates. Alkhaled et al. [3] indicated that using atmospheric CO2 concentration data has the potential to improve the scientific understanding of regional carbon cycle processes and budgets.
Existing ground-based CO2 monitoring networks provide accurate measurements of atmospheric CO2 concentration. However, these CO2 measurements are very sparse to understand and capture the global distribution of carbon sources and sinks [3,6]. Effectively grasping the global CO2 distribution with high spatiotemporal resolution has been a long-standing problem. Satellites provide the potential to derive CO2 column-averaged dry air mole fractions (XCO2) accurately with high spatiotemporal resolutions on global scale. To date, the Orbiting Carbon Observatory-2 (OCO-2) [7], the Greenhouse gases Observing SATellite (GOSAT) [8], and the SCanning Imaging Absorption Spectrometer for Atmospheric CHartographY (SCIAMACHY) [9] are the only three satellite instruments that can retrieve XCO2 with significant sensitivity in the boundary layer [10].
Although these satellites have been used to measure global XCO2 concentrations, because of cloud contamination and limitations due to the instrument observation modes (e.g., GOSAT observes in lattice points), the available data points for retrieved XCO2 from any single satellite are very limited [3,11].
For instance, Morino et al. [12] showed that only approximately 10% of the GOSAT data can be used for the retrieval of XCO2 because of cloud contamination. The limited satellite observations restrict the generation of level 3 (L3) XCO2 maps with high spatiotemporal resolution when only a single satellite-based XCO2 dataset is considered. Considering the weakness of single satellites, Wang et al. [13] proposed a physical fusing algorithm to generate a continuous spatiotemporal CO2 dataset. However, in certain regions, even after combining GOSAT with SCIAMACHY retrievals at time scales of up to a few months, some gaps remain, thereby influencing the analysis of global and regional spatiotemporal characteristics of XCO2 concentrations. Fortunately, researchers have recently suggested gap-filling methods based on the Kriging method to generate full-coverage global maps (L3 data products) using single satellite products. For example, Hammerling et al. [6,14] adopted a statistical mapping approach to create full-coverage maps (L3 data products) from GOSAT XCO2 observations. The National Institute for Environmental Studies (NIES) GOSAT Project generates GOSAT L3 data products by interpolating and extrapolating the GOSAT level 2 (L2) XCO2 products using ordinary Kriging [15]. Liu et al. [16] and Tomasada et al. [17] also exploited methods to produce the spatial distribution of CO2 concentrations. Creating L3 data products is one way to obtain new carbon cycle information [6]. Hammerling et al. [6] indicated that these L3 XCO2 products are not intended for direct use in inversion studies but can be used to make direct and independent comparisons with existing carbon flux and atmospheric transport models. Such comparison studies could be used to verify and track reported CO2 emissions [6].
Nevertheless, the fact is that these single satellite-based strategies could not ensure sufficient data for stable semivariogram estimation during Kriging interpolation because the number of valid data points is limited for a single satellite [13,18], which may cause large uncertainties. Rather than using L2 XCO2 from a single dataset (e.g., GOSAT), as performed in existing literature, fusing available CO2 measurements derived from various space-based data would facilitate the generation of highly reliable full coverage (L3) maps with high spatiotemporal resolution. Wang et al. [13] proved that the spatial coverage of the fused data is wider than that of a single satellite. Thus, using fused data to generate a global land full-coverage map of XCO2 distribution based on the Kriging approach is a better choice.
The overall objective of this study is to develop a global land gap-filling method and generate a CO2 L3 map with high spatiotemporal resolution by using the new combined CO2 dataset within 1° × 1° grids. The remainder of this paper is as follows. Section 2 describes the data used in this study. Section 3 introduces the fused algorithm and gap-filling methods based on ordinary Kriging. The results of the spatial variability analysis are presented in Section 4. In this section, comparison between single dataset-based prediction and that of fused-dataset-based prediction as well as the interpolated predictions versus ground-based measurements are investigated. Our conclusions are presented in Section 5.
2. Data
GOSAT was successfully launched on 23 January 2009 [19]. It is the first space-based sensor designed to measure CO2 and CH4 accurately with improved sensitivity and spatial resolution [8,20]. GOSAT’s onboard instrument, i.e., the Thermal And Near infrared Sensor for carbon Observation (TANSO), has two sensors: a Fourier Transform Spectrometer (FTS) and a Cloud and Aerosol Imager (CAI) [19]. TANSO-FTS mainly observes sunlight reflected from the Earth’s surface and light emitted from the atmosphere and the surface, and measures the amounts of greenhouse gases [19,20]. It has three narrow bands in the short-wave infrared region (i.e., 0.76, 1.6, and 2.0 µm) and a wide thermal infrared band (i.e., 5.5–14.3 µm) with spectral and spatial resolutions of 0.2 cm−1 and 10.5 km, respectively [20]. TANSO-CAI monitors the clouds and aerosols within the TANSO-FTS’s field of view [20]. Currently, five different CO2 retrieval algorithms are released from GOSAT. These are ACOS [21], NIES v02.xx [22], NIES PPDF-D [23], UOL FP [24], and RemoteC [25].
SCIAMACHY is a spectrometer that measures reflected, scattered, and transmitted solar radiation in the spectral region of 214–2380 nm at moderate spectral resolution [26,27]. It was onboard the Environmental Satellite (ENVISAT) [28]; however, contact with ENVISAT was lost in April 2012 [29]. The primary objective of SCIAMACHY was to monitor trace gases in the troposphere and stratosphere.
NASA’s OCO-2 launched in July 2014 will soon be providing approximately 100,000 high-quality daily measurements of CO2 concentrations from around the globe [7]. Currently, no XCO2 data is publicly available from OCO-2.
In this study, version 2.9 of the GOSAT Atmospheric CO2 Observations from Space (ACOS) XCO2 L2 data and version v02.00.08 of the SCIAMACHY Bremen optimal estimation (BESD) L2 data [30] are employed. ACOS v2.9 rather than ACOS v3.3 is used because ACOS v3.3 is still being evaluated and some deficiencies exist in this version [31]. BESD v02.00.08 is the newest algorithm and latest version from IUP Bremen. The fused data used in our study are obtained by combining the XCO2 retrievals of ACOS with those of BESD. The detailed fusing algorithm is described in the following section.
In addition, CO2 data of Carbon Tracker (CT), which is a data assimilation system built by the National Oceanic and Atmospheric Administration’s Earth System Research Laboratory, USA [32], are taken as a reference profile in the fusing algorithm. The Total Carbon Column Observing Network (TCCON, http://tccon.ipac.caltech.edu/) XCO2 data, which are ground-based Fourier transform spectrometer measurements [33], are used for comparison with the interpolated results. In this study, Lamont (USA, 36.60°N, 97.49°W), Park Falls (USA, 45.94°N, 90.27°W), and Garmisch (Germany, 47.48°N, 11.06°E) sites located in the Northern Hemisphere, and Wollongong (Australia, 34.41°S, 150.88°E) site located in the Southern Hemisphere, are used.
3. Method
3.1. Fusing CO2 Measurements from GOSAT and SCIAMACHY
Considering the current availability of multiple XCO2 datasets from space, combining these measurements is a promising way to obtain more data points within a certain time compared with any single satellite-based dataset. Both GOSAT and SCIAMACHY can provide XCO2 information, and we can consider combining these two XCO2 datasets to generate a new dataset at high spatiotemporal resolution. However, these two datasets cannot be combined directly because of differences in sampling methods, overpass times, averaging kernels, and the a priori CO2 profile involved during retrievals [34]. Therefore, a necessary adjustment is performed to adjust the two observations for a common a priori profile (i.e., the newly generated fused profile). Wang et al. [13] employed the CT CO2 profiles (2° × 3°) to assist data fusion. They indicated that a priori CO2 profile of both the ACOS and BESD are first interpolated or extrapolated to the level of the CT CO2 profile according to their pressure layers. After interpolation, the a priori CO2 profiles for both ACOS and BESD have the same dimension as the CT profile. Then equation (1) can be used to adjust these two XCO2 data to a unified level. In this study, a new CO2 profile database with 1° × 1° resolution is used by integrating the CO2 profiles of CT, ACOS, BESD, and NIES v02.xx products. Thus, the adjustment equation can be expressed as follows [13]:
In the above equation, XCO2_adj refers to the adjusted XCO2 for ACOS or BESD, XCO2_ret is the retrieved XCO2 of ACOS or BESD, h denotes a pressure weighting function, a is the column averaging kernel of ACOS or BESD, I is an identity matrix, and XCT and Xa are the newly generated fused CO2 profile and the corresponding a priori CO2 profile for ACOS or BESD, respectively; Here, the unit of XCO2_adj, XCO2_ret, and CO2 profile is ppm.
In view of different spatial samplings, to account for retrieval uncertainties, the XCO2 data with fine spatial scale are aggregated to a new value according to the uncertainty weight of individual XCO2 retrievals to suit the relatively coarse scale during fusion [11]. The detailed “aggregated” method can be found in [13]. In addition, the time difference between these two datasets is also considered by interpolating the newly generated fused profile (1° × 1°) data at a reference time (taking BESD overpass time as a reference).
On the basis of the steps described above, the globe is divided into numerous 1° × 1° latitude/longitude grid boxes (180 × 360 in total). For each grid, all CO2 observations located within that grid are averaged as the fused value weighted by the individual XCO2 retrieval accuracy.
3.2. Gap-Filling Method for the Fused Data
In this study, a gap-filling method based on the ordinary Kriging [6,15] technique is applied to map global land full-coverage XCO2 distribution by using fused ACOS and BESD data. This gap-filling method employs the spatial correlation of CO2 observations between different locations. The spatial correlation structure of the CO2 observations is derived using a semivariogram. Then, the derived spatial correlation structure and CO2 observations are used to estimate XCO2 values. The XCO2 values are predicted within global 1° × 1° grids. The detailed process is described in the following.
First, abnormal XCO2 data points should be screened as they may have significant impact on the interpolation results when no other nearby data point exists [15]. In this study, skewness and kurtosis is calculated to filter these extreme values that make the L2 data distribution differ from normal distribution. Our threshold number for skewness is 0.01 and that for kurtosis is 5. By using these two measures, the screening process is performed, and the detailed screening process is similar to that adopted by the NIES GOSAT Project [15].
Second, calculating and analyzing experimental semivariograms is indispensable to quantify spatial variability between CO2 observations; this can be calculated by the following equation [16]:
where γ(h) denotes the experimental semivariogram, Z(Xi) is the XCO2 value at Xi, Xi and Xi + h are the spatial locations on the earth’s surface, N(h) is the number of sample pairs separated by h, and h is the spatial distance between sample pairs of Xi and Xi + h, which is calculated by [15,17]:
where r is the Earth’s radius and
and
are the latitude and longitude of location Xi respectively.
Next, to quantify the spatial correlation structure between the pairs of XCO2 measurements, it is crucial to choose a theoretical semivariogram model. In this study, depending on the feature of the spatial variability of CO2 observations, an exponential semivariogram model with a nugget effect component was selected to model the XCO2 spatial variability [18].
where N is the nugget effect component, C is the sill value, and R is the range value [18]. These three model parameters, which fit the experimental semivariogram, are estimated by a nonlinear least-square method.
The subsequent prediction step is an ordinary Kriging approach. A distinct feature of Kriging is that an observation is not only weighted as a function of its distance to the prediction location but also as a function of its location relative to those of other observations [6]. Following the algorithm of GOSAT L3 products [15], the spatial correlation structure for each location is estimated by using local Kriging within a certain search range according to the property of a semivariogram (i.e., the farther the distance, the lesser the observation points contribute). Here, the search range of observation points adopts a moving ellipse similar to the method used by GOSAT L3 products [15]; however, the actual ellipse radii used were half that of the GOSAT L3 products. The detailed ellipse radii are listed in Table 1.
The XCO2 at each grid point x0 is subsequently predicted by the following equation [17]:
Where Z*(X0) refers to predicted XCO2, n is the number of observation points, and Z(Xi) is the value of the variable Z at Xi.
in (5) is calculated by the following equation [17]:
where
and
Another significant characteristic of Kriging is that it can quantify the uncertainties in the predicted value [15]. The mean square prediction error can be calculated by the following equation [15]:
In the interpolation processes, because of the differences between experimental semivariograms, the distribution tendency of global CO2 concentrations varies significantly between land and sea [15]. Therefore, in our study, the experiments are restricted to global land areas.

Table 1.
Search range used in the interpolated processes (unit: km).
| Season | Month | Latitude Range | Long Radii of Ellipse | Short Radii of Ellipse |
|---|---|---|---|---|
| Winter | 12, 1, 2 | 90 to 65 | 550 | 600 |
| 65 to 30 | 1250 | 900 | ||
| 30 to −10 | 1000 | 600 | ||
| −10 to −30 | 1100 | 550 | ||
| −30 to −60 | 800 | 900 | ||
| −60 to −90 | 900 | 1200 | ||
| Spring | 3, 4, 5 | 90 to 60 | 550 | 700 |
| 60 to 30 | 1550 | 1000 | ||
| 30 to −0 | 1000 | 750 | ||
| 0 to −30 | 750 | 500 | ||
| −30 to −65 | 400 | 650 | ||
| −65 to −90 | 900 | 500 | ||
| Summer | 6, 7, 8 | 90 to 65 | 550 | 650 |
| 65 to 30 | 1100 | 750 | ||
| 30 to 15 | 800 | 600 | ||
| 15 to −30 | 1200 | 800 | ||
| −30 to −70 | 800 | 650 | ||
| −70 to −90 | 800 | 550 | ||
| Autumn | 9, 10, 11 | 90 to 65 | 600 | 800 |
| 65 to 35 | 1200 | 750 | ||
| 35 to 10 | 900 | 600 | ||
| 10 to −30 | 1000 | 600 | ||
| −30 to −70 | 900 | 600 | ||
| −70 to −90 | 800 | 500 |
4. Results and Discussion
4.1. Global Spatial Distribution of XCO2 for Fused ACOS and BESD Data
In this study, as an example, the monthly averaged XCO2 data for October 2010 are used to investigate the global spatial coverage of the fused ACOS and BESD data. The fused data performed at other months are similar to that of October 2010. For better visualization, all data are aggregated in 2° × 2° bins by averaging data points for every grid cell in October 2010.
As shown in Figure 1, the XCO2 measurements from ACOS are distributed over both land and ocean areas. The XCO2 data points from BESD are restricted to land regions because of the low signal-to-noise ratio over the ocean. Although the data points from ACOS are slightly wider than those from BESD, both ACOS and BESD show poor global coverage. These results agree with those presented in the study conducted by Wang et al. [11].
From Figure 1, we can see that, on a global scale, the spatial distribution of the fused data is more extensive compared to that of other single-satellite data. We also investigated the global land coverage percentage for fused, ACOS, and BESD data (Figure 2) within 1° × 1° grids. Figure 2 shows that the global land spatial coverage of the fused data can reach up to 20.04% for time periods up to 30 days. For 30 days, the average global coverage of ACOS and BESD within 1° × 1° grids is approximately 8.86% and 14.60%, respectively. The global land spatial coverage of the fused data reached up to 15.57% within 15 days and 13.03% within 10 days. These results illustrate the overwhelming advantages of using fused data for both space and time scales. Although the fused data generate a wider global coverage, there are still some gaps in some regions. In this case, a proper gap-filling method is required to generate a continuous full-coverage map. To address this, an ordinary Kriging interpolation approach based on the three datasets (i.e., fused, ACOS, and BESD) was attempted and is described in the next section.
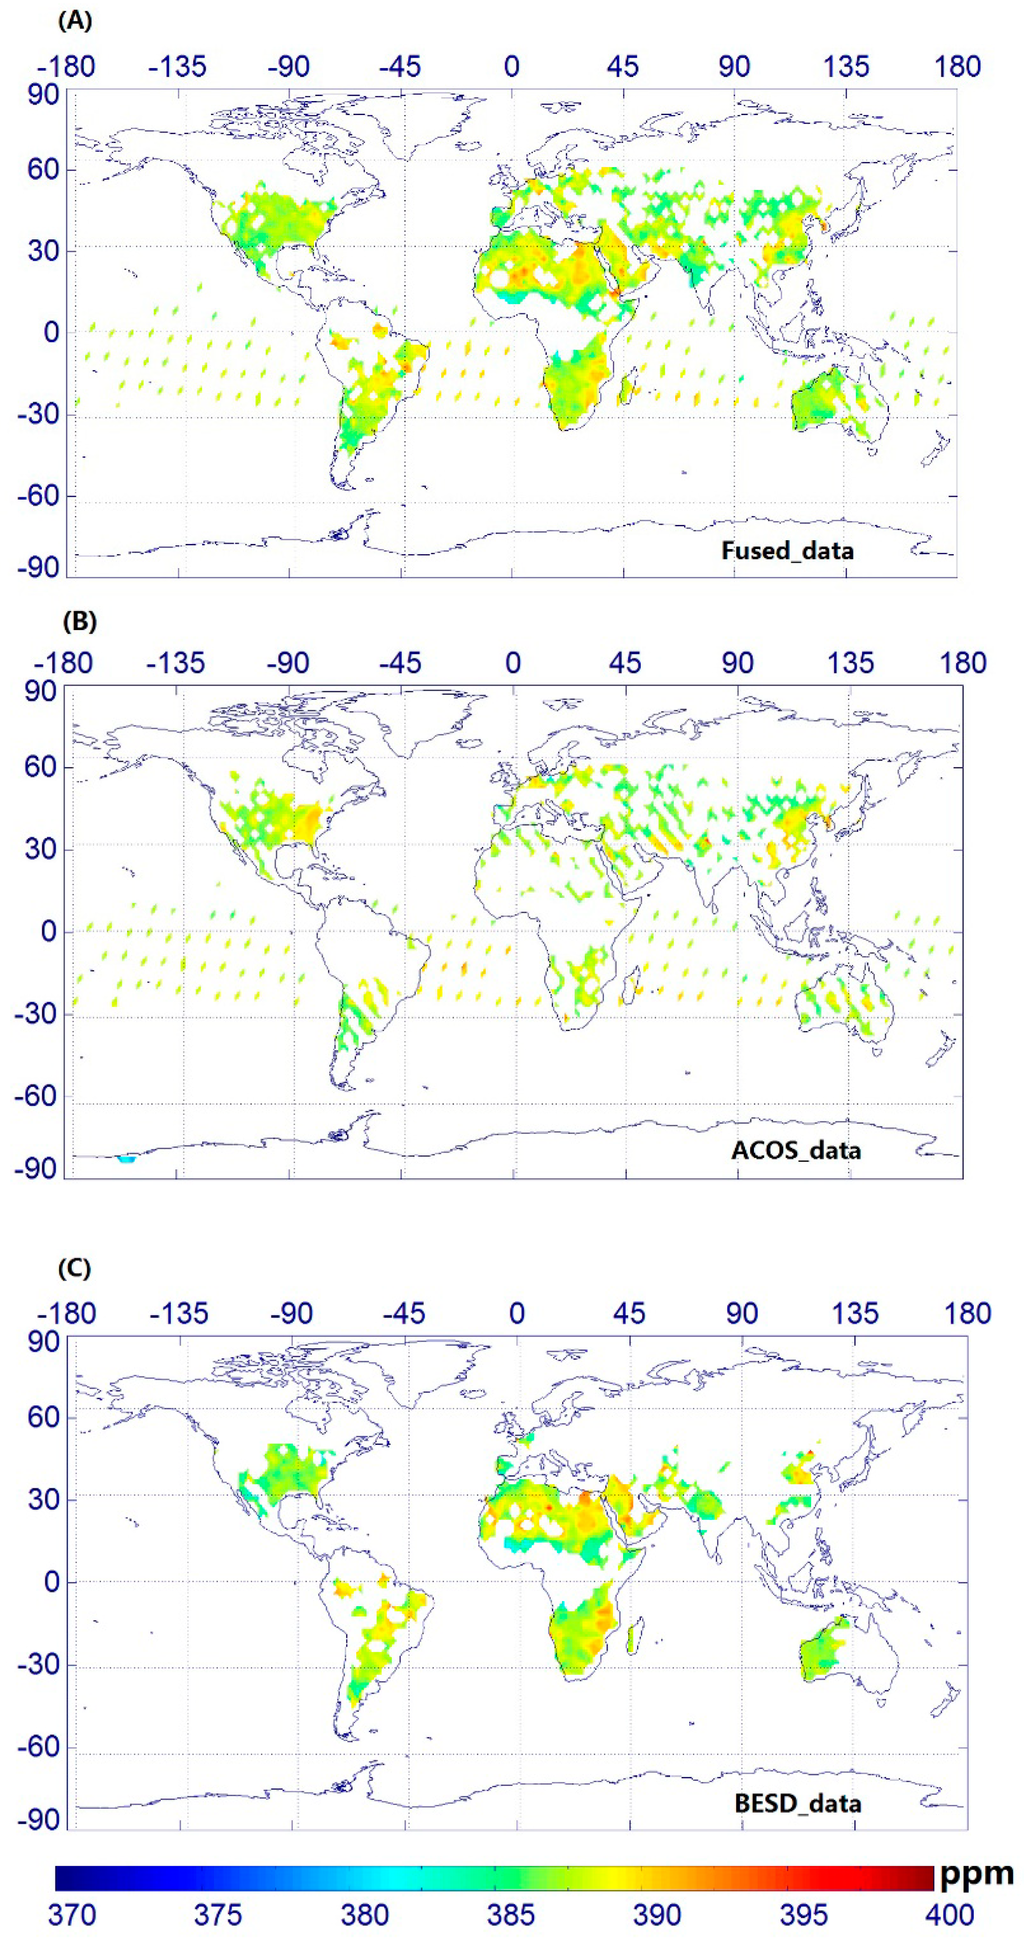
Figure 1.
Spatial coverage of XCO2 monthly average in 2° × 2° bins: (A) Fused data for October 2010; (B) ACOS data for October 2010; and (C) BESD data for October 2010.
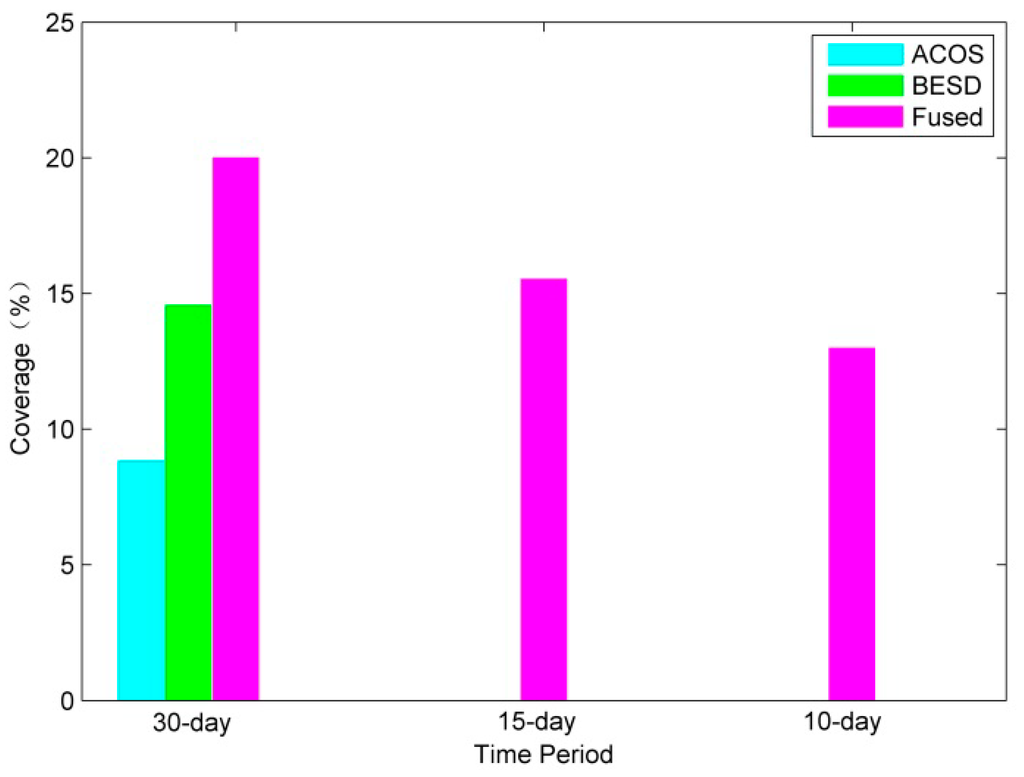
Figure 2.
Global land coverage percentage of XCO2 products for ACOS, BESD, and fused data within 1° × 1° grids for October 2010.
4.2. Estimating and Modeling Experimental Semivariograms of ACOS, BESD, and Fused XCO2 Data
In practice, initially a semivariogram model should be designated to fit a semivariogram obtained from actual observed data [15]. Semivariogram models include Gaussian, spherical, exponential, linear, and power models. After many tests, it turned out that the exponential semivariograms can fit the characteristics of the actually observed data more accurately than other semivariogram models for all three CO2 datasets (i.e., fused, ACOS, and BESD). Therefore, here, the exponential semivariogram model with a nugget effect component is selected. The experimental semivariograms and fitted results of fused, ACOS, and BESD data for October 2010 are shown in Figure 3.
In this study, on the basis of the relative distance, all semivariograms derived from CO2 observations are classified on a 100 km scale. The experimental semivariograms, which are denoted as blue dots in Figure 3, represent the average value of the semivariograms for each classification.
As shown by Figure 3, there are significant spatial correlations within these CO2 datasets, although the spatial correlation becomes weaker as the distance increases. Evidently, a potential advantage of the fused data is that it can ensure more data points for stable semivariogram estimation.
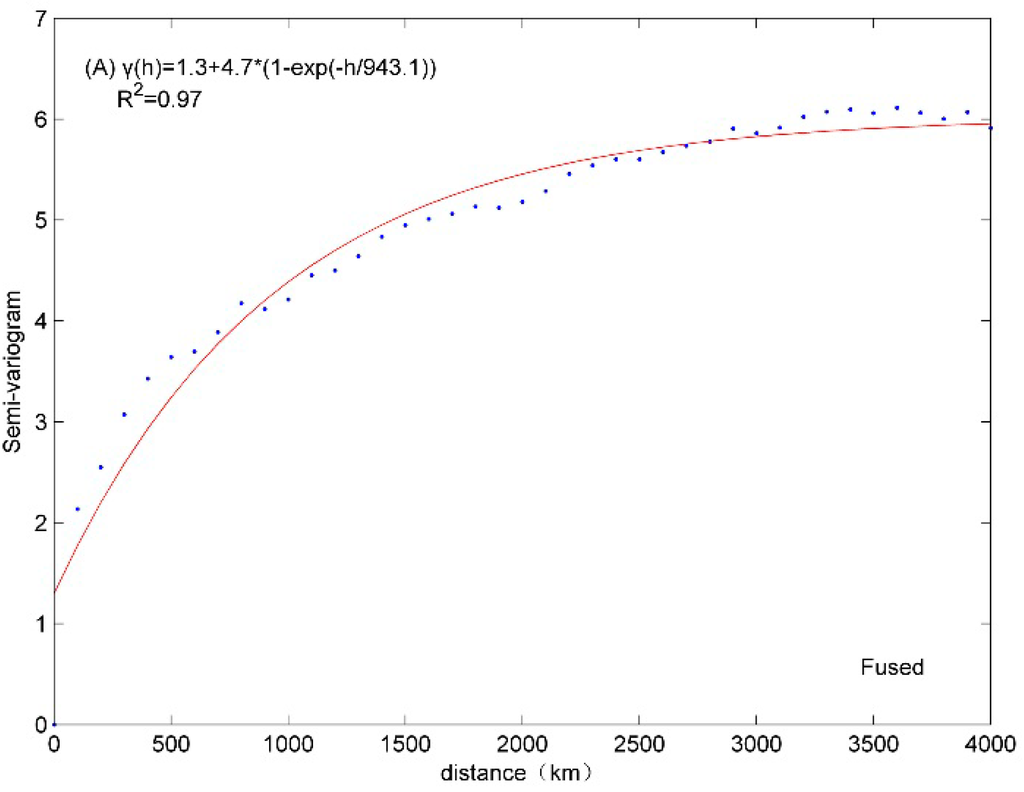
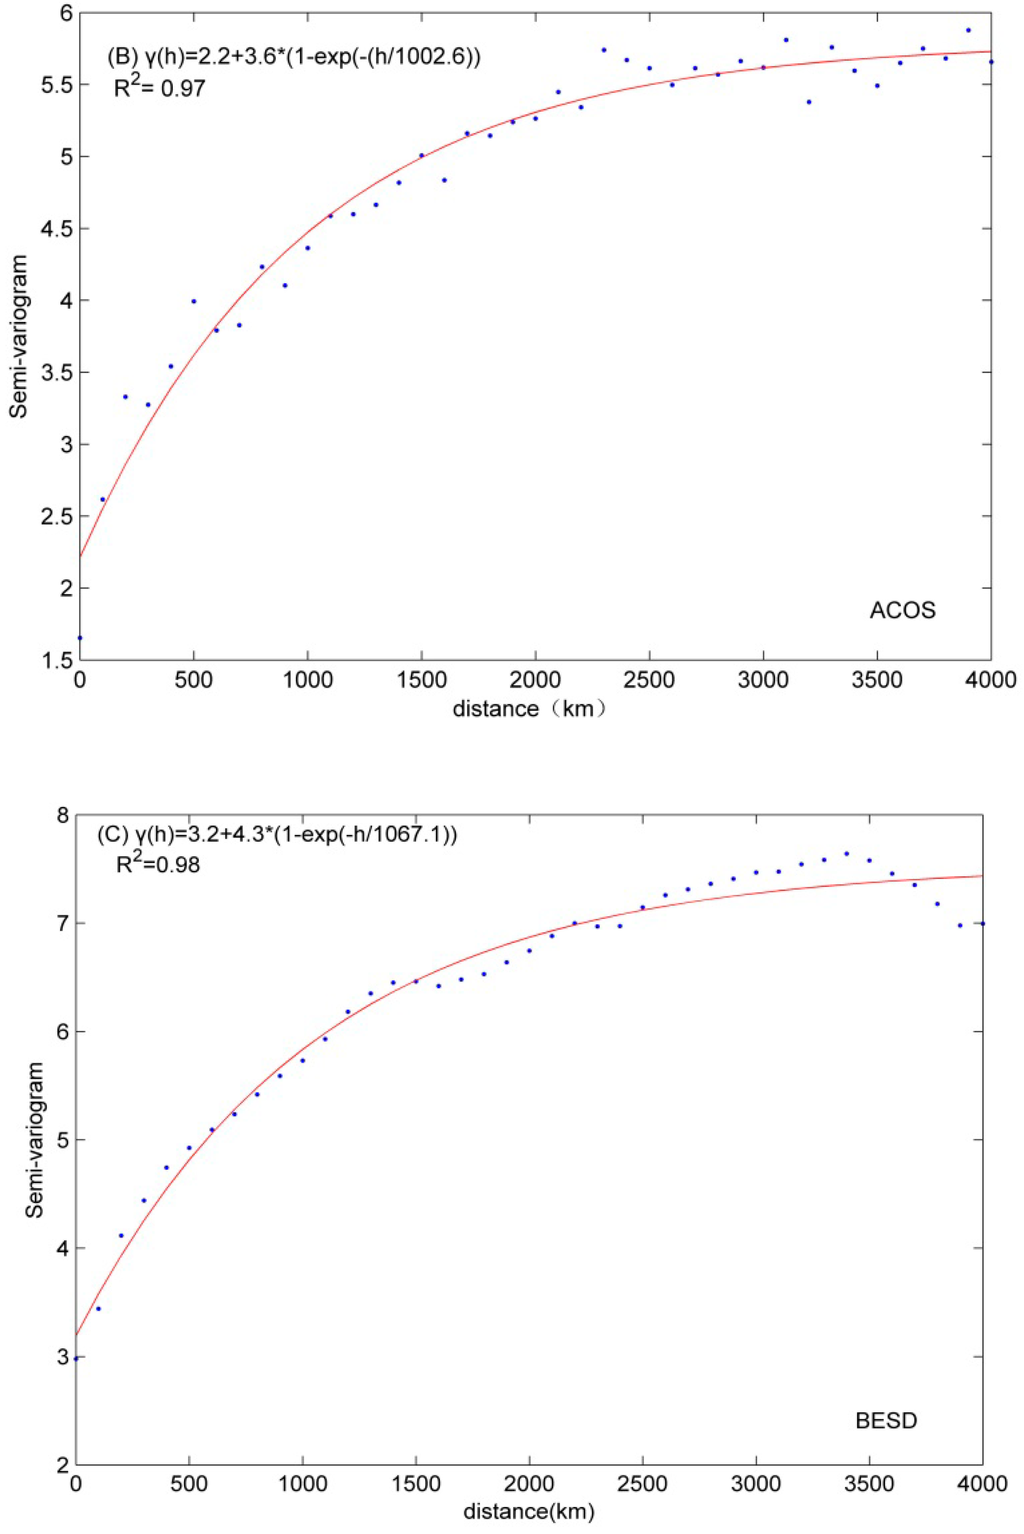
Figure 3.
The experimental semivariograms and their fitting results for October 2010: (A) Fused CO2; (B) ACOS; and (C) BESD.
4.3. Comparison of the Interpolated Map of the Fused CO2 with that of Single Satellite CO2
In this study, the ordinary Kriging method is used to fill in the gap of global land CO2 distributions for the fused and two single satellite datasets. A feature of this gap-filling method is that each predicted value has an associated uncertainty, which reflects the number of observations surrounding an estimation location and the spatial variability in the XCO2 field [14]. The predicted values with their associated uncertainties are used to implement comparisons between the fused data and the two single satellite observations. Figure 4 shows an example of the comparison of predicted results for these three datasets in October 2010.
Global standard deviation for interpolated XCO2 products (ACOS, BESD, and fused) in April, July, and October 2010 was also investigated and compared (Table 2). It can be seen from Table 2 that the interpolated fused data show the smallest mean standard deviation and the minimum value.
As shown in Figure 4, although the spatial coverage of the interpolated ACOS shows a similar trend with that of the interpolated fused data, it shows a small gap in the south of Central America relative to the fused data. From the corresponding uncertainties of ACOS, we also see that the gaps exist in the north of Southern America. Therefore, the spatial coverage of the interpolated fused data is somewhat wider over the global land region compared to the interpolated CO2 value of single satellite products. In particular, interpolated values of the fused data show lower uncertainties than those of the two satellites.
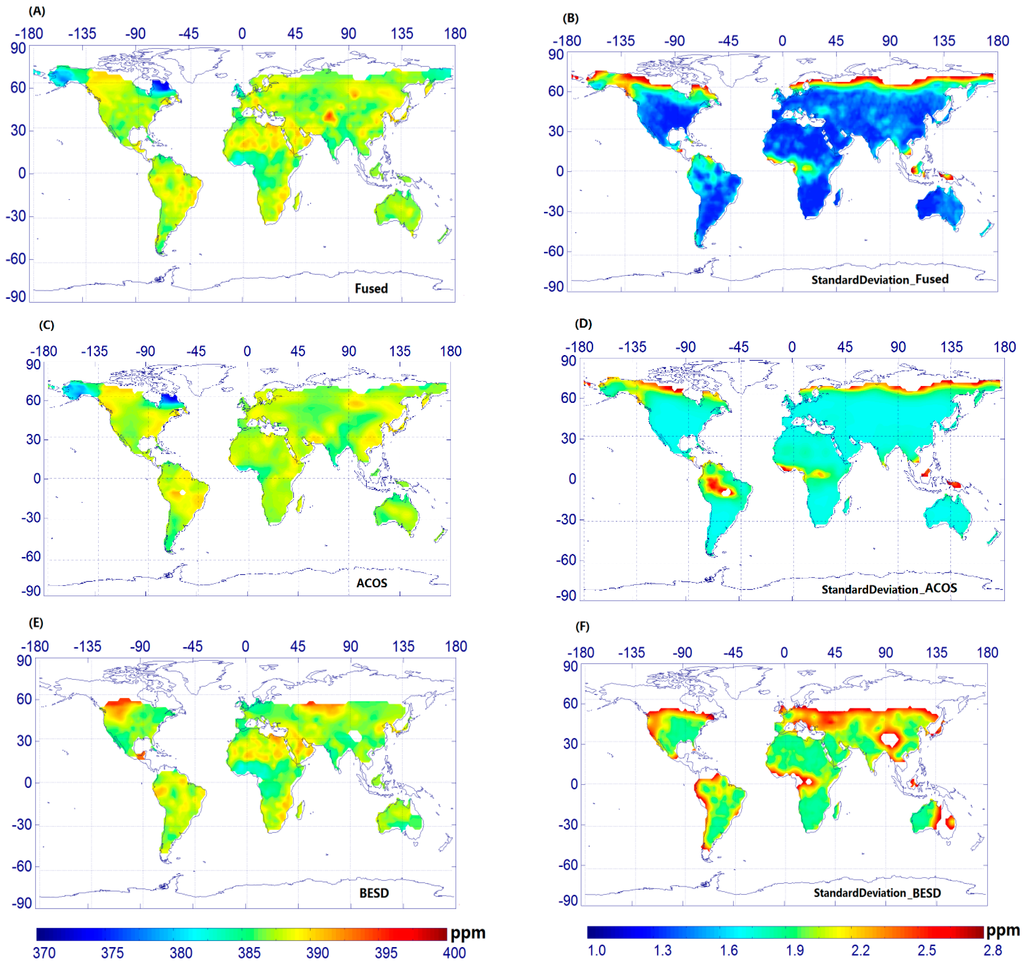
Figure 4.
Comparison of the spatial distribution of the Kriging predictions and associated standard deviations: (A) Interpolated fused CO2 data; (B) Standard deviation in (A); (C) Interpolated ACOS CO2 data; (D) Standard deviation in (B); (E) Interpolated BESD CO2 data; and (F) Standard deviation in (E).
These results indicate that our fused CO2 products are more effective for generating global full-coverage CO2 concentrations based on the ordinary Kriging method. In addition, with regard to the predictions, the spatial coverage over land in the Southern Hemisphere, e.g., southern Africa and southern South America, is relatively good for each of the three datasets. The predicted uncertainties are also low for these regions. However, for the interpolated results of the fused, ACOS, and BESD data, regions with relatively weak constraint exist in high northern latitudes, e.g., northern Canada, Greenland, and northern Russia. This is thought to be due to limited data points. At the same time, it can be seen from Figure 4 that, in eastern Africa and the northeast part of South America, high uncertainties also exist in the fused, ACOS, and BESD product, which may also be due to limited data points.

Table 2.
Basic global standard deviation statistics for interpolated XCO2 products in April, July, and October 2010. Unit: ppm.
| Month | Data | Mean | Max | Min |
|---|---|---|---|---|
| 4 | ACOS | 1.85 | 2.75 | 1.70 |
| BESD | 2.34 | 3.80 | 2.04 | |
| Fused | 1.76 | 3.31 | 1.49 | |
| 7 | ACOS | 1.89 | 2.90 | 1.82 |
| BESD | 2.37 | 3.83 | 2.05 | |
| Fused | 1.80 | 3.14 | 1.66 | |
| 10 | ACOS | 1.84 | 3.05 | 1.71 |
| BESD | 2.17 | 3.45 | 1.84 | |
| Fused | 1.61 | 3.07 | 1.29 |
Furthermore, we can see from Figure 4 that the interpolated fused results are similar to those of ACOS in the northern part of North America and the Eurasian area. This is because the fused data points are primarily from ACOS observation points, and limited BESD data points are available in these regions.
Overall, the fused CO2 data based on the ordinary Kriging is more helpful to map the global land CO2 distribution at high spatiotemporal resolution, and in the following section, we further investigate monthly variability for the interpolated fused data.
4.4. Monthly Variability for Predicting the Fused Data
In this study, monthly global land distributions of the predicted CO2 with the associated uncertainties are presented for April, July, September, and December 2010. As shown in Figure 5, the number of predicted CO2 values decreases slightly in April and December for the Northern Hemisphere. In addition, poor coverage is found in the high northern latitudes for April and December, which is probably due to solar zenith angle restrictions and limited valid observations in these regions [14].
Furthermore, the monthly variations are captured well in the prediction maps of the fused data, especially in the Northern Hemisphere with relatively higher CO2 values in April and lower CO2 values in September, thus reflecting the effect of the atmospheric CO2 seasonal cycle. The cause of these significant seasonal variations in CO2 concentration in the Northern Hemisphere has been analyzed by many researchers. They have indicated that, in the Northern Hemisphere, XCO2 values are higher in spring because of coal combustion as well as strong respiration of plants and soil, and XCO2 values are lower in autumn because of strong photosynthesis activity. For example, Liu et al. [16] proposed that smoke and dust from coal combustion is a main reason for higher XCO2 concentration in winter and spring. Bai et al. [35] stated that significant seasonal variations of CO2 in the Northern Hemisphere were closely related to human activities and green vegetation. Wang et al. [11] also found that seasonal cycles exist in the retrieved XCO2 concentrations from satellites in the Northern Hemisphere and that there are no significant seasonal variations in the Southern Hemisphere. From Figure 4, we can also see that there is no noticeable seasonal variation in the Southern Hemisphere, particularly for Australia and the southern part of South America.
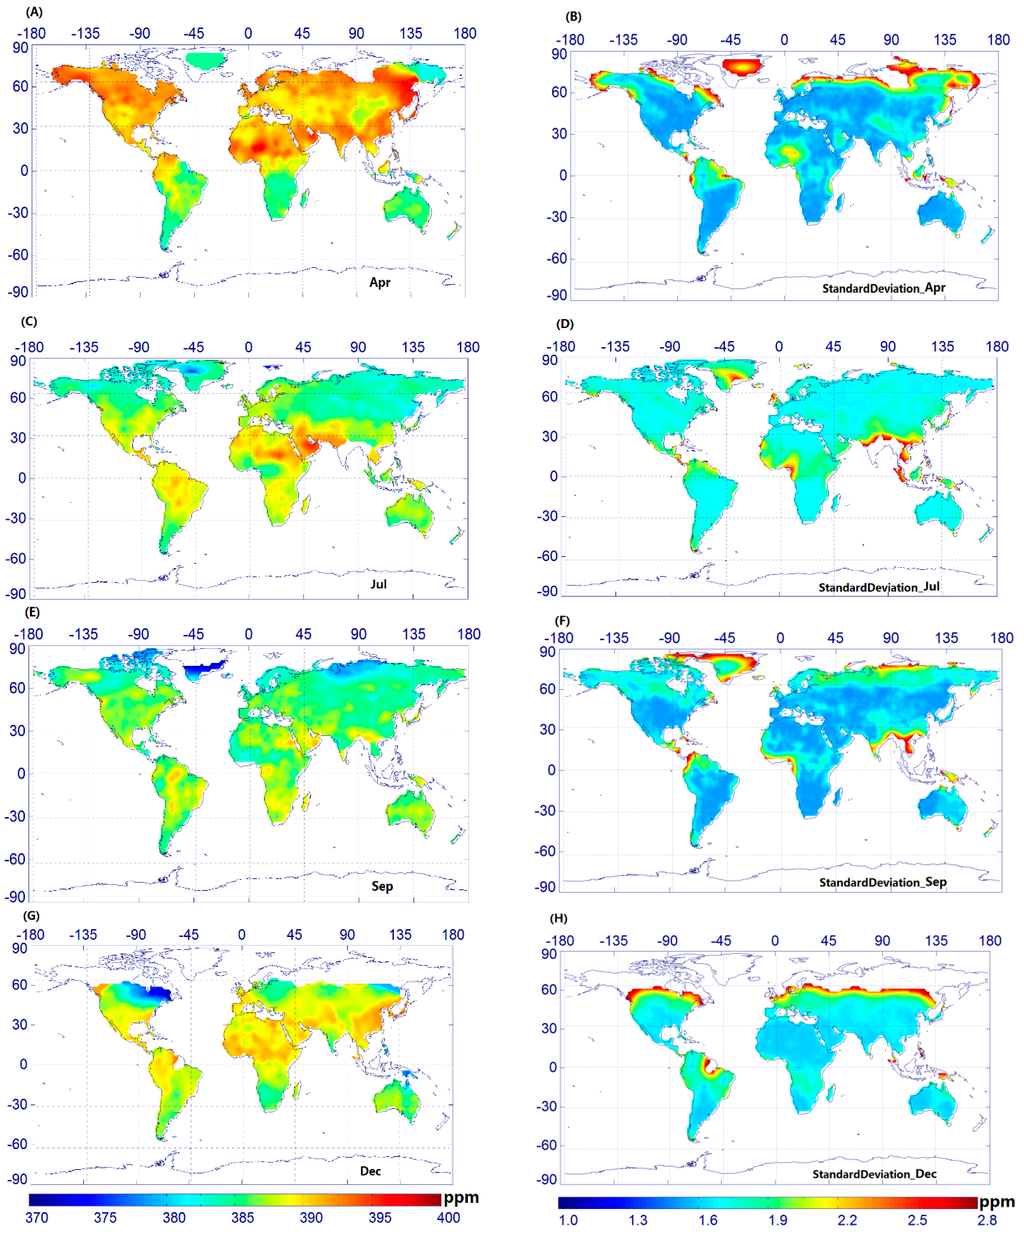
Figure 5.
Monthly mean maps of the predicted fused data with associated standard deviation (gridded in 2° × 2° bins): (A) Predicted fused data for April 2010; (B) Associated standard deviation for the predicted value (April 2010); (C) Predicted fused data for July 2010; (D) Associated standard deviation for the predicted value (July 2010); (E) Predicted fused data for September 2010; (F) Associated standard deviation for the predicted value (September 2010); (G) Predicted fused data for December 2010; and (H) Associated standard deviation for the predicted value (December 2010).
4.5. Comparison of Kriging Interpolation Results with Total Carbon Column Observing Network (TCCON) Measurements
To investigate the effectiveness of the interpolation result based on the fused dataset, ground-based measurements are compared with the predictions for monthly mean values in 2010. The ground measurements taken between 10 a.m. and 2 p.m. are used to calculate monthly averaged values to match the overpass time of the satellites involving GOSAT and SCIAMACHY. Monthly means typically comprise n ≈ 100–1000 individual measurements for TCCON and typically n ≈ 25 data for fused Kriging.
From Figure 6 it can be seen that the monthly average predicted CO2 data in 2010 are in good agreement with those of the TCCON sites on the whole, especially in the Lamont site located in the Northern Hemisphere. However, the monthly average predicted CO2 data are lower than those of the TCCON sites by 0.5% in the Lamont site, which may stem from underestimated observation values; these biases were also found by Wunch et al. [36]. At the same time, there are also some differences between the interpolated fused results and site data in some months for the Wollongong site. This is probably due to the lower number of data points from this site [36] for these months, which could result in inaccurate interpolated values. Note that the seasonal variations of the predicted and ground-based CO2 data in Lamont, with higher values in spring and winter and lower values in autumn, are also sufficiently evident. However, this tendency is not found at the Wollongong site located in the Southern Hemisphere.
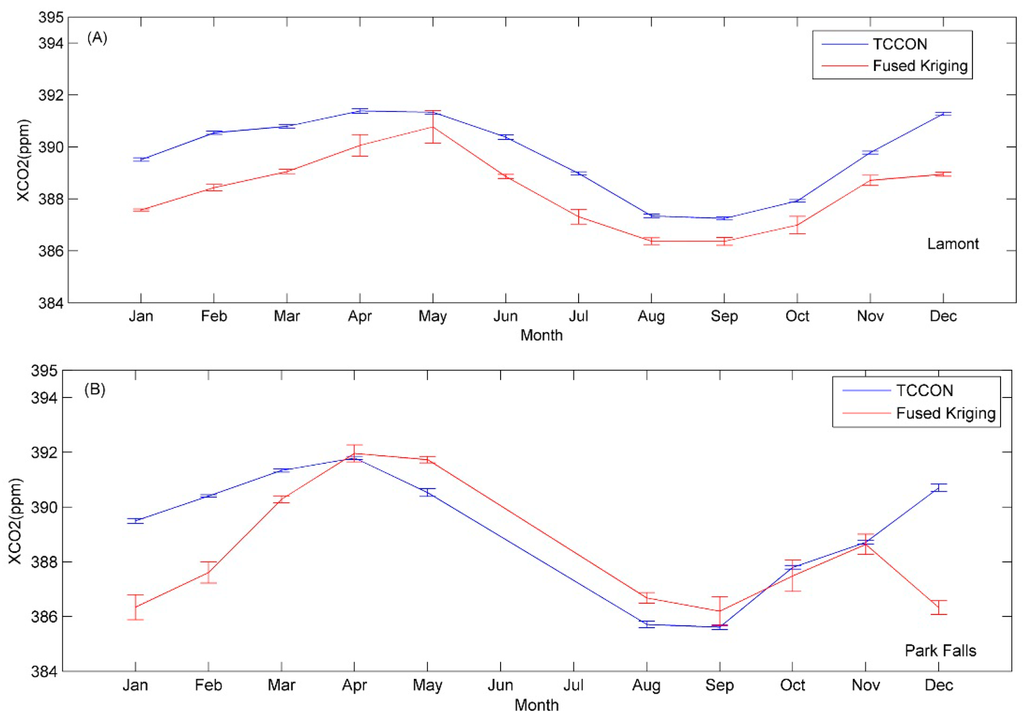
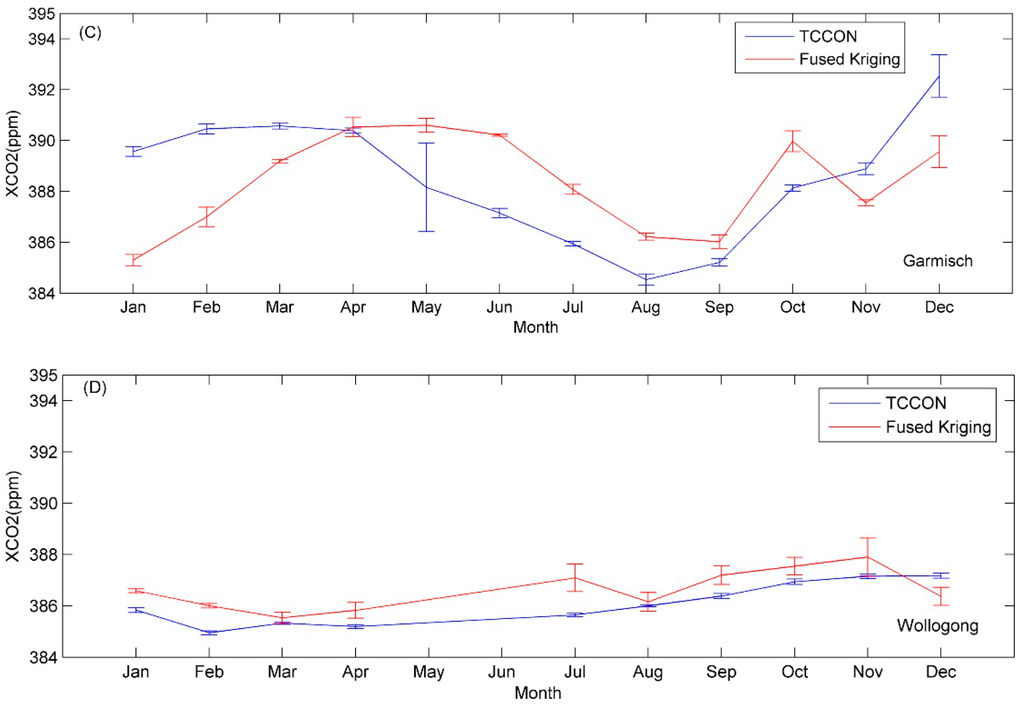
Figure 6.
Error bars are pure statistical uncertainties of the monthly means (±3 sigma/sqrt(n) for TCCON site and fused Kriging data within ±2.5° in 2010; for TCCON sites, the monthly data between 10 am and 2 pm are averaged according to the overpass time of two satellites being combined. (A) Lamont site in 2010; (B) Park Falls site in 2010; (C) Garmisch site in 2010; and (D) Wollongong site in 2010.
5. Conclusions
In this study, a physical fusion and gap-filling method was proposed to map global land CO2 distribution by combining GOSAT with SCIAMACHY data at high spatiotemporal resolution. Initially, spatial coverage of the monthly averaged CO2 in October 2010 was investigated for the fused, GOSAT, and SCIAMACHY data products. At the same time, the global land coverage percentage was compared among the fused, ACOS, and BESD datasets. The comparison results show that the global land spatial coverage of the fused data could reach up to 20.04% within 30 days, while the average global coverage of ACOS and BESD was approximately 8.86% and 14.60%, respectively. However, the global land spatial coverage percentage of the fused data within 15 days and 10 days reached up to 15.57% and 13.03%, respectively. Compared to ACOS or BESD, the fused data showed two or three times higher temporal resolution. These results indicate that the fused dataset is very effective for mapping the global distribution of XCO2 concentration in either space or time scales. Based on this, the global land spatial correlation structure was evaluated and modeled using an exponential semivariogram model with a nugget effect component for fused, ACOS, and BESD CO2 databases for October 2010. Subsequently, gap-filling maps of these CO2 datasets with associated uncertainties were constructed on the basis of ordinary Kriging interpolation. The interpolated results imply that the interpolated fused data have the lowest standard deviation (mean value: 1.61 ppm and minimum value: 1.29 ppm) among these three databases and the largest spatial coverage. The monthly variations of the predictions for the fused data were also investigated. The results show that the monthly variations are relatively noticeable with higher values in April and December and lower values in July and September in the Northern Hemisphere, which is coincident with the CO2 seasonal cycle.
In addition, the interpolated monthly averaged fused data were compared with data from the TCCON Lamont, Park Falls and Garmisch sites in the Northern Hemisphere and the Wollongong site in the Southern Hemisphere. The result revealed that the interpolated fused data is in good agreement with the TCCON sites on the whole. Furthermore, the seasonal cycle of the monthly averaged predicted fused data are also consistent with the TCCON measurements. These findings prove that predicted XCO2 based on the fused dataset and gap-filling method is very useful to map global full-coverage XCO2 distribution.
OCO-2 was launched in June 2014, and its data is still not available publicly. Once its data is released publicly, we will incorporate it and then generate improved fused XCO2 datasets. In the current fusion of the proposed method, we only use the CO2 profile of CT and Satellite (including GOSAT and SCIAMACHY); a new ground-based CO2 profile and other Satellite CO2 profiles, such as OCO-2, will be further considered to improve our method in the future. Considering the generality of our strategies shown in this study, they can be easily adapted to process other trace gases.
Acknowledgments
This study has been jointly supported by the Strategic Priority Research Program “Climate Change: Carbon Budget and Related Issues” of the Chinese Academy of Sciences (Grant No. XDA05040402) and the National Natural Science Foundation of China (Grant No. 41201347). We thank the SCIAMACHY team at the University of Bremen IUP/IFE for providing the BESD data, NASA and the ACOS project for providing the ACOS v2.9 data from the ACOS/OCO-2 data archive maintained at the NASA Goddard Earth Science Data and Information Services Center. We also wish to thank the U.S. National Oceanic and Atmospheric Administration for making the Carbon Tracker CO2 fields available. And TCCON data were obtained from the TCCON Data Archive, operated by the California Institute of Technology from the TCCON website. We thank Paul Wennberg, David Griffith for providing Park Falls, Lamont and Wollogong site data. TCCON work at Garmisch has been funded by the German Helmholtz Program ATMO and in part by the ESA ghg-cci project via subcontract with the University of Bremen.
Author Contributions
The work presented here was carried out in a collaboration between all authors. The study was conceived by Yingying Jing, Jiancheng Shi and Tianxing Wang. The writing was led by Yingying Jing, Jiancheng Shi and Tianxing Wang. Ralf Sussmann provided TCCON data used in this paper, pointed out an inconsistency in the data shown in Figure 6 and helped to resolve the underlying bug in the Kriging data. All authors contributed to reviewing and revising the text.
Conflicts of Interest
The authors declare no conflict of interest.
References
- Forster, P.; Ramaswamy, V.; Artaxo, P.; Berntsen, T.; Betts, R.; Fahey, D.W.; Haywood, J.; Lean, J.; Lowe, D.C.; Myhre, G.; et al. Changes in atmospheric constituents and in radiative forcing. In Climate Change 2007: The Physical Science Basis. Contribution of Working Group I to the Fourth Assessment Report of the Intergovernmental Panel on Climate Change; Solomon, S., Qin, D., Manning, M., Chen, Z., Marquis, M., Averyt, K.B., Tignor, M., Miller, H.L., Eds.; Cambridge University Press: Cambridge, UK/New York, NY, USA, 2007; pp. 137–140. [Google Scholar]
- Friedlingstein, P.; Cox, P.; Betts, R.; Bopp, L.; von Bloh, W.; Brovkin, V.; Cadule, P.; Doney, S.; Eby, M.; Fung, I.; et al. Climate-carbon cycle feedback analysis: Results from the C4MIP model intercomparison. J. Clim. 2006, 19, 3337–3353. [Google Scholar] [CrossRef]
- Alkhaled, A.; Michalak, A.M.; Kawa, S.R.; Olsen, S.; Wang, J.W. A global evaluation of the regional spatial variability of column integrated CO2 Distributions. J. Geophys. Res. 2008. [Google Scholar] [CrossRef]
- Araki, M.; Morino, I.; Machida, T.; Sawa, Y.; Matsueda, H.; Ohyama, H.; Yokota, T.; Uchino, O. CO2 column-averaged volume mixing ratio derived over Tsukuba from measurements by commercial airlines. Atmos. Chem. Phys. 2010, 10, 7659–7667. [Google Scholar] [CrossRef]
- Rayner, P.J.; O’Brien, D.M. The utility of remotely sensed CO2 concentration data in surface source inversions. Geophys. Res. Lett. 2001. [Google Scholar] [CrossRef]
- Hammerling, D.M.; Michalak, A.M.; Kawa, S.R. Mapping of CO2 at high spatiotemporal resolution using satellite observations: Global distributions from OCO-2. J. Geophys. Res. 2012. [Google Scholar] [CrossRef]
- Orbiting Carbon Observatory 2 (OCO-2). Available online: http//www.nasa.gov/jpl/oco2/virtual-time-machine-20140718/#.U9RtX6JHKJc (accessed on 18 July 2014).
- Yokota, T.; Oguma, H.; Morino, I.; Inoue, G. A nadir looking SWIR FTS to monitor CO2 column density for Japanese GOSAT project. In Proceedings of the 24th International Symposium on Space Technology and Science, Miyazaki, Japan, 30 May–6 June 2004.
- Buchwitz, M.; Beek, R.; Burrows, J.P.; Bovensmann, H.; Warneke, T.; Notholt, J.; Meirink, J.F.; Goede, A.P.H.; Bergamaschi, P.; Korner, S.; et al. Atmospheric methane and carbon dioxide from SCIAMACHY satellite data: Initial comparison with chemistry and transport models. Atmos. Chem. Phys. 2005, 5, 941–962. [Google Scholar] [CrossRef]
- Reuter, M.; Buchwitz, M.; Schneising, O.; Heymann, J.; Bovensmann, H.; Burrows, J.P. A method for improved SCIAMACHY CO2 retrieval in the presence of optically thin clouds. Atmos. Meas. Tech. 2010, 3, 209–232. [Google Scholar] [CrossRef]
- Wang, T.X.; Shi, J.C.; Jing, Y.Y.; Xie, Y.H. Investigation of the consistency of atmospheric CO2 retrievals from different space-based sensors: Intercomparison and spatiotemporal analysis. Chin. Sci. Bull. 2013, 58, 4161–4170. [Google Scholar] [CrossRef]
- Morino, I.; Uchino, O.; Inoue, M.; Yoshida, Y.; Yokota, T.; Wennberg, P.O.; Toon, G.C.; Wunch, D.; Roehl, C.M.; Notholt, J.; et al. Preliminary validation of column-averaged volume mixing ratios of carbon dioxide and methane retrieved from GOSAT short-wavelength infrared spectra. Atmos. Meas. Tech. 2011, 4, 1061–1076. [Google Scholar]
- Wang, T.X.; Shi, J.C.; Jing, Y.Y.; Zhao, T.X.; Ji, D.B.; Xiong, C. Combining XCO2 measurements derived from SCIAMACHY and GOSAT for potentially generating global CO2 maps with high spatiotemporal resolution. PLoS One 2014. [Google Scholar] [CrossRef]
- Hammerling, D.M.; Michalak, A.M.; O’Dell, C.; Kawa, S.R. Global CO2 distributions over land from the Greenhouse Gases Observing Satellite (GOSAT). Geophys. Res. Lett. 2012. [Google Scholar] [CrossRef]
- Yokota, T.; Watanabe, H.; Hayashi, K.; Takaichi, K.; Shimono, Y.; Suga, T. NIES GOSAT Project. In Algorithm Theoretical Basis Document for GOSAT TANSO-FTS L3; NIES-GOSAT-PO-017, V 1.0; National Institute for Environmental Studies: Tsukuba, Japan, 2011; pp. 3–25. [Google Scholar]
- Liu, Y.; Wang, X.; Guo, M.; Tani, H. Mapping the FTS SWIR L2 product of XCO2 and XCH4 data from the GOSAT by the Kriging method—A case study in East Asia. Int. J. Remote Sens. 2012, 33, 3004–3025. [Google Scholar] [CrossRef]
- Tomosada, M.; Kanefuji, K.; Matsumoto, Y.; Tsubaki, H. A prediction method of the global distribution map of CO2 column abundance retrieved from GOSAT observation derived from ordinary Kriging. In Proceedings of the ICROS-SICE International Joint Conference, Fukuoka, Japan, 18–21 August 2009.
- Zeng, Z.C.; Lei, L.P.; Guo, L.J.; Zhang, L.; Zhang, B. Incorporating temporal variability to improve geostatistical analysis of satellite-observed CO2 in China. Chin. Sci. Bull. 2013, 58, 1948–1954. [Google Scholar] [CrossRef]
- Kuze, A.; Suto, H.; Nakajima, M.; Hamazaki, T. Thermal and near infrared sensor for carbon observation Fourier-transform spectrometer on the Greenhouse Gases Observing Satellite for greenhouse gases monitoring. Appl. Opt. 2009, 48, 6716–6733. [Google Scholar] [CrossRef] [PubMed]
- Yokota, T.; Yoshida, Y.; Eguchi, N.; Ota, Y.; Tanaka, T.; Watanabe, H.; Maksyutov, S. Global concentrations of CO2 and CH4 retrieved from GOSAT: First preliminary results. SOLA 2009, 5, 160–163. [Google Scholar] [CrossRef]
- O’Dell, C.W.; Connor, B.; Bösch, H.; O’Brien, D.; Frankenberg, C.; Castano, R.; Christi, M.; Eldering, D.; Fisher, B.; Gunson, M.; et al. The ACOS CO2 retrieval algorithm—Part 1: Description and validation against synthetic observations. Atmos. Meas. Tech. 2012, 5, 99–121. [Google Scholar] [CrossRef]
- Yoshida, Y.; Ota, Y.; Eguchi, N.; Kikuchi, N.; Nobuta, K.; Tran, H.; Morino, I.; Yokota, T. Retrieval algorithm for CO2 and CH4 column abundances from short-wavelength infrared spectral observations by the Greenhouse gases observing satellite. Atmos. Meas. Tech. 2011, 4, 717–734. [Google Scholar] [CrossRef]
- Oshchepkov, S.; Bril, A.; Yokota, T. PPDF-based method to account for atmospheric light scattering in observations of carbon dioxide from space. J. Geophys. Res. 2008. [Google Scholar] [CrossRef]
- Bösch, H.; Baker, D.; Connor, B.; Crisp, D.; Miller, C. Global characterization of CO2 column retrievals from shortwave-infrared satellite observations of the orbiting carbon observatory-2 mission. Remote Sens. 2011, 3, 270–304. [Google Scholar]
- Butz, A.; Hasekamp, O.P.; Frankenberg, C.; Aben, I. Retrievals of atmospheric CO2 from simulated space-borne measurementsof backscattered near-infrared sunlight: Accounting for aerosol effects. Appl. Opt. 2009, 48, 3322–3336. [Google Scholar] [CrossRef] [PubMed]
- Bovensmann, H.; Burrows, J.P.; Buchwitz, M.; Frerick, J.; Noël, S.; Rozanov, V.V.; Chance, K.V.; Goede, A.P.H. SCIAMACHY—Mission objectives and measurement modes. J. Atmos. Sci. 1999, 56, 127–150. [Google Scholar] [CrossRef]
- Burrows, J.P.; Holzle, E.; Goede, A.P.H.; Visser, H.; Fricke, W. SCIAMACHY—scanning imaging absorption spectrometer for atmospheric chartography. Acta Astronaut. 1995, 35, 445–451. [Google Scholar] [CrossRef]
- Cracknell, A.P.; Varotsos, C. Editorial and cover: Fifty years after the first artificial satellite: From Sputnik 1 to ENVISAT. Int. J. Remote Sens. 2007, 28, 2071–2072. [Google Scholar]
- SCanning Imaging Absorption spectroMeter for Atmospheric CHartographY (SCIAMACY). Available online: http//www.sciamachy.org (accessed on 15 June 2014).
- Reuter, M.; Bovensmann, H.; Buchwitz, M.; Burrows, J.P.; Heymann, J.; Connor, B.J.; Deutscher, N.M.; Griffith, D.W.T.; Heymann, J.; Keppel-Aleks, G.; et al. Retrieval of atmospheric CO2 with enhanced accuracy and precision from SCIAMACHY: Validation with FTS measurements and comparison with model results. J. Geophys. Res. 2011. [Google Scholar] [CrossRef]
- Osterman, G.; Eldering, A.; Avis, C.; O’Dell, C.; Martinez, E.; Crisp, D.; Frankenberg, C.; Fisher, B.; Wunch, D. ACOS 3.3 Level 2 Standard Product Data User’s Guide, v3.3; GES DISC: Greenbelt, MD, USA, 2011. [Google Scholar]
- Peters, W.; Jacobson, A.R.; Sweeney, C.; Andrews, A.E.; Conway, T.J.; Masarie, K.; Miller, J.B.; Bruhwiler, L.M.P.; Petron, G.; Hirsch, A.I.; et al. An atmospheric perspective on North America carbon dioxide exchange: Carbon Tracker. Proc. Natl. Acad. Sci. USA 2007, 104, 18925–18930. [Google Scholar] [CrossRef]
- Wunch, D.; Toon, G.C.; Blavier, J.-F.L.; Washenfelder, R.A.; Notholt, J.; Connor, B.J.; Griffith, D.W.T.; Sherlock, V.; Wennberg, P.O. The total carbon column observing network. Phil. Trans. R. Soc. A. 2011. [Google Scholar] [CrossRef]
- Rodgers, C.D.; Connor, B.J. Intercomparison of remote sounding instruments. J. Geophys. Res. 2003. [Google Scholar] [CrossRef]
- Bai, W.G.; Zhang, X.Y.; Zhang, P. Temporal and distribution of tropospheric CO2 over China based on satellite observation. Chin. Sci. Bull. 2010. [Google Scholar] [CrossRef]
- Wunch, D.; Wennberg, P.O.; Toon, G.C.; Connor, B.J.; Fisher, B.; Osterman, G.B.; Frankenberg, C.; Mandrake, L.; O’Dell, C.; Ahonen, P.; et al. A method for evaluating bias in global measurements of CO2 total columns from space. Atmos. Chem. Phys. 2011, 11, 12317–12337. [Google Scholar]
© 2014 by the authors; licensee MDPI, Basel, Switzerland. This article is an open access article distributed under the terms and conditions of the Creative Commons Attribution license (http://creativecommons.org/licenses/by/4.0/).