Article

Analysis on Effectiveness of SO2 Emission Reduction in Shanxi, China by Satellite Remote Sensing

School of Geosciences and Info-Physics, Central South University, Changsha 410083, China
*
Author to whom correspondence should be addressed.
Atmosphere 2014, 5(4), 830-846; https://doi.org/10.3390/atmos5040830
Submission received: 5 August 2014 / Revised: 18 September 2014 / Accepted: 23 October 2014 / Published: 10 November 2014

Abstract

:
The SO2 emissions from coal-fired power plants in China have been regulated since 2005 by a mandatory installation of flue gas desulfurization (FGD) devices. In order to verify the effectiveness of FGD systems applied in power plants, Shanxi (a province well-known for the largest coal reserves in China) was selected, and the characteristic and evolution of SO2 densities over 22 regions with large coal-fired power plants during 2005–2012 were investigated by using the satellite remote sensing data from the Ozone Monitoring Instrument (OMI). A unit-based inventory was also employed to study the trend of SO2 emissions from coal-fired power plants in Shanxi. The results show that the operation of FGD systems was successful in reducing SO2 emissions from power plants during 2005–2010: the mean SO2 densities satellite-observed over those regions with power plants operated before 2005 showed a notable decrease of approximate 0.4 DU; the mean SO2 densities over other regions with power plants newly built behind 2006 did not show a statistical increasing trend overall; the mean SO2 density over the whole Shanxi also showed a moderate decline from 2008 to 2010. However, the polluted conditions over Shanxi during 2011–2012 rebounded and the declining trend in mean SO2 density over the whole Shanxi disappeared again. In comparison of unit-based emission inventory, the emissions calculated show a similar trend with SO2 densities satellite-observed during 2005–2010 and still maintain at a lower volume during 2011–2012. By investigating the developments of other emission sources in Shanxi during 2005–2012, it is considered that the rapid expansion of industries with high coal-consumption has played an important role for the increment rise of SO2 emissions. Lack of an independent air quality monitoring network and the purposeful reduced operation rate of FGD systems occurring in some coal-fired power plants have reduced the effectiveness of SO2 emission reduction policy applied in Shanxi. In view that the SO2 pollution in Shanxi has not been well ameliorated, more reasonable and mandatory policies, such as a national-wide independent monitoring network and installation of FGD systems in other large emission sources, should be pushed out in the near future.

1. Introduction

The phenomenal economic development in China since 2000 has been largely driven by an expansion in heavy industries, which were mainly fueled by coal. As a result, more than 3.1 billion-tons of coal were consumed in 2010 and about 50% of the total consumption was assigned to coal-fired power plants for electric supply [1]. The combustion of coal releases acidic pollutants (e.g., SO2 and NOx), which are detrimental to human health, harmful to ecosystems and responsible for several environmental problems such as acid rain, haze and photochemical smog [2,3,4,5]. According to recent studies, China has been the world’s largest SO2 emitting country, where several highly polluted regions have appeared, and coal-fired power plants have been considered as the most important source of SO2, due to its huge emissions and poor emission control regulation [6,7,8,9]. In order to improve air quality, the Chinese government has required all coal-fired power plants to install flue gas desulfurization (FGD) devices since 2005 and made a regulation that small power generation units should be closed gradually in the near future [10]. These aggressive steps might work when the installation of FGD is completed. However, there are two other factors that would weaken the net effect of emission control policy. On one hand, independent air quality monitoring networks in China are basically only located in larger cities, while monitoring instruments fixed at emission control devices are usually controlled by power plants themselves. Consequently, the operation rate of FGD is not guaranteed due to lack of public awareness and thirst for interest. On the other hand, some regulators in China are used to taking short-term emission restrictions before important events such as the 2008 Beijing Summer Olympics [11] and the 2010 Shanghai Expo [12], so that the emission always rebounds dramatically when the events are over. Therefore, more independent and reliable monitoring methods are necessary for verifying the effectiveness of SO2 emission control policies applied in power plants.
A series of satellite sensors applied in the past decades have offered alternative tools for studying trace gases in the troposphere [13,14,15]. Now, developments in satellite remote sensing instruments, such as the Total Ozone Mapping Spectrometer (TOMS) [16,17], Global Ozone Monitoring Experiment (GOME) [18,19], Scanning Imaging Absorption Spectrometer for Atmospheric Chartography (SCIAMACHY) [20,21] and Ozone Monitoring Instrument (OMI) [22,23] can make routine SO2 observations at high temporal and spatial resolution. In these instruments, OMI provides the best spatial resolution (13 × 24 km2), with daily global coverage and has been widely used to identify large anthropogenic SO2 sources [24,25,26,27,28,29,30]. According to the most recent studies, SO2 densities observed by satellite in China during 2008–2010 have showed a moderate decline and these results may indicate that the emission control policies have been successful in reducing concentrations of SO2 over highly polluted regions in China [31,32]. Unfortunately, the heavy haze events (i.e., heavy air pollution with deteriorated horizontal visibility) frequently occurred in the North China Plain (NCP) since 2011 have made the emission control policies doubtful again [33,34,35]. Since the regulatory action in emission control of China’s 11th Five Year Plan (2006–2010) would be examined at the end of 2010, a series of short-term emission restrictions have been applied again in coal-fired power plants to meet the plan required [36]. Therefore, the emission situation of power plants after 2010 is vitally important to investigate reasons for the heavy haze events occurred in NCP.
More recently, two satellite-based studies concerned about SO2 emission from large coal-fired power plants were reported by Fioletov et al. [37] and Lu et al. [38]. They demonstrated OMI had the capability to monitor the seasonal and inter-annual trend of SO2 emissions from those point sources in US and India. Moreover, reported by Li et al. [39], the reductions of SO2 emissions from larger coal-fired power plants attributed to FGD system in Inner Mongolia (northern China) have been observed by OMI during 2007–2008. In addition, according to China’s national regulations [40,41], the lowest removal efficiency of FGD systems should be above 85% and as a result the concentrations of SO2 over those areas around power plants would decrease dramatically. Hence, a long-run reduction of SO2 over those areas can be observed by OMI as long as the FGD devices running well. As far as we known, most of the literature reported before has paid scant attention to this field or the research details were ahead of 2010 and outdated [32,39]. So our work in this paper may update our knowledge of the SO2 emissions and find out the flaws in emission control policies already applied in China.
In this study, OMI planetary boundary layer (PBL) SO2 column densities were used to evaluate the effectiveness of SO2 emission reduction in Shanxi Province during 2005–2012, and the variation characteristics and evolution of SO2 densities over 22 regions with large coal-fired power plants (>500 MW) were analyzed. The purpose of this work is to demonstrate that the effectiveness of SO2 emission reduction policies applied in Shanxi (maybe in whole NCP) is not sufficient to achieve a significant decline in total SO2 emission or gain a great improvement on the air quality, and much more stringent regulations should be pushed out to reduce the great SO2 emissions still existed in Shanxi.

2. Data and Method

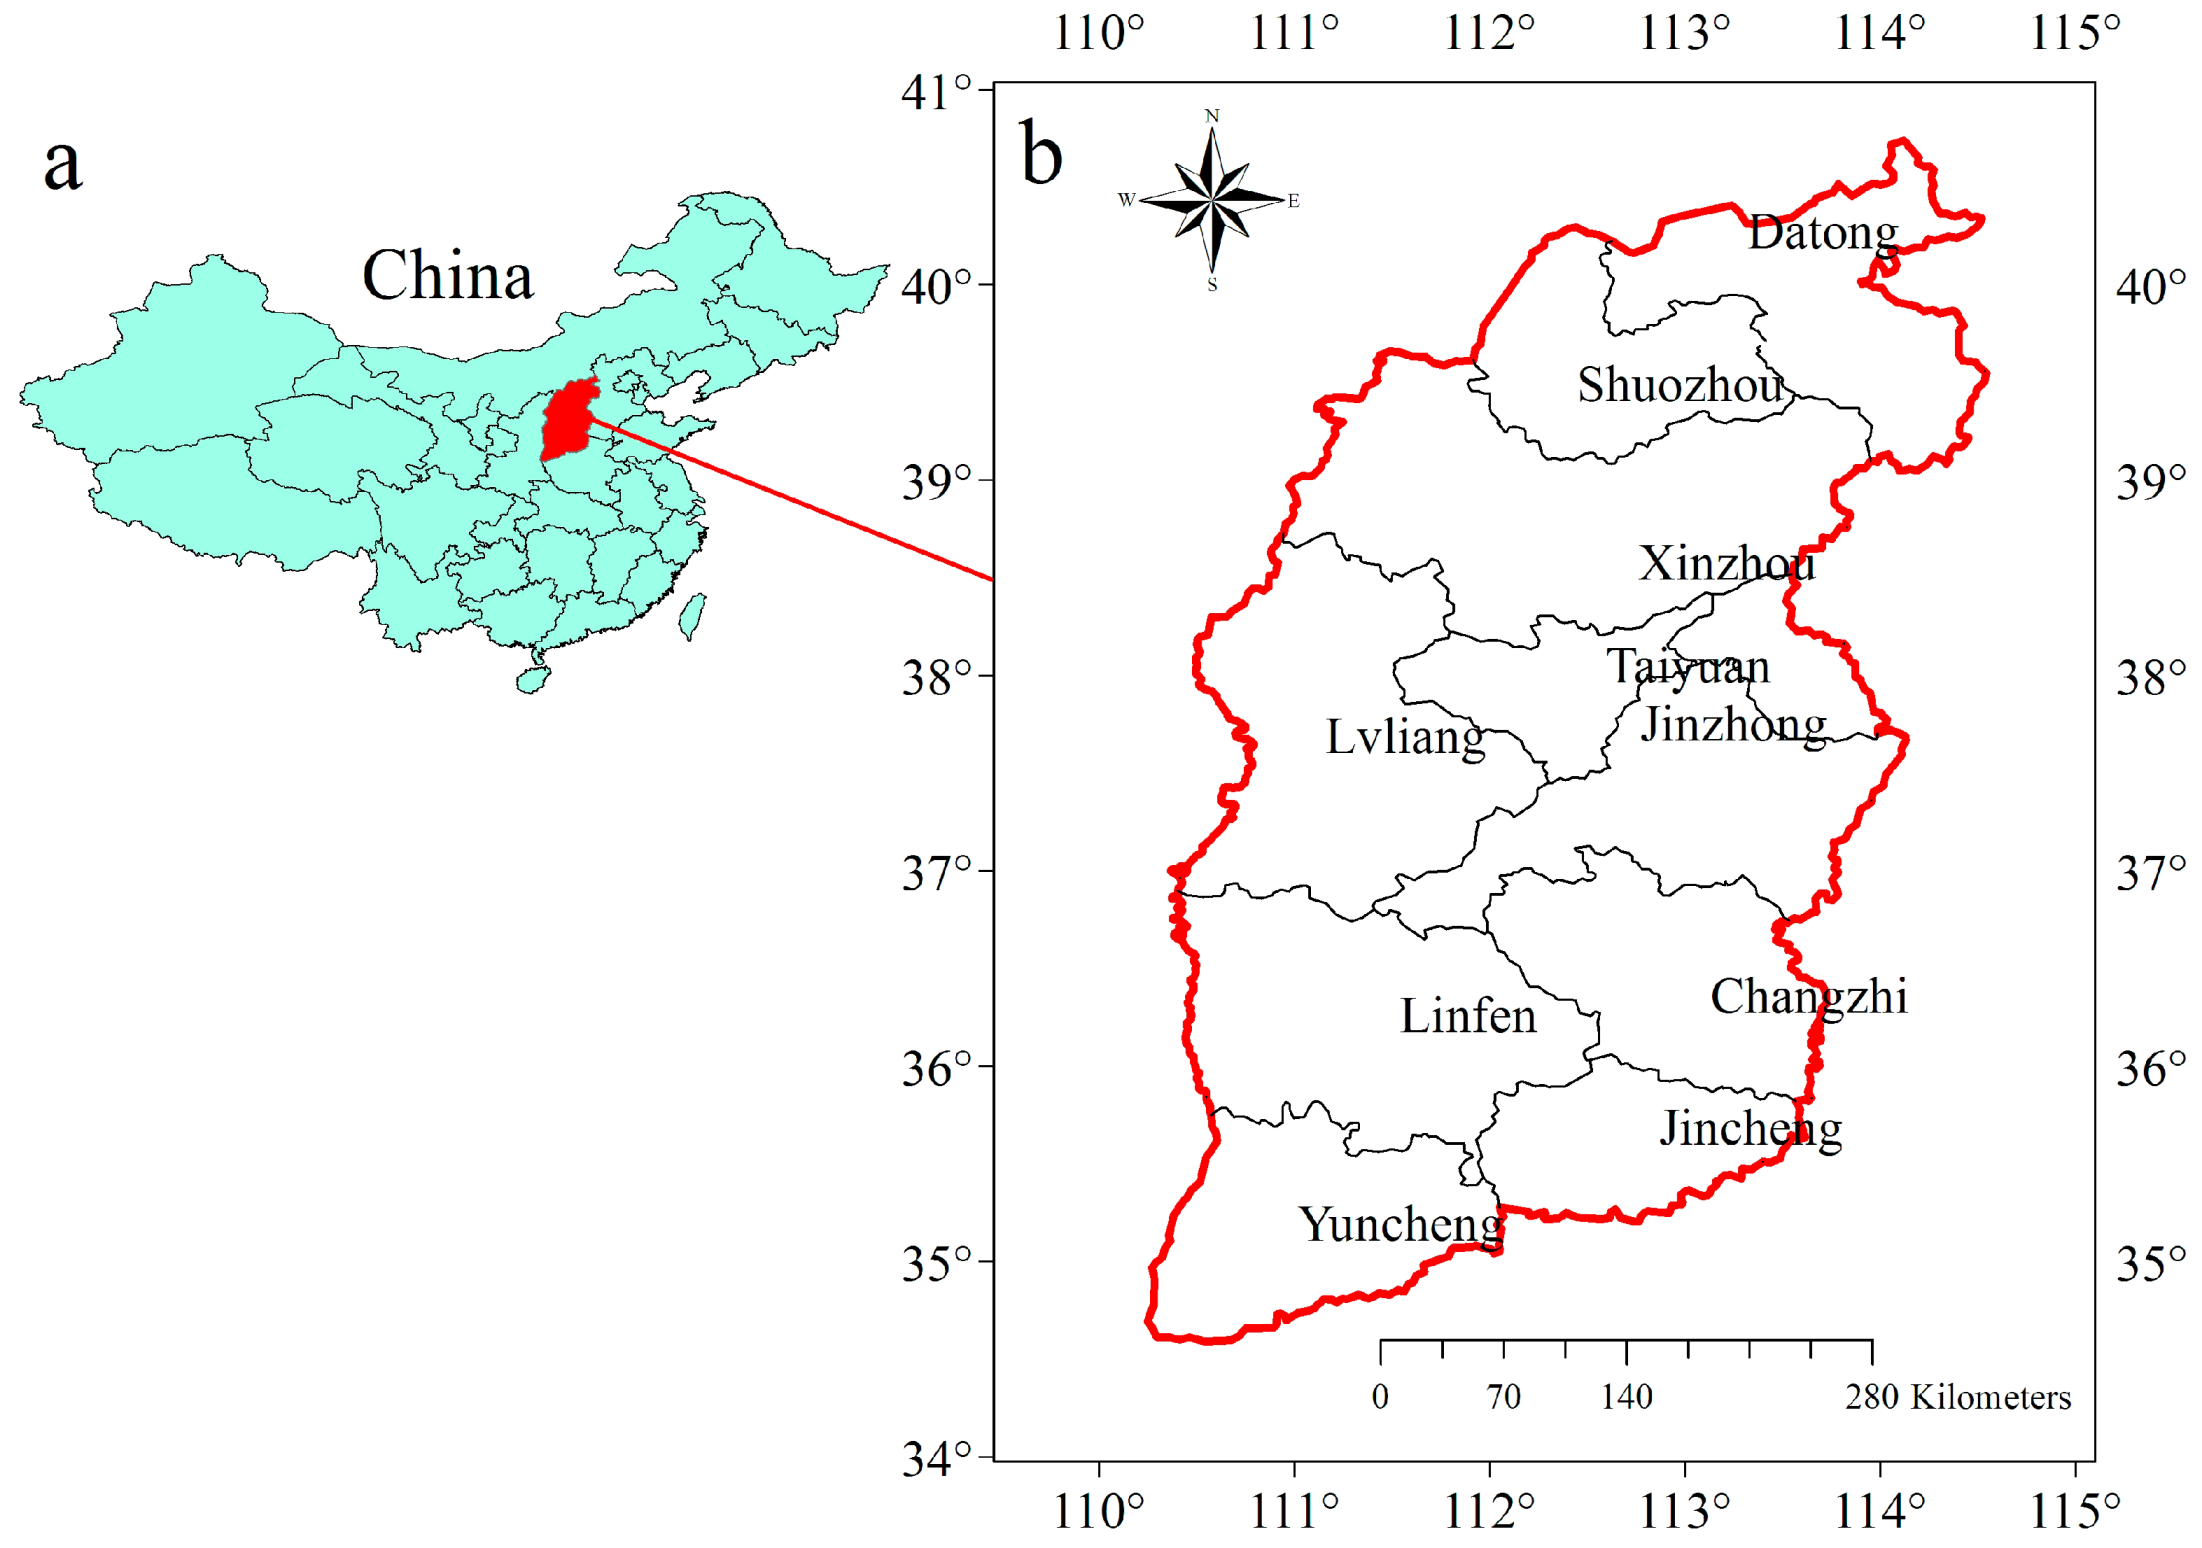
2.1. Site Description

Shanxi (34°34′–40°43′N, 110°14′–114°33′E) is located in northern China at the middle reaches of the Yellow River, bordered by Hebei to the east, Inner Mongolia to the north, Shaanxi to the west and Henan to the south (see Figure 1). Shanxi covers a surface of 156,000 km2 with 11 districts and is the richest province in coal resources in China with noteworthy fame in numerous coal-based industries. Shanxi is a very important electric power base fueled by coal and about 20% of generated electricity has been sent to eastern industrialized provinces during 2005–2012. SO2 is the key air pollutant in Shanxi and the coal-fired power plants have been considered the largest emission sources, which accounted for about 50% of the total SO2 emission in 2005, according to Department of Environmental Protection (DEP) of Shanxi [42]. The installation of FGD systems in coal-fired power plants was required in 2005 and some small power generation units have been closed since 2005. With the booming economy in China, a number of new power plants with generation capacity larger than 500 MW have been constructed in Shanxi during 2005–2012. At the end of 2012, there were 34 large coal-fired power plants operated in Shanxi [43]. The total annual coal-fired power generation in Shanxi during 2005–2012 has kept growing and no inter-annual decreases have been found, even in the economic recession of late 2008. However, as the proportion of larger units rose, the average annual operation hour of all coal-fired power generation units in Shanxi has dropped since 2005 [44] and only rebounded by approximate 6% during 2010–2011 (see Figure 2).
Figure 1. Location of Shanxi, China: (a) Location of Shanxi Province in China; (b) geographical distribution in Shanxi.
Atmosphere 05 00830 g001
It was reported by DEP of Shanxi that the total annual SO2 emissions in Shanxi during 2005–2012 were 1516, 1478, 1386, 1308, 1268, 1249, 1399 and 1301 kt, respectively. On the basis of DEP’s reports, a notable decreasing trend of SO2 emission has been found during 2005–2010, while just a moderate rebound of about 12% in inter-annual change occurred in 2011.

2.2. OMI SO2 Data and Processing

In this work, any adjacent plants sharing the same location (0.375 × 0.375°) were combined as a single source and then 22 regions were selected to verify the effect of FGD system on SO2 emission reduction by investigating the variation characteristics and evolution of mean SO2 densities over those areas during 2005–2012. A summary of selected regions is reported in Table 1 (shown in Section 3.2). The total capacity of power plants in Table 1 is 13,880 (2005) and 37,740 (2012) MW, which accounted for 60.2% (2005) and 75.3% (2012) of the total capacity of coal-fired power plants in Shanxi respectively. The proportion of power plants equipped with FGD systems in Table 1 is 8.6%, 23.9%, 44.8%, 81.7%, 90.3%, 92.1% and 100% during 2005–2012, respectively. The wet-FGD system is widely used by power plants in Table 1 while the circulating fluidized bed (CFB) dry-FGD system only accounts for 7% of the total capacity in 2012.
Figure 2. Power generation and average annual operation hour of coal-fired power plants in Shanxi during 2005–2012.
Atmosphere 05 00830 g002
The Dutch-Finish-built OMI is a nadir-viewing, UV-visible spectrometer aboard the NASA’s EOS/Aura satellite, which has been observing aerosols and trace gases (e.g., SO2, NO2) since 2004. The NASA’s standard OMI planetary boundary layer (PBL) SO2 density data-set is retrieved by using a Band Residual Difference (BRD) algorithm [45], validated against aircraft measurements over China [46]. The PBL SO2 data-set is specially developed for the anthropogenic SO2 emitting sources and the values are given in Dobson Units (DU, 1 DU = 2.69 × 1026 molecules/km2).
In this study, the PBL SO2 data from the OMSO2 L2G (V003) product were used, which are available at Goddard Earth Sciences Data and Information Services Center, and only the daily data belonging to the six warm months (including April–September) during 2005–2012 were included. To get reliable results, some further corrections were applied to the originally retrieved PBL SO2 data. First, the data was allocated to grid cells of 0.125° × 0.125° and filtered to remove data with large solar zenith angle (>70°), or relatively high cloud fraction (radiative cloud fraction > 0.2). Then, only data from rows 5 to 23 [0-based] were included in the analysis throughout all years, for some of the 60 cross-track positions measured by OMI have been affected by the so called “row anomaly” [47] since 2007. Finally, a similar approach reported by Fioletov et al. [37] was used by averaging all SO2 data centered within a 0.125 × 0.125° square from each pixel and pixels at a 0.025 × 0.025° grid were resampled for the whole Shanxi Area. Considering large-scale biases may still remain, a similar approach recently noted by Fioletov et al. [27] was used by assuming the tenth percentiles of SO2 observed values centered within a 3 × 3° square from each pixel as an estimate of the local bias and then local-bias corrections were applied for each year. The spatial distributions of the original and corrected mean SO2 values during 2011–2012 are presented in Figure 3, while results for the rest of the years are similar and plots are not shown.
Figure 3. Mean SO2 values (in DU) over Shanxi province during 2011–2012. Original data as well as data corrected are shown: (a) 2011-original; (b) 2011-corrected; (c) 2012-original; (d) 2012-corrected. Solid triangles and squares represent regions with already-operated and newly-built large coal-fired power plants.
Atmosphere 05 00830 g003

2.3. SO2 Emission Estimation

To compare with satellite-observed data, annual SO2 emissions from every power plant in Table 1 were estimated by using the unit-based method described by Zhao et al. [48] and a fraction F was also used as Li et al. did [39], to employ the same period data (i.e., the seasonal coal-fired power generation). The SO2 emission of power plant was calculated by the following equation:
E S O 2 = j 2.8 × U j × T j × E j × F × S × ( 1 S r ) × ( 1 η j ) × 10 6
where subscript j stands for different power unit; ESO2 is the SO2 emissions from all power generation units (kt); 2.8 is the mass scaling factor from standard coal to raw coal; U is the generation capacity (MW); T is the annual operation hour; E is specific coal consumption per unit electricity-supply (gce∙k∙Wh−1); F is the monthly fraction of annual total power generation; S is the sulfur content in coal; Sr is the sulfur retention in ash; η is the sulfur removal efficiency of the FGD devices.
The uncertainty in SO2 emission factors for Chinese power plants was approximate 7% described by Zhao et al. [49] by measuring the gaseous pollutant in situ at eight coal-fired power plants across China. In this work, we followed their findings and the S, Sr, η used in Equation (1) were set at 0.01, 0.1, 0.9 (for wet-FGD) and 0.8 (for CFB-dry-FGD), respectively. In addition, the SO2 emissions from other smaller coal-fired power plants (<500 MW) in Shanxi were also calculated by Equation (1), but the sulfur removal efficiency was treated as zero because the detailed information (e.g., location, generation capacity and emission control technology) has not been opened compared to the larger units.

3. Results and Discussion

3.1. Spatial-Temporal Variation Characteristics of SO2

The spatial-temporal distributions of mean SO2 densities observed by OMI in warm seasons over Shanxi during 2005–2012 are shown in Figure 4. Because the exact time when the FGD system of different power plants formally came into operation was random and scattered, a two-year mean SO2 density was used in Figure 4 in order to find more significant statistical variations in the satellite-observed data. The locations of large coal-fired power plants already operated and newly built in Table 1 were also marked in Figure 4.
It is clearly shown in Figure 4 that a significant decrease in SO2 densities over some regions can be found between 2009–2012 and 2005–2008 because of FGD’s wide operation and the decreases are more significant near the places with large power plants than in other places. We can even find that the SO2 densities over some regions halved in 2009–2012 compared to 2005–2006. Taiyuan, the capital city of Shanxi, seems to be the worst polluted district in Shanxi, for the SO2 density is higher than other districts obviously. A relative decrease in SO2 density can still be found over Taiyuan in 2009–2012 compared to 2005–2008, implying that the installation of FGD in large coal-fired power plants has succeeded in reducing total SO2 emissions, or the increasing trend of SO2 emissions in some regions in Shanxi may have been terminated.
Figure 4. Spatial distribution of Mean SO2 densities over Shanxi province during 2005–2012: (a) 2005–2006; (b) 2007–2008; (c) 2009–2010; (d) 2011–2012. Solid triangles and squares represent regions with operated and newly-built large coal-fired power plants.
Atmosphere 05 00830 g004
However, the two-year arithmetic mean SO2 densities of the whole Shanxi during 2005–2012 are 1.190, 1.195, 1.054 and 1.155 DU respectively, implying that the SO2 pollution in Shanxi has only showed a moderate improvement during 2009–2010. As mentioned before, there are too many coal-based industries in Shanxi and the SO2 emissions from large coal-fired power plants are part of the total emissions. Though the FGD system operated in power plants has gradually increased since 2005, the other SO2 emission sources have kept expanding with the economic developments (the growth rate of Gross Domestic Product in Shanxi approached 22.1% and 7.8% for 2011 and 2012 [1]). The characteristics of mean SO2 density of the whole Shanxi during 2005–2012 may imply that the emission control policy only applied in power plants is not enough to reverse the increasing trend of SO2 emissions in Shanxi.
We further investigated the values of SO2 densities and generation capacities of the selected regions. It has been found that the SO2 densities of regions with similar generation capacity vary significantly, implying that other SO2 emitting sources have played important roles in such regions with relatively higher SO2 densities.
According to satellite-observed SO2 densities shown in Figure 4, the polluted conditions over Shanxi during 2011–2012 have shown a rebound compared to 2009–2010 and we will discuss this phenomenon in the following sections.

3.2. Evolution of SO2 over Selected Regions

A summary of measured SO2 densities over 22 selected regions during 2005–2012 is reported in Table 1. Because the installation of FGD system became mandatory in 2005, those power plants operated before 2005 were basically run without FGD systems, while other plants newly built after 2006, were mostly run with FGD systems. This situation has given us an opportunity to find out the variation characteristics of SO2 densities over those regions, affected by the operation of FGD systems.
There are eight regions in Table 1 (marked “*”) where power plants are operated without FGD systems and significant decreases in SO2 densities of seven regions (except for Changzhi, where the total generation capacity expanded 3.1 times after 2006) can be found during 2008–2010 compared to 2005–2006, for the FGD systems started operation gradually. The arithmetic mean SO2 density over the seven regions during 2008–2010 shows a decrease of approximate 0.4 DU compared to 2005–2007. Though the mean SO2 density over the whole Shanxi shows poor improvements during 2005–2012, the decreases in SO2 densities over such seven regions can still demonstrate that the total SO2 emissions in these regions have been reduced successfully during 2008–2010 attributed to the FGD systems.
Since the emission intensity drops substantially attributed to the FGD systems, the SO2 densities over other regions with newly-built power plants after 2006, do not show a statistical increasing trend overall and some regions even show a decrease in SO2 densities during 2008–2010. It should be noted that the SO2 emissions may be reduced by a decrease in annual operation hour units. As already discussed, the annual operation hour of total coal-fired units has dropped since 2005. Anyhow, this contribution is negligible compared to the FGD systems case.
The mean SO2 densities over the 22 regions in Table 1 also show a moderate rebound of approximate 0.15 DU during 2011–2012 compared to 2009–2010. We will compare the OMI-observed data to emission inventory in the next section to investigate the variation.
Table 1. SO2 densities over the 22 selected regions with large coal-fired power plants in Shanxi during 2005–2012.
LocationOperated TimeSO2/DU
20052006200720082009201020112012
Changzhi *36.375°N, 113.125°E20051.1591.4901.7932.2432.0321.8362.2811.791
Yushe37°N, 113°E20050.9871.1451.1471.2741.4021.2861.4581.509
Datong *40°N, 113.25°E20052.2321.5111.9501.2420.7950.8661.1671.398
Yangcheng *35.375°N, 112.5°E20052.2491.1560.9581.6281.6651.6812.6512.036
Shuozhou *39.375°N, 112.5°E20051.6161.7951.4860.6791.5321.0281.2001.297
Taiyuan *37.75°N, 112.5°E20052.3952.6603.0302.4742.2191.7392.5871.673
Hequ *39.375°N, 111.25°E20050.9901.1060.8980.7860.9930.8440.7740.637
Pingding *37.75°N, 113.625°E20052.2321.7451.7391.5971.4491.2811.9881.085
Hejin *35.625°N, 110.625°E20052.3772.6062.4202.6082.1202.5892.4362.090
Huozhou36.125°N, 111.375°E20061.5821.6611.6701.5051.1051.2191.3031.481
Gujiao37.875°N, 112.125°E20061.8531.4031.7822.2681.8991.3861.6911.217
Wuxiang36.875°N, 112.875°E20071.0041.0171.4421.6031.8121.6511.8001.743
Yongji34.875°N, 110.5°E20071.7671.9532.3481.9731.3021.6251.3491.468
Ruicheng34.625°N, 110.25°E20081.5771.5271.8111.7321.5871.2121.3721.098
Liulin37.375°N, 110.875°E20080.9480.9370.8481.0441.1860.7671.2140.981
Jinzhong37.625°N, 112.75°E20101.9002.0132.2181.7711.6101.1751.9531.400
Yuanping38.875°N, 112.5°E20100.8490.9370.9970.7680.8320.9171.3071.268
LinFen36.5°N, 111.75°E20111.6521.7551.9101.4421.1631.5731.1241.871
Zezhou35.5°N, 113°E20111.9841.2001.2331.9021.7271.9542.1191.897
Zuoquan37.125°N, 113.375°E20120.5190.7310.5890.4640.5660.3311.1710.641
Youyu39.875°N, 112.5°E20120.7981.0000.8270.2220.9590.8750.7731.021
Shanyin39.625°N, 112.875°E20121.2471.7271.1651.0350.8790.8941.0301.223
* where power plants operated without FGD systems.

3.3. SO2 Emission by Inventory

In order to compare the OMI-observed trend with the SO2 emissions by inventory and find out the reason for the rebound in SO2 densities during 2011–2012, the annual SO2 emissions from larger power plants in Table 1 and other smaller units in Shanxi were calculated by Equation (1). The smaller units in Shanxi were combined as a single source and the total generation capacity opened in the China Electric Power Yearbook [44] was employed, because detailed information was not available. Given that the SO2 densities over regions are the signals of the total emissions, the annual emissions from all coal-fired power plants in the whole Shanxi were summed up to find out a more statistical variation trend in SO2 emissions.
Figure 5 shows the annual trend of SO2 emissions from Shanxi’s coal-fired power plants during 2005–2012 as well as the annual trend of mean SO2 densities over the 22 regions and the whole Shanxi. A notable decreasing trend in SO2 emissions can be found in Figure 5 and the decrement is more significant since 2008, for the proportion of FGD systems operated has risen to 81.7% at that time. Owning to the installation of FGD systems, SO2 emissions from power plants decreased rapidly by 49.8% from 698.7 to 351.1 kt during 2005–2012 and have maintained at a lower volume since 2008. The mean SO2 densities over the 22 regions and the whole Shanxi also show a decline between 2005–2007 and 2008–2010, while the declining trend belonging to power plants is more significant. Comparison of SO2 emissions and densities suggests that the reduction in SO2 emissions contributed to FGD systems can be distinguished by OMI observation. Hence, the increasing trend of SO2 emissions from coal-fired power plants in Shanxi has successfully been reversed during 2005–2010, verified by OMI observation and emission inventory.
Figure 5. SO2 emissions from coal-fired power plants in Shanxi during 2005–2012, as well as mean SO2 densities OMI-observed are shown.
Atmosphere 05 00830 g005
SO2 emissions calculated show a decline by approximate 50% between 2005 and 2012 while the value is 14% according to the report by DEP of Shanxi. Actually, the SO2 emissions belonging to coal-fired power plants after 2008 may drop lower than calculated, for many of the smaller units have FGD devices operated since 2008 (but the sulfur removal efficiency of them treated as zero in calculations). In view of the insufficiency of air quality monitoring networks, the official SO2 emissions reported by DEP of Shanxi are probably based on emission inventories to a great extent. As of the end of 2012, only SO2 emissions from coal-fired power plants are widely restricted and the other numerous emitting sources in Shanxi are not paid attention to yet. Therefore, the SO2 emission inventory used in the analysis might omit some particularly important factors contributed to the total emission in Shanxi, resulting in such great discrepancies between the two emission inventories. To be precise, we will discuss other emission sources that deserve special mention.

3.4. Other Emission Sources Contributed to SO2 Pollution

China has undergone a very rapid economic growth by increasing urbanization during the past decade. A great many industrial materials (e.g., cement, steel, coke and glass) have been consumed with the expansion of urban area. The manufacturing of these materials needs a considerable amount of energy (e.g., heat and electricity), basically fueled by coal. Owning to the tremendous coal reserves in Shanxi, an industrial mode specially based on coal has been developed rapidly and a large number of plants producing such materials, directly or indirectly fueled by coal, have come into operation during the past 10 years. Though not fueled by coal, the manufacturing process of glass in China is mostly fueled by heavy oil (usually with higher sulfur content than coal) and the decomposition of Na2SO4 (a clarifier widely used) releases SO2 pollutants as well [50]. Consequently, the huge consumption of such materials has created a substantial increment in SO2 emissions in Shanxi.
Figure 6 shows the variation trend of productions of four materials during 2005–2012 in Shanxi. A notable increasing trend in the productions of cement, crude steel, and glass can be found in Figure 6, with an increase of 124.6%, 113.7% and 150.7% in 2012 compared to 2006 respectively. In contrast, the production of coke is relatively stable during the past eight years. The rapid increases in such three materials have played an important role in the increasing SO2 emissions in Shanxi during 2005–2012, since the emissions from these sections have not been regulated yet. Hence, the total SO2 emissions in Shanxi during 2005–2012 has just shown a moderate decline, though the application of FGD among coal-fired power plants might have cut down about 50% in terms of SO2 emission compared to 2005 theoretically.
Figure 6. Relative Changes in the production of crude steel, coke, glass and Cement (already normalized to 2006), as well as variation of anthracite price during 2005–2012.
Atmosphere 05 00830 g006
Actually, because there is an electricity price control by governments in China, the profit on electricity sales for coal-fired power plant highly depend on the cost of coal. A significant increasing trend in anthracite price (a common benchmark in coal-fired power plants) during 2005–2012 can be found in Figure 6. Since the electricity price is adjusted more slowly than coal price (i.e., once the social inflation rate increase, the price adjustment is delayed for one or several years), the profit on electricity sales has dropped rapidly when coal prices increase. Because the electricity supply is always guaranteed by the governments, the electricity generation should go on even if the deficit has been ballooning. It is reported that a common deficit has occurred in the coal-fired power plants with a proportion of above 90% during 2011–2012 [44]. Because the operation of FGD systems is costly, some coal-fired power plants have cut down the operation rate of FGD systems for the sake of profit (Such things can be found in reports by Ministry of Environmental Protection of China). In addition, it is not punished by regulars, if the operation rate of FGD system is above 90% [51]. According to Equation (1), the emissions will double if the operation rate of FGD system shows a decrease of approximately 11%. Though the regulators in China have punished some power plants in the past five years, these illegalities still have not been terminated even in 2013 [52]. The large coal-fired power plant located in Yangcheng, one of the 22 regions selected in this study, has cut down the operation rate of FGD to 62%–80% in recent years reported by MEP of China. As shown in Table 1, the mean SO2 densities over Yangcheng also rebounded for about 0.7 DU between 2011–2012 and 2008–2010. This situation cannot been estimated precisely for lack of independent air quality monitoring networks. Therefore, the SO2 emission reduction policy applied in Shanxi (maybe in whole NCP) is not sufficient to achieve a significant decline in total SO2 emissions or gain a great improvement in the air quality, for all reasons already discussed.

4. Conclusions

(i) The analysis shows that the installation of FGD systems was successful in reducing SO2 emissions from larger coal-fired power plants in general and the increasing trend of total SO2 emissions slow down in the whole Shanxi is attributed to this policy during 2005–2012.
(ii) By investigating the developments of other emission sources in Shanxi, it is considered that the rapid expansion of industries with high coal-consumption has played an important role for the increase of SO2 emissions during 2005–2012. The total SO2 emissions in the whole Shanxi may show an increasing trend again if these emission sources are not regulated in near future.
(iii) The unwelcomed experience in reducing operation rate of FGD systems on purpose occurring in some coal-fired power plants has contaminated the effectiveness of SO2 emission reduction policy applied in Shanxi. An independent air quality monitoring network is very important for ensuring the effectiveness of emission control policies and a national-wide network should be constructed as soon as possible in the near future.

Acknowledgments

The data used in this paper were acquired as part of the activities of NASA’s Science Mission Directorate, and are archived and distributed by the Goddard Earth Sciences (GES) Data and Information Services Center (DISC). The author gratefully acknowledges the providing OMI data. The authors wish to thank the anonymous reviewers for their comments.

Author Contributions

The work has been performed in collaboration between all the authors. Huaxiang Song carried out experiments, analyzed the data, interpreted the results and wrote the paper. Minhua Yang edited and approved the final paper. All authors have contributed to, seen and approved the manuscript.

Conflicts of Interest

The authors declare no conflict of interest.

References

  1. National Bureau of Statistics. In China Statistical Yearbook 2005–2012; China Statistics Press: Beijing, China, 2013. (In Chinese)
  2. Jaeglé, L.; Jacob, D.J.; Wang, Y.; Weinheimer, A.J.; Ridley, B.A.; Campos, T.L.; Sachse, G.W.; Hagen, D.E. Sources and chemistry of NOx in the upper troposphere over the United States. Geophys. Res. Lett. 1998, 25, 1705–1708. [Google Scholar] [CrossRef]
  3. Strouda, C.; Madronicha, S.; Atlasa, E.; Ridleya, B.; Flockea, F.; Weinheimera, A.; Talbotb, B.; Frieda, A.; Werta, B.; Shetter, R.; et al. Photochemistry in the arctic free troposphere: NOx budget and the role of odd nitrogen reservoir recycling. Atmos. Environ. 2003, 37, 3351–3364. [Google Scholar] [CrossRef]
  4. Badr, O.; Probert, S.D. Atmospheric sulphur: Trends, sources, sinks and environmental impacts. Appl. Energy 1994, 47, 1–67. [Google Scholar] [CrossRef]
  5. Zhao, Y.; Duan, L.; Xing, J.; Larssen, T.; Nielsen, C.P.; Hao, J. Soil acidification in China: Is controlling SO2 emissions enough? Environ. Sci. Technol. 2009, 43, 8021–8026. [Google Scholar] [CrossRef]
  6. Ohara, T.; Akimoto, H.; Kurokawa, J.; Horii, N.; Yamaji, K.; Yan, X.; Hayasaka, T. An Asian emission inventory of anthropogenic emission sources for the period 1980–2020. Atmos. Chem. Phys. 2007, 7, 4419–4444. [Google Scholar] [CrossRef]
  7. Gao, C.; Yin, H.; Ai, N.; Huang, Z. Historical analysis of SO2 pollution control policies in China. Environ. Manag. 2009, 43, 447–457. [Google Scholar] [CrossRef]
  8. Zhang, Q.; Streets, D.G.; Carmichael, G.R.; He, K.B.; Huo, H.; Kannari, A.; Klimont, Z.; Park, I.S.; Reddy, S.; Fu, J.S.; et al. Asian emissions in 2006 for the NASA INTEX-B mission. Atmos. Chem. Phys. 2009, 9, 5131–5153. [Google Scholar] [CrossRef]
  9. Lu, Z.; Zhang, Q.; Streets, D.G. Sulfur dioxide and primary carbonaceous aerosol emissions in China and India, 1996–2010. Atmos. Chem. Phys. 2011, 11, 9839–9864. [Google Scholar] [CrossRef]
  10. Schreifels, J.J.; Fu, Y.; Wilson, E.J. Sulfur dioxide control in China: Policy evolution during the 10th and 11th Five-Year Plans and lessons for the future. Energy Policy. 2012, 48, 779–789. [Google Scholar] [CrossRef]
  11. Witte, J.C.; Schoeberl, M.R.; Douglass, A.R.; Gleason, J.F.; Krotkov, N.A.; Gille, J.C.; Pickering, K.E.; Livesey, N. Satellite observations of changes in air quality during the 2008 Beijing Olympics and Paralympics. Geophys. Res. Lett. 2009. [Google Scholar] [CrossRef]
  12. Hao, N.; Valks, P.; Loyola, D.; Cheng, Y.F.; Zimmer, W. Space-Based measurements of air quality during the World Expo 2010 in Shanghai. Environ. Res. Lett. 2011. [Google Scholar] [CrossRef]
  13. Simonds, M.; Xiao, H.; Levine, S.P. Optical remote sensing for air pollutants-review. Am. Ind. Hyg. Assoc. J. 1994, 55, 953–965. [Google Scholar] [CrossRef] [PubMed]
  14. Martin, R.V. Satellite remote sensing of surface air quality. Atmos. Environ. 2008, 42, 7823–7843. [Google Scholar] [CrossRef]
  15. Kidd, C.; Levizzani, V.; Bauer, P. A review of satellite meteorology and climatology at the start of the twenty-first century. Prog. Phys. Geogr. 2009, 33, 474–489. [Google Scholar] [CrossRef]
  16. Krueger, A.J.; Walter, L.S.; Schnetzler, C.C.; Doiron, S.D. TOMS measurement of the sulfur dioxide emitted during the 1985 Nevado del Ruiz eruptions. J. Volcanol. Geotherm. Res. 1990, 41, 7–15. [Google Scholar] [CrossRef]
  17. Bluth, G.J.; Doiron, S.D.; Schnetzler, C.C.; Krueger, A.J.; Walter, L.S. Global tracking of the SO2 clouds from the June, 1991 Mount Pinatubo eruptions. Geophys. Res. Lett. 1992, 19, 151–154. [Google Scholar] [CrossRef]
  18. Eisinger, M.; Burrows, J.P. Tropospheric sulfur dioxide observed by the ERS-2 GOME instrument. Geophys. Res. Lett. 1998, 25, 4177–4180. [Google Scholar] [CrossRef]
  19. Thomas, W.; Erbertseder, T.; Ruppert, T.; van Roozendael, M.; Verdebout, J.; Balis, D.; Meleti, C.; Zerefos, C. On the retrieval of volcanic sulfur dioxide emissions from GOME backscatter measurements. J. Atmos. Chem. 2005, 50, 295–320. [Google Scholar] [CrossRef]
  20. Bovensmann, H.; Burrows, J.P.; Buchwitz, M.; Frerick, J.; Noël, S.; Rozanov, V.V.; Chance, K.V.; Goede, P.H. SCIAMACHY: Mission objectives and measurement modes. J. Atmos. Sci. 1999, 56, 127–150. [Google Scholar]
  21. Lee, C.; Martin, R.V.; van Donkelaar, A.; O’Byrne, G.; Krotkov, N.; Richter, A.; Huey, L.G.; Holloway, J.S. Retrieval of vertical columns of sulfur dioxide from SCIAMACHY and OMI: Air mass factor algorithm development, validation, and error analysis. J. Geophys. Res. 2009. [CrossRef]
  22. Carn, S.A.; Krueger, A.J.; Krotkov, N.A.; Yang, K.; Levelt, P.F. Sulfur dioxide emissions from Peruvian copper smelters detected by the Ozone Monitoring Instrument. Geophys. Res. Lett. 2007. [Google Scholar] [CrossRef]
  23. Yang, K.; Krotkov, N.A.; Krueger, A.J.; Carn, S.A.; Bhartia, P.K.; Levelt, P.F. Retrieval of large volcanic SO2 columns from the aura Ozone Monitoring Instrument: Comparison and limitations. J. Geophys. Res. 2007. [Google Scholar] [CrossRef]
  24. Georgoulias, A.K.; Balis, D.; Koukouli, M.E.; Meleti, C.; Bais, A.; Zerefos, C. A study of the total atmospheric sulfur dioxide load using ground-based measurements and the satellite derived Sulfur Dioxide Index. Atmos. Environ. 2008, 43, 1693–1701. [Google Scholar] [CrossRef]
  25. Carn, S.A.; Krueger, A.J.; Krotkov, N.A.; Yang, K.; Evans, K. Tracking volcanic sulfur dioxide clouds for aviation hazard mitigation. Nat. Hazards 2009, 51, 325–343. [Google Scholar] [CrossRef]
  26. Lee, C.; Martin, R.V.; van Donkelaar, A.; Lee, H.; Dickerson, R.R.; Hains, J.C.; Krotkov, N.; Richter, A.; Vinnikov, K.; Schwab, J.J. SO2 emissions and lifetimes: Estimates from inverse modeling using in situ and global, space-based (SCIAMACHY and OMI) observations. J. Geophys. Res. 2011. [Google Scholar] [CrossRef]
  27. Fioletov, V.E.; McLinden, C.A.; Krotkov, N.; Yang, K.; Loyola, D.G.; Valks, P.; Theys, N.; Van Roozendael, M.; Nowlan, C.R.; Chance, K.; et al. Application of OMI, SCIAMACHY, and GOME-2 satellite SO2 retrievals for detection of large emission sources. J. Geophys. Res.: Atmos. 2013, 118, 11399–11418. [Google Scholar] [CrossRef]
  28. Xue, L.; Ding, A.; Gao, J.; Wang, T.; Wang, W.; Wang, X.; Lei, H.; Jin, D.; Qi, Y. Aircraft measurements of the vertical distribution of sulfur dioxide and aerosol scattering coefficient in China. Atmos Environ. 2010, 44, 278–282. [Google Scholar] [CrossRef]
  29. He, H.; Li, C.; Loughner, C.P.; Li, Z.; Krotkov, N.A.; Yang, K.; Wang, L.; Zheng, Y.; Bao, X.; Zhao, G.; et al. SO2 over central China: Measurements, numerical simulations and the tropospheric sulfur budget. J. Geophys. Res. 2012. [Google Scholar] [CrossRef]
  30. Jiang, J.; Zha, Y.; Gao, J.; Jiang, J. Monitoring of SO2 column concentration change over China from Aura OMI data. Int. J. Remote Sens. 2012, 33, 1934–1942. [Google Scholar] [CrossRef]
  31. Lu, Z.; Streets, D.G.; Zhang, Q.; Wang, S.; Carmichael, G.R.; Cheng, Y.F.; Wei, C.; Chin, M.; Diehl, T.; Tan, Q. Sulfur dioxide emissions in China and sulfur trends in East Asia since 2000. Atmos. Chem. Phys. 2010, 10, 6311–6331. [Google Scholar] [CrossRef]
  32. Tian, H.; Liu, K.; Zhou, J.; Lu, L.; Hao, J.; Qiu, P.; Gao, J.; Zhu, C.; Wang, K.; Hua, S. Atmospheric emission inventory of hazardous trace elements from China’s coal-fired power plants—Temporal trends and spatial variation characteristics. Environ. Sci. Technol. 2014, 48, 3575–3582. [Google Scholar] [CrossRef] [PubMed]
  33. Wang, L.; Xu, J.; Yang, J.; Zhao, X.; Wei, W.; Cheng, D.; Pan, X.; Su, J. Understanding haze pollution over the southern Hebei area of China using the CMAQ model. Atmos. Environ. 2012, 56, 69–79. [Google Scholar] [CrossRef]
  34. Wang, H.; Tan, S.C.; Wang, Y.; Jiang, C.; Shi, G.Y.; Zhang, M.X.; Che, H.Z. A multisource observation study of the severe prolonged regional haze episode over eastern China in January 2013. Atmos. Environ. 2014, 89, 907–815. [Google Scholar]
  35. Quan, J.; Tie, X.; Zhang, Q.; Liu, Q.; Li, X.; Gao, Y.; Zhao, D. Characteristics of heavy aerosol pollution during the 2012–2013 winter in Beijing, China. Atmos. Environ. 2014, 88, 83–89. [Google Scholar] [CrossRef]
  36. General Office of the State Council. Urgent Circular on Assuring the Supply of Electricity for Civil Living and Generation and Utilization of Electricity in Regular Order. Available online: http://www.gov.cn/zwgk/2010-11/23/content_1751457.htm (accessed on 30 July 2014). (In Chinese)
  37. Fioletov, V.E.; McLinden, C.A.; Krotkov, N.; Moran, M.D.; Yang, K. Estimation of SO2 emissions using OMI retrievals. Geophys. Res. Lett. 2011. [Google Scholar] [CrossRef]
  38. Lu, Z.; Streets, D.G.; de Foy, B.; Krotkov, N.A. Ozone monitoring instrument observations of interannual increases in SO2 emissions from Indian coal-fired power plants during 2005–2012. Environ. Sci. Technol. 2013, 47, 13993–14000. [Google Scholar] [CrossRef] [PubMed]
  39. Li, C.; Zhang, Q.; Krotkov, N.A.; Streets, D.G.; He, K.; Tsay, S.C.; Gleason, J.F. Recent large reduction in sulfur dioxide emissions from Chinese power plants observed by the Ozone Monitoring Instrument. Geophys. Res. Lett. 2010. [Google Scholar] [CrossRef]
  40. Ministry of Environmental Protection. HJ/T178–2005 Flue Gas Circulation Fluidized Bed Desulfurization Project Technical Specification of Thermal Power Plant; China Environment Science Press: Beijing, China, 2005. (In Chinese) [Google Scholar]
  41. Ministry of Environmental Protection. HJ/T179–2005 Flue Gas Limestone/Limegypsum Desulfurization Project Technical Specification of Thermal Power Plant; China Environment Science Press: Beijing, China, 2005. (In Chinese) [Google Scholar]
  42. Department of Environmental Protection of Shanxi. 2005 Report on the State of Environment in Shanxi: Atmosphere. Available online: http://www.sxhb.gov.cn/news.do?action=info&id=4101 (accessed on 30 July 2014). (In Chinese)
  43. Ministry of Environmental Protection. Circular on Publishing the Key Projects for Atmospheric Pollution Reduction such as Desulfurization and Denitration Devices of Coal-Fired Equipments. Available online: http://www.mep.gov.cn/gkml/hbb/bgg/201305/t20130506_251654.htm (accessed on 30 July 2014). (In Chinese)
  44. Editorial Committee of China Electric Power Yearbook. China Electric Power Yearbook 2005–2013; China Electric Power Press: Beijing, China, 2013. (In Chinese) [Google Scholar]
  45. Krotkov, N.A.; Carn, S.A.; Krueger, A.J.; Bhartia, P.K.; Yang, K. Band Residual Difference Algorithm for Retrieval of SO2 From the Aura Ozone Monitoring Instrument (OMI). IEEE Trans. Geosci. Remote Sens. 2006, 44, 1259–1266. [Google Scholar] [CrossRef]
  46. Krotkov, N.A.; McClure, B.; Dickerson, R.R.; Carn, S.A.; Li, C.; Bhartia, P.K.; Yang, K.; Krueger, A.J.; Li, Z.; Levelt, P.F.; et al. Validation of SO2 retrievals from the Ozone Monitoring Instrument over NE China. J. Geophys. Res. 2008. [Google Scholar] [CrossRef]
  47. OMI Row Anomaly Team. Background Information about the Row Anomaly in OMI. Available online: http://www.knmi.nl/omi/research/product/rowanomaly-background.php (accessed on 30 July 2014).
  48. Zhao, Y.; Wang, S.; Duan, L.; Lei, Y.; Cao, P.; Hao, J. Primary air pollutant emissions of coal-fired power plants in China: Current status and future prediction. Atmos. Environ. 2008, 42, 8442–8452. [Google Scholar] [CrossRef]
  49. Zhao, Y.; Wang, S.; Nielsen, C.P.; Li, X.; Hao, J. Establishment of a database of emission factors for atmospheric pollutants from Chinese coal-fired power plants. Atmos. Environ. 2010, 44, 1515–1523. [Google Scholar] [CrossRef]
  50. Shi, F.; Zhao, J.; Liu, W. The generated and control measures on the glass furnace flue gas discussion on the origin and regulation steps of SO2 in flue gas. Glass 2009, 6, 23–25. (In Chinese) [Google Scholar]
  51. National Development and Reform Commission/Ministry of Environmental Protection. Measures on the Management of the Desulfured Electricity Price of Coal-Fired Generation Units and the Operation of Desulfurization Devices. Available online: http://www.zhb.gov.cn/gkml/hbb/gwy/200910/W020070613292631585823.pdf (accessed on 30 July 2014). (In Chinese)
  52. Ministry of Environmental Protection. Circular on Punishments for Companies with Prominent Problems on Flue Gas Desulfurization Devices in 2013. Available online: http://www.mep.gov.cn/gkml/hbb/bgg/201406/t20140612_276862.htm (accessed on 30 July 2014). (In Chinese)

