1. Introduction
Forest fires in dry dipterocarp forest (DDF) occur in Thailand during the dry season, from December to April, when trees shed their leaves, and consequently, the leaf litter can accumulate quickly, and then serve as perfect fuel for burnings to be set by local communities. Fires of tropical deciduous forests, including dry dipterocarp forest and mixed deciduous forest in Thailand are generally man-made. The reasons frequently recorded by forest fire control stations are (1) to facilitate the gathering of non-timber forest product, (2) to ease the access to forest for hunting, and (3) to help land clearing for crop cultivation [
1]. The type of fires occurred in DDF is characterized as surface fire, since the fuel is composed of biomass present on the ground surface of the forest, including leaf litter, twig, grass, undergrowth, shrub, climber, and seedling. The leaf litter constitutes the major component of biomass fuel. Studies on fuel consumption indicated that about 95% of biomass fuels in DDF are consumed by surface fires [
2].
Regarding impacts of fires on the ecosystem, it was shown that the frequency of fire can drastically modify the structure and composition of aboveground biomass and affect the carbon cycle. Actually, the more frequent is the burning the lower is the growth rate. It was observed that in the annually burned area, the increase of tree diameter and basal area was lower than that of biennially, which was lower than that of triennially burned, with only 0.237 cm∙y
−1 and 0.0007 m∙y
−1, respectively. Concerning the survival to fire which depends on the base diameter, it was found that the seedlings with base diameter less than 1 cm were completely dead after the fire passage [
3]. It was revealed that fires directly affect biomass fuel characteristics, as well as underneath soil properties and nutrients dynamics [
4]. Indeed, the heat from fires distresses insects on the ground or under the bark wood, and activates the natural regeneration and undergrowth development [
3]. Although their adverse effects, it should be noted that fires play an important role in tropical deciduous forest management, because they enable to maintain its plant structure and ecosystem.
On the other hand, emissions from forest fires strongly affect air quality. They include air pollutants and climate forcers such as carbon monoxide (CO), methane (CH4), nitrous oxide (N2O), fine particulate matter (PM10 and PM2.5), carbonaceous aerosols composed of black carbon (BC) and organic carbon (OC), etc. While these compounds adversely impact the local air quality and long-term climate change, documentations on qualitative and quantitative characteristics of the emissions from dry dipterocarp forest fires in Thailand are still very scarce or inexistent.
In this study, we investigated the emission factor of black carbon from dry dipterocarp forest fires, by burning the leaf litter, which constitutes the major biomass fuel type. The estimation of the carbon dioxide, carbon monoxide, aerosols and carbon content in the biomass fuel and burned residues are presented. The amount of carbon released to the atmosphere and emission factor estimation of black carbon based on the carbon mass balance method of the combustion reaction was then presented and discussed.
2. Materials and Methods
2.1. Study Site Description
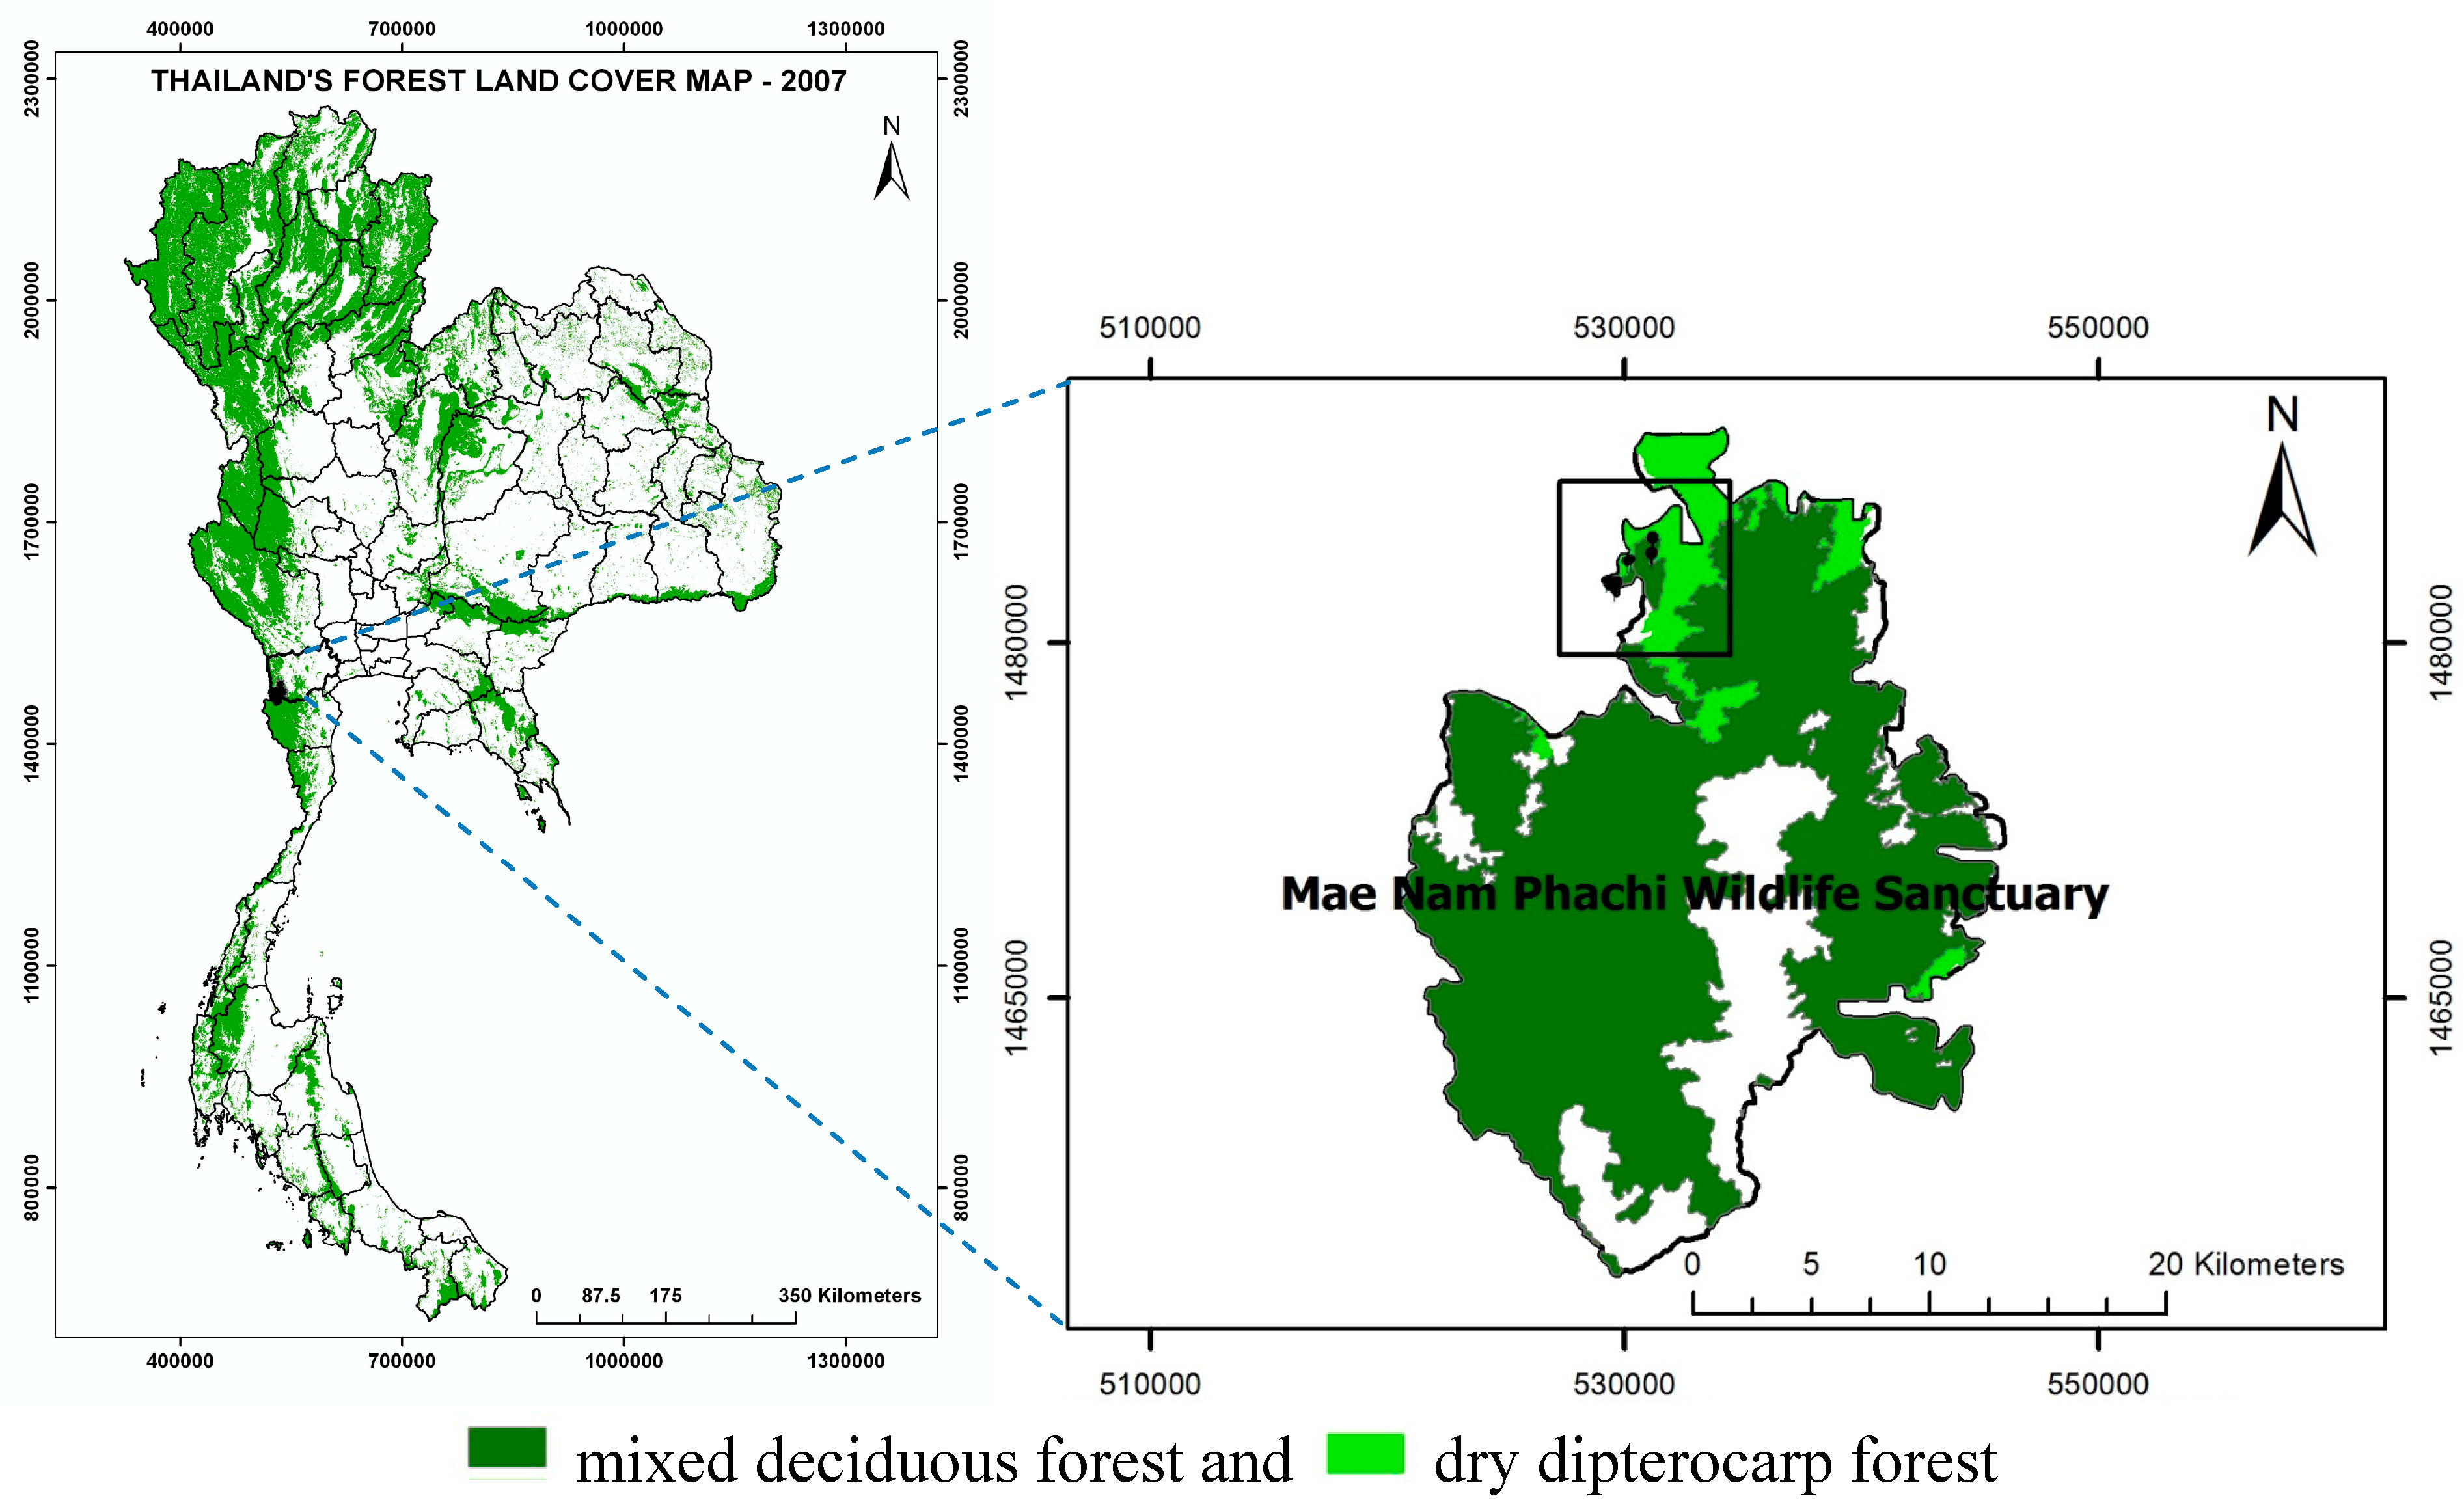
Mae Nam Phachi wildlife sanctuary is located in Ratchaburi province, about 215 km far from Bangkok, in the western region of Thailand. It is lied between 13°8′N to 13°27′N latitude and 99°10′E to 99°25′E longitude, on a high mountain covering the Suan Pueng district, Khing Amphoe Ban Kha and Park Tho district, close to the border of Thailand and Myanmar, and the altitude for this area ranges from 200 to 1400 m above the sea level. This wildlife sanctuary has a total area of 489 km
2, and the forest types included therein are composed of dry evergreen forest, dry dipterocarp forest, mixed deciduous forest (
Figure 1) and pure stand bamboo forest.
In DDF, the research study of Chaiyo
et al. [
5] reported that the dominant species are
Shorea obtusa,
S. siamensis,
Lannea coromandelica and
Dipterocarpus obtusifolius. The tree density in steep slope and terrain slope is 2350 ± 354 and 1225 ± 71 individuals∙ha
−1, respectively. The aboveground biomass in steep slope and terrain slope is 91.96 and 30.95 tonnes∙ha
−1, respectively. The surface biomass is mainly composed of leaf litter,
i.e., with coverage higher than 90% in volume and mass, that can be consumed to release the pollutants into the atmosphere.
Figure 1.
Location of Mae Nam Phachi wildlife sanctuary, Ratchaburi Province, Thailand.
Figure 1.
Location of Mae Nam Phachi wildlife sanctuary, Ratchaburi Province, Thailand.
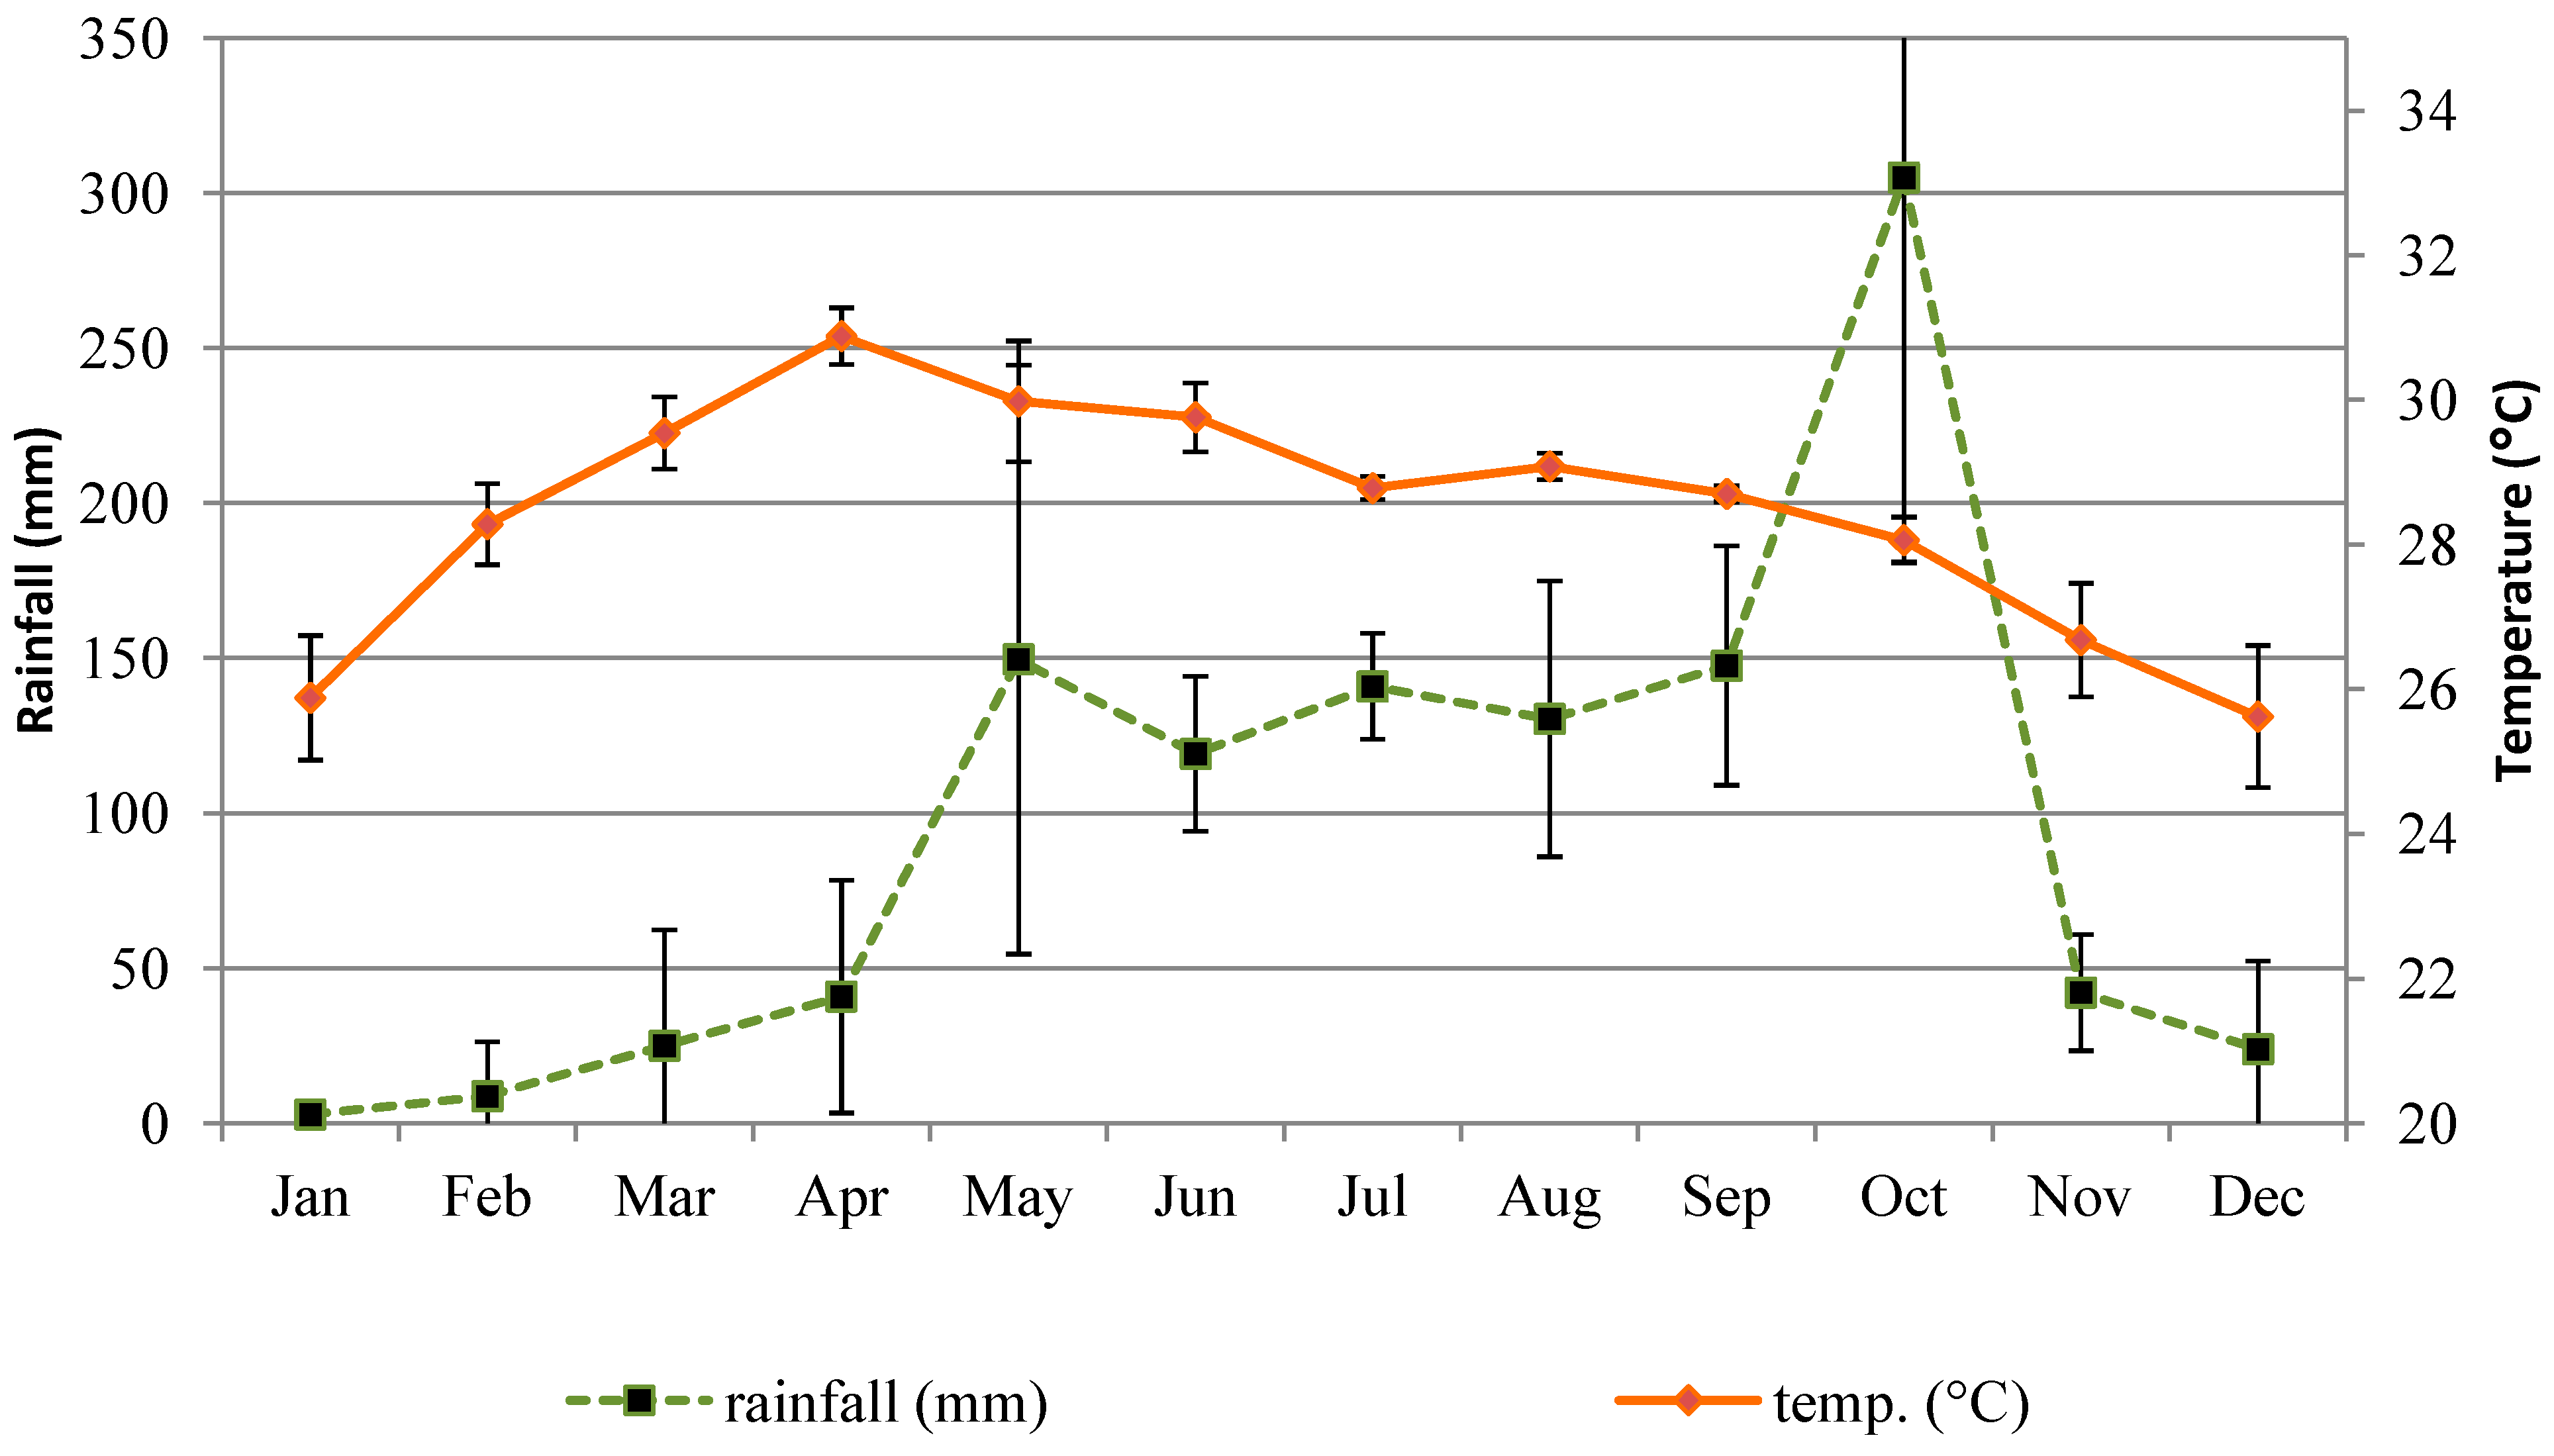
In Ratchaburi Province, the average total rainfall and mean temperature during 2005 to 2009, were 959 to 1285 mm and 28 °C, respectively, as reported by the Ratchaburi meteorological station. The peak of temperature during dry seasons, especially in April, lied between 30.3 to 31.3 °C. On the other hand, December was the coolest month with temperature ranges from 24.5 to 26.9 °C. January corresponded to the driest month with a total rainfall lesser than 6.5 mm rainfall, while October constituted the wettest month with 117.6 to 441.5 mm of rainfall (
Figure 2).
The experimental plots were set during dry season, i.e., in February to March. Three experimental plots of 40-m × 40-m plots were set in DDF. DDF1 and DDF2 were located in steep slope (i.e., slope ranging from 20 to 40%) and DDF3 in terrain slope, respectively. The prescribed fire was set in DDF1, and the overall burning occurred in steep slope. The surface biomass fuel was sampled from the three plots.
Figure 2.
Average annual temperature and rainfall profiles in Ratchaburi Province based on records from meteorological station during 2005 to 2009.
Figure 2.
Average annual temperature and rainfall profiles in Ratchaburi Province based on records from meteorological station during 2005 to 2009.
2.2. Surface Biomass Sampling
The surface biomass in this study was composed of leaf litter, twig, seedling, and understory (
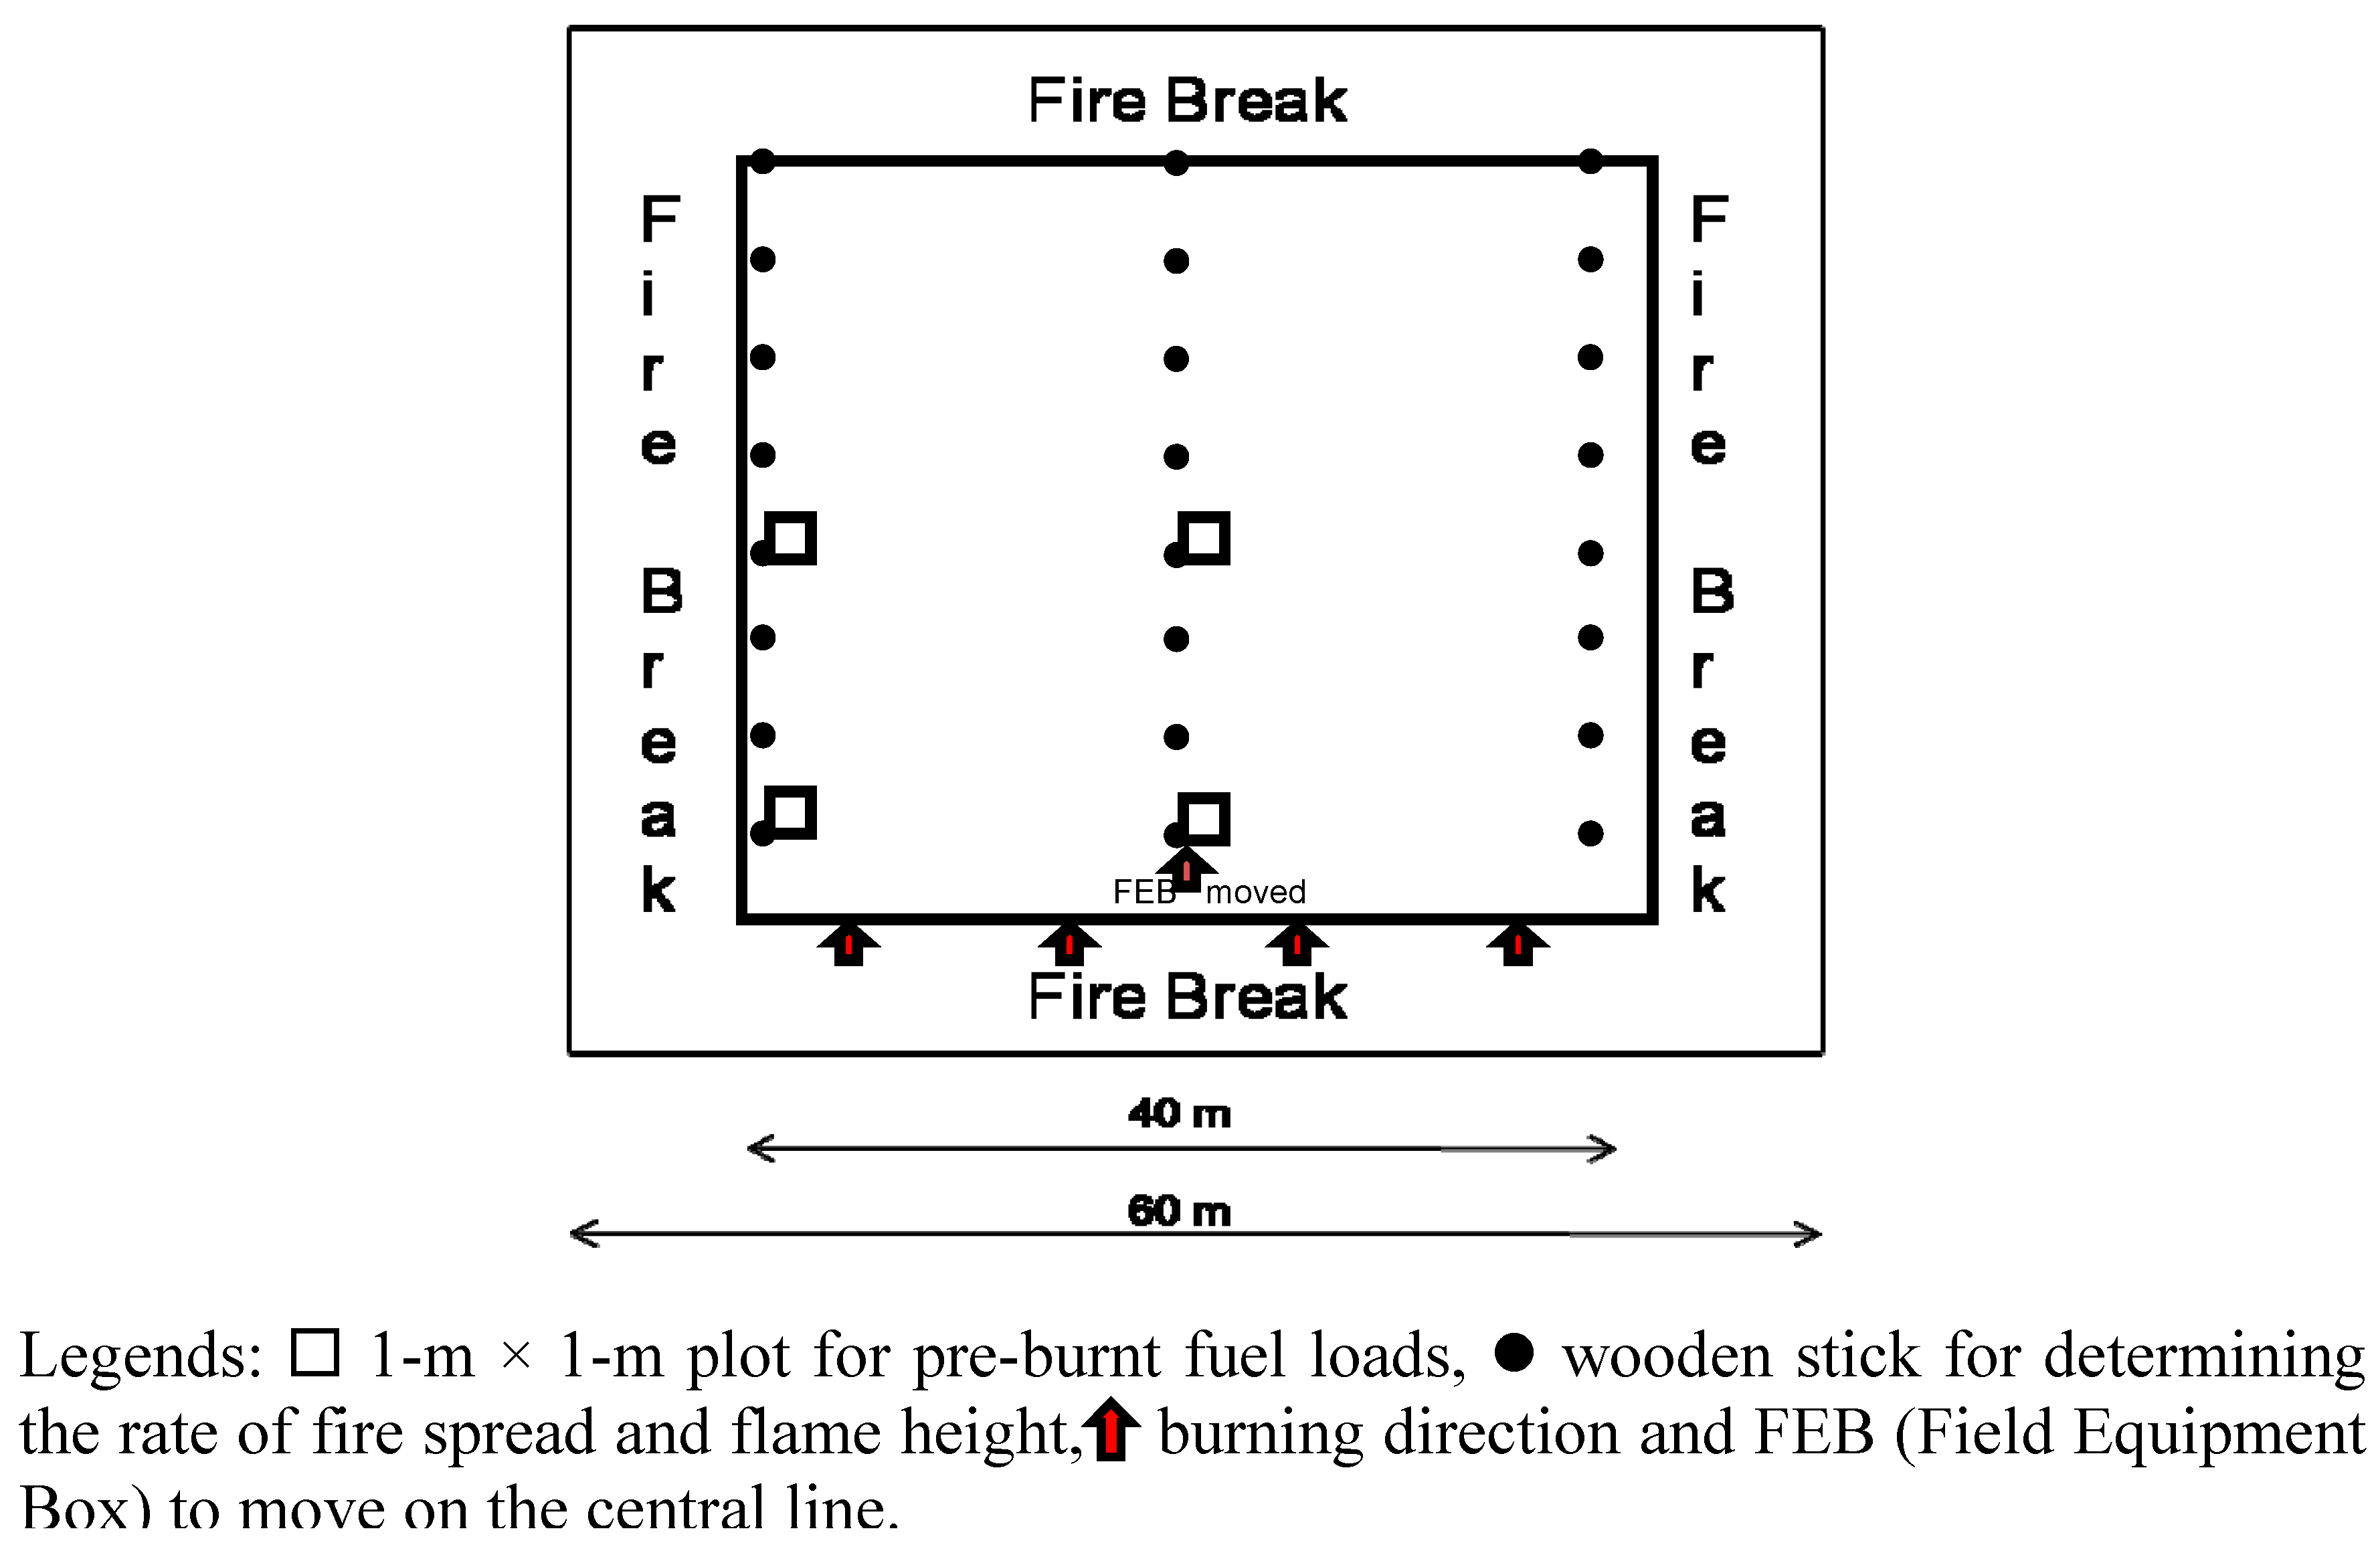
i.e., grass, climber and herb). The systematic random sampling method was used to sample surface biomass from field experiment. Four samples of surface biomass were collected from four sub-plot of 1-m × 1-m, as shown in
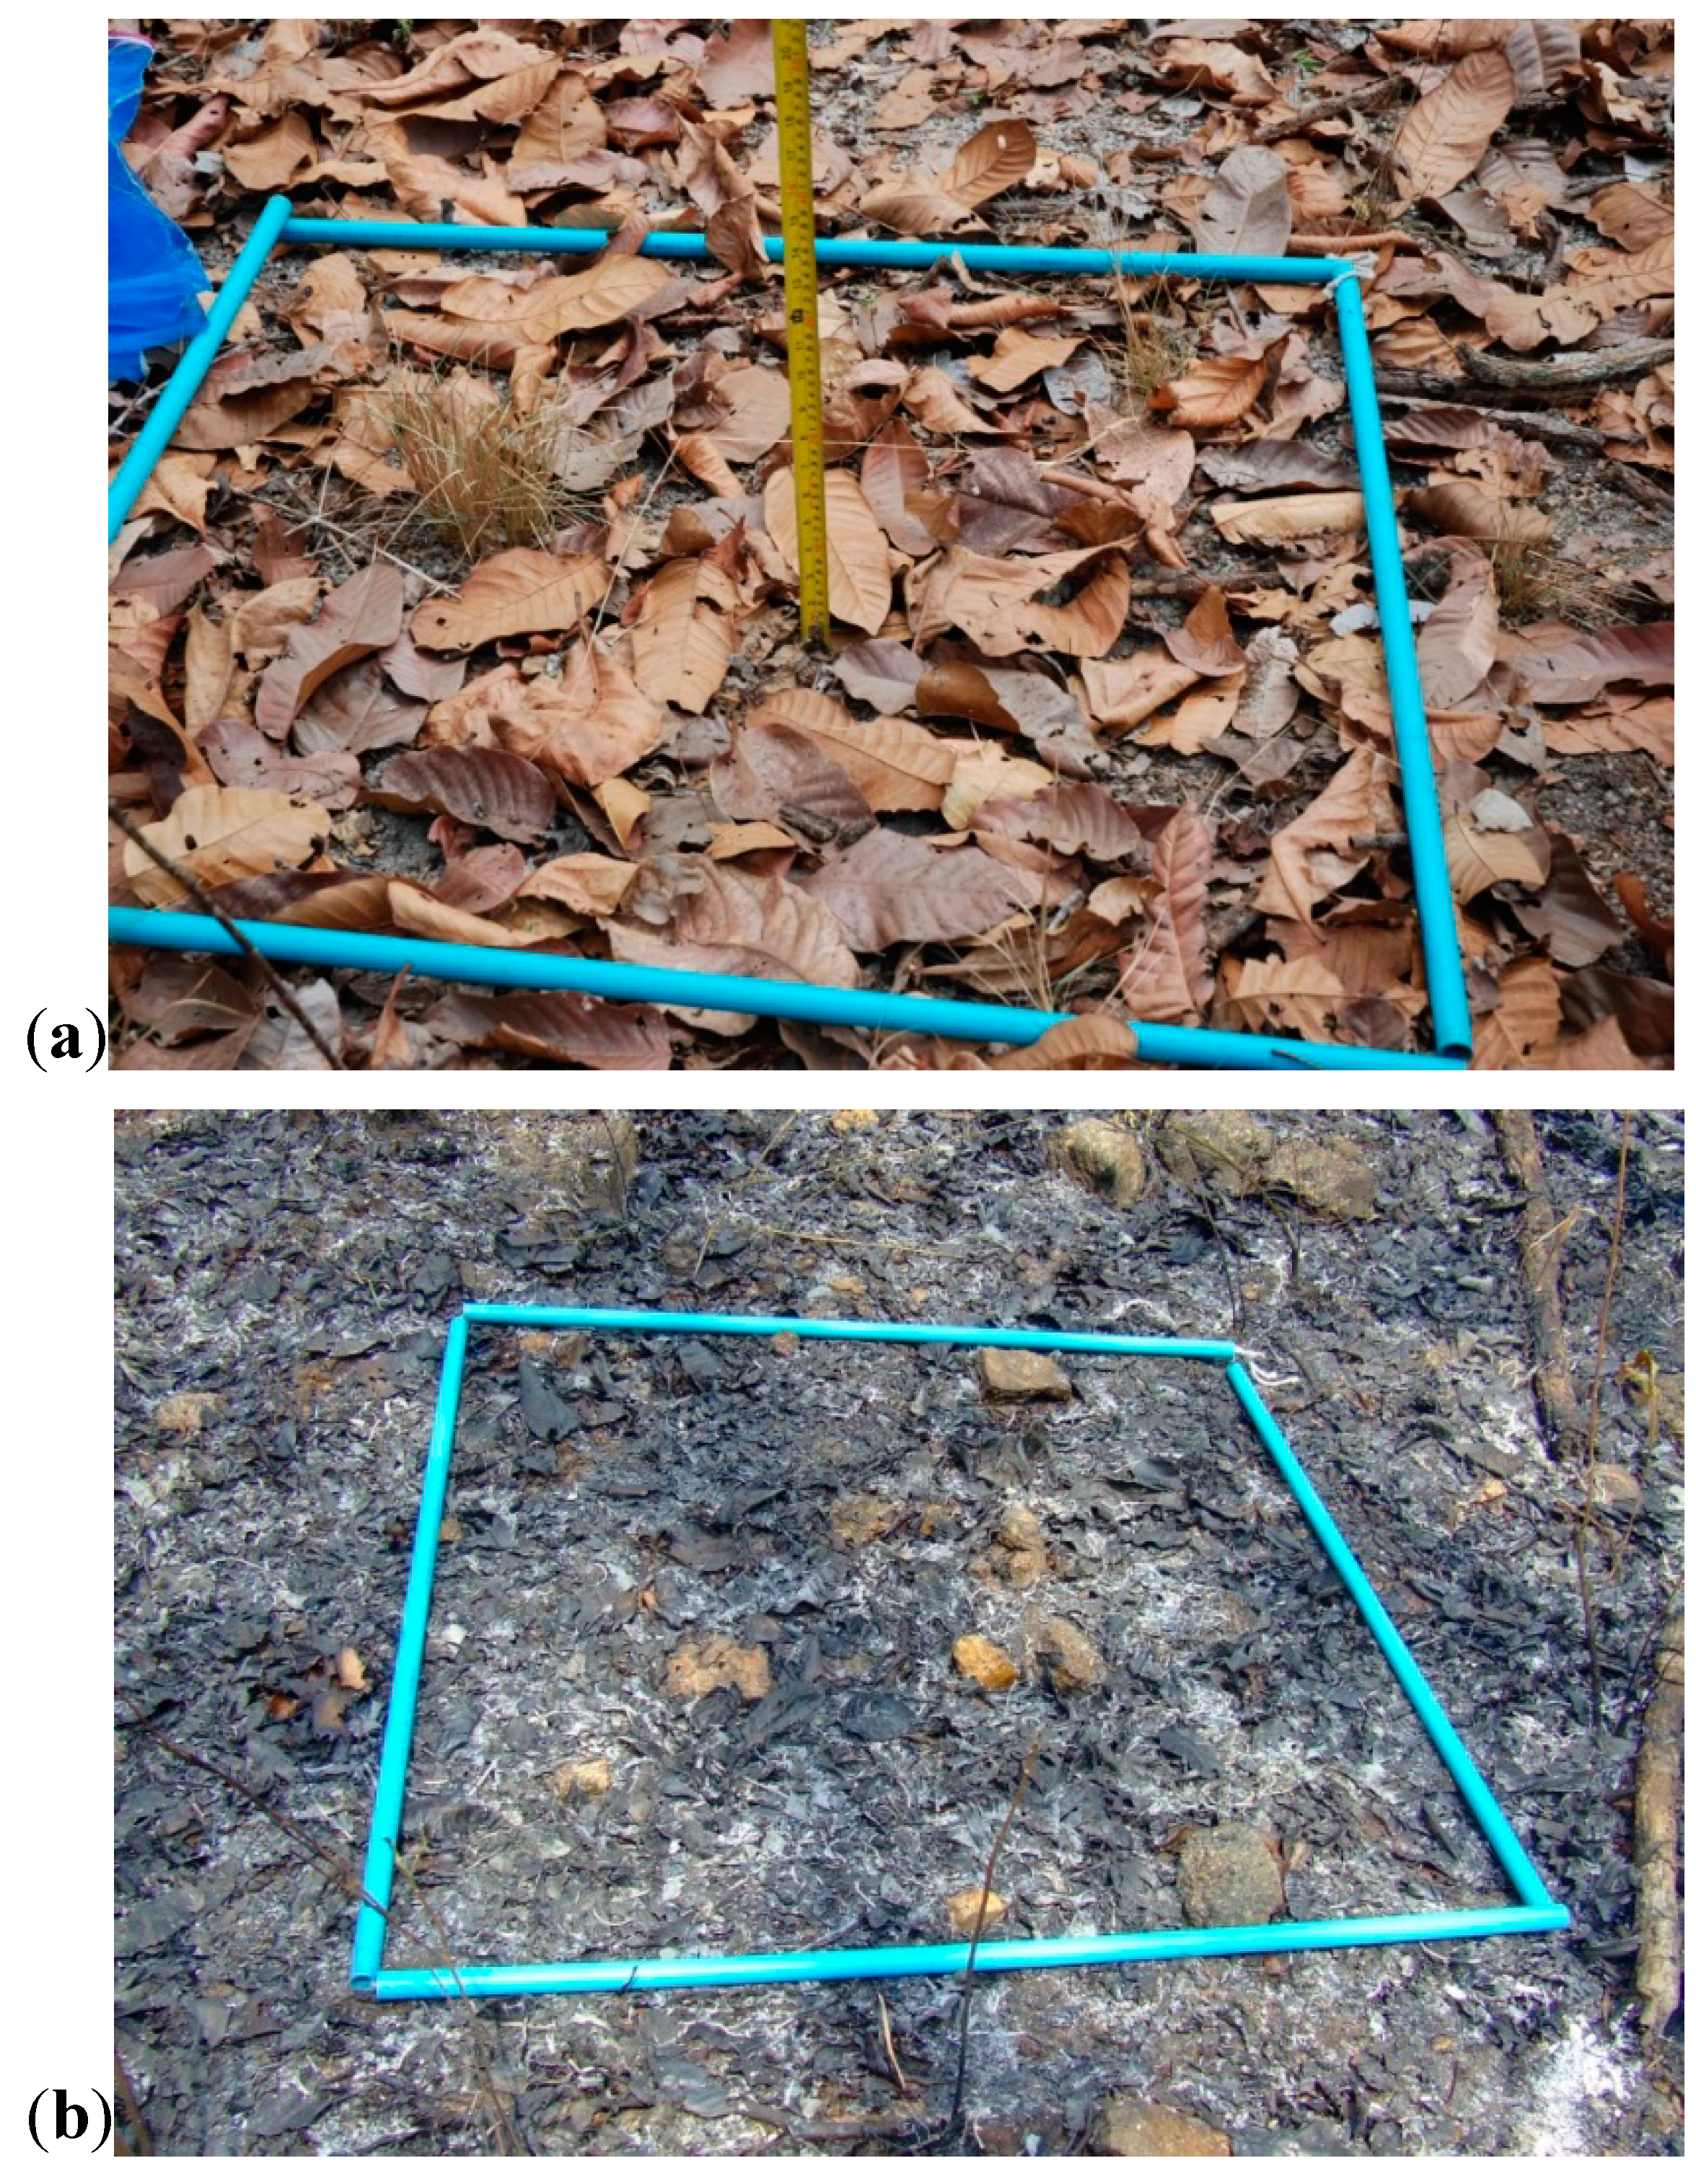
Figure 3. For each one square meter sub-plot, the surface coverage of surface biomass was observed and estimated in percentage of coverage, the surface biomass bed height was measured, and the biomass fuel was cut and sampled (
Figure 4). For each sampling plot, surface biomass samples were separated into fuel type including leaf litter, twig, seedling, and understory. Each category was weighed in the field to determine the wet weight. All samples were then carried to laboratory to be oven-dried at 80 °C for 24 hours or until constant weight. All samples were then weighed to determine the dry weight and moisture content.
2.3. Fire Experiment Set Up
In order to measure the fire characteristics (including fire spread rate and flame height), which led to emissions of compounds of interest, wood sticks of 1.5 meters tall with 1 meter height scale mark were placed every 5 meters on the left, central, and right lines of the plot as shown in
Figure 3. The rate of fire spread was calculated using the measurement of the time taken by the flame to move between two sticks in each line. The flame height at each wood stick was recorded manually using a meter tape.
Figure 3.
Fire experiment set-up.
Figure 3.
Fire experiment set-up.
Figure 4.
Surface biomass (a) and residues after burning (b) in a 1-m × 1-m sub-plot sampling.
Figure 4.
Surface biomass (a) and residues after burning (b) in a 1-m × 1-m sub-plot sampling.
The fire was set by igniting in-line the located upwind side of the main plot. The in-line ignition was used to minimize the edge effect that may affect the fire propagation. The measurements were recorded from the three rows of wood sticks, i.e., left, central and right lines of the main plot, and not from the left and right line only to avoid perturbation of the measurement that may result from the edge effect.
2.4. After-Fire Residues Sampling
The residues after burning composed of ash and charred leaves were collected after the fire experiment from four sub-plots of 1-m × 1-m using simple random method (
Figure 4). The same sample handling and treatment as for surface biomass were applied to the residue samples for dry matter, and moisture and carbon content determination.
2.5. Analysis of Carbon Content in Biomass and Residues after Burning
After oven-dried at 80 °C for at least 24 hours or until reaching a constant weight, the leaf litter samples were cut using the cutting mill (SM 2000 model, Retsch, Germany) and ground with the ball mill (PM10 model, Retsch, Germany) until obtaining a powder with diameter lesser than 100 µm. The ground samples were then analyzed for the carbon content by Organic Elemental Analyzer (Flash EA1112 NC-Soil model, ThermoFinnigan, Italy). The same analytical procedure was applied to residues after burning composed of a mixture of ash and charred leaves.
2.6. Real-Time Measurement and Sampling of Emissions
The background concentration measurement was conducted by real-time measurement set-up at the center of the plot for 30 min before ignition started. The fire was ignited at noon and the emission measurement in the plume was performed until no visible smoke was observed. The weather conditions including relative humidity, temperature, wind speed and wind directions were monitored during the whole duration of the background and fire emission measurement using a portable weather station (La Cross Technology, France). The weather station was set at about 10 meters downwind from the prescribed plot.
2.6.1. Measurement of CO2 and CO
Carbon dioxide (CO2) was analyzed using a non-dipersive infared (NDIR) detector. Carbon monoxide (CO) analysis was performed using chemical cell detection technique with a full scale resolution of 1000 ppm, repeatability of 3% ± 2 LSD (Least significant digits), and display resolution of 1 ppm. For CO2, a full scale resolution of 20,000 ppm with display resolution of ±300 ppm was selected. The outflow connecting tubing was connected with the micro-aethalometer at a flow rate of 50 mL∙min−1.
2.6.2. Measurement of PM2.5
DustTrak aerosol monitor (TSI Inc., USA), a real-time optical scattering measurement equipment, was used to measure the concentration of PM2.5 emitted from the burning. The principle of the measurement consists in pumping the air or smoke through the chamber to be scattered by the infra-red diode laser beam. The aerosols flow through the inlet with selected size by pump. The light scattering laser of the photo-detector determines the mass concentration of aerosol drawn to the unit in a constant stream. The mass concentration measurement is based on a calibration using the ISO 12103-1, A1 dust (Arizona Road Dust) standard.
2.6.3. Sampling of Total Particulate Matter
Quartz filters of 47 mm diameter (Pall Life Science, USA) were preheated at 800 °C for 5 hours [
6] then cooled down in desiccator for 24 hours, weighed and placed in desiccator before use to collect particulate matter of the emission plume. The quartz filter was placed in an open-faced stainless steel filter holder (Pall Life Sciences, USA) connected with an individual pump operating at a flow rate of 5 L∙min
−1.
2.6.4. Measurement of Black Carbon
The micro-aethalometer (Magee Scientific, AE51 model, USA) uses the optical technique principle to measure the black carbon concentration at 880 nm wavelength. The equipment was set up for real-time measurement of the black carbon concentration at the flow rate of 50 mL∙min−1.
2.7. Field Equipment Box and Tower
The field equipments for emission concentration measurement, including real-time monitoring of carbon dioxide, carbon monoxide (Quest Technologies, IAQ model AQ500Pro, USA), black carbon (Micro-aethalometer, Magee Scientific, USA), and PM2.5 (DustTrak, 8520 model, TSI, USA), and the batch sampling of total particulate matter, were set up in the field equipment box (FEB) at the top of a tower of 3 meter-height.
2.8. Estimation of Emission Factors of Carbonaceous Compound
2.8.1. Carbon Mass Balance Method
The carbon mass balance (CMB) method [
7,
8] was used to calculate the carbon oxidized by the combustion of biomass fuel as follows.
where:
Cbiomass is the amount of carbon in the biomass consumed (gC∙m
−2),
Cash is the amount of carbon in residues after burned (gC∙m
−2),
Creleased is the amount of carbon released to the atmosphere (gC∙m
−2).
The carbon content of biomass fuel was used to estimate the amount of carbon in the ash and released to the atmosphere. The CMB method [
7,
8] was used to calculate the carbon oxidized related to the carbon in biomass before and after burning. The general equation to calculate the CMB in biomass combustion is illustrated in Equation (1).
In case of a complete combustion, the carbon released to the atmosphere would be equal to the carbon in the form of carbon dioxide (CO
2). As forest fire is always an incomplete combustion, the carbon released is composed of carbon dioxide (CO
2) representing more than 90% of the total, carbon monoxide (CO) corresponding to minor component (
i.e., lesser than 5% of the total) [
5,
6] and trace carbonaceous compounds including gaseous species such as methane (CH
4), non-methane volatile organic compounds (NMVOCs),
etc., and carbon-contained particulate matter, composed of black carbon (BC) and organic carbon (OC). In this study, the carbon released to the atmosphere was estimated from the carbon in residues after burned, which was then subtracted from carbon in biomass fuel consumed.
2.8.3. Estimation of Emission Factor of Emitted Carbonaceous Aerosols
Black carbon (BC) and organic carbon (OC) are the solid carbon contained found generally in the fine fraction of atmospheric particles (
i.e., PM
2.5) The OC and total carbon (TC) content of atmospheric particulate matter can be estimated by Equations (5) and (6). From Ward
et al. [
14] and Neto
et al. [
11], it was found that the mass of TC represents about 60% of the total mass of PM
2.5 emitted from biomass burning. The emission factor of particle species can be calculated as Equation (7).
where:
MAi is the emission concentrations of carbonaceous aerosols or particulate matter of species
i (mgC∙m
−3),
Cm is the mass fraction of carbon released to dry biomass consumed, 1000 (g∙kg
−1),
Ct is the total mass of carbon released in form of CO
2, CO and PM
2.5 (mgC∙m
−3).
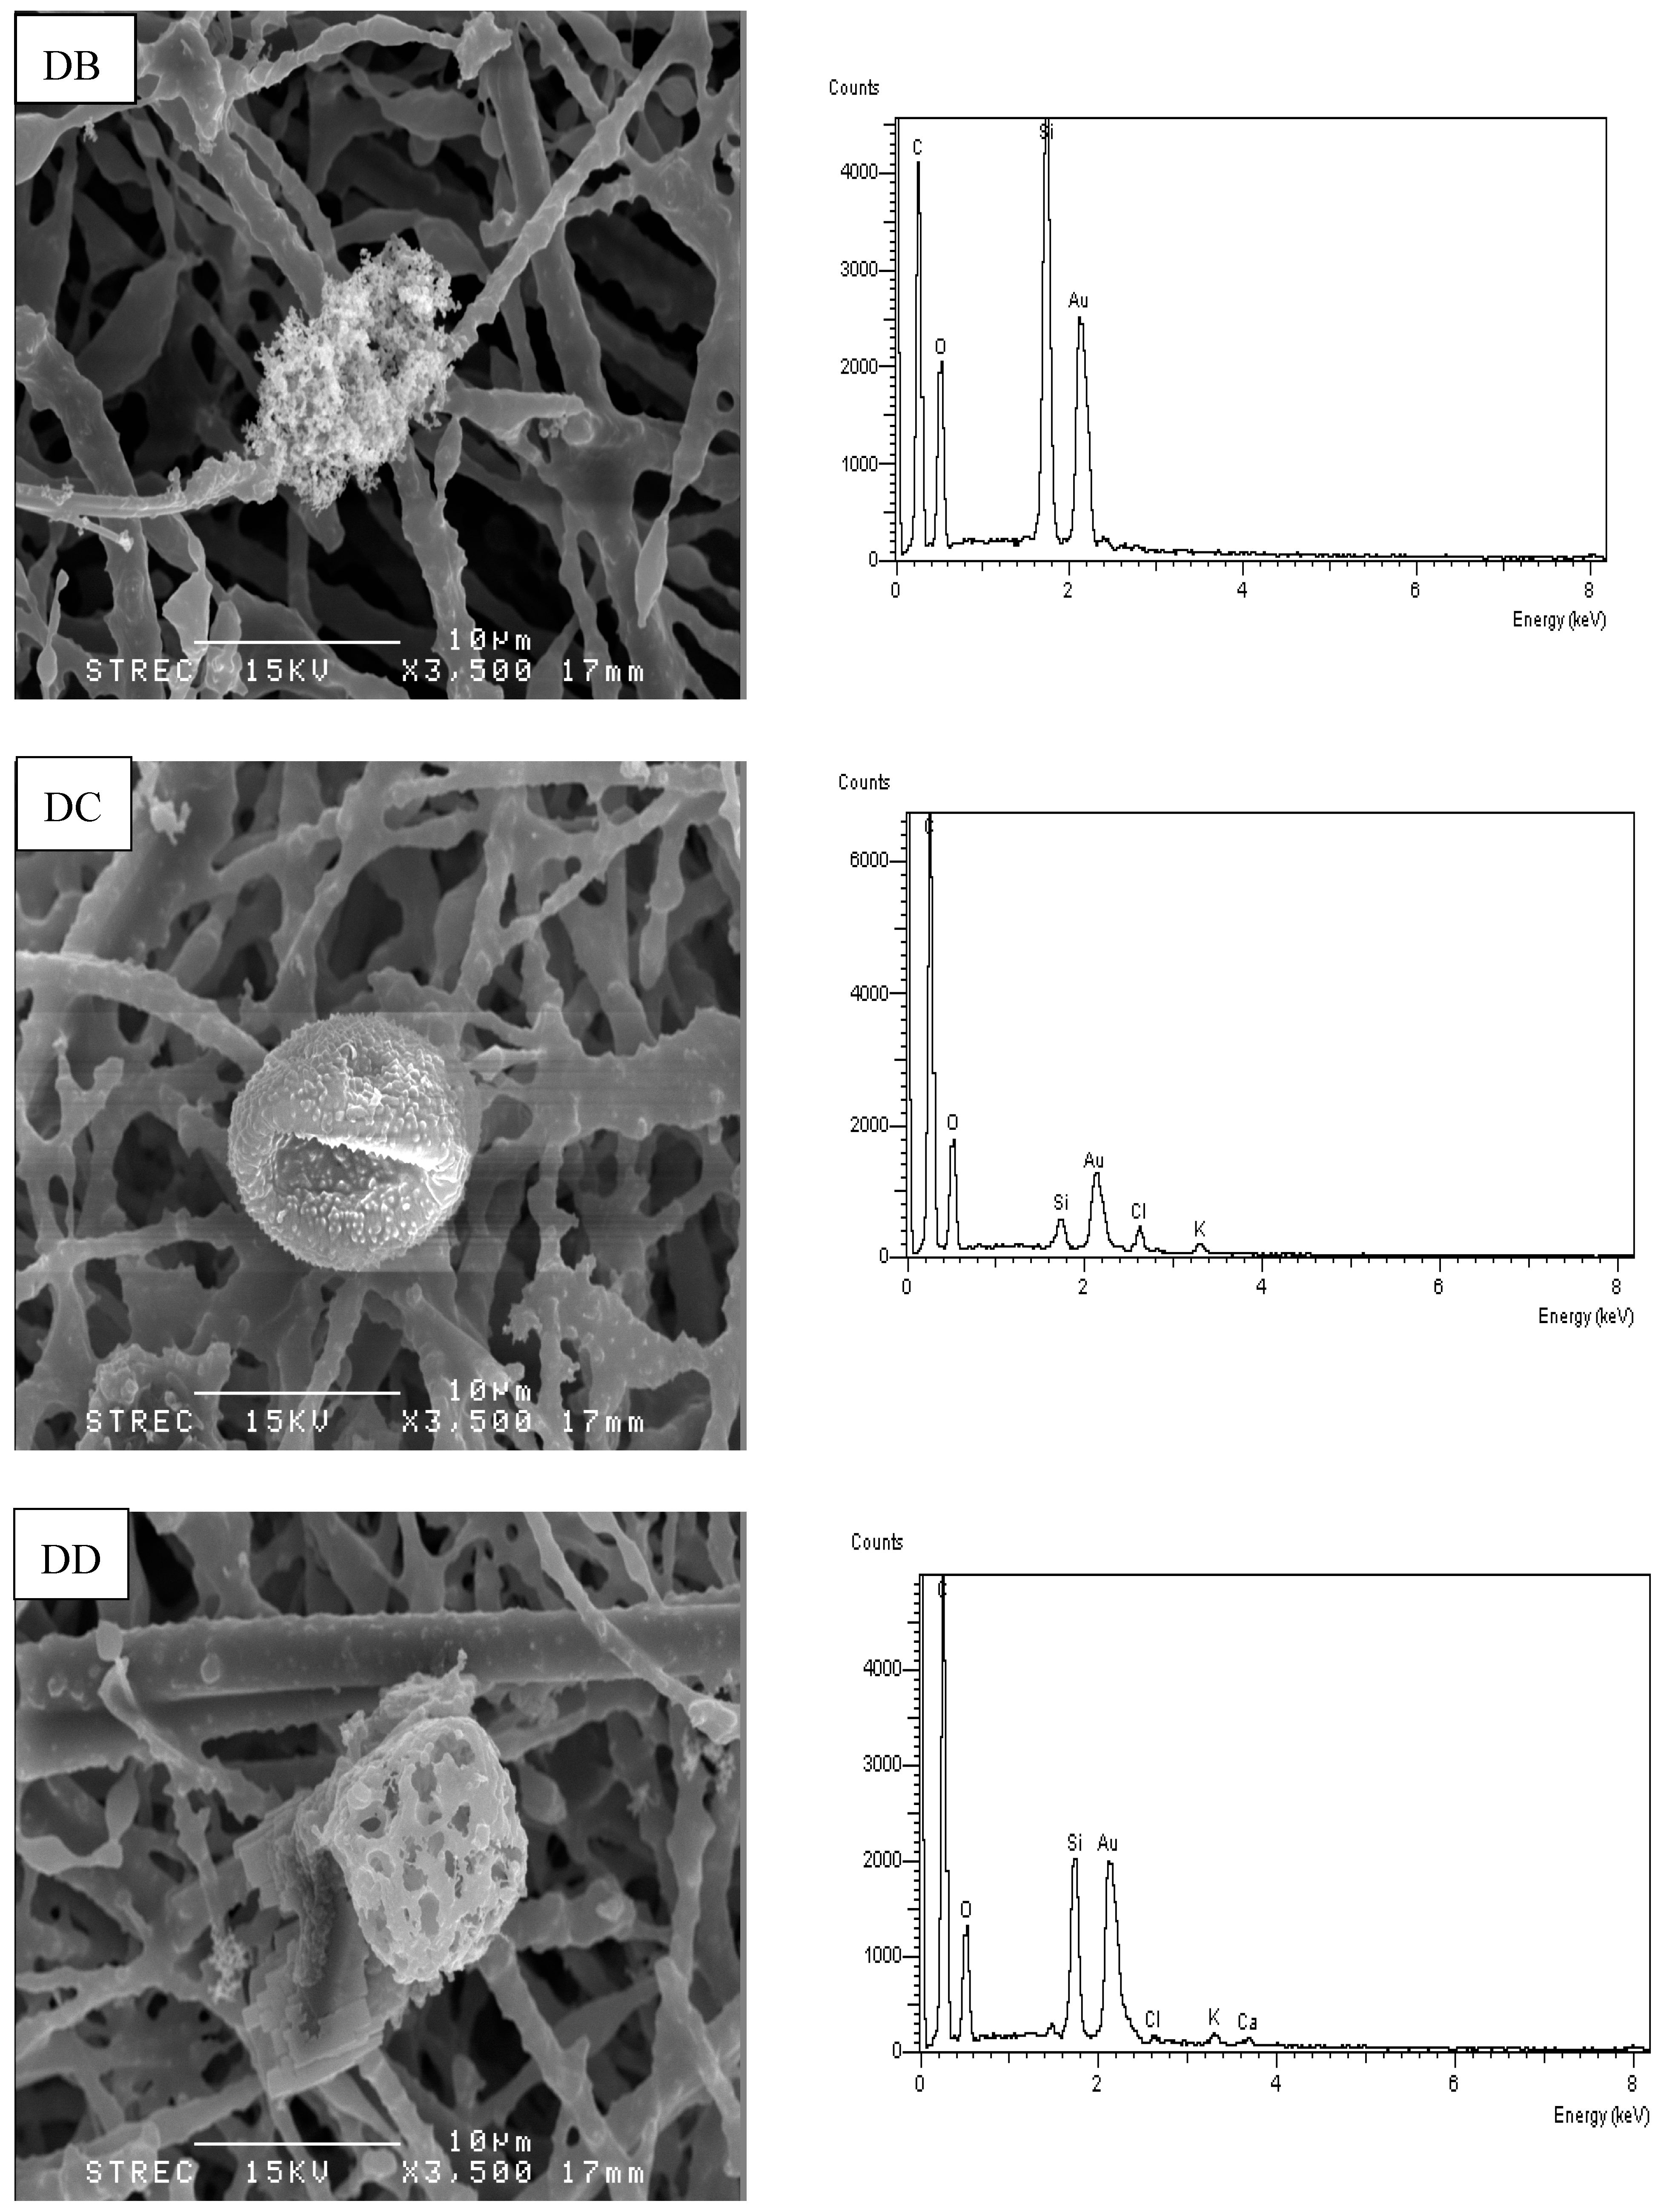
2.9. Morphology of Carbonaceous Aerosols Using Scanning Electron Microscope
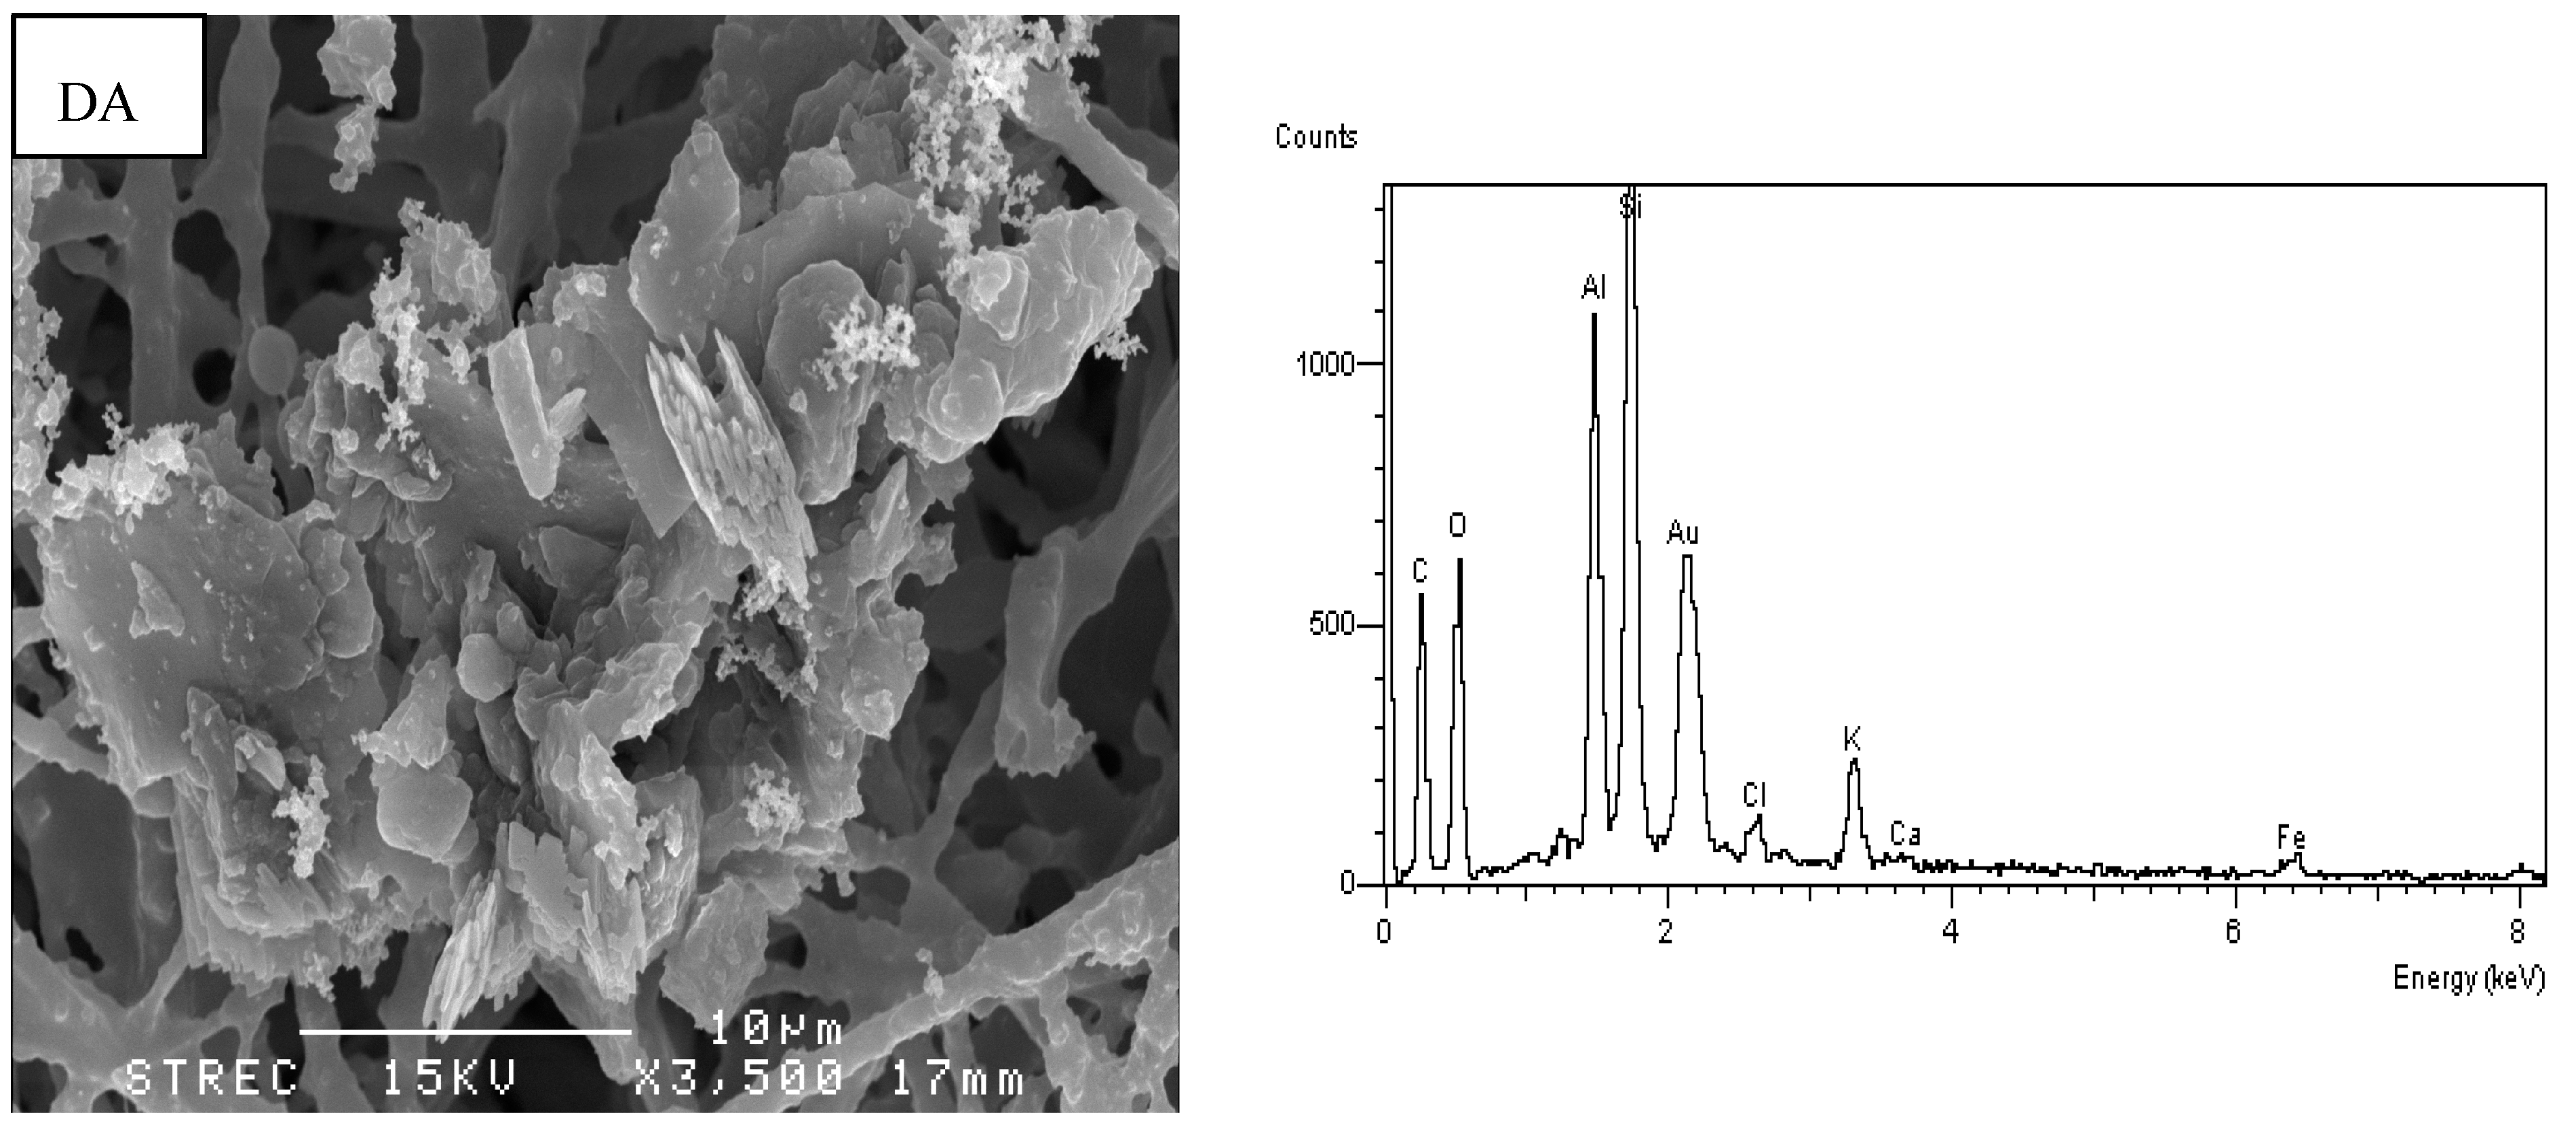
Particulates collected on quartz filter were conditioned in desiccator for 24 hours before analysis of the morphology by scanning electron microscopy with energy-dispersive X-ray spectroscopy (SEM-EDX) (JEOL, Model: ISM-S410LV, Japan). Each sampled filter was punched to obtain 10 mm diameter samples which were then gold coated before the SEM-EDX analysis. Micrographs were taken at 20 Kv for identification and characterization of aerosols.
3. Results and Discussion
3.1. Surface Biomass Fuel and After-Fire Residues Characteristics
The depth of surface biomass varied among sites, depending on the vegetation structure and the repartitioning between living and dead fraction. The dead leaves and twig depths were about 5–10 cm and 2–6 cm, respectively. Overall 90% coverage of surface fuel was dead leaves, followed by twig. The dead leaves load in DDF1, DDF2 and DDF3 were 561, 212 and 253 g∙m−2, respectively. The moisture content of dead leaves was 4.69, 6.55 and 7.11% in DDF plot number 1 to 3, respectively. The average of dead leaves load in four plots was 342 ± 190 g∙m−2 and the twig load was lesser than 100 g∙m−2. It was confirmed that the dead leaves constituted the main component of the surface biomass.
After burning, the amount of surface biomass consumed was 271 ± 138 g∙m−2. It was observed that twig kept the same shape as before burning. Therefore, dead leaves were the major fuel consumed. The residues after burning or fire included the charred leaves and ash. The mass of residues after burning was 39 ± 13 g∙m−2. It should be noted that it was difficult to separate charred leaves from ash for quantification of the mass load.
3.2. Carbon Content in Surface Biomass and After-Fire Residues
The carbon content of dead leaves and small twig before burning was 45.81 ± 0.04% and 43.49 ± 0.09%, respectively. The carbon content in the residues was 35.0 ± 0.06%. The carbon content in the dead leaves and residues after burning are reported in
Table 1.
From
Table 1, it was found that the carbon released to the atmosphere from the DDF fires represented 88.38 ± 2.02% of the initial dead leaves carbon content. The results showed that each gram of carbon released to the atmosphere corresponded to 2.40 ± 0.02 g of dead leaves consumed by fires in DDF.
Table 1.
Carbon content in the dead leaves consumed, after-fire residues and released to the atmosphere.
Table 1.
Carbon content in the dead leaves consumed, after-fire residues and released to the atmosphere.
| Carbon (gC∙m−2) |
|---|
| Dead leaves consumed | After-fire Residues | Released to atmosphere |
| 124.83 ± 63.36 | 13.75 ± 4.57 | 111.07 ± 58.88 |
Carbon in after-fire residues would be left on the ground surface and returned to forest soil to enhance its carbon stock in the long term. The percentage of carbon in the residues was 11.25 ± 2.11% of the total carbon in the surface biomass fuel consumed. It was shown that the amount of carbon returned to the ecosystem in the form of a mixture of ash and charred leaves in this forest type is 53.85 ± 9.67 gC∙kg−1dry biomass.
3.3. Carbon Released to the Atmosphere
In this study, the carbon released to the atmosphere resulted from dead leaves burning was 88.38 ± 2.02% the initial dead leaves fuel carbon content. This indicates that each gram of carbon released was resulted from about 2.40 ± 0.02 g of dry dead leaves, which is in good agreement with the result obtained by Nelson from laboratory fire experiments [
13]. It is also of the same order of magnitude as the laboratory experimental result found by Chaiyo
et al. [
15] which stated that each gram of carbon released was produced from the combustion of DDF dead leaves was 2.27 ± 0.01 g.
The assessment of the amount of carbon released to the atmosphere from fires in Mae Nam Phachi wildlife sanctuary during 2007 to 2010 indicated that the average of carbon to the atmosphere was 6.04 ± 3.88 tonnes C∙y−1.
3.4. Modified Combustion Efficiency (MCE) and Emission of Carbonaceous Compound
The amount of biomass burned in DDF1 was 430.41 g. Overall, the combustion in DDF plot was flaming dominant, indicating that the combustion completeness should be higher than 0.90 [
16], and MCE should range between 0.70–0.99. The MCE found in this study was 0.93 ± 0.05.
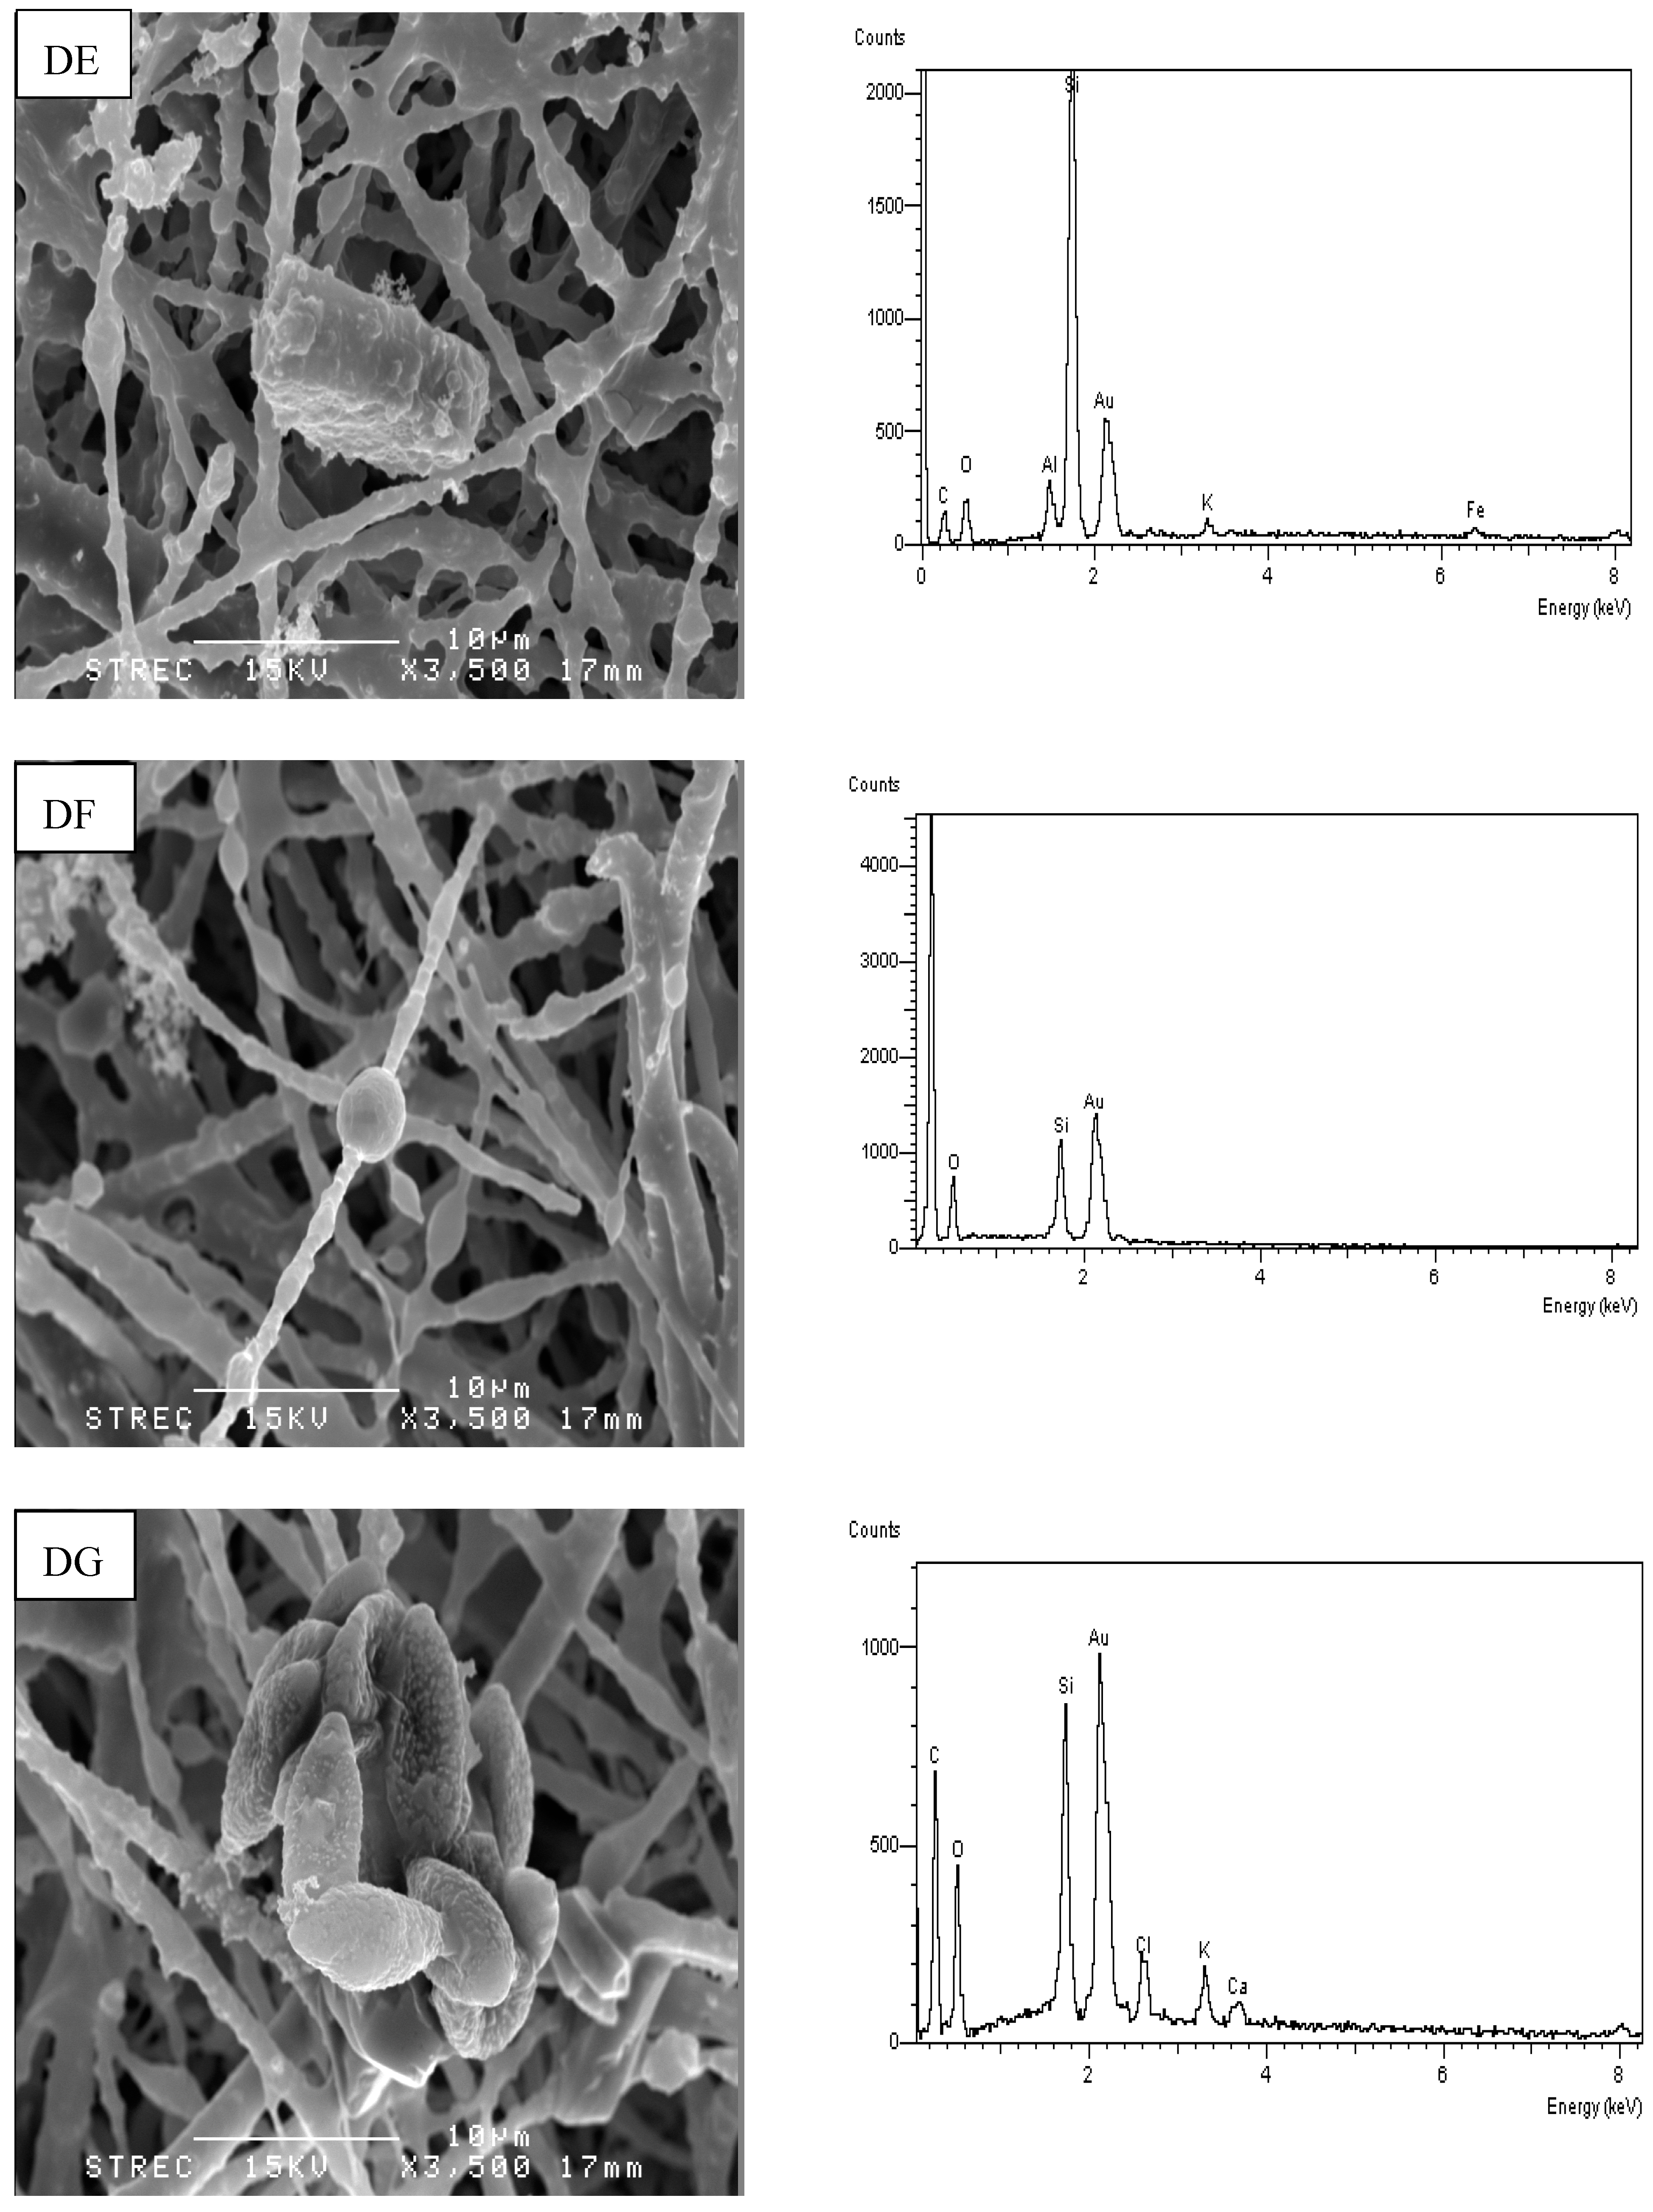
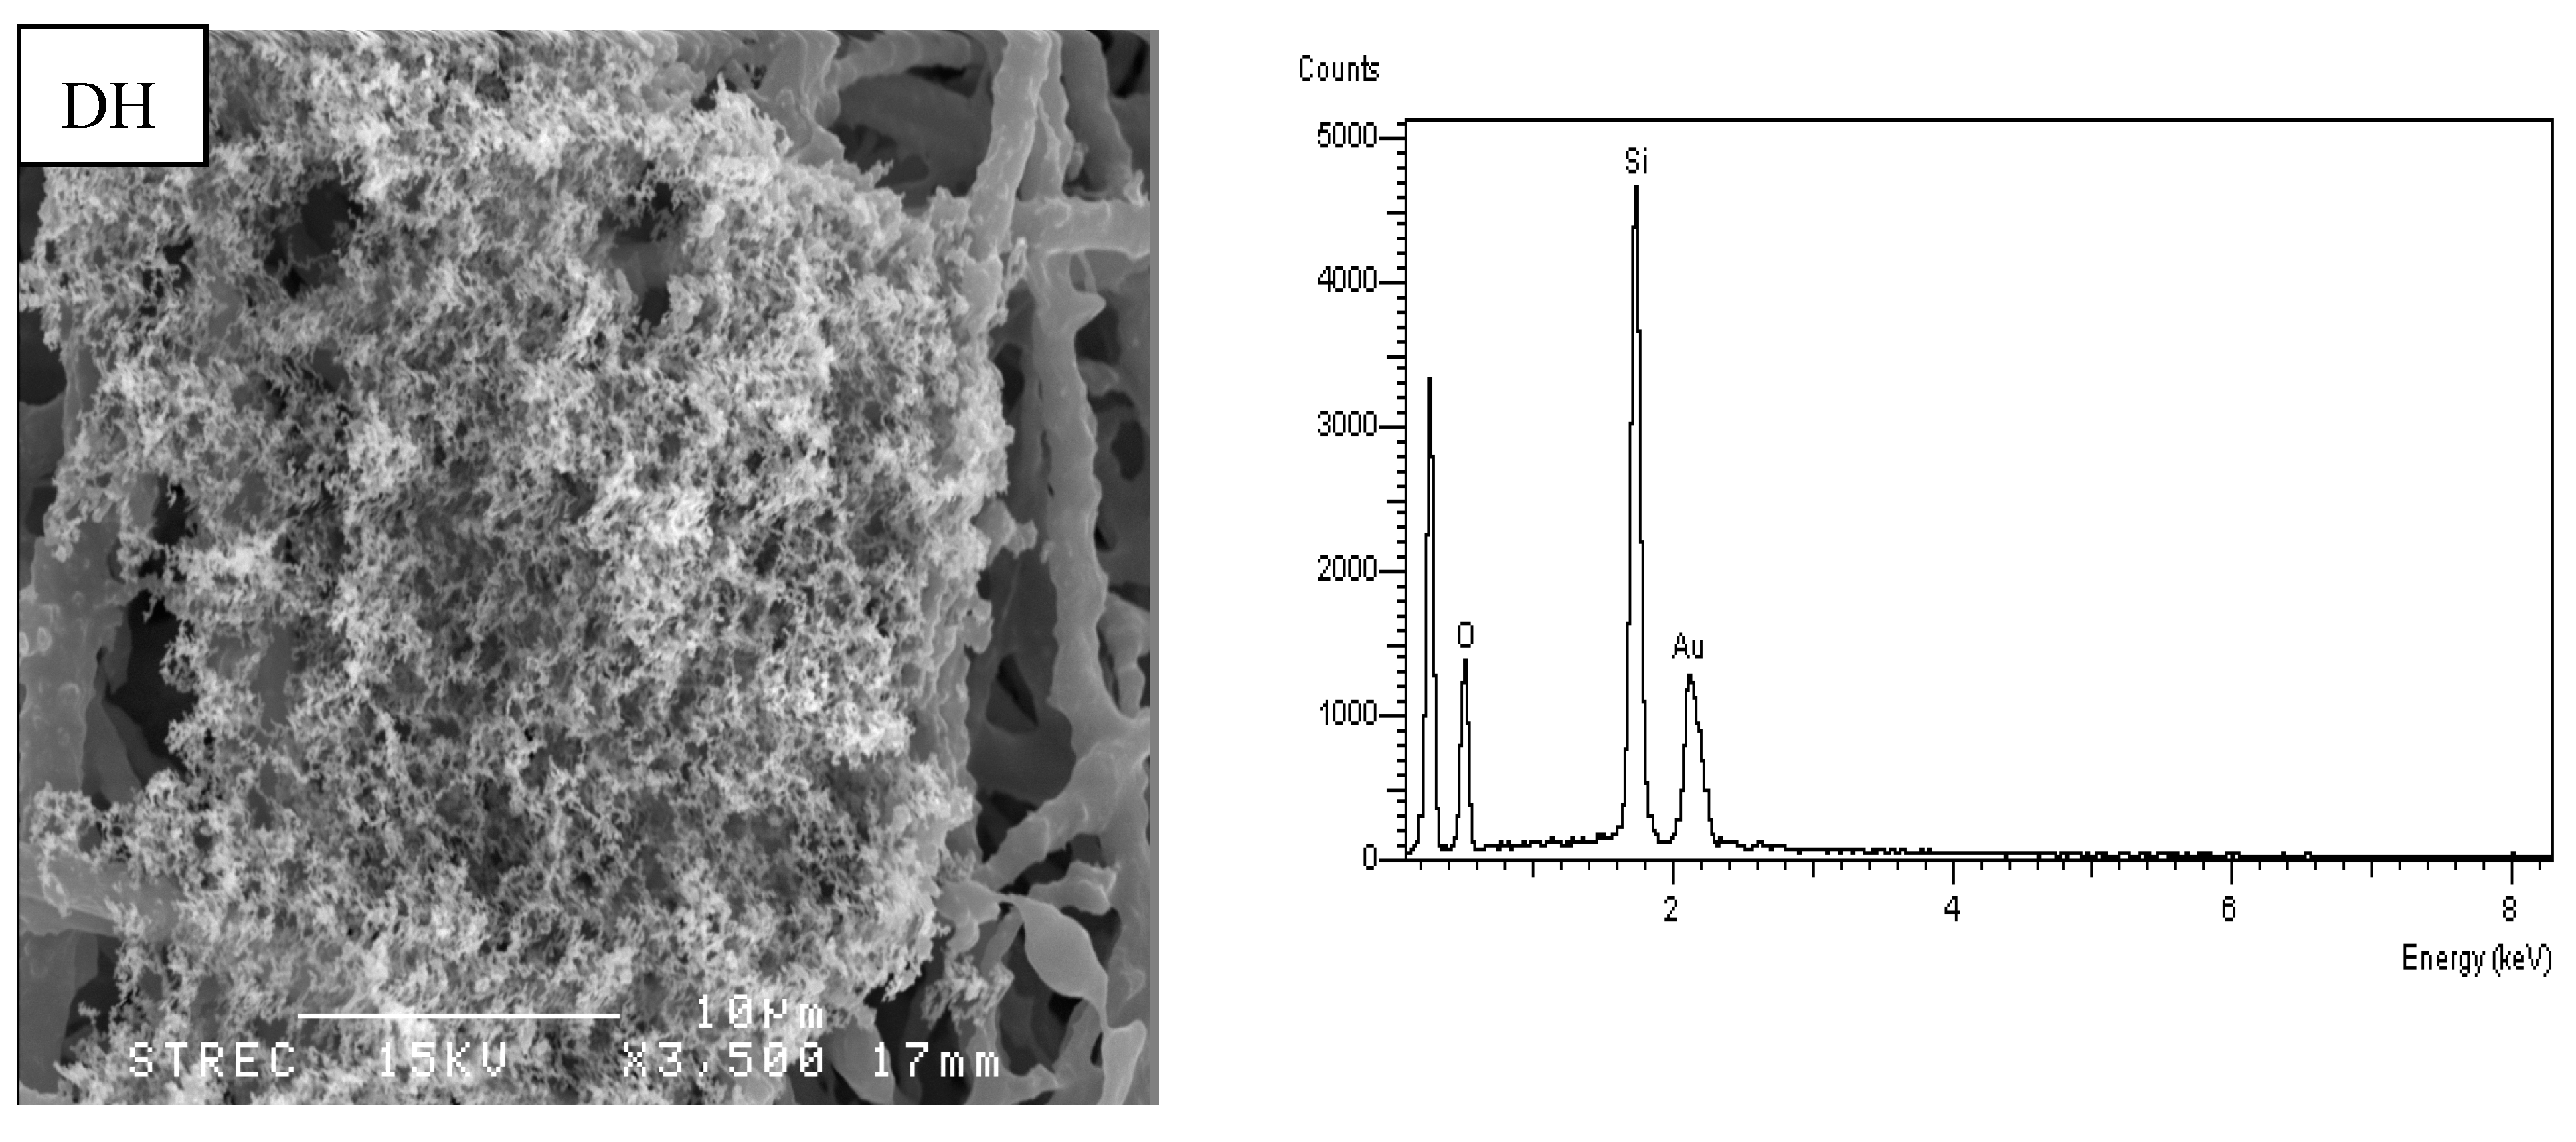
3.6. Morphology of Carbonaceous Aerosols
The SEM micrographs of TPM showed various morphological types (
Figure 5). The micrographs from the burning of DDF indicated 8 shapes of carbonaceous aerosols. The elemental composition analysis of each micrograph found the presence of carbon (C), oxygen (O), aluminum (Al), chlorine (Cl), potassium (K), iron (Fe) and calcium (Ca). DA micrograph shows the dominant shape, followed by DB, DH and DG micrographs, respectively. The DB and DH micrographs display similar shapes of branched clusters of soot particles as obtained by Pachauri
et al. [
24].
3.7. Contribution to Global Warming of Emissions from DDF Fires
Table 6 presents the emissions from annual DDF fires in Thailand in CO
2 equivalent, using the Global Warming Potential (GWP) of CO
2, CO, BC and OC, the main carbon components measured in this study.
Figure 5.
SEM micrographs of particulate matter emitted from dry dipterocarp forest fires in Thailand.
Figure 5.
SEM micrographs of particulate matter emitted from dry dipterocarp forest fires in Thailand.
Table 6.
Contribution to global warming of emissions from dry dipterocarp forest fires in Thailand.
Table 6.
Contribution to global warming of emissions from dry dipterocarp forest fires in Thailand.
| Species | GWP | Emissions (tonnes∙y−1) | Tonnes·CO2eq∙y−1) |
|---|
| 20 y * | 100 y * | 20 y | 100 y |
|---|
| CO2 | 1 | 1 | 29,964 | +29,964 | +29,964 |
| CO | 6 | 2 | 2027 | +12,165 | +4055 |
| BC | 1600 | 460 | 17 | +27,886 | +8017 |
| OC | −240 | −69 | 337 | −80,840 | −23,242 |
The GWP metric is used to determine the relative radiation effect of a given emission mass of a species compared to CO
2 integrated over a chosen time horizon. Generally, 20 year and 100 year time horizons are used to calculate the GWP of a given compound. In addition, BC and OC are usually estimated based on 20 year time horizon, because of their shorter lifetime compared to traditional greenhouse gas. It was found that on the basis of 20 year time horizon in tonnes·CO
2eq per year unit, the emission of BC by dry dipterocarp forest fires can induce similar warming effect as the co-emitted CO
2: 27,886 tonnes
·CO
2eq∙y
−1 vs. 29,964 tonnes
·CO
2eq∙y
−1 (
Table 6).
4. Conclusions
The surface biomass is composed of leaf litter and small twig. Dead leaves represent more than 90% of the total surface biomass whether weight or ground surface coverage basis, and hence constitute the main fuel for combustion. Another fraction that may influence the biomass combustion process investigated in this study are small twigs, but at a level much smaller than dead leaves. Based on the field experiment measurement data, it was estimated that the amount of carbon released by DDF fires in Thailand during 2002 to 2006 was 9241.46 tonnes∙y−1, and about 3.37 tonnes∙y−1 of carbon was returned to soil. Also, it was shown that Chiangmai represents the province where more than 50% of the total carbon released from DDF fires in 2009 followed by Lampoon, Khon Kaen, and Karlasin, respectively.
The morphology of carbon contained particulate matter emitted from DDF fires investigated in thestudy included 8 shapes. Moreover, it was observed that the color of the particles collected from DDF fires were grey to black, indicating high presence of BC. It was found that BC represented about 8.25% of the total mass of PM2.5 emitted from DDF fires. Using the emission fluxes of BC and carbon released obtained in this study, it was found that BC constitutes about 1.89 × 10⁻³ (~0.19%) of the carbon released to the atmosphere from DDF fires.
Using the 20 year and 100 year time horizon GWP of BC, this study showed that for 20 year time horizon, BC emitted from DDF in Thailand may induce the same global warming effect as co-emitted CO2.
Acknowledgments
This research was financially supported by the Joint Graduate School of Energy and Environment (JGSEE)-Center for Energy Technology and Environment (CEE-PERDO), King Mongkut’s University of Technology Thonburi, through PhD scholarship program. The authors also gratefully acknowledged the financial support from the Commission on Higher Education, Ministry of Education, under the National Research University (NRU) grant. We gratefully thank Utit Phookate and the staff of Ratchaburi Forest Fire Control station. We would like to convey our sincerest thanks to Dachochai Wilairat and Sudhathai Wilairat for their field work assistance. We would like to extend our appreciation to the Aerosol from Biomass Burning to the Atmosphere (ABBA) research group, Joint Graduate School of Energy and Environment (JGSEE), King Mongkut’s University of Technology Thonburi (KMUTT), for the technical support throughout the study.
Author Contributions
Both authors contributed to the research and field experiment design of this study, and to the elaboration of this manuscript. Ubonwan Chaiyo performed the data collection and analysis, and prepared the first draft of this paper. Savitri Garivait supervised the overall research work, provided guidelines for the write up of the manuscript, and contributed to its editing and finalization.
Conflicts of Interest
The authors declare no conflict of interest.
References
- Forest Fire Control Yearly Report; National Park Wildlife and Plant Conservation Department, Forest Fire Control Office: Bangkok, Thailand, 2005.
- Samran, S. Effect of forest fire on change in above ground biomass in the Maeklong mixed deciduous forest, Kanchanaburi province, Thailand. In Proceedings of the Conference on Climate Change in Forest: The Potential of Forest in Support of the Kyoto Protocol, Bangkok, Thailand, 4–5 August 2005.
- Suthivanit, S. Effects of Fire Frequency on Vegetation in Dry Dipterocarp Forest at Sakarat, Changwat Nakorn Ratchasima. Master’s Thesis, Kasetsart University, Bangkok, Thailand, 1998. [Google Scholar]
- Wanthongchai, K.; Bauhus, J.; Goldammer, J.G. Nutrient losses through prescribed burning of aboveground litter and understorey in dry dipterocarp forests of different fire history. Catena 2008, 74, 321–332. [Google Scholar] [CrossRef]
- Chaiyo, U.; Savitri, G.; Wanthongchai, K. Carbon storage in above-ground biomass of tropical deciduous forest in Ratchaburi Province, Thailand. World Acad. Sci., Eng. Technol. 2011, 58, 636–641. [Google Scholar]
- Cao, G.; Zhang, X.; Gong, S.; Zheng, F. Investigation on emission factors of particulate matter and gaseous pollutants from crop residue burning. J. Environ. Sci. 2008, 20, 50–55. [Google Scholar] [CrossRef]
- Ward, D.E.; Nelson, R.M.; Adams, D.F. Forest fire smoke plume documentation. In Proceedings of the 72nd Annual Meeting, Air Pollution Control Association, Cincinnati, OH, USA, 21–29 June 1979.
- Radke, L.F.; Lyons, J.H.; Hobbs, P.V.; Hegg, D.A.; Sandberg, D.V.; Ward, D.E. Airborne Monitoring and Smoke Characterization of Prescribed Fires on Forest Lands in Western Washington and Oregon; PNW-GTR-251; U.S. Department of Agriculture, Forest Service, Northwest Research Station: Portland, OR, USA, 1990. [Google Scholar]
- Reid, J.S.; Koppman, R.; Eck, R.F.; Eluterio, D.P. A review of biomass burning emissions part II: Intensive physical properties of biomass burning particles. Atmos. Chem. Phys. 2005, 5, 799–825. [Google Scholar] [CrossRef]
- Andreae, M.O.; Merlet, P. Emissions of trace gases and aerosols from biomass burning. Glob. Biogeochem. Cycles 2001, 15, 955–966. [Google Scholar] [CrossRef]
- Neto, T.G.S.; Carvalho, J.A.; Veras, C.A.G.; Alvarado, E.C.; Gielow, R.; Lincoln, E.N.; Christian, T.J.; Yokelson, R.J.; Santos, J.C. Biomass consumption and CO2, CO and main hydrocarbon gas emissions in an Amazonian forest clearing fire. Atmos. Environ. 2009, 43, 438–446. [Google Scholar] [CrossRef]
- Urbanski, P.U.; Hao, W.M.; Baker, S. Chemical composition of wildland fire emissions. Dev. Environ. Sci. 2009, 8, 79–107. [Google Scholar]
- Nelson, R.M. An Evaluation of Carbon Mass Technique for Estimating Emission Factors and Fuel Consumption in Forest Fires; U.S. Department of Agriculture, Forest Service, Southeastern Research Station: Asheville, NC, USA, 1982. [Google Scholar]
- Ward, D.E.; Radke, L.F. Emission measurements from vegetation fires: A comparative evaluation of methods and results. Fire Environ.: Ecol. Atmos. Clim. Importance Veg. Fires 1993, 13, 53–76. [Google Scholar]
- Chaiyo, U.; Pizzo, Y.; Garivait, S. Estimation of carbon released from dry dipterocarp forest fires in Thailand. Int. J. Environ. Sci. 2013, 7, 522–525. [Google Scholar]
- Babitt, R.E.; Ward, D.E.; Susot, R.A.; Artaxo, P.; Kauffman, J.B. A comparison of concurrent airborne and ground-based emissions Generated from biomass burning in the Amazon Bazin. In SCAR-B (Smoke/Sulfate, Clouds and Radiation-Brazil) Proceedings, Transtec, Sao Paulo, Brazil; 1996. [Google Scholar]
- Ward, D.E.; Hao, W.M. Air toxic emissions from burning of biomass globally—Preliminary estimate. In Proceedings of the 85th Annual Meeting, Air and Waste Management Association, Kansas City, MO, USA; 1993. [Google Scholar]
- Yokelson, R.J. The tropical forest and fire emissions experiment: Laboratory fire measurements and synthesis of campaign data. Atmos. Chem. Phys. 2008, 8, 3509–3527. [Google Scholar] [CrossRef]
- Akagi, S.K.; Yokelson, R.J.; Wiedinmyer, C.; Alvarado, M.J.; Reid, J.S.; Karl, T.; Crounse, J.D.; Wennberg, P.O. Emission factors for open and domestic biomass burning for use in atmospheric models. Atmos. Chem. Phys. 2011, 11, 4039–4072. [Google Scholar] [CrossRef]
- Weerapole, K. The Effect of Forest Fire for Champeria manillana (Bliume) Merr, in Kanjanaburi Province, Thailand; National Park Wildlife and Plant Conservation Department: Bangkok, Thailand, 2003. [Google Scholar]
- Himmapan, W. Behavior, Effect and Smoke Composition of Burning Fire in Dry Dipterocarp Forest at Huay Kha Khaeng Wildlife Sanctuary, Uthai Thani Province. Ph.D. Thesis, Kasetsart University, Bangkok, Thailand, 2004. [Google Scholar]
- Sompoh, B. Fuel Complex in Dry Dipterocarp and Mixed Deciduous Forests at Huai Kha Khaeng Wildlife Sanctuary, Changwat Uthai Thani. Master’s Thesis, Kasetsart University, Bangkok, Thailand, 1998. [Google Scholar]
- Sudthichart, K. Impact of Fire on Soil and Plant at Phu Kradung National Park. Master’s Thesis, Kasetsart University, Bangkok, Thailand, 1996. [Google Scholar]
- Pachauri, T.; Satsangi, A.; Singla, V.; Lakhani, A.; Kumari, K.M. Characteristics and sources of carbonaceous aerosols in PM2.5 during wintertime in Agra, India. Aerosol Air Qual. Res. 2013, 13, 977–991. [Google Scholar]
- Permadi, D.A.; Kim Oanh, N.T. Assessment of biomass open burning emissions in Indonesia and potential climate forcing impact. Atmos. Environ. 2013, 27, 250–258. [Google Scholar] [CrossRef]
© 2014 by the authors; licensee MDPI, Basel, Switzerland. This article is an open access article distributed under the terms and conditions of the Creative Commons Attribution license (http://creativecommons.org/licenses/by/4.0/).


