Next Article in Journal
Areal-Averaged Spectral Surface Albedo from Ground-Based Transmission Data Alone: Toward an Operational Retrieval
Next Article in Special Issue
A Survey of Mercury in Air and Precipitation across Canada: Patterns and Trends
Previous Article in Journal / Special Issue
Airborne Vertical Profiling of Mercury Speciation near Tullahoma, TN, USA
 
 
Comment published on 19 September 2016, see Atmosphere 2016, 7(9), 119.
Article

Programmable Thermal Dissociation of Reactive Gaseous Mercury, a Potential Approach to Chemical Speciation: Results from a Field Study †

1
Division of Marine and Atmospheric Chemistry, Rosenstiel School of Marine and Atmospheric Science, University of Miami, 4600 Rickenbacker Causeway, Miami, FL 33149, USA
2
Electric Power Research Institute, 3420 Hillview Avenue, Palo Alto, CA 94304, USA
*
Author to whom correspondence should be addressed.
Based on “Tatum Ernest, C.; Donohoue, D.; Bauer, D.; Ter Schure, A.; Hynes, A.J. Programmable thermal dissociation of reactive gaseous mercury—A potential approach to chemical speciation: Results from a field study. Atmos. Chem. Phys. Discuss. 2012, 12, 33291–33322”.
Current Address: Atmospheric Chemistry Department, Max Planck Institute for Chemistry, Hahn-Meitner-Weg 1, D-55128 Mainz, Germany.
Current Address: Department of Chemistry, Lawrence University, Appleton, WI 54911, USA.
Atmosphere 2014, 5(3), 575-596; https://doi.org/10.3390/atmos5030575
Submission received: 9 May 2014 / Revised: 17 July 2014 / Accepted: 22 July 2014 / Published: 13 August 2014
(This article belongs to the Special Issue Atmospheric Mercury)

Abstract

:
Programmable Thermal Dissociation (PTD) has been used to investigate the chemical speciation of Reactive Gaseous Mercury (RGM, Hg2+). RGM was collected on denuders and analyzed using PTD. The technique was tested in a field campaign at a coal-fired power plant in Pensacola, Florida. Stack gas samples were collected from ducts located after the electrostatic precipitator and prior to entering the stack. An airship was used to sample from the stack plume, downwind of the stack exit. The PTD profiles from these samples were compared with PTD profiles of HgCl2. Comparison of stack and in-plume samples suggest that the chemical speciation are the same and that it is possible to track a specific chemical form of RGM from the stack and follow its evolution in the stack plume. Comparison of the measured plume RGM with the amount calculated from in-stack measurements and the measured plume dilution suggest that the stack and plume RGM concentrations are consistent with dilution. The PTD profiles of the stack and plume samples are consistent with HgCl2 being the chemical form of the sampled RGM. Comparison with literature PTD profiles of reference mercury compounds suggests no other likely candidates for the speciation of RGM.

1. Introduction

The specific chemical speciation of mercury in flue gas emitted from coal-fired power plants (CFPPs) has important implications for its impact on the environment. The rate of wet and dry deposition and any potential atmospheric reactivity will depend both on the oxidation state of mercury and also on the specific chemical form of any oxidized mercury. The importance of understanding chemical speciation has been highlighted by work that suggests that oxidized mercury may be reduced to elemental mercury in power plant plumes.
The first observations of in-plume reduction were reported by Edgerton et al. [1] who measured Gaseous Elemental Mercury (GEM, Hg°), Reactive Gaseous Mercury (RGM, Hg2+) and fine particulate mercury (Hg-P) at three sites in the southeastern United States (U.S.), using simultaneous measurements of SO2 and NOy to identify plumes from CFPPs. Their measurements suggested that total-Hg (i.e., GEM + RGM) was essentially conserved from the point of emission to the sampling site; however, GEM was the dominant component with less than 20% present as RGM. This contrasted strongly with speciation estimates obtained from EPRI-ICR model equations for CFPPs that burn bituminous coal. The EPRI-ICR model [2] is an empirical correlation model developed with ICR (EPA Information Collection Rule) coal analysis data and stack test data and it predicted that RGM should be the dominant component of the total mercury in the observed plumes.
Lohman et al. [3] simulated nine power plant plume events with a reactive plume model that included a comprehensive treatment of plume dispersion, transformation, and deposition. Their study focused on observations at one of the sites, Yorkville, GA, USA, used in the Edgerton et al. [1] study. The EPRI-ICR model was used to predict the speciation of the mercury emitted from the CFPP’s in the vicinity of the Yorkville site. The reactive plume model was then used to examine any change in the speciation of mercury as a result of in-plume chemistry. The model simulations failed to reproduce any depletion in RGM that could rationalize the observations of Edgerton et al. [1] and, as possible explanations they modeled RGM reduction to GEM in the plume by unknown chemistry, rapid reduction of RGM on ground surfaces, and/or an overestimation of the RGM fraction in the power plant emissions by the EPRI-ICR model. The incorporation of either a pseudo-first order decomposition of RGM or reaction with SO2 as possible in-plume reduction processes produced better agreement with the observations.
Deeds et al. [4] reported on an aircraft study of mercury speciation in a CFPP plume at the Nanticoke generating station in Ontario, Canada. They found that the speciation in the plume was significantly different than the estimated stack speciation. Although they concluded that both elemental and particulate mercury levels were consistent with plume dilution, they did not observe a mass balance in total mercury and they saw significantly lower levels of RGM than would have been expected based simply on plume dilution alone. In contrast, a study carried out at the We Energies Pleasant Prairie Power Plant, Pleasant Prairie, Wisconsin, utilized aircraft and ground measurements and concluded that there was significant reduction in the fraction of Reactive Gaseous Mercury (RGM) (with a corresponding increase in the fraction of elemental mercury) as part of the Total Gaseous Mercury (TGM) emitted from the Pleasant Prairie stack [5]. Both studies demonstrate the difficulties of obtaining quantitative plume data using aircraft sampling.
In this context, the Electric Power Research Institute (EPRI) and the United States Environmental Protection Agency (USEPA) sponsored a major field campaign at CFPP Crist in Pensacola, Florida [6]. The objectives of the campaign were, by making simultaneous measurements of both GEM and RGM in the boiler stack and in the stack emission plume, to (A) determine if significant reduction of RGM was occurring in the plume; and (B) investigate the rate of reaction if significant reduction was observed. If GEM/RGM ratios in the plume were observed to be significantly higher than those ratios within the stack, then this would be evidence of such conversion occurring. The stack measurements were made using both a mercury continuous emission monitoring system (CEMS) and the Ontario Hydro method to inter-compare methods and provide confidence in the measured stack concentrations. Rather than using an aircraft that would traverse the plume, the Crist campaign utilized an airship as a sampling platform that could maintain the sampling instrumentation within the plume and measure at a variety of distances from the stack to follow the evolution of the plume chemistry. The plume measurements were designed to incorporate both a CEMS system that was identical to the stack system, avoiding instrumental bias, together with manual denuder measurements of RGM. In addition, a variety of ancillary measurements were made both in the stack and plume [6].
The chemistry of mercury in combustion emissions has been reviewed in detail by Schofield [7] who concluded that heterogeneous processes are responsible for mercury oxidation in flue gas, with homogeneous gas phase chemistry playing no role. This explains both the variability in the fraction of total mercury that is oxidized in CFPP and the inability of combustion models to predict this variability. Prior work on the speciation of mercury in CFPP flue gas has attempted to quantitatively measure the concentrations of GEM and total RGM. It is currently assumed that mercuric chloride, HgCl2, is the major component of oxidized mercury in the combustor [7,8], and hence the major component of the oxidized mercury in the exhaust plume. However, to date no direct measurements of HgCl2 in either stack or plume gases have confirmed this. Identification of the specific chemical components of RGM would improve our understanding of the mercury oxidation chemistry within power plant combustion systems and allow us to better understand the fate of RGM after it exits the power plant stack and interacts with the ambient atmosphere. Preliminary studies in our laboratory [9] suggested that collection of RGM on denuders coupled with analysis using programmable thermal dissociation (PTD) could provide information on the specific chemical speciation of RGM. As a result, PTD measurements were included as an innovative component of the Plant Crist campaign, but precluding any additional characterization of the PTD approach prior to the field campaign. In this sense, the field measurements were an attempt to characterize the potential of PTD analysis applied to samples collected in a realistic combustion environment. It was in effect a “proof of concept” experiment. The results are, however, of value because of the unique nature of this field experiment, with simultaneous sampling in the stack and the stack plume.

2. Results and Discussion

2.1. Prior PTD Studies

PTD has been used for the analysis of solids containing mercury compounds. The PTD profiles obtained here can be compared with prior published work on solid HgCl2 samples, and other representative mercury compounds. In comparing it is important to note that the prior studies used much higher concentrations of RGM. Since they used small amounts of a solid sample, the oven temperature distribution was, in contrast to this study, not a problem. In addition, some techniques were designed to be able to distinguish between thermal desorption, i.e., the evaporation or sublimation of the mercury compound, and decomposition to produce GEM. Bister and Scholz [10] used PTD to examine mercury speciation in contaminated soils. They used atomic absorption for detection of GEM. Calibration samples were diluted with quartz powder. To distinguish between desorption and decomposition the vapor passed through an 800 °C quartz pyrolysis tube before analysis thus measuring the sum of desorption and decomposition. By bypassing the pyrolyzer they could monitor decomposition alone. Their PTD profile of HgCl2 shows decomposition starting at ~80 °C and peaking at 200 °C. They saw no difference in PTD profiles obtained by bypassing the pyrolyzer and it was concluded that decomposition was occurring exclusively.
Feng et al. [11] used ICPMS detection of GEM, examining aerosol samples collected in Toronto, Canada. The detection technique presumably measured the sum of desorption and decomposition although this was not explicitly discussed. Their calibration samples were diluted using fly ash. For HgCl2 they showed a very broad PTD profile with decomposition/desorption starting at 100 °C and peaking at 300 °C.
Lopez-Anton et al. [12] used a commercially available thermal dissociation module coupled with a CVAFS detector. They used a pyrolyzer prior to analysis and would have detected both dissociated and desorbed/sublimed RGM. They examined fly ash and solid mercuric compounds generating standards by mixing pure compounds with powdered quartz and obtained a very sharp HgCl2 PTD profile with appearance at ~70 °C and the peak at 125 °C.
Wu et al. [13] used mass spectrometry and this allowed them to simultaneously monitor decomposition, producing GEM, and desorption, monitoring HgCl2 directly. Their standard compounds were diluted with several solid powders. Commercial SiO2, TiO2, Al2O3, and coconut shell AC were used as diluents and interestingly, both the shape of the PTD profile and the ratio of GEM:HgCl2 varied dramatically as a function of the diluent powders. For example, using the powdered quartz diluent a broad PTD profile was obtained with a peak at 150 °C and with GEM and HgCl2 being detected in equal amounts. In contrast, a PTD profile with Al2O3 diluent was much sharper with a peak at 150 °C but consisting exclusively of GEM.
These studies also examined the PTD profiles of other Hg(II) and Hg(I) compounds, HgS, HgSO4, HgO, HgBr2, Hg2Cl2 and Hg2SO4. In general, the non-halide Hg(II) compounds are found to dissociate at higher temperatures than HgCl2 although there is considerable variability between the studies. Lopez-Anton et al. [12] show a PTD profile for HgBr2 that has its decomposition peak shifted slightly to lower temperature relative to HgCl2. It is also clear that there is significant variability in the results of these studies.
In addition to using considerably higher mercury concentrations than our work, all of the studies used a linear temperature ramp in contrast to the ramp and hold sequence that was used here. As we note below we have now switched to a linear ramping sequence. Unfortunately, we were not aware of the two prior literature studies [10,11] at the start of the Crist campaign in 2008, hence our decision to use the ramp and hold sequences described as “oven 1” and “oven 2”. The “oven 2” sequence is probably closest to a straight ramping sequence and the “oven 2” profiles are similar to published PTD profiles and to our more recent, better defined work shown in Supplemental Figure S1 The “oven 1” profiles show more variability and if the work of Wu et al. [13] is correct this may be due at least in part to the competition between sublimation and decomposition. We plan to modify our implementation of PTD by incorporating a pyrolyzer and second LIF detection cell to be able to simultaneously monitor both dissociation and desorption/sublimation profiles.

2.2. Laboratory HgCl2 PTD Profiles

Laboratory PTD profiles of HgCl2 were obtained after the completion of the Crist field experiment using two thermal ramping schemes that we denote as “oven 1” and “oven 2”. Figure 1 shows the individual and averaged calibration profiles obtained at a single deposition flow for the “oven 1” thermal cycle. The LIF signal has been normalized by the signal resulting from the injection of known amounts of GEM, as described in Section 3.6.
Figure 1. Six programmable thermal dissociation (PTD) profiles using Oven 1 program for an uncoated tubular denuder loaded with pure HgCl2. Denuders were loaded by flowing N2 over pure HgCl2 for 1 min at 135 sccm. The average of the six profiles is also shown.
Atmosphere 05 00575 g001
Figure 1 indicates the reproducibility of 6 PTD profiles obtained by depositing pure HgCl2 under nominally identical conditions. The HgCl2 loadings varied considerably. Possible reasons include fluctuations in the gas phase concentration of HgCl2, variations in denuder collection efficiency, and variation in competition between desorption of molecular HgCl2, which we would not detect, and decomposition to produce GEM which we do detect. We have found it difficult to develop stable sources of HgCl2 for calibration purposes and this represents a major challenge in this type of experiment.
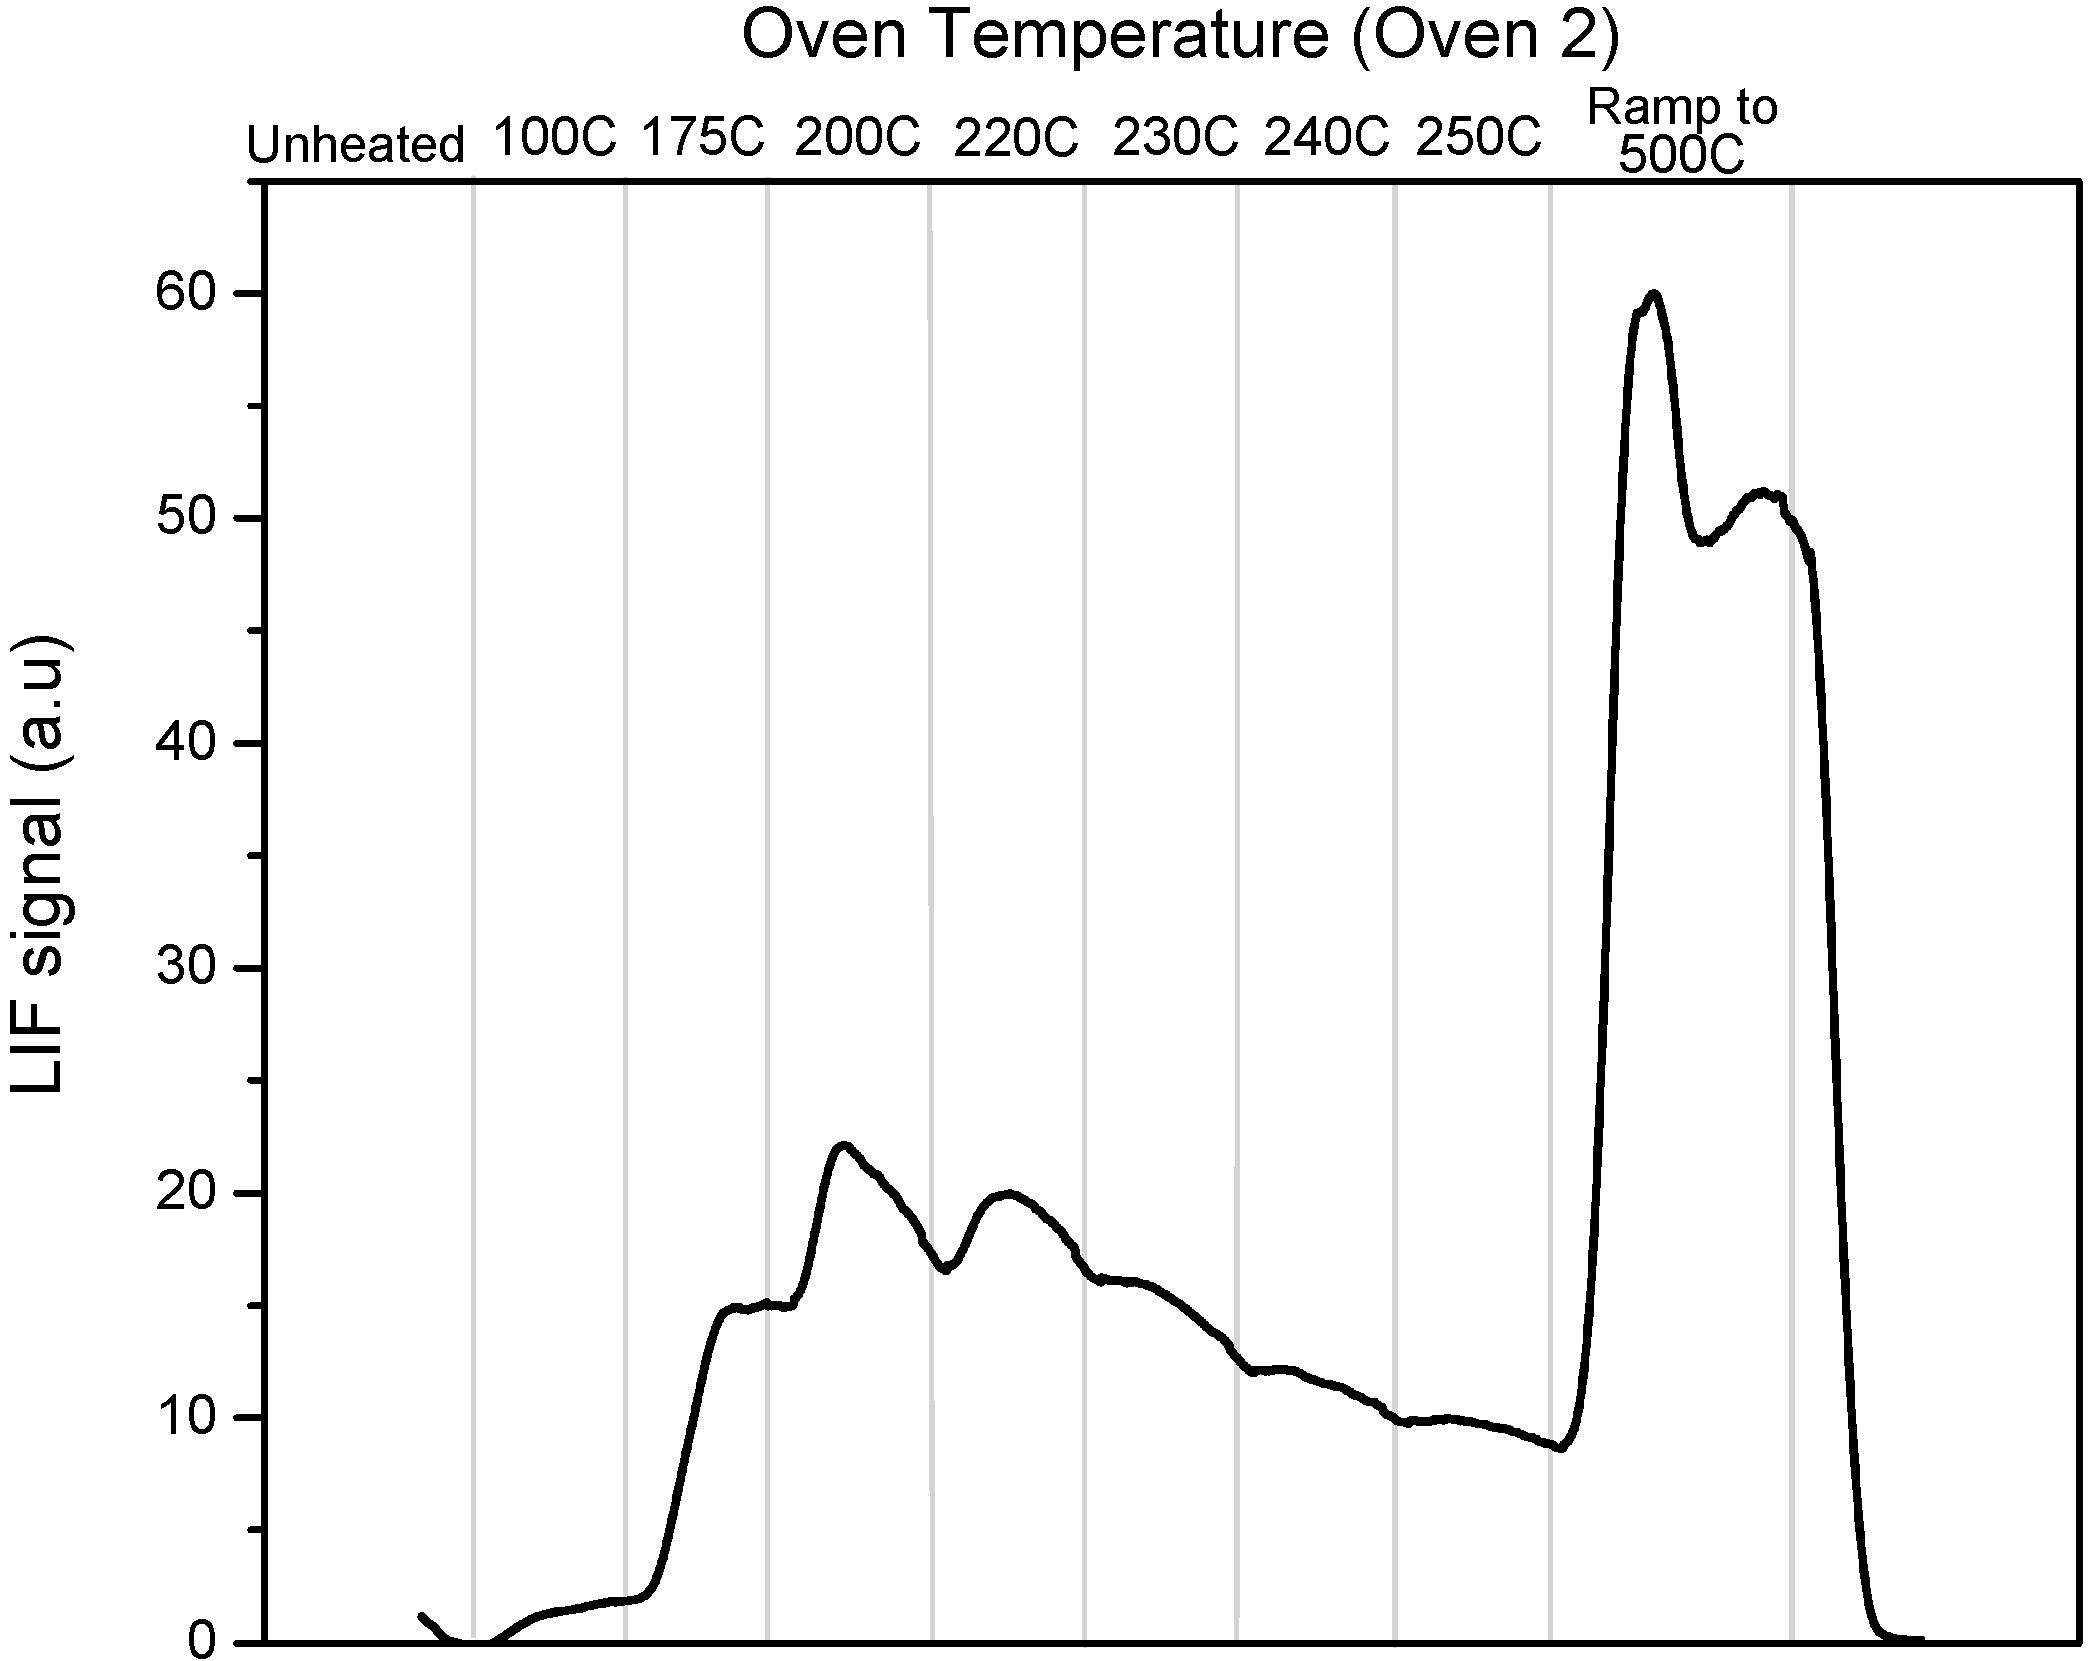
As a result of time constraints we were only able to obtain a single calibration profile obtained for the “oven 2” profile which is shown in Figure 2.
Figure 2. PTD profile using Oven 2 program for an uncoated tubular denuder loaded with pure HgCl2.
Atmosphere 05 00575 g002
Some of the variability in the shape and structure of the PTD profiles has been determined to be a function of the deposition pattern of RGM on the denuder, the very significant temperature gradient along the denuder during the heating cycle, and the direction of buffer gas flow during both sampling and analysis. During the Crist measurements RGM was sampled over the whole denuder surface including the ends that are located outside of the oven and the direction of gas flow was not noted during sampling. As discussed below, we have found that during the heating cycle the center portion of the denuder heats most rapidly and the initial production of GEM reflects dissociation of RGM in this section of the denuder. The temperature in the PTD profile figures is the temperature as read by the oven thermocouple and most closely reflects the temperature of the central section of the denuder; the ends of the denuder are significantly cooler. As the temperature increases RGM deposited further from the center reaches decomposition temperature and the final ramp produces decomposition over most of the length of the tube. The oscillations in the PTD profiles appear to be the result of this effect in conjunction with the “ramp and hold for 5 min” sequence that we used for temperature ramping at Crist.
In addition, RGM deposition appears to be a function of flow direction, presumably maximum deposition occurs as the flow enters the denuder and decreases as the RGM concentration is depleted as the gas flows down the denuder. The flow-effect becomes more significant as the RGM loading increases. One consequence of the flow-effect is that dissociation profiles are more reproducible if the direction of gas flow through the denuder is the same during sampling and analysis. Since the direction of the sampling flow was not noted during stack sampling, this variation, together with a lack of reproducibility in the oven cycling, contributes to variation in the PTD profiles. The “post-Crist” improvements that have eliminated these problems are discussed below. Nonetheless, these issues affect the work at Crist and the initial calibration profiles obtained at the end of the campaign. In spite of this, the unique nature of the sampling opportunity, with simultaneous measurements in the stack and plume do allow us to draw useful conclusions, as we discuss below.

2.3. Stack PTD Profiles

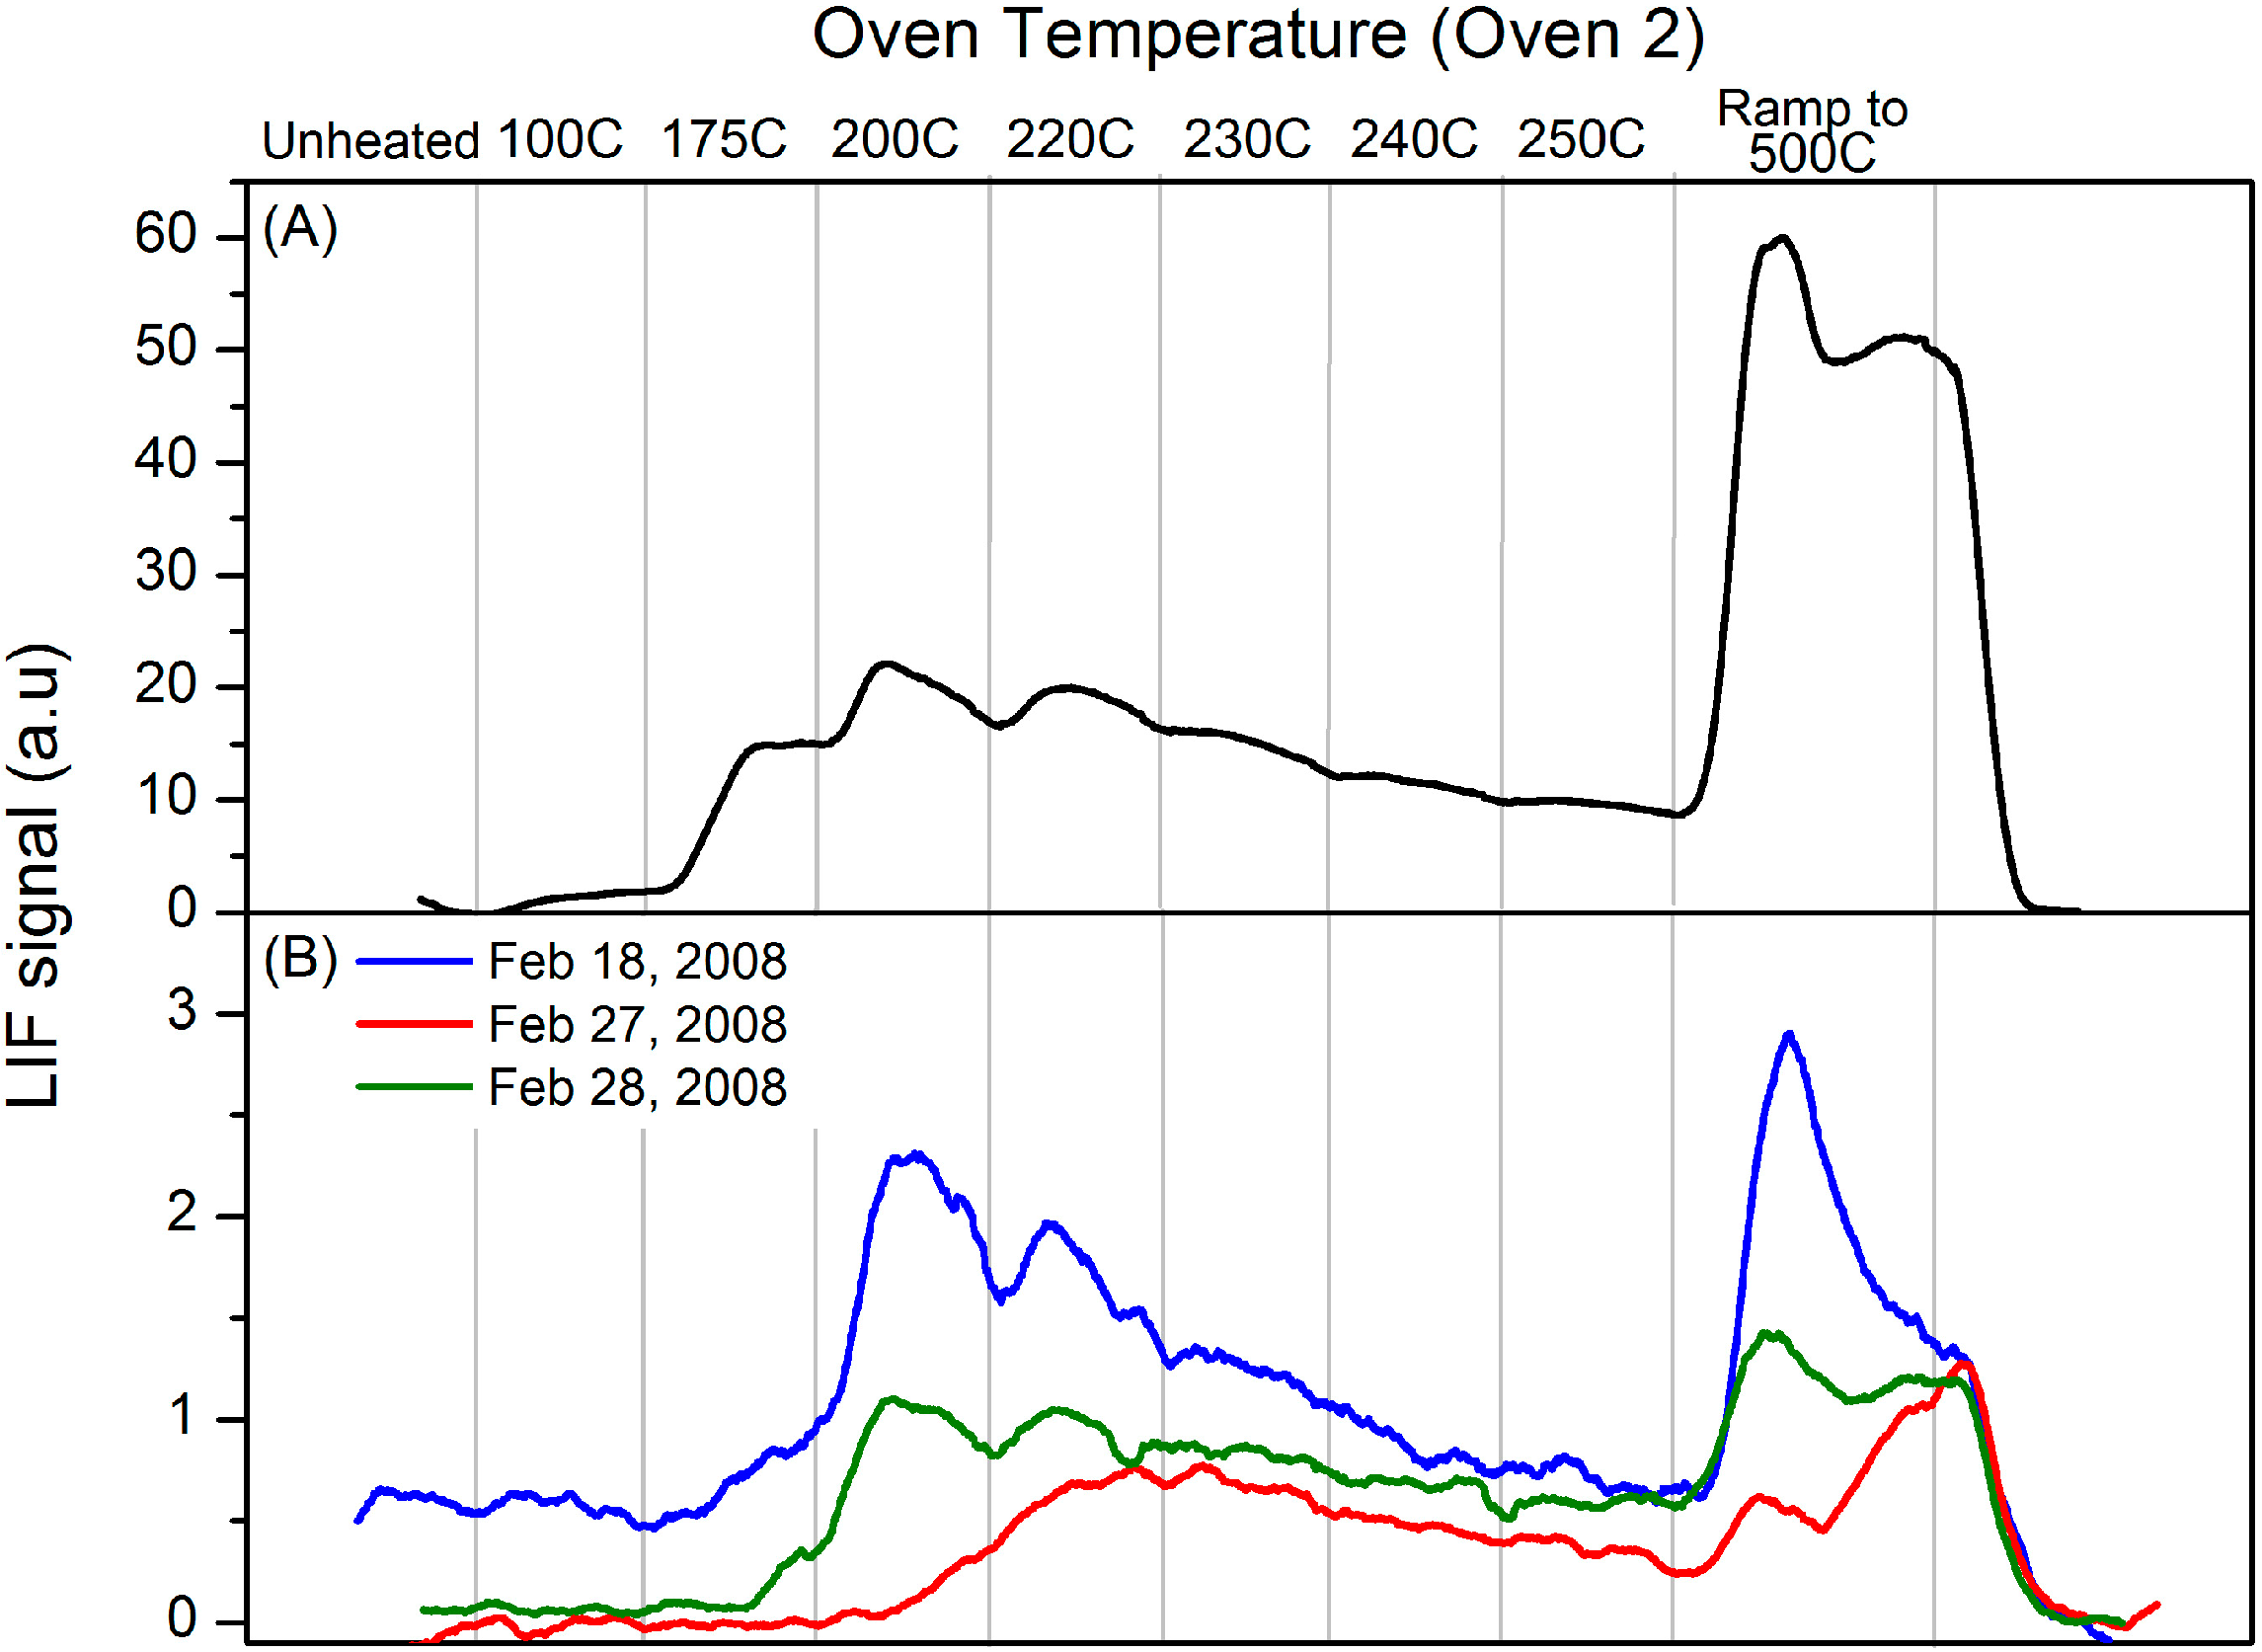
Figure 3b shows PTD profiles for several stack samples analyzed using the “oven 2” thermal cycle described below. The “oven 2” PTD profile for pure HgCl2 (Figure 2) is shown again for comparison in Figure 3a. The stack profiles show a sharp onset of RGM dissociation at ~200 °C. GEM continues to evolve as the temperature increases, with a spike in RGM dissociation as the oven temperature is ramped to 500 °C. The profiles are similar to the calibration HgCl2 profiles although the onset of dissociation occurs at a slightly lower temperature in the HgCl2 profiles. Nevertheless, the profiles shown in Figure 3 are quite similar and consistent with the HgCl2 calibration profile and the onset of RGM dissociation was quite consistent. The observation that these profiles are consistent with the HgCl2 profiles does not constitute a definitive identification of HgCl2.
Figure 3. Panel (A). Calibration profile obtained using Oven 2 program for denuder loaded with pure HgCl2; Panel (B). Dissociation profiles obtained using Oven 2 program for stack samples collected 18, 27 and 28 February 2008.
Atmosphere 05 00575 g003
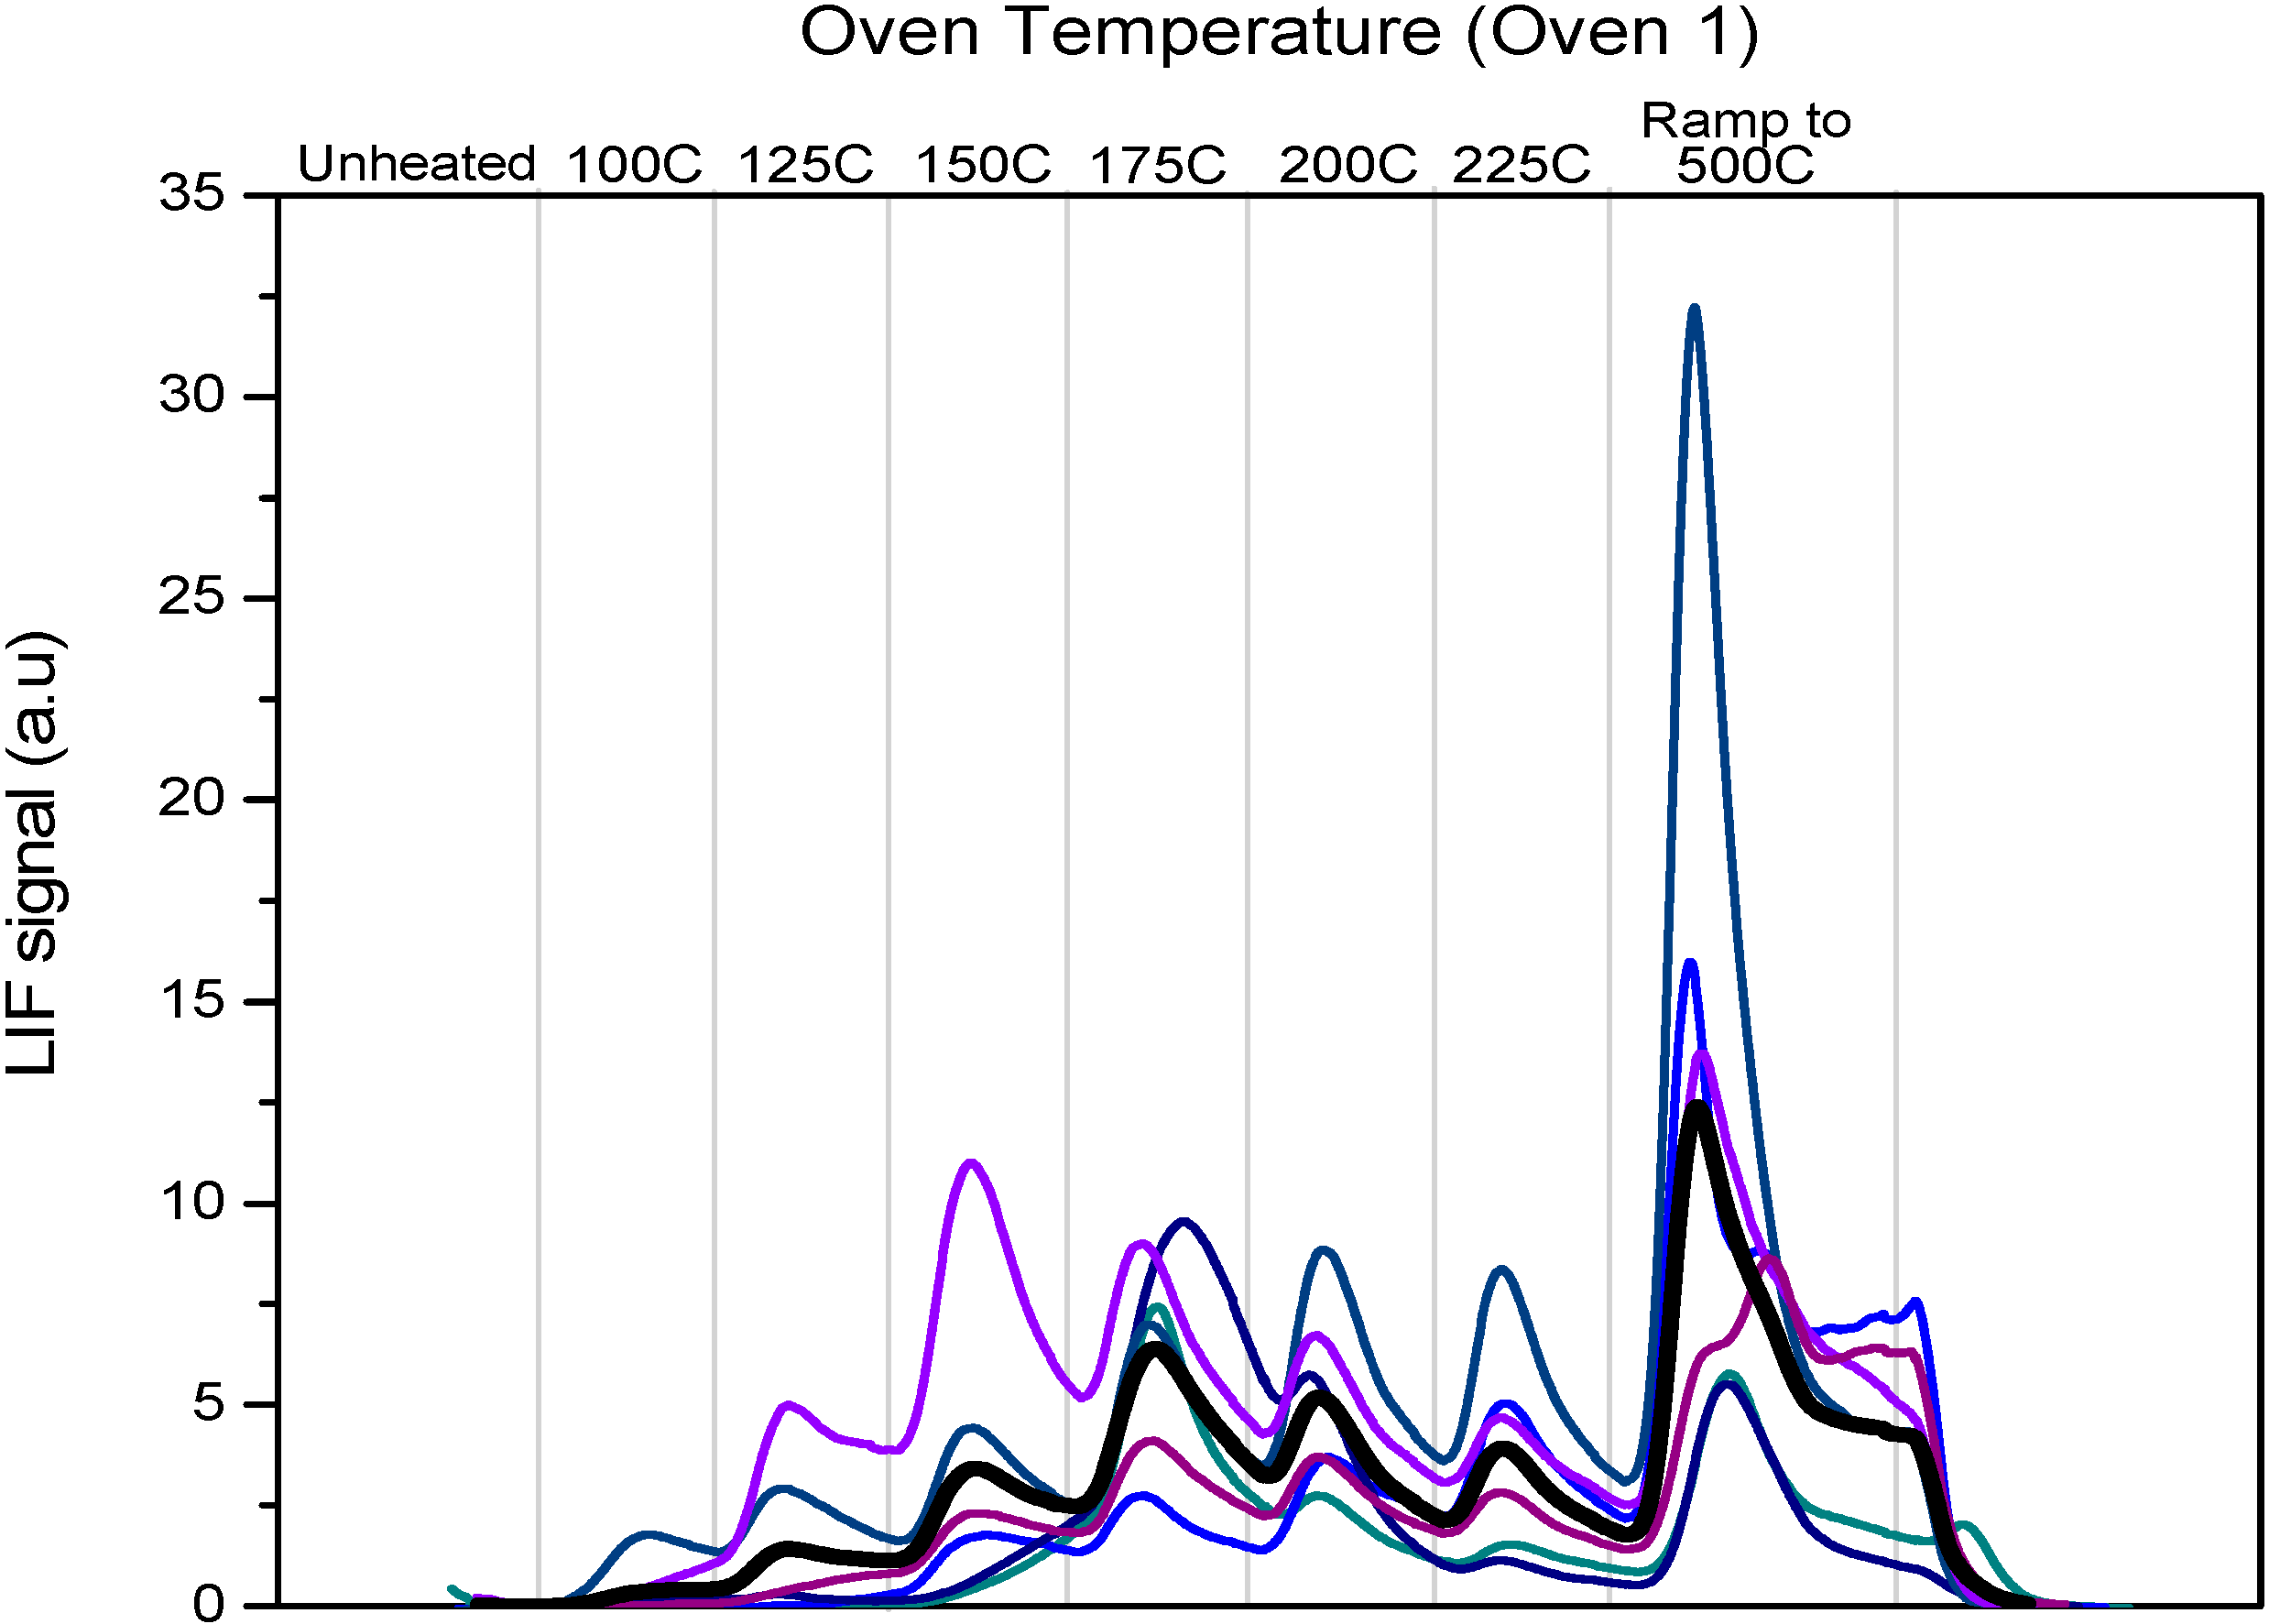
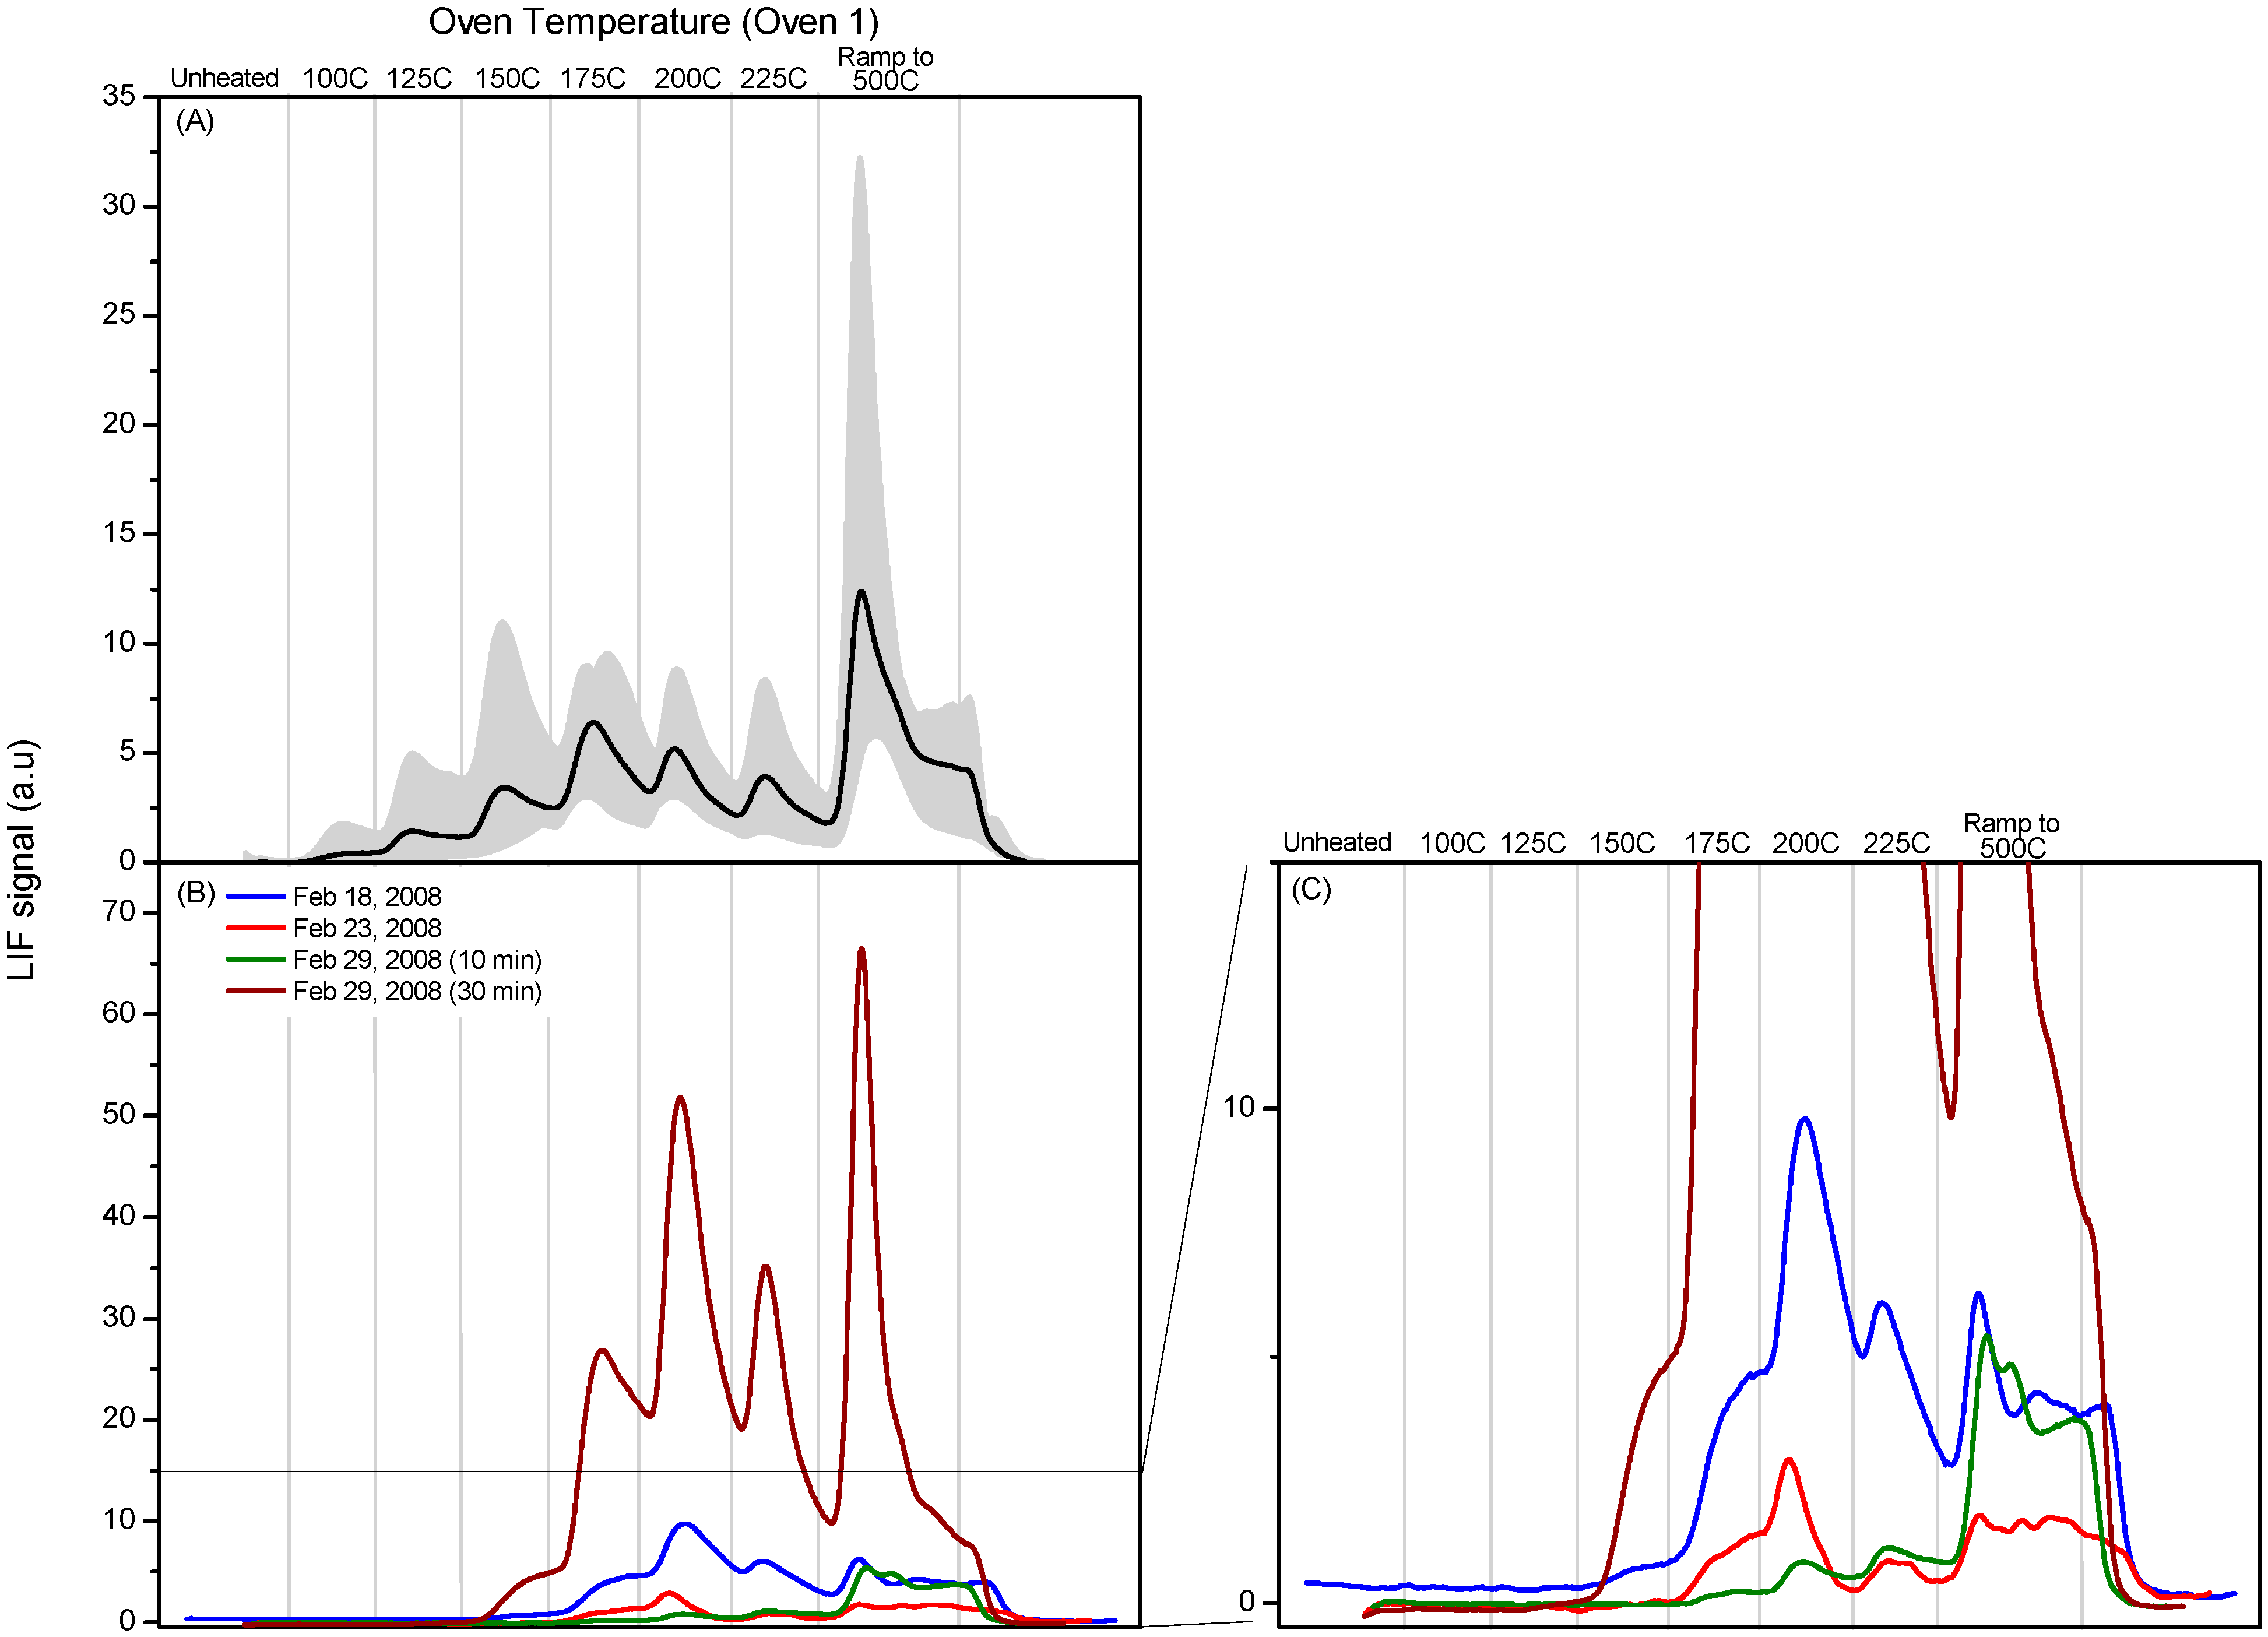
Figure 4b shows PTD profiles of stack samples analyzed with the “oven 1” cycle described below together with the averaged “oven 1” PTD profile of HgCl2 shown in Figure 4a. The grey shading in this and subsequent “oven 1” PTD figures spans the minimum and maximum signals observed. The “oven 1” profiles have a slower temperature ramp between 100 and 200 °C; however, we saw no evidence for any RGM species with a lower peak decomposition temperature. The “oven 1” PTD profile for pure HgCl2 shows measurable decomposition at 100 °C and typically peaks at ~200 °C. In the “oven 1” PTD profiles of stack samples, decomposition begins at a slightly higher temperature but the peak decomposition temperatures of the majority of the stack PTD profiles are consistent with HgCl2 being the sampled component of the deposited RGM. We should emphasize that this does not identify or prove that the compound is HgCl2; however, we do not see any evidence for a species with a peak decomposition temperature that is significantly lower and could clearly be identified as not being consistent with HgCl2.
Figure 4. Panel (A): Calibration profile obtained from average of six PTD profiles using Oven 1 program for denuder loaded with pure HgCl2. The grey shading spans the minimum and maximum signals observed; Panels (B,C): Dissociation profiles obtained using Oven 1 program for stack samples collected 18, 23 and 29 February 2008.
Atmosphere 05 00575 g004
As we discuss above, the variation and reproducibility of the PTD profiles is a function of the deposition pattern, the temperature gradient, reproducibility of oven temperature cycling, and the direction of gas flow during both sampling and analysis. During stack sampling it is reasonable to assume that a variety of compounds that are present in the stack gas are being co-deposited on the denuders and this may have some impact both on the decomposition temperature and the competition between desorption and decomposition. It is also possible that chemical reactions can take place on the surface of the denuder between deposited RGM and other components of the stack gas. In-situ spiking of the stack gas with HgCl2 could address the impact of co-deposition effects.

2.4. In-Plume Sampling

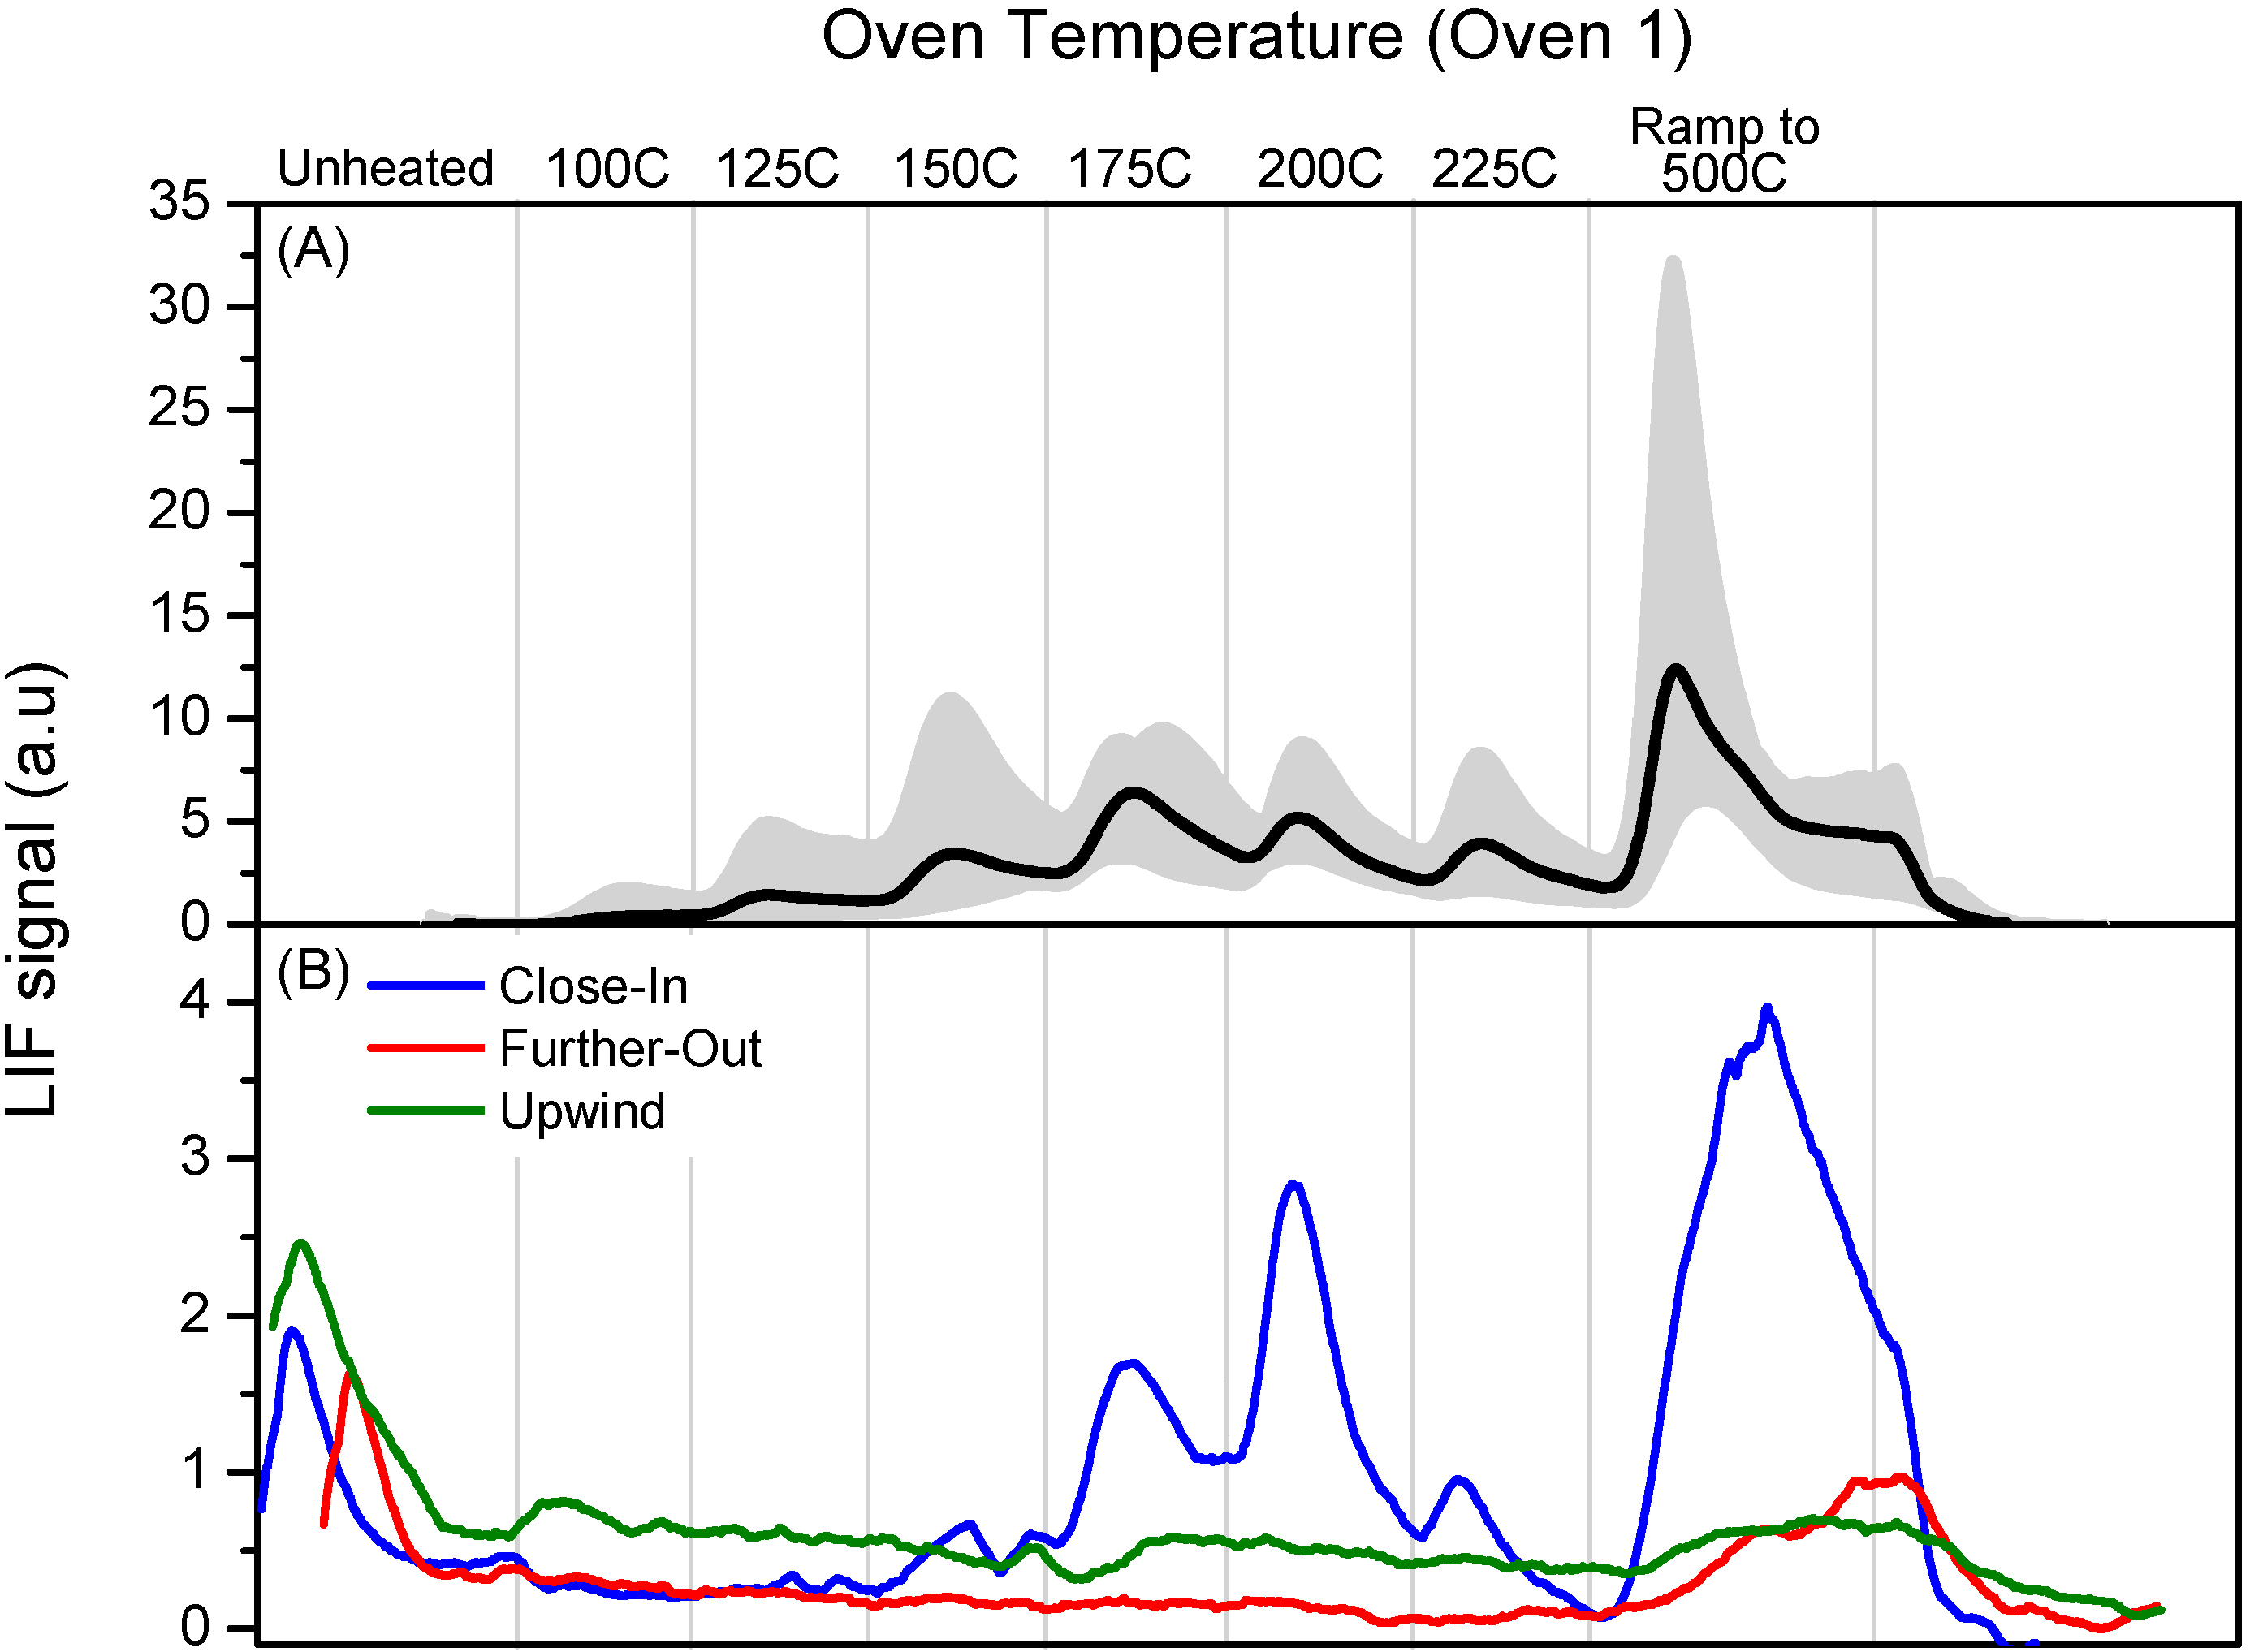
Figure 5b shows profiles from 28 February, showing the similarity in PTD profiles sampled in the stack and plume. The upwind sample was located approx. 4 km upwind of the Crist plant, Close-in was a sample collected approx. 0.6 km downwind of the Crist plant and further-out was a sample collected approx. 1.5 km downwind of the Crist plant.
Figure 5. Panel (A): Calibration profile obtained from average of six PTD profiles using Oven 1 program for denuder loaded with pure HgCl2. The grey shading spans the minimum and maximum signals observed; Panel (B): Dissociation profiles obtained using Oven 1 program for airship samples collected 28 February 2008.
Atmosphere 05 00575 g005
The “close-in” sample shows a well-defined thermal dissociation profile that is similar to the stack profile of the morning of the 29 February 2008, as seen in Figure 4, burning an identical coal mixture. The airship profiles show a GEM signal that occurs prior to the heating cycle. This preheat mercury signal was observed in all of the airship samples including those that were not able to detect any plume RGM. No preheat mercury signal was observed in any of the stack samples. This could be a result of a contamination problem in the adapters used to plumb the screw-end denuders into the analysis gas flow system but its origin was not identified. 
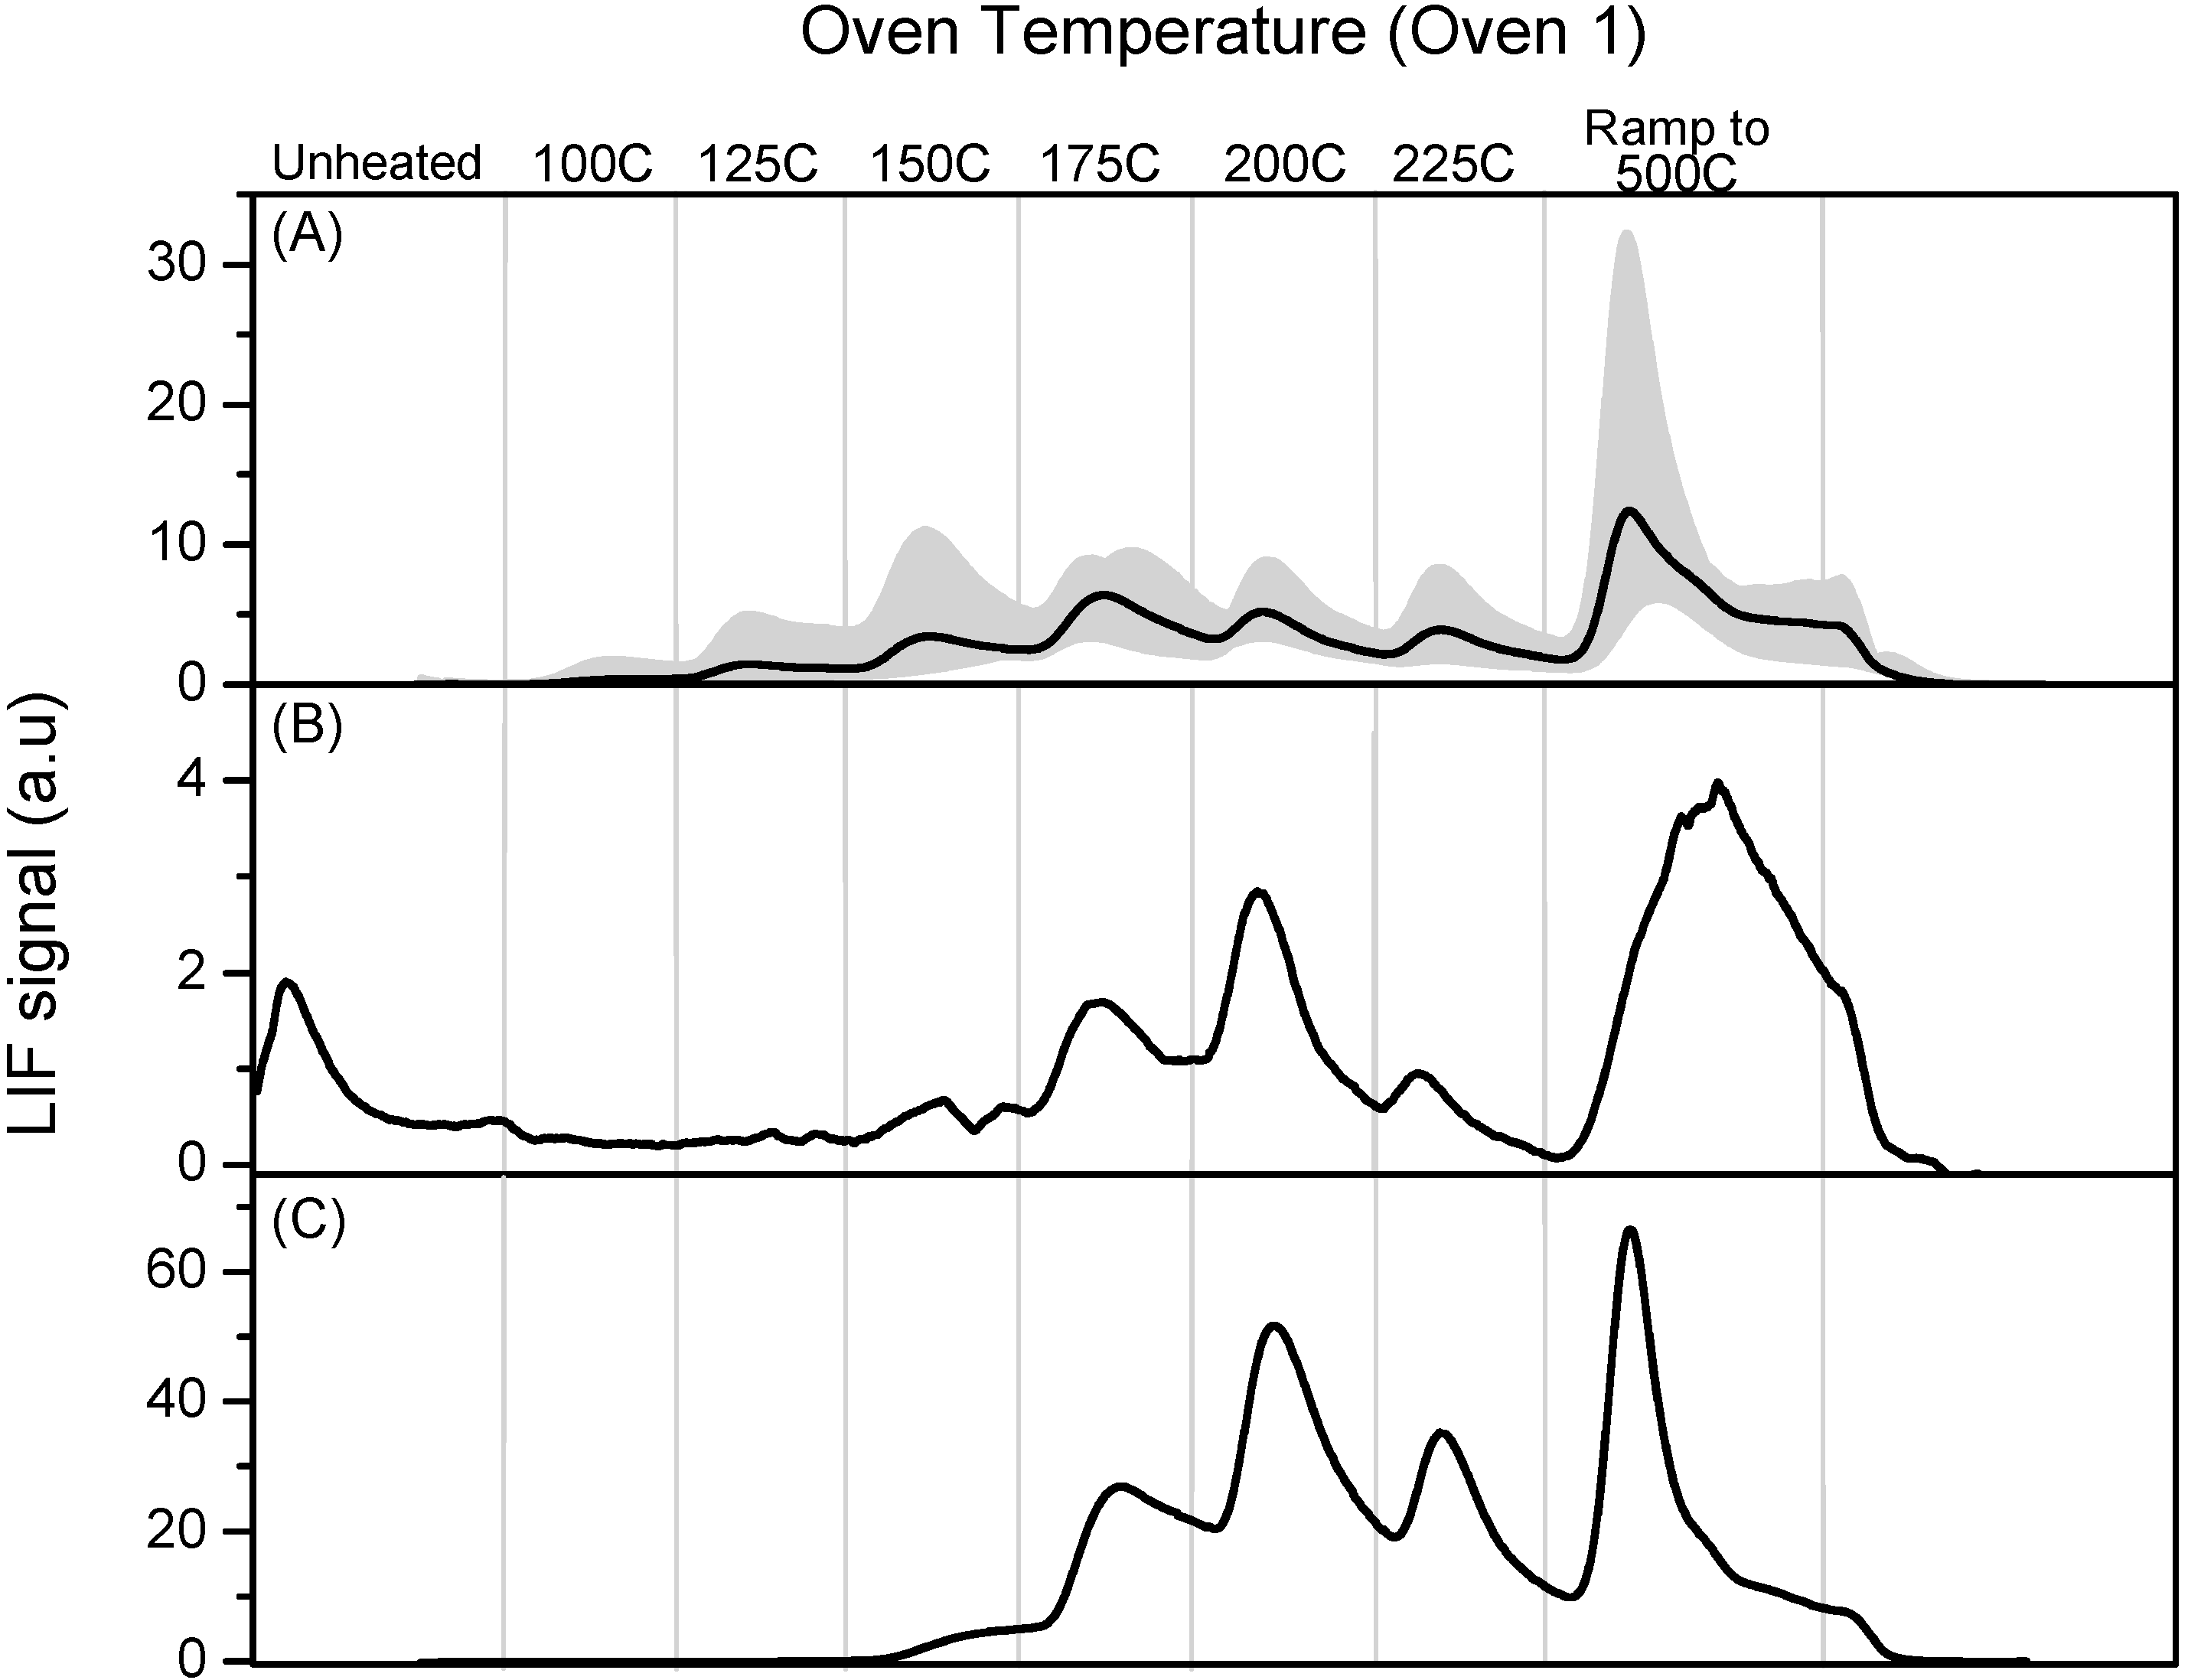
Figure 6 shows the PTD profiles of HgCl2, the “close-in” blimp sample and the stack sample from the morning of the 29 February 2008.
The similarity between the PTD stack and blimp profiles and their similarity to the HgCl2 profile suggest that the species sampled from the stack and the plume are the same and are consistent with the chemical speciation of the sampled RGM being HgCl2. The coal that was used during this sampling period contained the highest level of chlorine seen during the Crist campaign, constituting 97% of the total halogens with a bromine content of 0.16% and fluorine as the balance. Comparing PTD profiles of HgCl2 with the PTD profiles of the stack and plume samples suggests they are consistent with HgCl2 as the specific chemical speciation of sampled stack RGM but, as discussed above, this does not prove that the stack RGM is HgCl2. It could also consist of other oxidized mercury compounds that have a similar PTD profile to HgCl2. One possible explanation of the observations of Edgerton et al. [1] is that a component of RGM undergoes slow thermal decomposition at ambient temperatures. No evidence for a significant component of the RGM sample that has a significantly lower decomposition temperature than HgCl2 was observed.
Figure 6. Panel (A): Calibration profile obtained from average of six PTD profiles using Oven 1 program for denuder loaded with pure HgCl2. The grey shading spans the minimum and maximum signals observed; Panel (B): Dissociation profiles obtained using Oven 1 program for “close-in” airship sample collected 28 February 2008; Panel (C): Dissociation profiles obtained using Oven 1 program for stack sample collected 29 February 2008.
Atmosphere 05 00575 g006

2.5. Denuder Sampling Efficiencies

The objective of this component of the Crist study was to investigate the potential of PTD for chemical speciation of RGM. The collection efficiency of the denuder is not known and PTD will not give a quantitative measurement of RGM concentration under these conditions. However, the PTD profiles were also calibrated for Hg° as discussed in Section 2.6. This provides an approximate measure of the total amount of RGM collected on the denuder. Since the RGM stack concentrations were measured independently, we can obtain an approximate measure of the sampling efficiency of the denuders as a check on the integrity of the measurements. For example, a sampling efficiency in excess of 100% would imply major problems with denuder contamination.
All denuder sampling was performed under laminar flow conditions and a theoretical sampling efficiency can be estimated using the Gormley-Kennedy equation [14]. This assumes laminar flow and a sticking coefficient of 1 and requires a tube diameter and a flow rate, which are known, and a diffusion coefficient for the species of interest, which is not known. If a diffusion coefficient of 0.1 cm2∙s−1 is assumed, a typical value for molecules in air, we calculate a sampling efficiency of ~60% for the stack sampling and ~70% for plume sampling. If we assume that the chemical identity of the RGM is HgCl2, we can estimate a diffusion coefficient of 0.04 cm2∙s−1 using the mass relationship from Schwarzenbach et al. [15] and this would give calculated sampling efficiencies of 35% and 43% at the stack and plume sampling flow rates.
To estimate the actual denuder sampling efficiencies, the total amount of RGM that was sampled was calculated from the stack RGM concentrations as measured by the CEMS instrumentation and sampling flow rate through the denuder. The RGM that was actually deposited on the denuder was taken from the total calibrated PTD profiles and included the final peak obtained during the temperature increase to 500 °C. The RGM actually deposited on the denuder was then divided by the calculated total sampled amount based on the flow and stack concentrations. This then gives an estimate of the denuder sampling efficiency, i.e., the amount of RGM collected on the denuder compared with the total amount of RGM that was sampled from the stack and then flowed through the denuder, but did not necessarily deposit on the walls. These sampling efficiencies are estimates since some RGM was deposited on the ends of the denuders and was not measured. As noted above, it is possible that some of the deposited RGM evaporated before decomposition to Hg° and this would not have been measured.
The efficiencies for stack profiles shown in the figures are given in Table 1. A total of 28 stack profiles were analyzed with sampling efficiencies that ranged from ~1% to 55%. Sampling efficiencies from samples obtained with the particle filter in place were typically much lower than estimated from the Gormley–Kennedy equation, ranging from ~1% to 30%. Three PTD stack profiles were obtained without the particle filter in the sampling stream and the calculated sampling efficiencies were 50%, 55% and 37%, much closer to the estimated values so it appears that the presence of the filter significantly reduced the sampling efficiency. This does not appear to be due to collection of particulate mercury when the filter was removed. These samples were obtained downstream of the electrostatic precipitator and Ontario Hydro measurements found that the concentration of particulate mercury was below detection limits. We have looked at the variability in greater detail. Based on a total of 24 samples taken with the filter the mean and standard deviation of the RGM/m3 is 0.46 ± 0.66 ug/m3, taking only samples collected using etched denuders we obtain 0.25 ± 0.19 ug/m3 and those analyzed using the oven 2 cycle 0.35 ± 0.24 ug/m3. For the samples taken without the filter the average is 2.7 ± 1.0 ug/m3. It is clear that the presence of the quartz filter significantly reduced the collection efficiency and we have no explanation for this. The significant variability is also clear and it does not appear to be explained by differences in analysis, i.e., oven program, or tube etching.
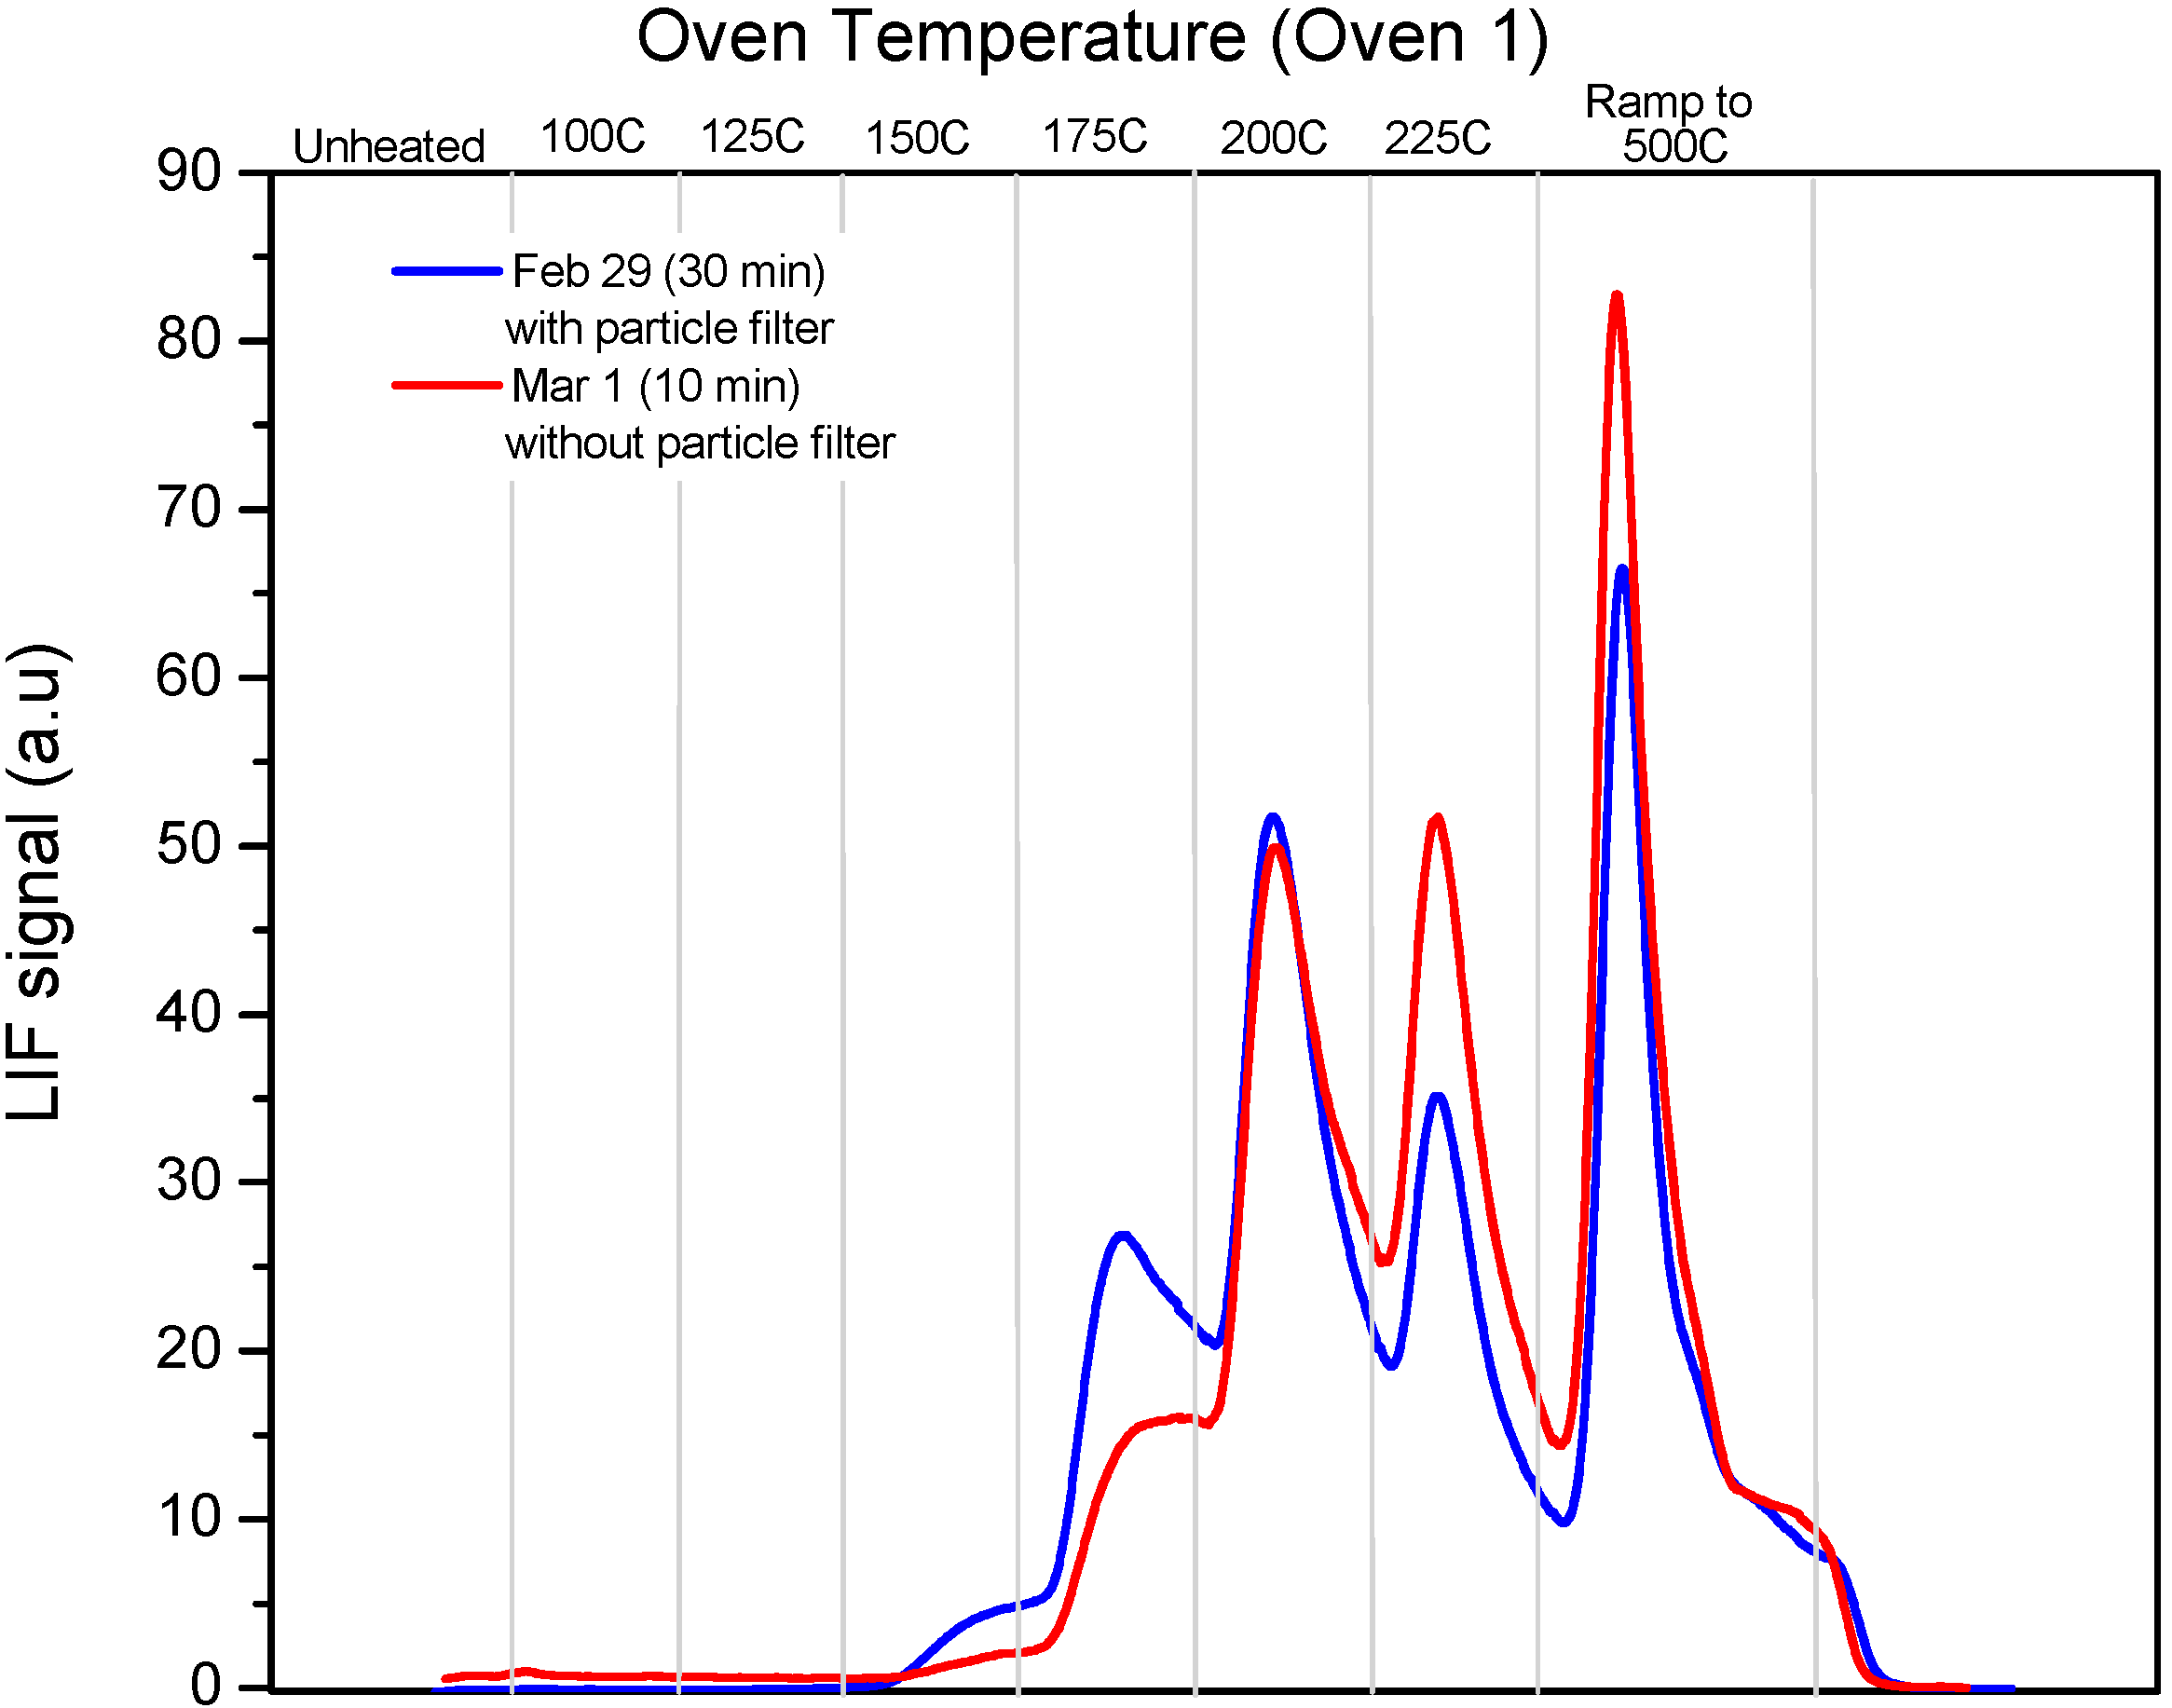
In Figure 7 we show PTD profiles of two samples taken within a 24-h period burning identical coals. One, a 30 min stack sample from 29 February was taken with the filter in place, while the other, a 10 min stack sample from March 1st was taken without the filter. The similarity between the profiles suggests that the filter did not affect the speciation of the deposited RGM, while the difference in sampling time shows the reduced collection efficiency when the filter was in place. It is important to also recognize that the measured RGM in the stack gas was variable and there was disagreement of up to 40% in the stack RGM measurements using different approaches.
Figure 7. Comparison of PTD profiles (using Oven 1 program) of a 30 min stack sample obtained on 29 February 2008 with the particle filter in place and a 10 min stack sample obtained on 1 March 2008 without the particle filter.
Atmosphere 05 00575 g007
An estimate of the collection efficiency of the in-plume samples requires a comparison between sampled RGM and that predicted using the measured stack concentrations and calculated plume dilution ratios. Dilution ratios were based on the measured concentrations of three tracer gases, SO2, NOy and CO2, which were measured in stack and also in the airship. 
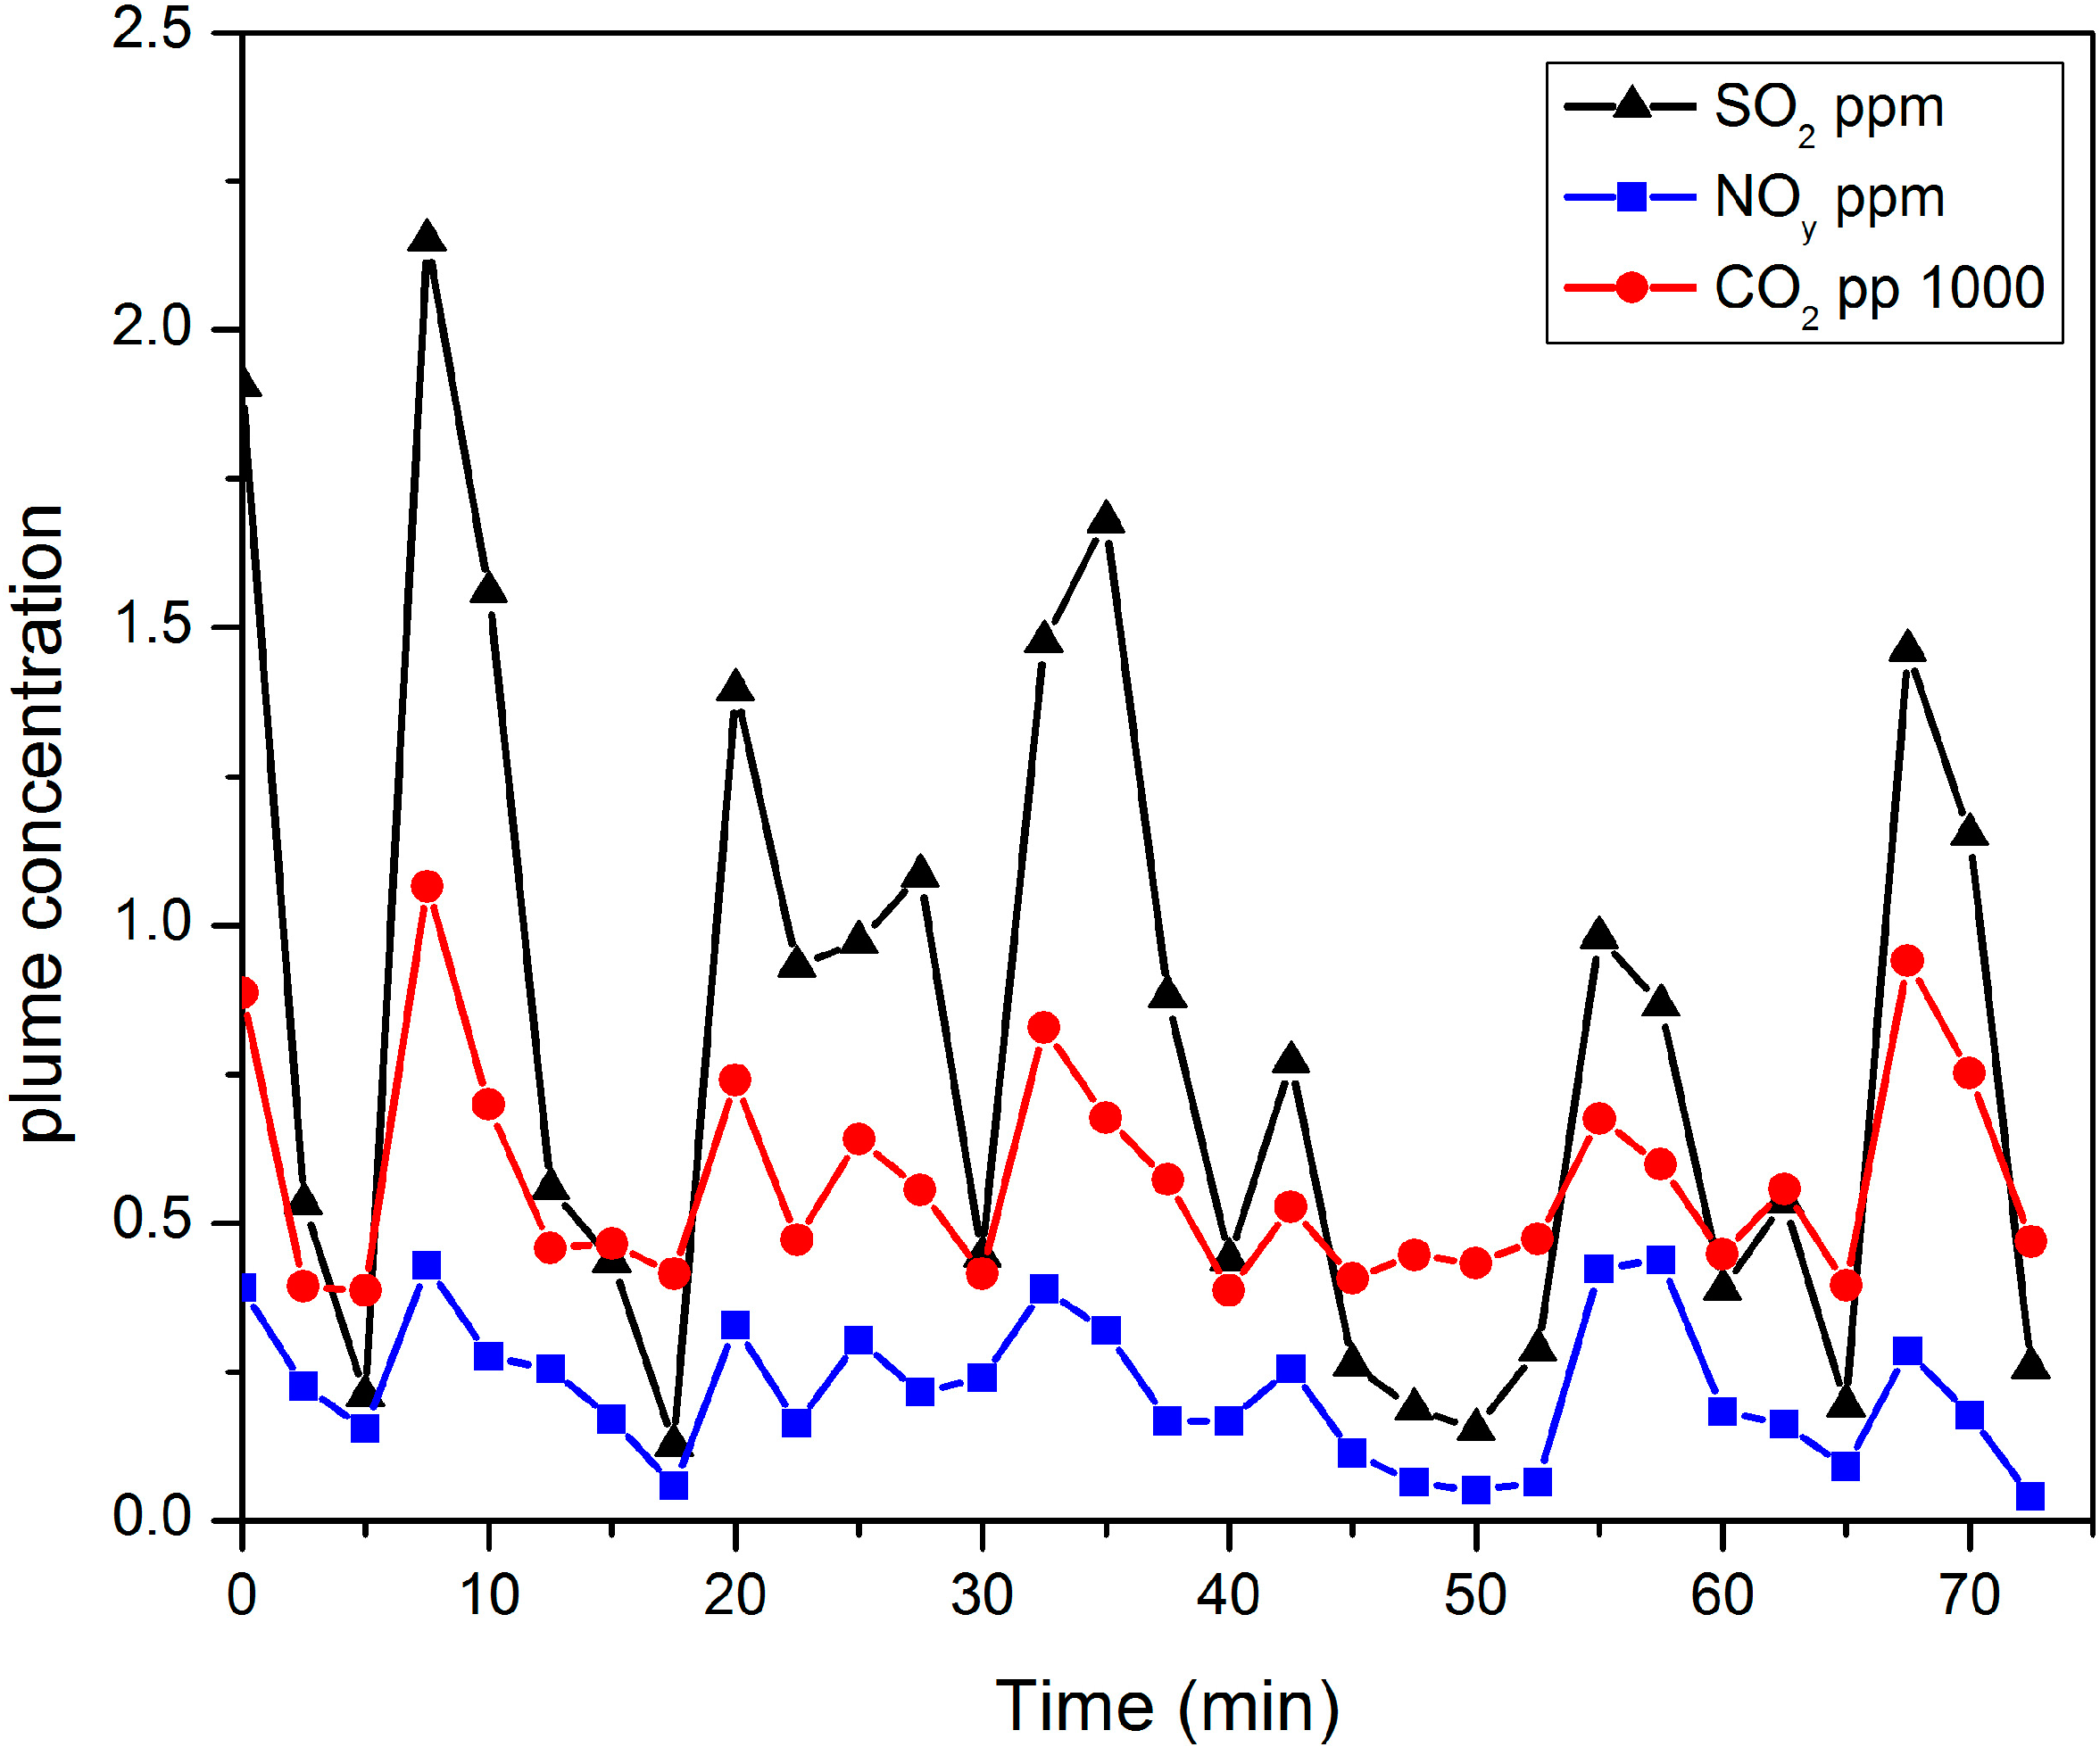
Figure 8 shows the “background corrected” concentrations of SO2, NOy and CO2 as measured by the airship’s sampling system during the 75-min “close-in” sampling run on 28 February.
Figure 8. “Background corrected” concentrations of SO2, NOy and CO2 as measured by the airship’s sampling system during the “close-in” sampling run on 28 February.
Atmosphere 05 00575 g008
The background correction was obtained by subtracting the concentrations measured upstream of the plume. The concentrations shown in Figure 8 reflect the increase in the concentration of these gases over ambient as the plume gases mix with ambient air. There was little variation in the stack concentrations during the sampling period and the observed variations reflect the difficulties of keeping the airship’s sampling system in the plume. The measured airship concentrations of SO2, NOy and CO2 can be used to calculate the dilution of the plume gases as the plume evolved and mixed with ambient air. Because of the variation in concentration, the dilution ratios were calculated for 2.5 min coincident time bins for each tracer gas. The calculated dilution ratio for each tracer gas was then multiplied by the stack RGM concentration measured by the CEMS instrumentation to calculate the mass of RGM sampled by the denuder during each 2.5 min bin. This was summed to calculate the total mass of RGM sampled by the denuder during the 75-min sampling period based on each tracer dilution ratio. Table 1 shows the calculated total amount of RGM sampled by the denuders at the “close-in” and “further-out” positions. These amounts are calculated from the RGM concentration measured in the stack by the CEMS instrument and the calculated dilution ratio from each tracer. The difference between the values calculated using the three tracers reflects the fact that the three tracers give different integrated dilution ratios, an indication of the difficulty of the measurement.
Table 1. Estimated denuder collection efficiencies for in-plume samples obtained 28 February 2008.
Airship SampleDenuder TypeActual RGM * Deposited on Denuder (ng)Total RGM ** Sampled by Denuder (ng) as Calculated from Dilution RatiosDenuder Collection Efficiency (%) as Calculated from Dilution Ratios
SO2NOyCO2SO2NOyCO2
“Close-in”unetched quartz1.191.782.161.196755100
“Further-out”unetched pyrex0.130.410.730.41321832
* As determined using PTD technique; ** Based on CEMS stack concentration and calculated dilution ratio for each tracer.
The observation of the early Hg° signal and the drifting baseline complicate the analysis of the dissociation profiles in Figure 3. The “close-in” profile shows a well-defined dissociation profile between 150–225 °C and a larger area in the final ramp to 500 °C. Taking the total integrated sample gives ~1.3 ng of Hg°, 0.61 ng in the structured profile and 0.66 ng in the final ramp to 500 °C. If we take the 0.08 ng from the upwind sample as our field blank we calculate 0.13 ng of RGM deposited on the “further-out” denuder and 1.19 ng deposited on the “close-in” denuder. If we then compare this with the total RGM sampled by the denuders, as calculated from dilution ratios, we find sampling efficiencies of 67% and 55% using the SO2 and NOy dilution ratios and 100% from the CO2 dilution ratio. For the “Further-out” denuder we calculate sampling efficiencies of 32%, 18% and 32% respectively. Given the large uncertainty in the dilution ratios these efficiencies suggest that the RGM sampled in-plume is consistent with the levels measured by the CEMS instrument in the stack. This, together with the PTD profiles of the stack and plume samples shown in Figure 6 suggests that it is possible to use PTD to measure a component of RGM in the stack and follow its evolution in the plume. It also suggests that the speciation of the RGM is not changed during this period and that it is consistent with HgCl2 as the speciation of RGM. This can be compared with the observations of Deeds et al. [4] who found greatly decreased levels of RGM and no mass balance.

2.6. RGM Speciation

As we have noted above, it is important to emphasize that the generally held opinion that HgCl2 is the species of RGM emitted from coal-fired power plants is not based on any experimental evidence, or on any reasonable mechanism for homogeneous formation of HgCl2 in coal combustion. The PTD profiles shown here are clearly consistent with identifying the speciation of stack and plume RGM as HgCl2 and represent the first actual experimental evidence that is consistent with HgCl2 speciation. It is reasonable to ask if any other mercury species is consistent with the observed PTD profiles. As we have noted previously, all of the mercuric halides are stable gas phase species; however, for most of the coal burned during the Crist campaign more than 95% was present as Cl and less than 1% was present as Br, hence HgBr2 is not viable as an RGM candidate. Sulfur typically constituted 1% by weight of the coal burned; however, HgS is not a stable gas phase species [16] and the PTD profiles of HgS are not consistent with our observations.
The reported PTD profiles for solid HgO [11,12,13] are much more variable with peak decomposition temperatures ranging from 260 °C to 600 °C, but are not consistent with the decomposition seen in oven 1 profiles. Earlier work [8] suggested that HgO could be a significant component of RGM at stack gas temperatures in excess of 450 °C. However, recent high level ab-initio calculations [17] have shown that HgO cannot exist as a stable diatomic molecule in the gas phase. The implications of this for the atmospheric chemistry of mercury have been discussed in detail elsewhere [18] but it is clear that even in lean flames HgO can play no role in Hg oxidation and cannot be a candidate for stack RGM. It should be noted that Donohoue [9] reported PTD profiles for HgO that were thought to be from gas phase deposition. These profiles showed decomposition at low temperatures but it is now clear that these profiles were an artifact that resulted from contamination in sample lines. We have measured PTD profiles of solid HgO and find that it decomposes at a significantly higher temperature than HgCl2.
It is clear, therefore, that HgCl2 is the only stable Hg(II) species with an observed PTD profile that is consistent with our stack and plume PTD profiles and is the most likely candidate for the actual species.
In spite of the caveats associated with the fact that this was the first attempt to do this kind of sampling and analysis in a working coal-fired power plant, our experimental evidence, sampling from both stack and plume, suggests that HgCl2 is indeed the emitted form of RGM. To the best of our knowledge this is the first and only set of experimental evidence that addresses this speciation issue. It suggests that attempts to understand and model in-plume reduction of RGM to GEM should use HgCl2 as the speciation of RGM.

2.7. Further Development of the PTD Approach

In continuing development of the PTD approach, focus was on the use of uncoated quartz tubular denuders with an etched central area. The control of the oven ramping temperature is critical for reproducible PTD profiles and we have eliminated the use of a PID temperature controller and the type of “ramp and hold” cycles that were used during the Crist campaign. In addition, by using an etched central portion of the denuders it is possible to completely eliminate the large peak that is associated with the final temperature ramp. Typically we now use 5 min of preheating at 50 °C and then a constant ramp from 50 to 500 °C. Supplemental Figure S1 shows PTD profiles of HgCl2 deposited on etched quartz denuders that are obtained using this 50–500 °C ramping sequence. The mass of HgCl2 deposited varies between 20 and 50 pg, i.e., more than an order of magnitude lower than deposited during the Crist campaign. The profiles are quite reproducible and eliminate the “final ramp” peak and oscillations that are particularly evident in the “oven 1” profiles. The PTD profiles of HgCl2 and HgBr2 were compared and are identical on uncoated tubular denuders. However, this is not relevant to the Crist work because chlorine was the dominant halogen component of all the coal that was burned during the Crist campaign. In contrast, we find that solid samples of HgO and a compound deposited from the heterogeneous reaction of mercury and ozone have PTD profiles that decompose at significantly higher temperature than HgCl2. In other work from this laboratory uncoated quartz denuders with an etched central surface were used to sample from a small aircraft over Mississippi and the Gulf of Mexico. Several samples show evidence for an RGM species that decomposes at a significantly lower temperature than HgCl2 or HgBr2 together with samples that decompose at temperatures that are consistent with the PTD profiles of these mercuric halides. Examples of two such profiles are shown in Supplemental Figures S2 and S3. Figure S2 shows a PTD profile of a high altitude sample with a total mass of 58 pg. Figure S3 shows a PTD profile of a sample taken at 500 ft in the marine boundary layer over the Gulf of Mexico with a total mass of 56 pg. In both cases the PTD profiles of the flight blanks are shown. These observations are significant in that they may imply there is a form of atmospheric RGM with a PTD profile which is not consistent with speciation as either HgCl2 or HgBr2; however, we saw no evidence for the presence of this species in the Plant Crist plume.

3. Experimental Section

3.1. Conventional Denuder Sampling

Since PTD is not a commonly used analytical method, it is useful to contrast the PTD technique with “conventional denuder sampling” as a route to the measurement of total RGM concentrations. The use of KCl coated annular denuder sampling coupled with thermal dissociation has been described by Landis et al. [19] and forms the basis of a commercially available RGM measurement system, the Tekran Model 1130 Mercury Speciation Unit (Tekran, 2010). In this instrument air is pulled through a KCl coated annular denuder that captures RGM but transmits elemental and particulate mercury. After a period of sampling, the denuder is flushed with zero air and the denuder is heated to 500 °C. The RGM is thermally decomposed producing elemental mercury that desorbs from the denuder surface and is then captured by a Tekran 2537 Mercury vapor analyzer. In the Tekran 2537 the elemental mercury is collected by amalgamation on a gold cartridge during a sampling phase. The instrument is then flushed with argon and the mercury desorbed by heating the gold cartridge. The desorbed gas phase mercury is detected by Cold Vapor Atomic Fluorescence Spectrophotometry (CVAFS).

3.2. Programmable Thermal Dissociation

In PTD, the evolution of GEM is monitored as a function of temperature in real time during pyrolysis of a sample. PTD could be considered to be somewhat analogous to thermogravimetric analysis. However, in PTD the evolution of a gas phase product is monitored, rather than monitoring the decrease in the weight of the sample. It has been used to examine mercury speciation in solids [10,11,12,13] and a comparison of the PTD profiles reported in these works and measured here was discussed in Section 2.3.
In contrast to the studies of mercury containing solids, the configuration of PTD utilized in this work is designed to sample gas phase RGM. During the thermal analysis we use laser-induced fluorescence to monitor the extent of RGM decomposition as a function of temperature in real time by measuring the evolution of GEM produced during decomposition. The RGM sample is obtained by pulling the analysis gas through a quartz or Pyrex tube that acts as a denuder and captures RGM but transmits elemental and particulate mercury. It should be emphasized that these are uncoated tubular denuders in contrast to the KCl coated annular denuders that are commonly used to quantify total RGM [19]. The collection efficiency of the denuder is not known and, in this configuration, PTD is not designed to produce a quantitative measurement of RGM concentration. After a period of sampling the denuder is transported to a laboratory, flushed with He and then heated in a series of temperature ramps in an oven. As the denuder temperature increases, RGM dissociates and the GEM product is desorbed from the denuder wall. The GEM evolution is monitored in real time using laser-induced fluorescence (LIF). Comparison of the PTD profiles of unknown samples with profiles of known oxidized mercury compounds may provide information on the chemical identity of the sample. Since PTD is an indirect technique and different compounds can have identical or very similar decomposition properties it is unlikely to provide a definitive molecular identification. However, it should be possible to indicate whether the PTD profile of a sample is consistent with a particular molecular species or class of species.

3.3. Denuder Sampling

3.3.1. Sampling during the Crist Campaign

Field sampling at CFPP Crist took place between 18 February and 1 March 2008. The plant has four coal-fired units, two of which were operational during the campaign. The operational units, #6 (320 MW) and #7 (500 MW) shared a common stack and mercury continuous emissions monitoring systems (CEMS) were located at the output of each unit prior to discharge into the stack. In addition to the mercury CEMS, independent measurements of mercury concentration were made using the Ontario Hydro method and sorbent traps. NOx, SO2 and CO2 were measured by the Crist CEMS instrumentation. Mercury emissions were dominated by the exhaust from unit #7, which typically contained 5–7 μg∙m−3 of mercury, more than 90% of which was present as RGM. The unit #6 exhaust typically contained less than 1 μg∙m−3 of mercury and contained equal amounts of GEM and RGM. As a consequence, mercury in the stack gas was largely in the form of RGM. The Ontario Hydro and CEMS RGM stack measurements showed good agreement although the agreement between the GEM measurements was more problematic, reflecting the much lower concentrations of elemental mercury in the stack gas [6].
A preliminary laboratory assessment of the utility of PTD on KCl coated annular denuders is described by Donohoue [9]. Based on the prospect of sharper PTD profiles, together with time and cost limitations, uncoated tubular denuders were selected for PTD analysis during the campaign. A variety of quartz and Pyrex tubular denuders approximately 2.5 cm diameter and 50 cm long were used during the sampling campaign. Several of the denuders had a 25 cm central section that was etched to enhance the surface area. Denuders were prepared by rinsing with concentrated KOH, followed by distilled water, 10% nitric acid solution, distilled water, and finally methanol. They were dried in air without heating.
It was necessary to analyze the denuders and then clean them for additional sampling, making on-site analysis desirable. Analysis was performed at the University of West Florida (UWF), located approximately 7 m from Plant Crist and 5 m from Pensacola Airport, the base of operations for the airship. Denuder sampling experience prior to the Crist campaign had been a limited set of laboratory studies and high levels of RGM in the stack and blimp samples that could be analyzed using single photon LIF were anticipated.
During the sampling campaign the dye laser that was used to excite fluorescence showed short-term drift, due to a damaged output coupler that had been degrading the Nd-Yag pump laser over the course of the two week sampling period, and possibly also due to temperature variation in the laboratory at UWF. This short-term drift produced background shifts in a number of the dissociation profiles.

3.3.2. Stack Sampling

All stack sampling was performed by personnel from the Energy and Engineering Research Center (EERC), University of North Dakota in conjunction with their measurements of GEM and RGM using the Ontario Hydro method. Stack gas samples were collected from ducts located after the electrostatic precipitator and prior to entering the stack. The gas was pumped from the ducts and diluted to prevent condensation. Most of the samples were obtained with a quartz particle filter in the sampling line. The filter was located in the stack and had a capture efficiency of 99.95% for 0.3 μm particles. Typical sampling times were 1–30 min at the stack at 5 SLPM total flow (4.5 SLPM dilution air +0.5 SLPM stack gas). Typical stack gas temperatures at the sampling point were ~150 °C and the gas had cooled to ~25 °C before reaching the denuder. After sampling, the denuders were capped, and once sampling was completed for the day they were transported to UWF for analysis. Denuders were stored in the analysis laboratory at room temperature and typically analyzed the day following sampling.

3.3.3. In-Plume Sampling

An airship was used to sample the exhaust plume with the objective of holding the sampling modules within the centerline of the plume at approximately the same position for an extended period of time. The sampling PVC modules were suspended 60 feet below the airship’s gondola and connected by umbilical tubes that included sample lines connected to pumps in the gondola. In addition to denuders and filters located in the sampling modules, a dual TEKRAN system located in the gondola ran in parallel and measured total gaseous mercury (RGM + GEM) and GEM separately at 2.5 min intervals. In addition, SO2, NOy, and CO2 were measured continuously and used as plume-detection tracers.
EPA personnel performed the in-plume sampling. The sampling module for the PTD denuders pulled air directly from the plume at ambient temperature and this was drawn though the denuder at 3.5 SLPM. After a sampling period of typically one hour the module was pulled up into the airship’s gondola, the denuder was removed and capped, a fresh denuder loaded into the module, and the module lowered back into the plume for another period of sampling. After the airship landed the denuders were transported to UWF for analysis. A total of 20 uncoated tubular denuder samples were obtained on six days during the campaign. The airship’s sampling protocol involved taking one sample upwind of the stack to establish background conditions followed by a sample downwind and close to the stack, and then a final sample further downwind in-plume; referred to as “close-in” and “further-out,” respectively.

3.4. Analysis by Programmable Thermal Dissociation (PTD)

Analysis was performed using PTD, heating the denuders in a series of steps and monitoring the evolution of GEM as a function of time using single photon LIF. Analysis was performed in He buffer to enhance detection sensitivity for GEM. For analysis the denuders were placed in a clamshell furnace and flushed with He at 0.45 L/min to remove all ambient gas and this flow was maintained for the full heating cycle. Two thermal cycles were used and are subsequently referred to as “oven 1” or “oven 2”. In the “oven 1” cycle the temperature was raised to 100 °C and then increased in five 25 °C ramps up to 225 °C with each ramping cycle taking 5 min. Finally, the oven temperature was rapidly increased to 500 °C and held at this temperature for 5 min. In the other cycle “oven 2” the oven temperature was increased to 100 °C, 175 °C, 200 °C, four 10 °C ramps to 250 °C and then rapidly increased to 500 °C. Again each ramping step took 5 min. The “oven 1” profile was designed to capture species that dissociated at a significantly lower temperature than the mercuric halides. The “oven 2” profile, which began with a much steeper initial ramp from 100 °C to 170 °C and then with smaller increments to 250 °C, was designed to try and distinguish between compounds with similar decomposition temperatures in the 170–250 °C range. Throughout the initial flushing and the heating cycle the gas that left the denuder passed through a fluorescence cell and the concentration of GEM was monitored by single photon LIF. After the heating cycle was complete the LIF signal was calibrated by injecting a known amount of GEM into the gas flow through a septum as described below.

3.5. GEM Detection

GEM was detected by single photon, resonance LIF using excitation of the 63P1-61S0 transition at 253.7 nm. A frequency doubled dye laser pumped by the third harmonic of a Nd-Yag laser was used to generate the excitation beam. Resonance fluorescence was observed using a Hamamatsu 1P28 photomultiplier tube with a 253 nm filter. In this approach the detection PMT detects both LIF and laser scatter and thus sensitivity is limited by the ratio of intensity of the LIF signal to the laser scatter. Since the 63P1 level is efficiently quenched by both O2 and N2 the thermal analysis was performed in He buffer gas to achieve good detection sensitivity. The PTD profiles of all the samples collected during the Crist campaign used uncoated tubular denuders and the analysis used single photon LIF.

3.6. Calibration of Absolute Hg° Concentration

The LIF signal was converted into an absolute Hg° concentration by injecting known amounts of GEM into the detection cell through a septum. A saturated calibration gas was obtained by taking a sample of elemental mercury and allowing it to equilibrate at 6 °C for over 24 h before initial use. The elemental mercury was kept in a Pyrex vial capped with a septum in Ar bath gas. The transfer syringe was at room temperature and the saturated gas was withdrawn from the vial and directly injected slightly upstream of the fluorescence cell. The GEM concentration was calculated assuming saturation, correcting for the temperature difference between the syringe and the vial, and using the temperature dependence of the vapor pressure given by the Dumarey equation [20].

3.7. HgCl2 Calibration Profiles

After the completion of the sampling campaign at Plant Crist, thermal dissociation profiles of HgCl2 were measured for comparison with stack and plume samples. Samples were obtained by flowing N2 over powdered HgCl2 and passing the gas mixture through denuder tubes that were then analyzed using the “oven 1” or “oven 2” cycles. Calibration profiles from samples deposited at N2 flows of 520 sccm and 135 sccm were measured although there were large fluctuations in the deposited amounts of HgCl2 presumably as a result of fluctuating gas phase concentrations during sampling and variations in denuder collection efficiency. Six PTD profiles were measured using samples deposited at 135 sccm and two PTD profiles at 520 sccm deposition flow using the “oven 1” thermal ramp sequence. A single “oven 2” profile was measured, using a sample deposition flow of 520 sccm.

3.8. Characterization of the Oven Temperature Distribution

After the completion of the Plant Crist campaign and the laboratory HgCl2 calibration experiments the temperature distribution along a denuder tube was measured by attaching thermocouples at the ends and center of the inside of a tube and at the center on the outside of the tube. With the oven controller reading 190 °C the temperature at the center of the denuder was 212 °C on the outside and 204 °C on the inside. The active heating section of the oven was 30 cm long and the temperature differential over the central 18 cm section was 30 °C with a maximum at the center, a drop of 10 °C at 9 cm downstream, i.e., in the direction of gas flow, and a drop of 30 °C at 9 cm upstream at the point where cool gas is entering. The differential then increased considerably and was 30 °C cooler 12.5 cm upstream and 50 °C cooler at the 12.5 cm downstream point. The ability of the oven controller to produce reproducible temperature ramps was limited with the temperature typically overshooting the set point.

4. Conclusions

Measurements of the chemical speciation of RGM represent a significant analytical challenge. Lack of information on the chemical speciation is perhaps the single biggest obstacle to developing a detailed understanding of the chemical cycling of mercury in the atmosphere. A “proof of concept” experiment as a component of a major field campaign was conducted to test the use of PTD to chemically speciate RGM in a working combustion environment. Thermal dissociation profiles for RGM were obtained in both stack and in-plume samples that suggest that it is possible to track a specific chemical form of RGM from the stack and follow its evolution in the stack plume. In contrast to the recently published work of Deeds et al. [4], comparison of the measured plume RGM with the amount calculated from in-stack measurements and the measured plume dilution suggest that the stack and plume RGM concentrations are consistent with dilution. The PTD profiles of the stack and plume samples are consistent with HgCl2 being the chemical form of the sampled RGM. It is also possible that the RGM consists of some other oxidized mercury species with a similar decomposition temperature. An example would be HgBr2, but the absence of a significant amount of bromine in the feed coal makes this unlikely. Comparison with literature PTD profiles of reference mercury compounds suggests no other likely candidates for the speciation of RGM.

Acknowledgments

We wish to acknowledge the assistance of many of the other participants in the Plant Crist campaign for performing measurements, providing logistical support and releasing results prior to publication. This work was supported by the Electric Power Research Institute.

Author Contributions

Anthony Hynes, Cheryl Tatum Ernest and Dieter Bauer wrote the manuscript and performed much of the data analysis. Cheryl Tatum Ernest and Dieter Bauer performed the field experiments. Arnout Ter Schure performed the analysis of trace gas dilutions. Anthony Hynes, Cheryl Tatum Ernest, Dieter Bauer and Arnout Ter Schure were involved in the planning and preparation for the field deployment. Deanna Donohoue performed preliminary experiments and provided scientific insight and editing.

Conflicts of Interest

The authors declare no conflict of interest.

References

  1. Edgerton, E.S.; Hartsell, B.E.; Jansen, J.J. Mercury speciation in coal-fired power plant plumes observed at three surface sites in the Southeastern U.S. Environ. Sci. Technol. 2006, 40, 4563–4570. [Google Scholar] [CrossRef]
  2. EPRI. An Assessment of Mercury Emissions from U.S. Coal-Fired Power Plants; EPRI Report No. 1000608; Electric Power Research Institute: Palo Alto, CA, USA, 2000. [Google Scholar]
  3. Lohman, K.; Seigneur, C.; Edgerton, E.S.; Jansen, J.J. Modeling mercury in power plant plumes. Environ. Sci. Technol. 2006, 40, 3848–3854. [Google Scholar] [CrossRef]
  4. Deeds, D.A.; Banic, C.M.; Lu, J.; Daggupaty, S. Mercury speciation in a coal-fired power plant plume: An aircraft-based study of emissions from the 3640 MW Nanticoke Generating Station, ON, Canada. J. Geophys. Res.: Atmos. 2013, 118, 4919–4935. [Google Scholar] [CrossRef]
  5. Laudal, D.; Seigneur, C. Mercury Reactions in Power Plant Plumes: Pleasant Prairie Experiment and Compliance Scenario Assessment; Technical Report, Report No. 1010142; Electric Power Research Institute: Palo Alto, CA, USA, 2006. [Google Scholar]
  6. Landis, M.; Ryan, J.; Oswald, E.; Jansen, J.; Monroe, L.; Walters, J.; Levin, L.; Ter Schure, A.; Laudal, D.; Edgerton, E. Plant crist mercury plume study. In Proceedings of Air Quality VII Conference, Arlington, VA, USA, 26–29 October 2009.
  7. Schofield, K. Fuel-mercury combustion emissions: An important heterogeneous mechanism and an overall review of its implications. Environ. Sci. Technol. 2008, 42, 9014–9030. [Google Scholar] [CrossRef]
  8. Galbreath, K.C.; Zygarlicke, C.J. Mercury speciation in coal combustion and gasification flue gases. Environ. Sci. Technol. 1996, 30, 2421–2426. [Google Scholar] [CrossRef]
  9. Donohoue, D.A. Kinetic Studies of the Oxidation Pathways of Gaseous Elemental Mercury. Ph.D. Thesis, University of Miami, Miami, FL, USA, 2008. [Google Scholar]
  10. Biester, H.; Scholz, C. Determination of mercury binding forms in contaminated soils: Mercury pyrolysis versus sequential extractions. Environ. Sci. Technol. 1997, 31, 233–239. [Google Scholar] [CrossRef]
  11. Feng, X.; Lu, J.; Gregoire, D.C.; Hao, Y.; Banic, C.M.; Schroeder, W.H. Analysis of inorganic mercury species associated with airborne particulate matter/aerosols: Method development. Anal. Bioanal. Chem. 2004, 380, 683–689. [Google Scholar] [CrossRef]
  12. Lopez-Anton, M.A.; Yang, Y.; Ron, P.; Maroto-Valer, M.M. Analysis of mercury species present during coal combustion by thermal desorption. Fuel 2010, 89, 629–634. [Google Scholar] [CrossRef]
  13. Wu, S.; Uddin, M.A.; Nagano, S.; Ozaki, M.; Sasaoka, E. Fundamental study on decomposition characteristics of mercury compounds over solid powder by temperature-programmed decomposition desorption mass spectrometry. Energy Fuels 2011, 25, 144–153. [Google Scholar] [CrossRef]
  14. Gormley, P.G.; Kennedy, M. Diffusion from a stream flowing through a cylindrical tube. Proc. R. Irish Acad. Sect. A 1949, 52, 163–169. [Google Scholar]
  15. Schwarzenbach, R.P.; Gschwend, P.M.; Imboden, D.M. Environmental Organic Chemistry; John Wiley & Sons, Inc.: New York, NY, USA, 1993. [Google Scholar]
  16. Goldfinger, P.; Jeunehomme, M. Mass spectrometric and Knudsen cell vaporization studies of 2B-6B compounds. Trans. Faraday Soc. 1963, 59, 2851–2867. [Google Scholar] [CrossRef]
  17. Shepler, B.C.; Peterson, K.A. Mercury monoxide: A systematic investigation of its ground electronic state. J. Phys. Chem. A 2003, 107, 1783–1787. [Google Scholar]
  18. Hynes, A.J.; Donohoue, D.L.; Goodsite, M.E.; Hedgecock, I.M. Our current understanding of major chemical and physical processes affecting mercury dynamics in the atmosphere and at the air-water/terrestrial interfaces. In Mercury Fate and Transport in the Global Atmosphere: Emissions, Measurements and Models; Pirrone, N., Mason, R.P., Eds.; Springer: Berlin, Germany; pp. 427–457.
  19. Landis, M.S.; Stevens, R.K.; Schaedlich, F.; Prestbo, E. Development and characterization of an annular denuder methodology for the measurement of divalent inorganic reactive gaseous mercury in ambient air. Environ. Sci. Technol. 2002, 36, 3000–3009. [Google Scholar] [CrossRef]
  20. Dumarey, R.; Brown, R.J.C.; Corns, W.T.; Brown, A.S.; Stockwell, P.B. Elemental mercury vapour in air: The origins and validation of the “Dumarey equation” describing the mass concentration at saturation. Accredit. Qual. Assur. 2010, 15, 409–414. [Google Scholar] [CrossRef]

