2.1. Prior PTD Studies
PTD has been used for the analysis of solids containing mercury compounds. The PTD profiles obtained here can be compared with prior published work on solid HgCl
2 samples, and other representative mercury compounds. In comparing it is important to note that the prior studies used much higher concentrations of RGM. Since they used small amounts of a solid sample, the oven temperature distribution was, in contrast to this study, not a problem. In addition, some techniques were designed to be able to distinguish between thermal desorption,
i.e., the evaporation or sublimation of the mercury compound, and decomposition to produce GEM. Bister and Scholz [
10] used PTD to examine mercury speciation in contaminated soils. They used atomic absorption for detection of GEM. Calibration samples were diluted with quartz powder. To distinguish between desorption and decomposition the vapor passed through an 800 °C quartz pyrolysis tube before analysis thus measuring the sum of desorption and decomposition. By bypassing the pyrolyzer they could monitor decomposition alone. Their PTD profile of HgCl
2 shows decomposition starting at ~80 °C and peaking at 200 °C. They saw no difference in PTD profiles obtained by bypassing the pyrolyzer and it was concluded that decomposition was occurring exclusively.
Feng
et al. [
11] used ICPMS detection of GEM, examining aerosol samples collected in Toronto, Canada. The detection technique presumably measured the sum of desorption and decomposition although this was not explicitly discussed. Their calibration samples were diluted using fly ash. For HgCl
2 they showed a very broad PTD profile with decomposition/desorption starting at 100 °C and peaking at 300 °C.
Lopez-Anton
et al. [
12] used a commercially available thermal dissociation module coupled with a CVAFS detector. They used a pyrolyzer prior to analysis and would have detected both dissociated and desorbed/sublimed RGM. They examined fly ash and solid mercuric compounds generating standards by mixing pure compounds with powdered quartz and obtained a very sharp HgCl
2 PTD profile with appearance at ~70 °C and the peak at 125 °C.
Wu
et al. [
13] used mass spectrometry and this allowed them to simultaneously monitor decomposition, producing GEM, and desorption, monitoring HgCl
2 directly. Their standard compounds were diluted with several solid powders. Commercial SiO
2, TiO
2, Al
2O
3, and coconut shell AC were used as diluents and interestingly, both the shape of the PTD profile and the ratio of GEM:HgCl
2 varied dramatically as a function of the diluent powders. For example, using the powdered quartz diluent a broad PTD profile was obtained with a peak at 150 °C and with GEM and HgCl
2 being detected in equal amounts. In contrast, a PTD profile with Al
2O
3 diluent was much sharper with a peak at 150 °C but consisting exclusively of GEM.
These studies also examined the PTD profiles of other Hg(II) and Hg(I) compounds, HgS, HgSO
4, HgO, HgBr
2, Hg
2Cl
2 and Hg
2SO
4. In general, the non-halide Hg(II) compounds are found to dissociate at higher temperatures than HgCl
2 although there is considerable variability between the studies. Lopez-Anton
et al. [
12] show a PTD profile for HgBr
2 that has its decomposition peak shifted slightly to lower temperature relative to HgCl
2. It is also clear that there is significant variability in the results of these studies.
In addition to using considerably higher mercury concentrations than our work, all of the studies used a linear temperature ramp in contrast to the ramp and hold sequence that was used here. As we note below we have now switched to a linear ramping sequence. Unfortunately, we were not aware of the two prior literature studies [
10,
11] at the start of the Crist campaign in 2008, hence our decision to use the ramp and hold sequences described as “oven 1” and “oven 2”. The “oven 2” sequence is probably closest to a straight ramping sequence and the “oven 2” profiles are similar to published PTD profiles and to our more recent, better defined work shown in Supplemental Figure S1 The “oven 1” profiles show more variability and if the work of Wu
et al. [
13] is correct this may be due at least in part to the competition between sublimation and decomposition. We plan to modify our implementation of PTD by incorporating a pyrolyzer and second LIF detection cell to be able to simultaneously monitor both dissociation and desorption/sublimation profiles.
2.2. Laboratory HgCl2 PTD Profiles
Laboratory PTD profiles of HgCl
2 were obtained after the completion of the Crist field experiment using two thermal ramping schemes that we denote as “oven 1” and “oven 2”.
Figure 1 shows the individual and averaged calibration profiles obtained at a single deposition flow for the “oven 1” thermal cycle. The LIF signal has been normalized by the signal resulting from the injection of known amounts of GEM, as described in
Section 3.6.
Figure 1.
Six programmable thermal dissociation (PTD) profiles using Oven 1 program for an uncoated tubular denuder loaded with pure HgCl2. Denuders were loaded by flowing N2 over pure HgCl2 for 1 min at 135 sccm. The average of the six profiles is also shown.
Figure 1.
Six programmable thermal dissociation (PTD) profiles using Oven 1 program for an uncoated tubular denuder loaded with pure HgCl2. Denuders were loaded by flowing N2 over pure HgCl2 for 1 min at 135 sccm. The average of the six profiles is also shown.
Figure 1 indicates the reproducibility of 6 PTD profiles obtained by depositing pure HgCl
2 under nominally identical conditions. The HgCl
2 loadings varied considerably. Possible reasons include fluctuations in the gas phase concentration of HgCl
2, variations in denuder collection efficiency, and variation in competition between desorption of molecular HgCl
2, which we would not detect, and decomposition to produce GEM which we do detect. We have found it difficult to develop stable sources of HgCl
2 for calibration purposes and this represents a major challenge in this type of experiment.
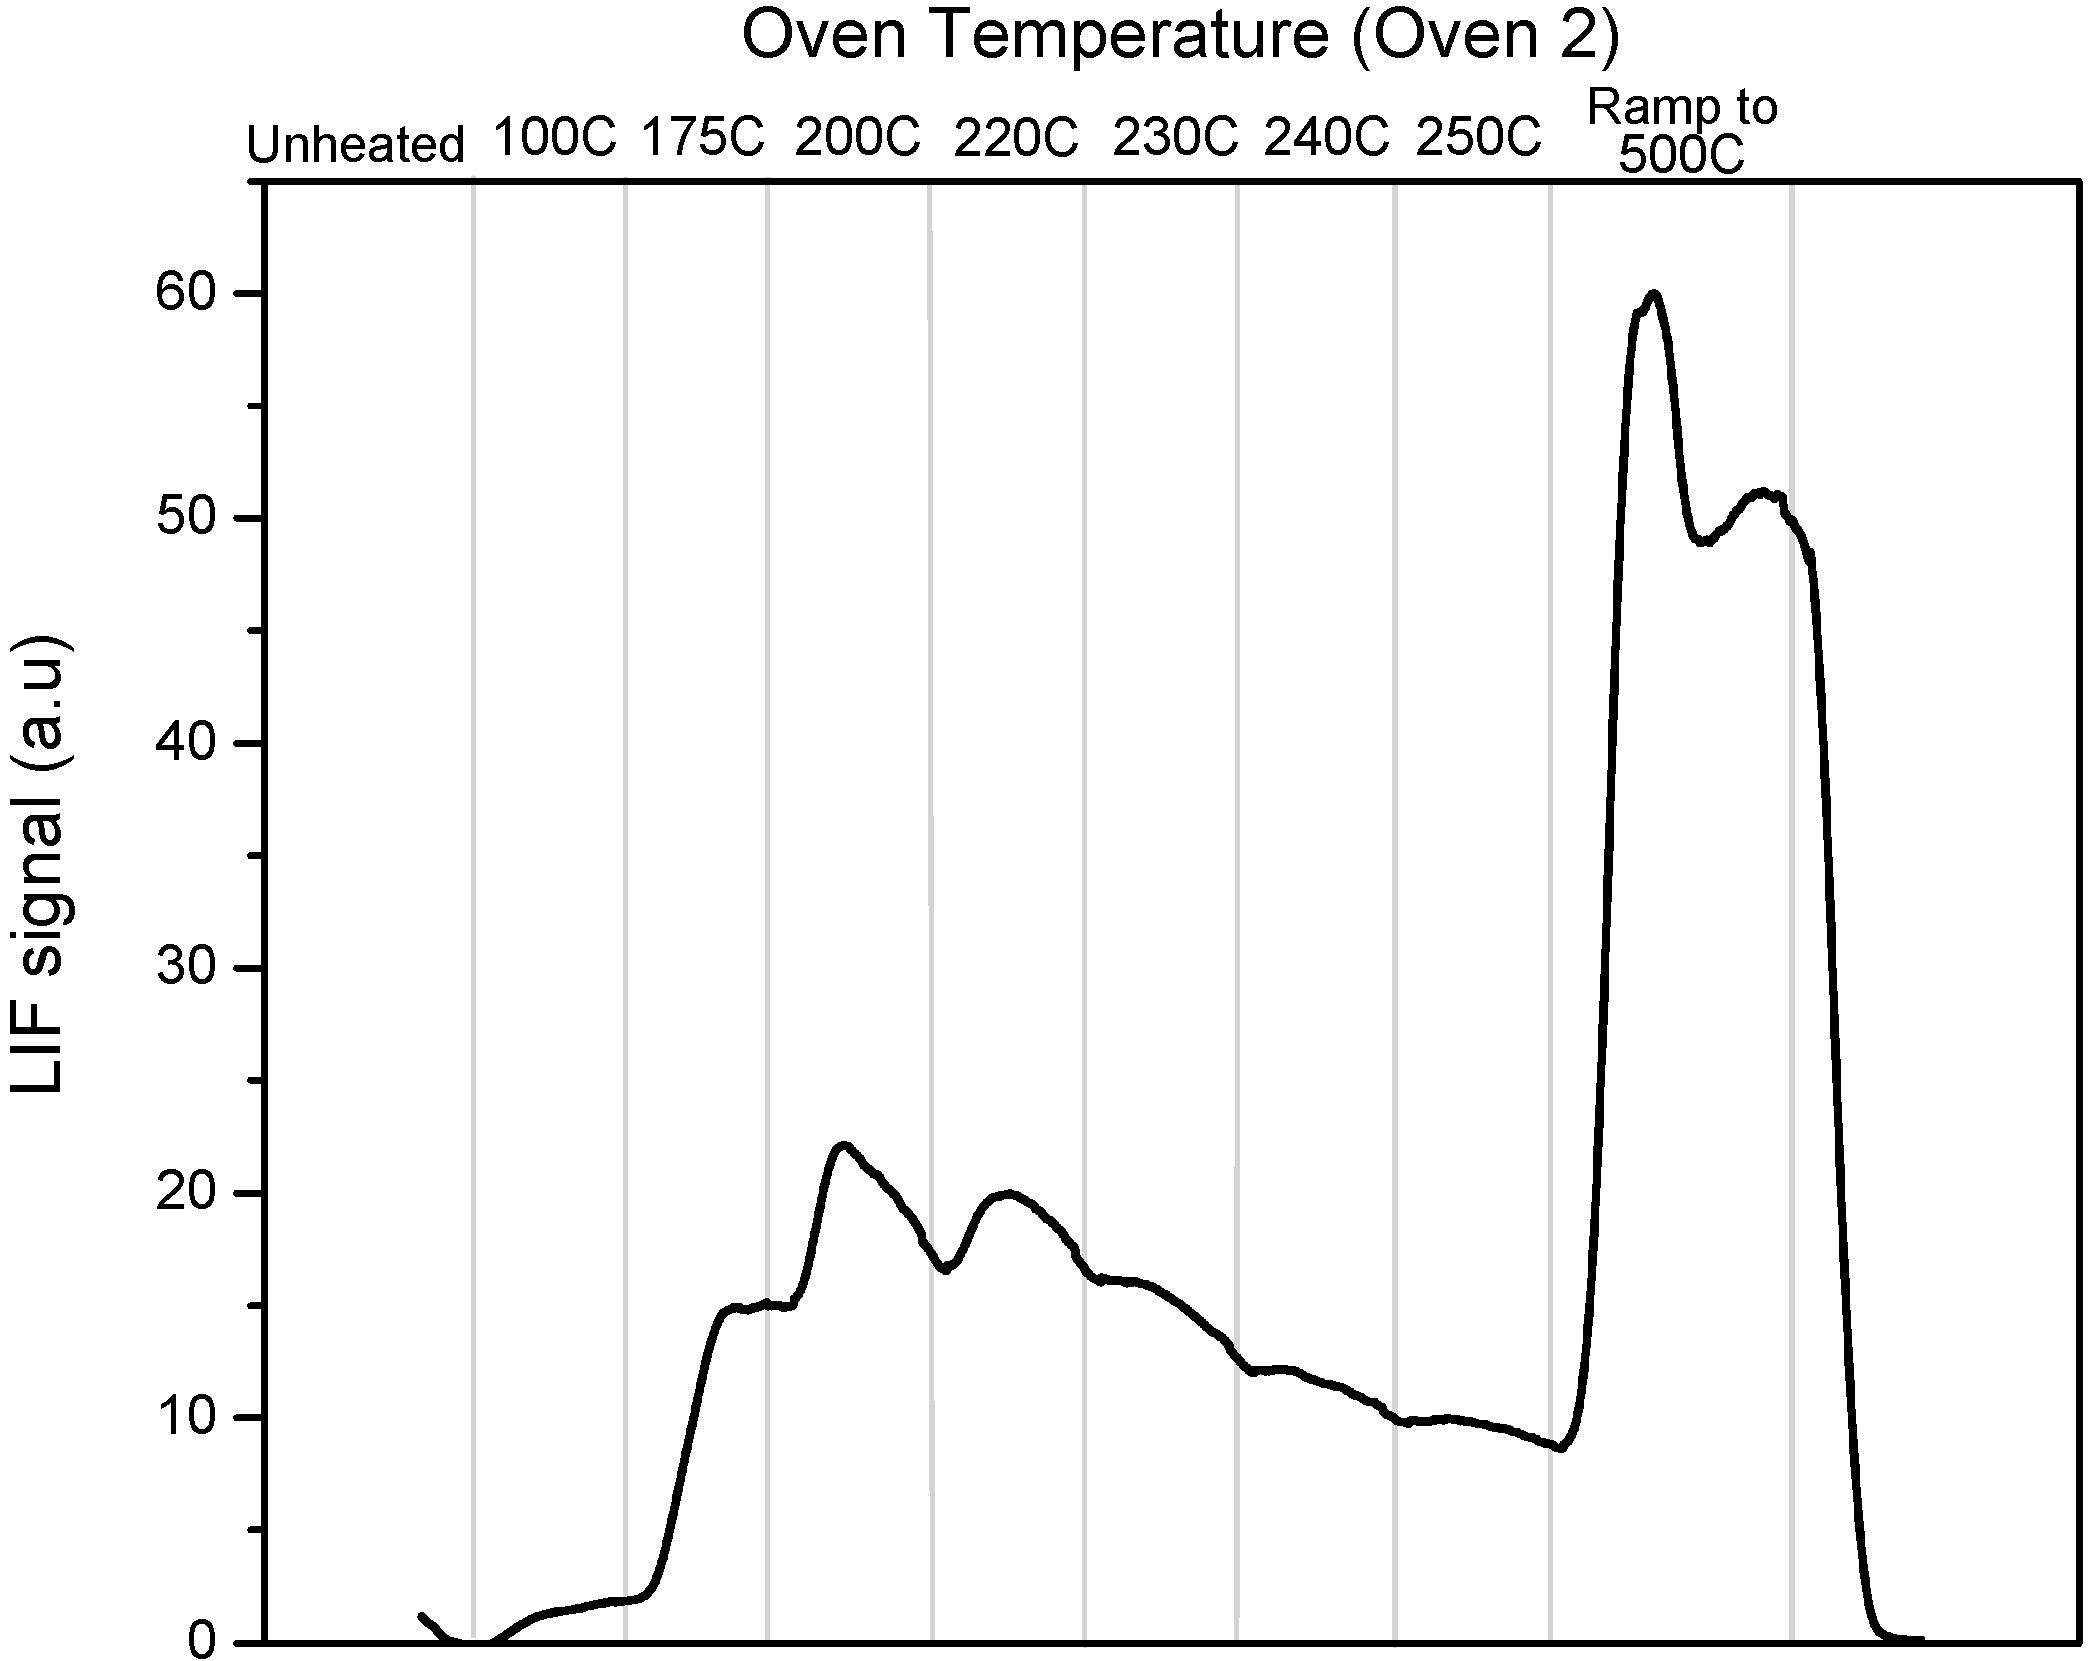
As a result of time constraints we were only able to obtain a single calibration profile obtained for the “oven 2” profile which is shown in
Figure 2.
Figure 2.
PTD profile using Oven 2 program for an uncoated tubular denuder loaded with pure HgCl2.
Figure 2.
PTD profile using Oven 2 program for an uncoated tubular denuder loaded with pure HgCl2.
Some of the variability in the shape and structure of the PTD profiles has been determined to be a function of the deposition pattern of RGM on the denuder, the very significant temperature gradient along the denuder during the heating cycle, and the direction of buffer gas flow during both sampling and analysis. During the Crist measurements RGM was sampled over the whole denuder surface including the ends that are located outside of the oven and the direction of gas flow was not noted during sampling. As discussed below, we have found that during the heating cycle the center portion of the denuder heats most rapidly and the initial production of GEM reflects dissociation of RGM in this section of the denuder. The temperature in the PTD profile figures is the temperature as read by the oven thermocouple and most closely reflects the temperature of the central section of the denuder; the ends of the denuder are significantly cooler. As the temperature increases RGM deposited further from the center reaches decomposition temperature and the final ramp produces decomposition over most of the length of the tube. The oscillations in the PTD profiles appear to be the result of this effect in conjunction with the “ramp and hold for 5 min” sequence that we used for temperature ramping at Crist.
In addition, RGM deposition appears to be a function of flow direction, presumably maximum deposition occurs as the flow enters the denuder and decreases as the RGM concentration is depleted as the gas flows down the denuder. The flow-effect becomes more significant as the RGM loading increases. One consequence of the flow-effect is that dissociation profiles are more reproducible if the direction of gas flow through the denuder is the same during sampling and analysis. Since the direction of the sampling flow was not noted during stack sampling, this variation, together with a lack of reproducibility in the oven cycling, contributes to variation in the PTD profiles. The “post-Crist” improvements that have eliminated these problems are discussed below. Nonetheless, these issues affect the work at Crist and the initial calibration profiles obtained at the end of the campaign. In spite of this, the unique nature of the sampling opportunity, with simultaneous measurements in the stack and plume do allow us to draw useful conclusions, as we discuss below.
2.3. Stack PTD Profiles
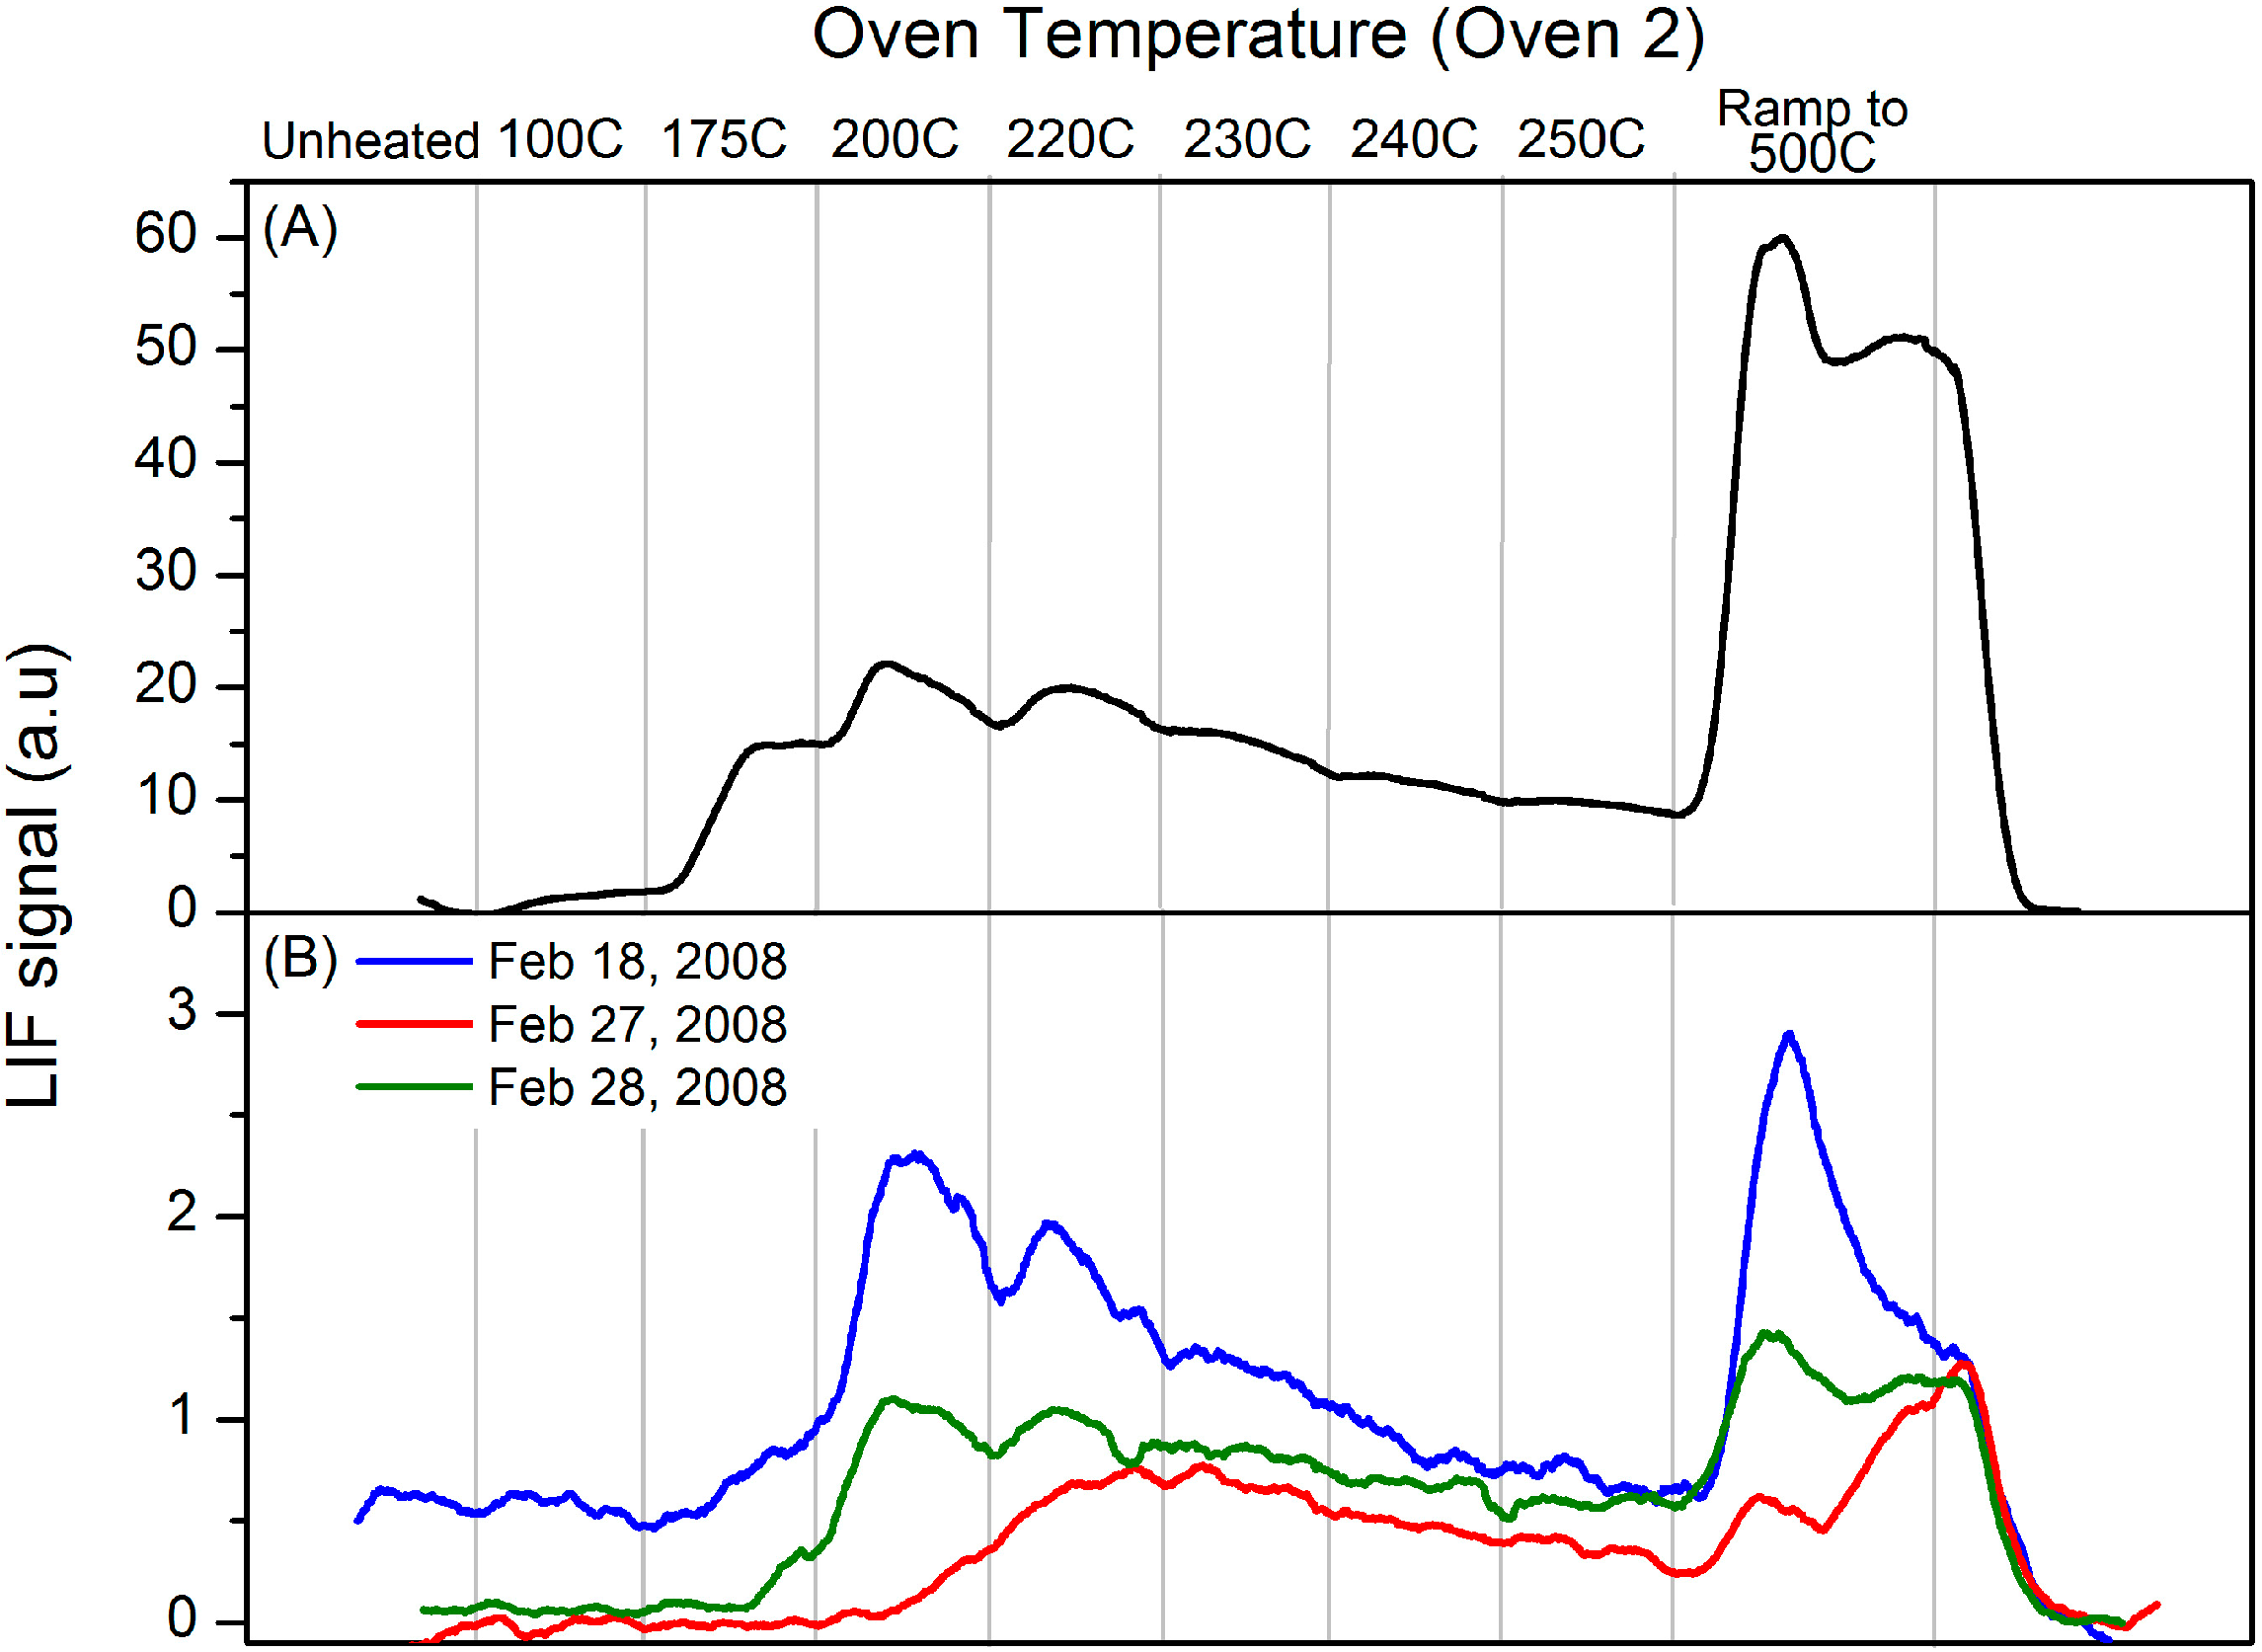
Figure 3b shows PTD profiles for several stack samples analyzed using the “oven 2” thermal cycle described below. The “oven 2” PTD profile for pure HgCl
2 (
Figure 2) is shown again for comparison in
Figure 3a. The stack profiles show a sharp onset of RGM dissociation at ~200 °C. GEM continues to evolve as the temperature increases, with a spike in RGM dissociation as the oven temperature is ramped to 500 °C. The profiles are similar to the calibration HgCl
2 profiles although the onset of dissociation occurs at a slightly lower temperature in the HgCl
2 profiles. Nevertheless, the profiles shown in
Figure 3 are quite similar and consistent with the HgCl
2 calibration profile and the onset of RGM dissociation was quite consistent. The observation that these profiles are consistent with the HgCl
2 profiles does not constitute a definitive identification of HgCl
2.
Figure 3.
Panel (A). Calibration profile obtained using Oven 2 program for denuder loaded with pure HgCl2; Panel (B). Dissociation profiles obtained using Oven 2 program for stack samples collected 18, 27 and 28 February 2008.
Figure 3.
Panel (A). Calibration profile obtained using Oven 2 program for denuder loaded with pure HgCl2; Panel (B). Dissociation profiles obtained using Oven 2 program for stack samples collected 18, 27 and 28 February 2008.
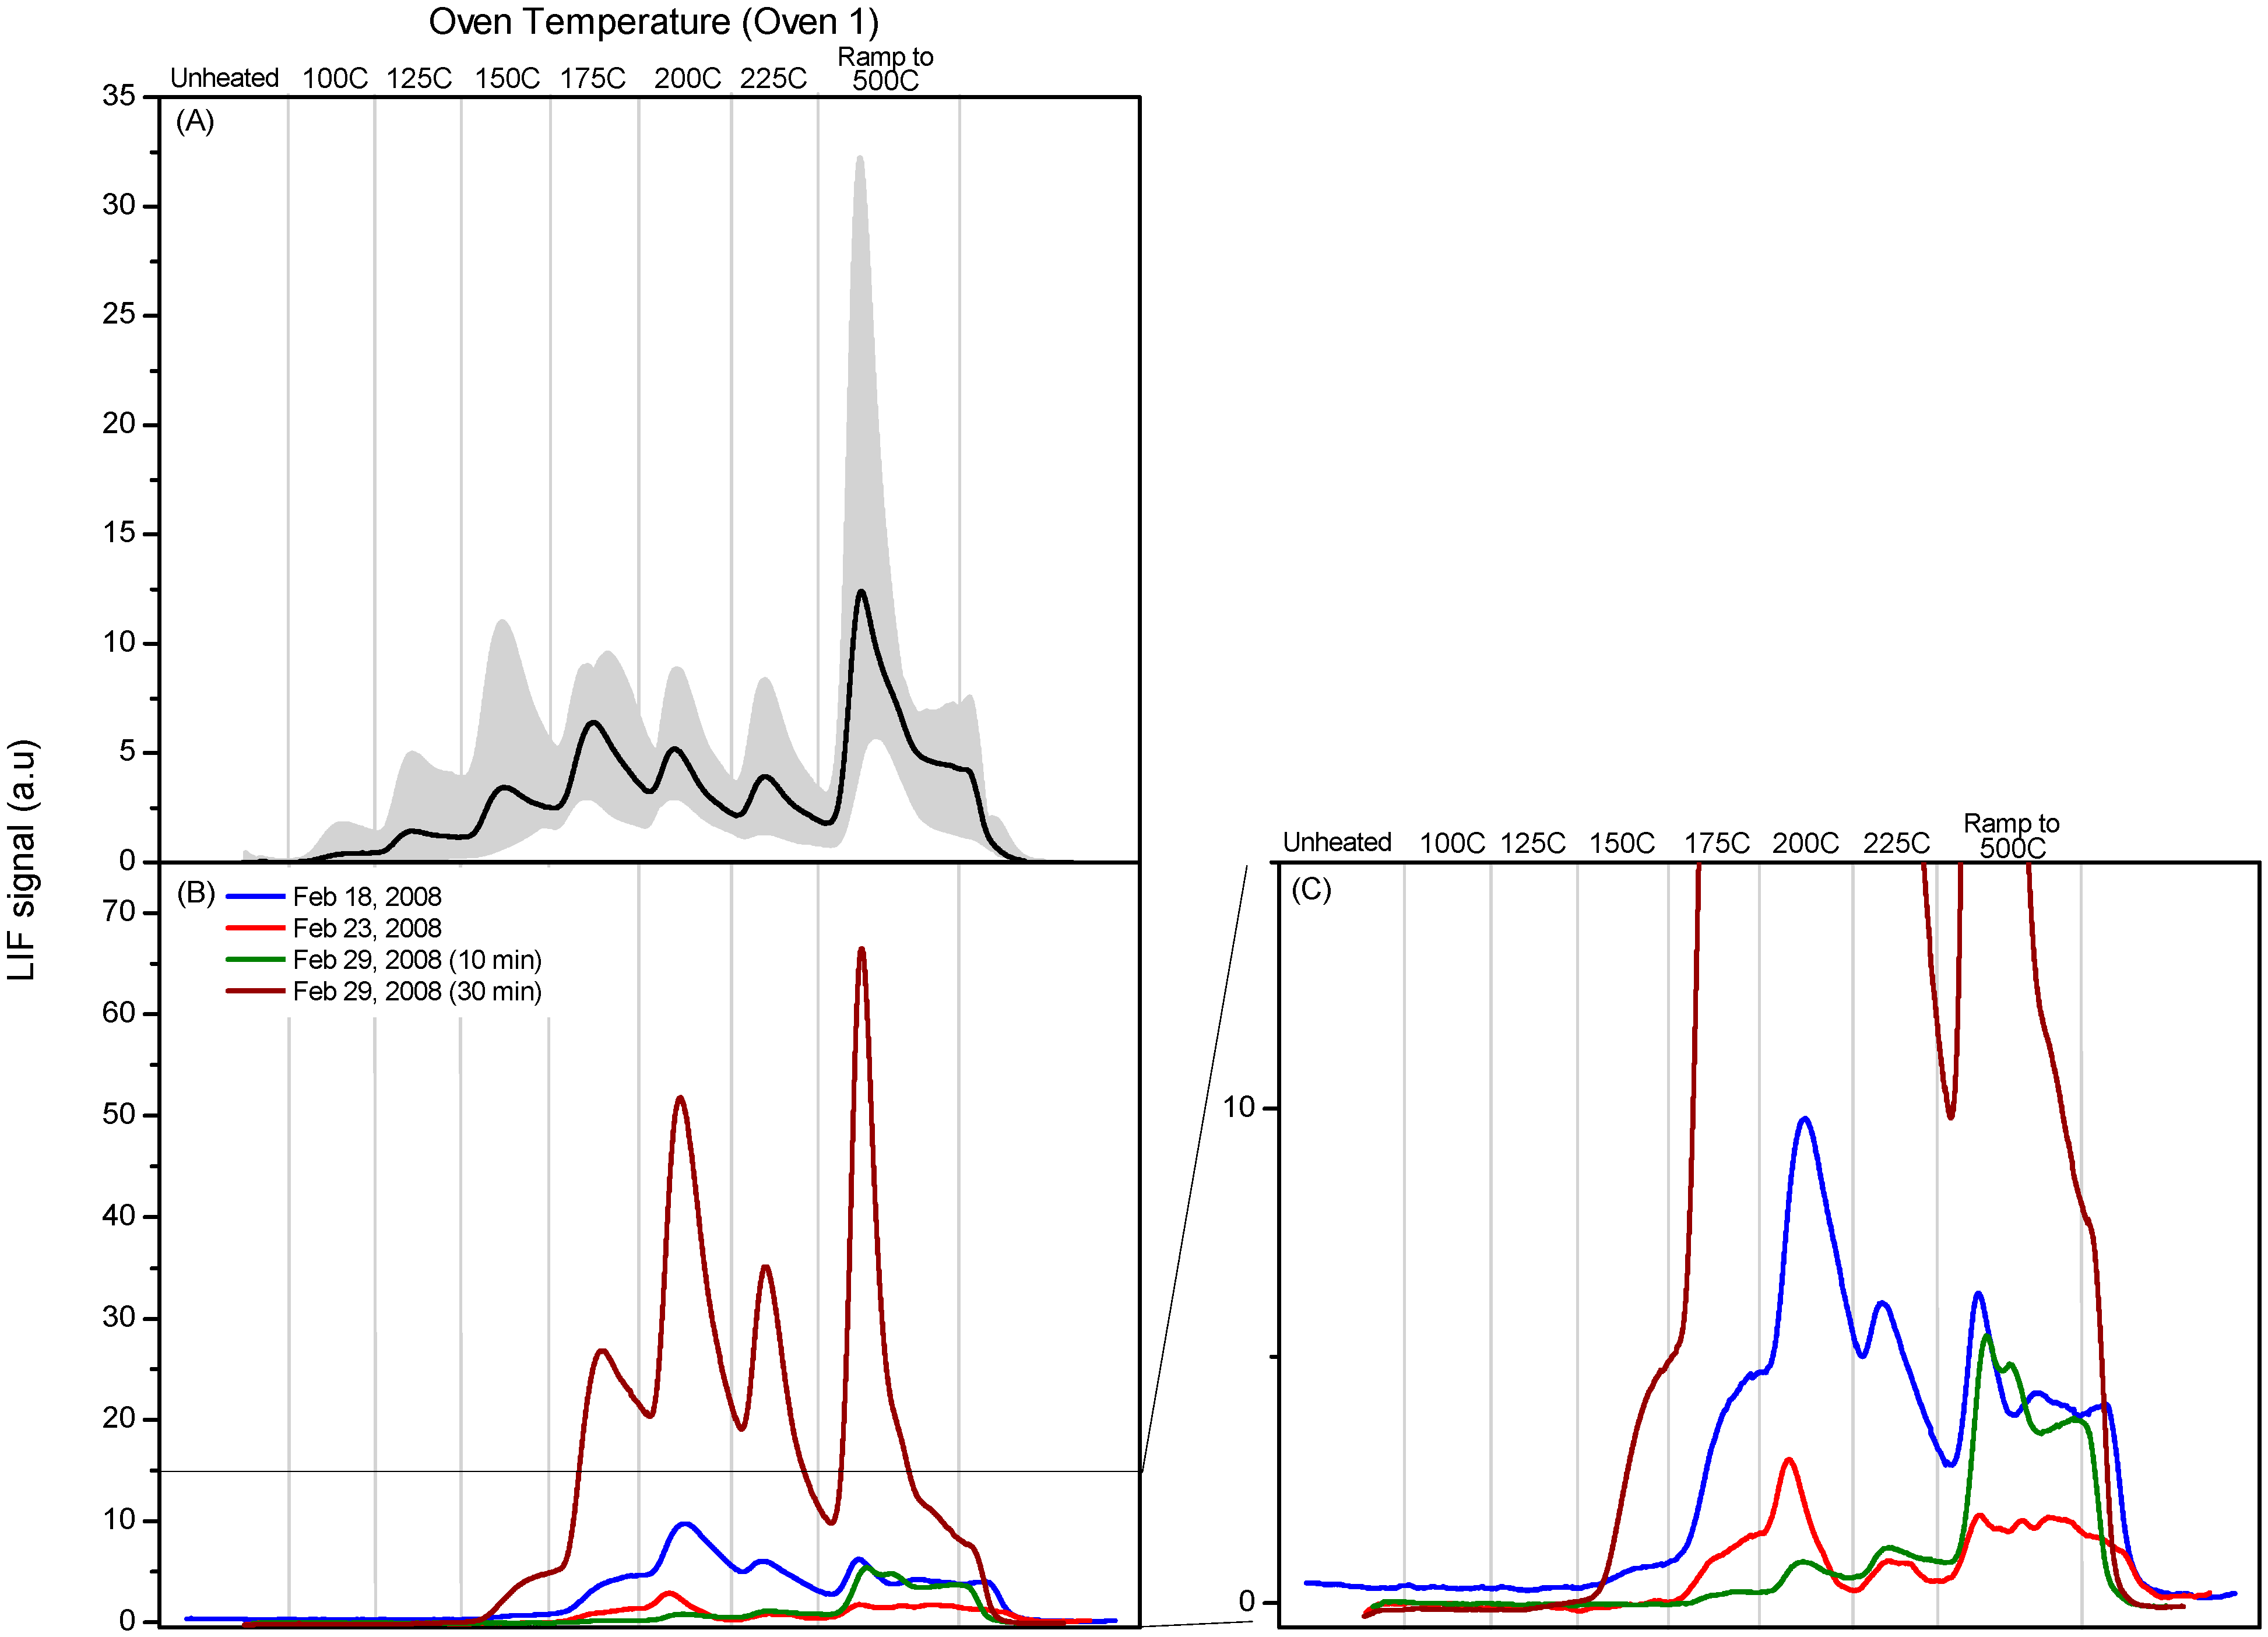
Figure 4b shows PTD profiles of stack samples analyzed with the “oven 1” cycle described below together with the averaged “oven 1” PTD profile of HgCl
2 shown in
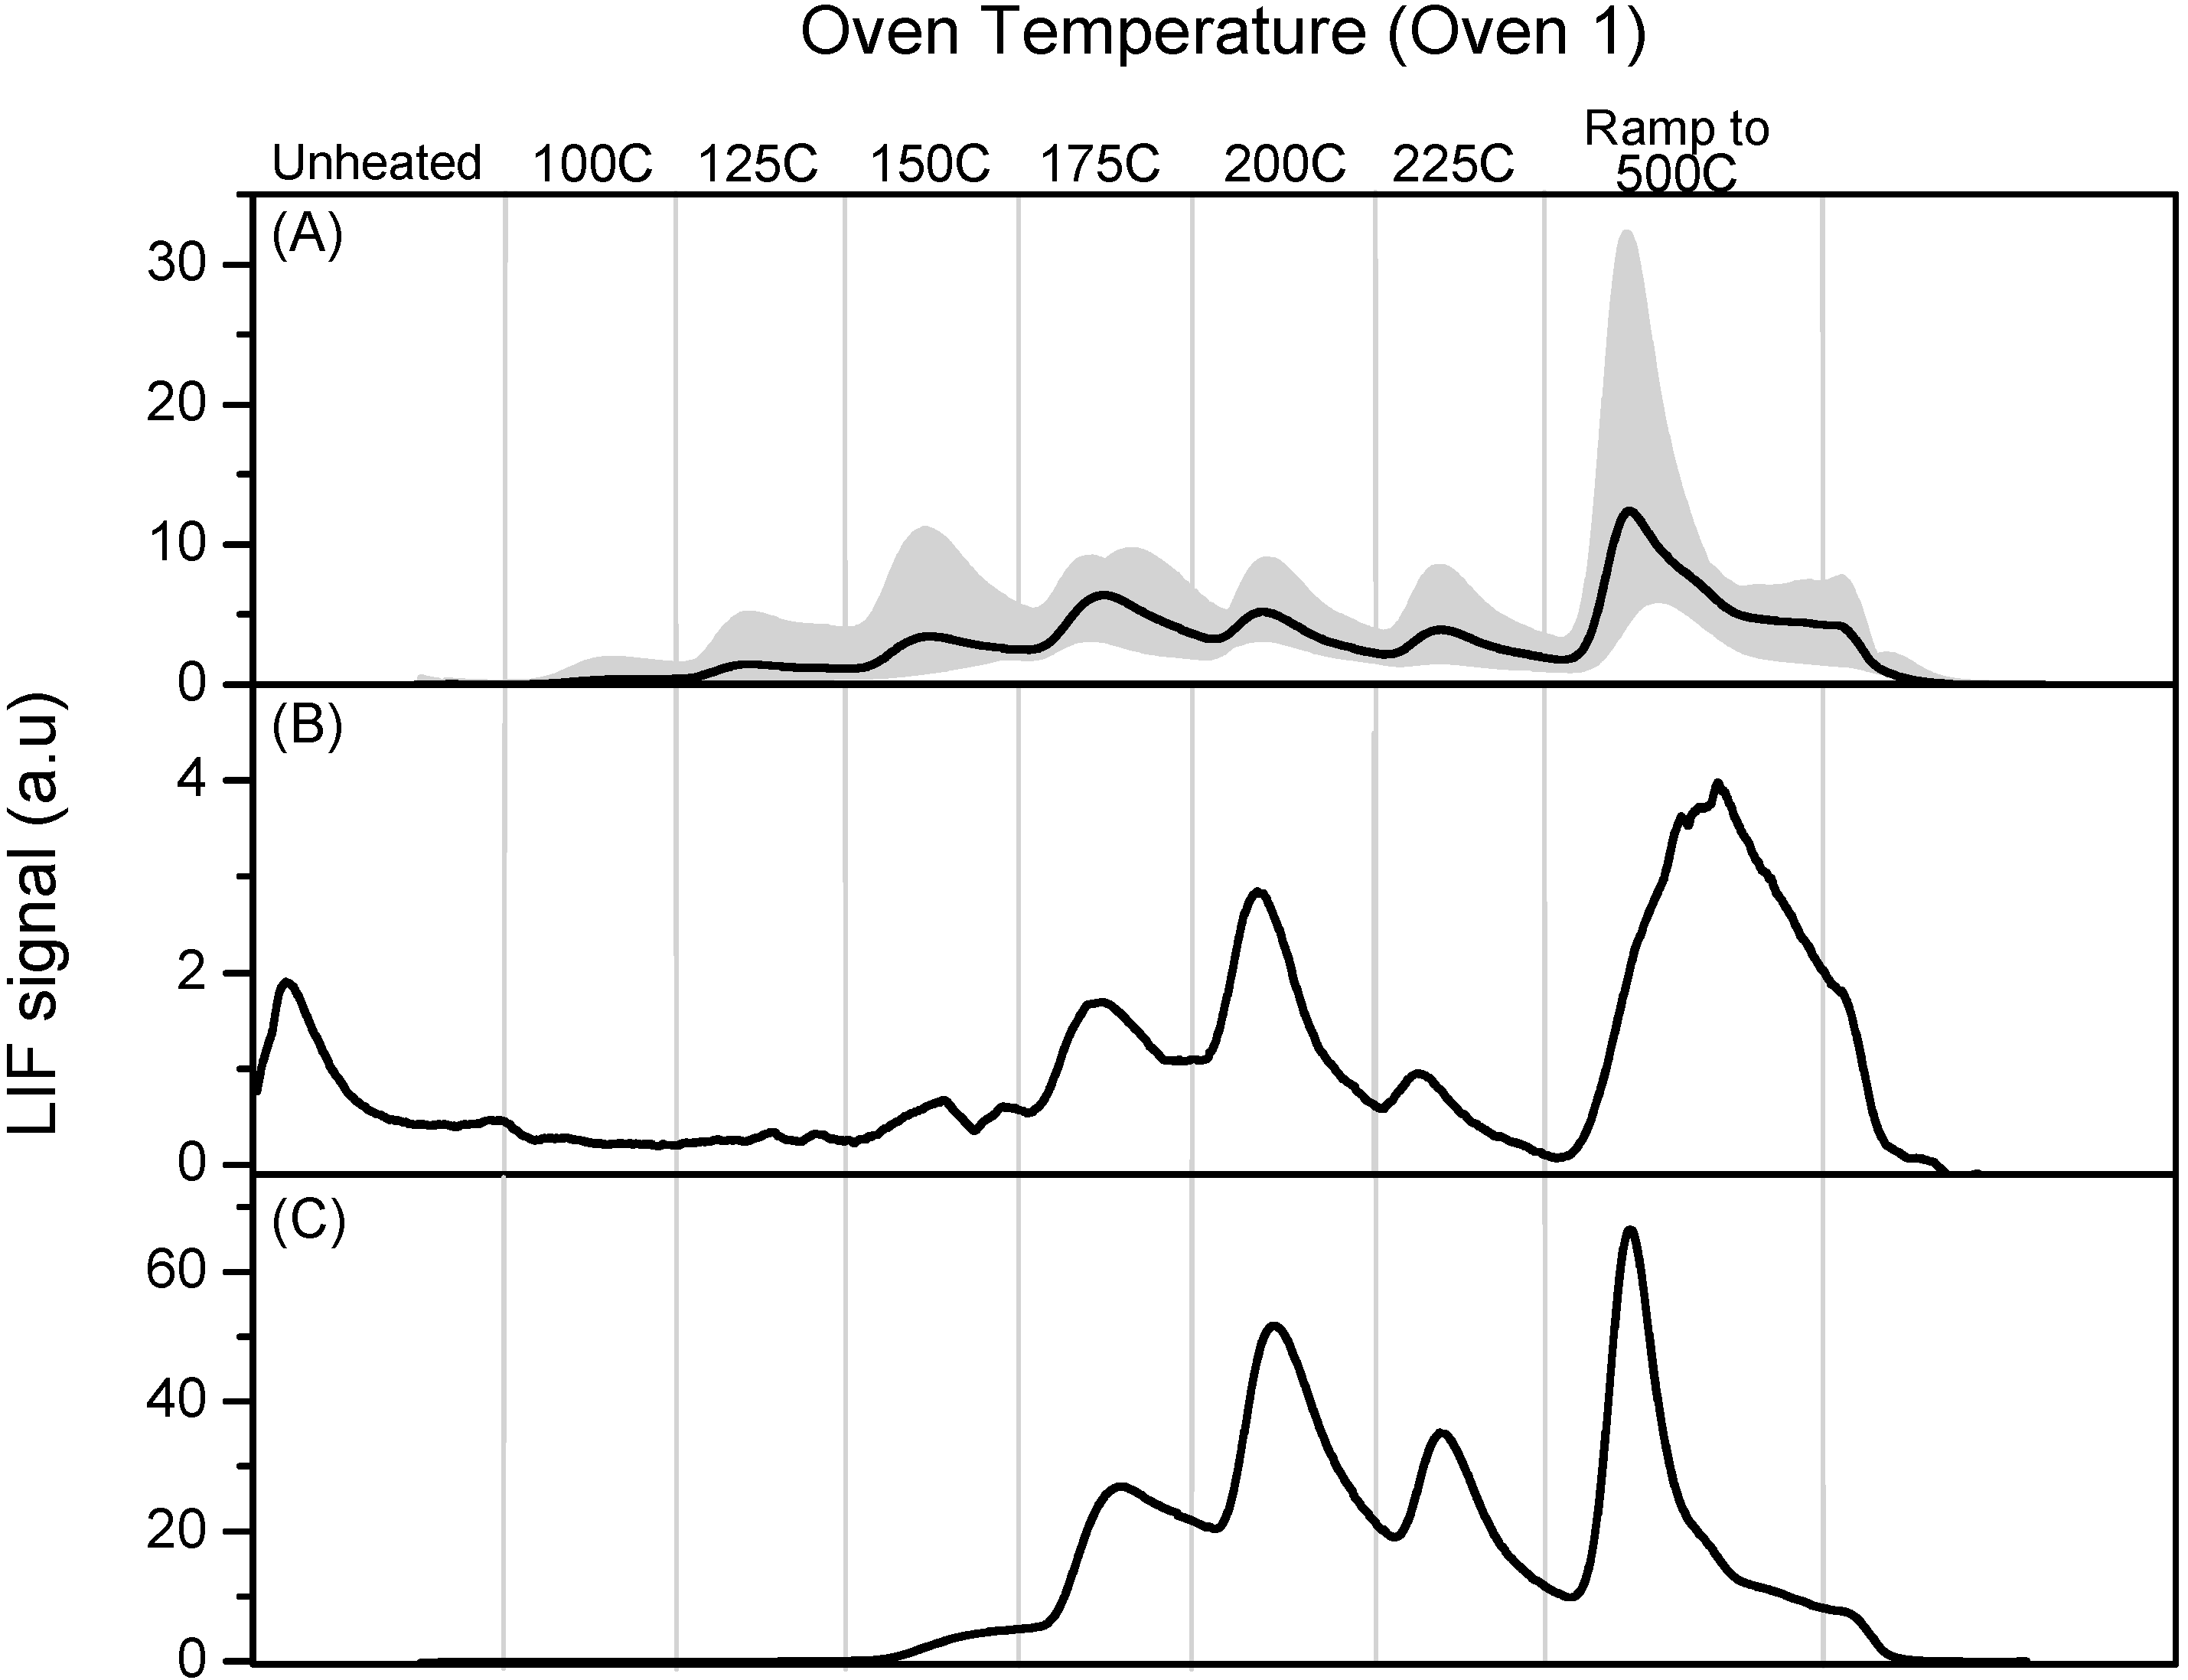
Figure 4a. The grey shading in this and subsequent “oven 1” PTD figures spans the minimum and maximum signals observed. The “oven 1” profiles have a slower temperature ramp between 100 and 200 °C; however, we saw no evidence for any RGM species with a lower peak decomposition temperature. The “oven 1” PTD profile for pure HgCl
2 shows measurable decomposition at 100 °C and typically peaks at ~200 °C. In the “oven 1” PTD profiles of stack samples, decomposition begins at a slightly higher temperature but the peak decomposition temperatures of the majority of the stack PTD profiles are consistent with HgCl
2 being the sampled component of the deposited RGM. We should emphasize that this does not identify or prove that the compound is HgCl
2; however, we do not see any evidence for a species with a peak decomposition temperature that is significantly lower and could clearly be identified as not being consistent with HgCl
2.
Figure 4.
Panel (A): Calibration profile obtained from average of six PTD profiles using Oven 1 program for denuder loaded with pure HgCl2. The grey shading spans the minimum and maximum signals observed; Panels (B,C): Dissociation profiles obtained using Oven 1 program for stack samples collected 18, 23 and 29 February 2008.
As we discuss above, the variation and reproducibility of the PTD profiles is a function of the deposition pattern, the temperature gradient, reproducibility of oven temperature cycling, and the direction of gas flow during both sampling and analysis. During stack sampling it is reasonable to assume that a variety of compounds that are present in the stack gas are being co-deposited on the denuders and this may have some impact both on the decomposition temperature and the competition between desorption and decomposition. It is also possible that chemical reactions can take place on the surface of the denuder between deposited RGM and other components of the stack gas. In-situ spiking of the stack gas with HgCl2 could address the impact of co-deposition effects.
2.4. In-Plume Sampling
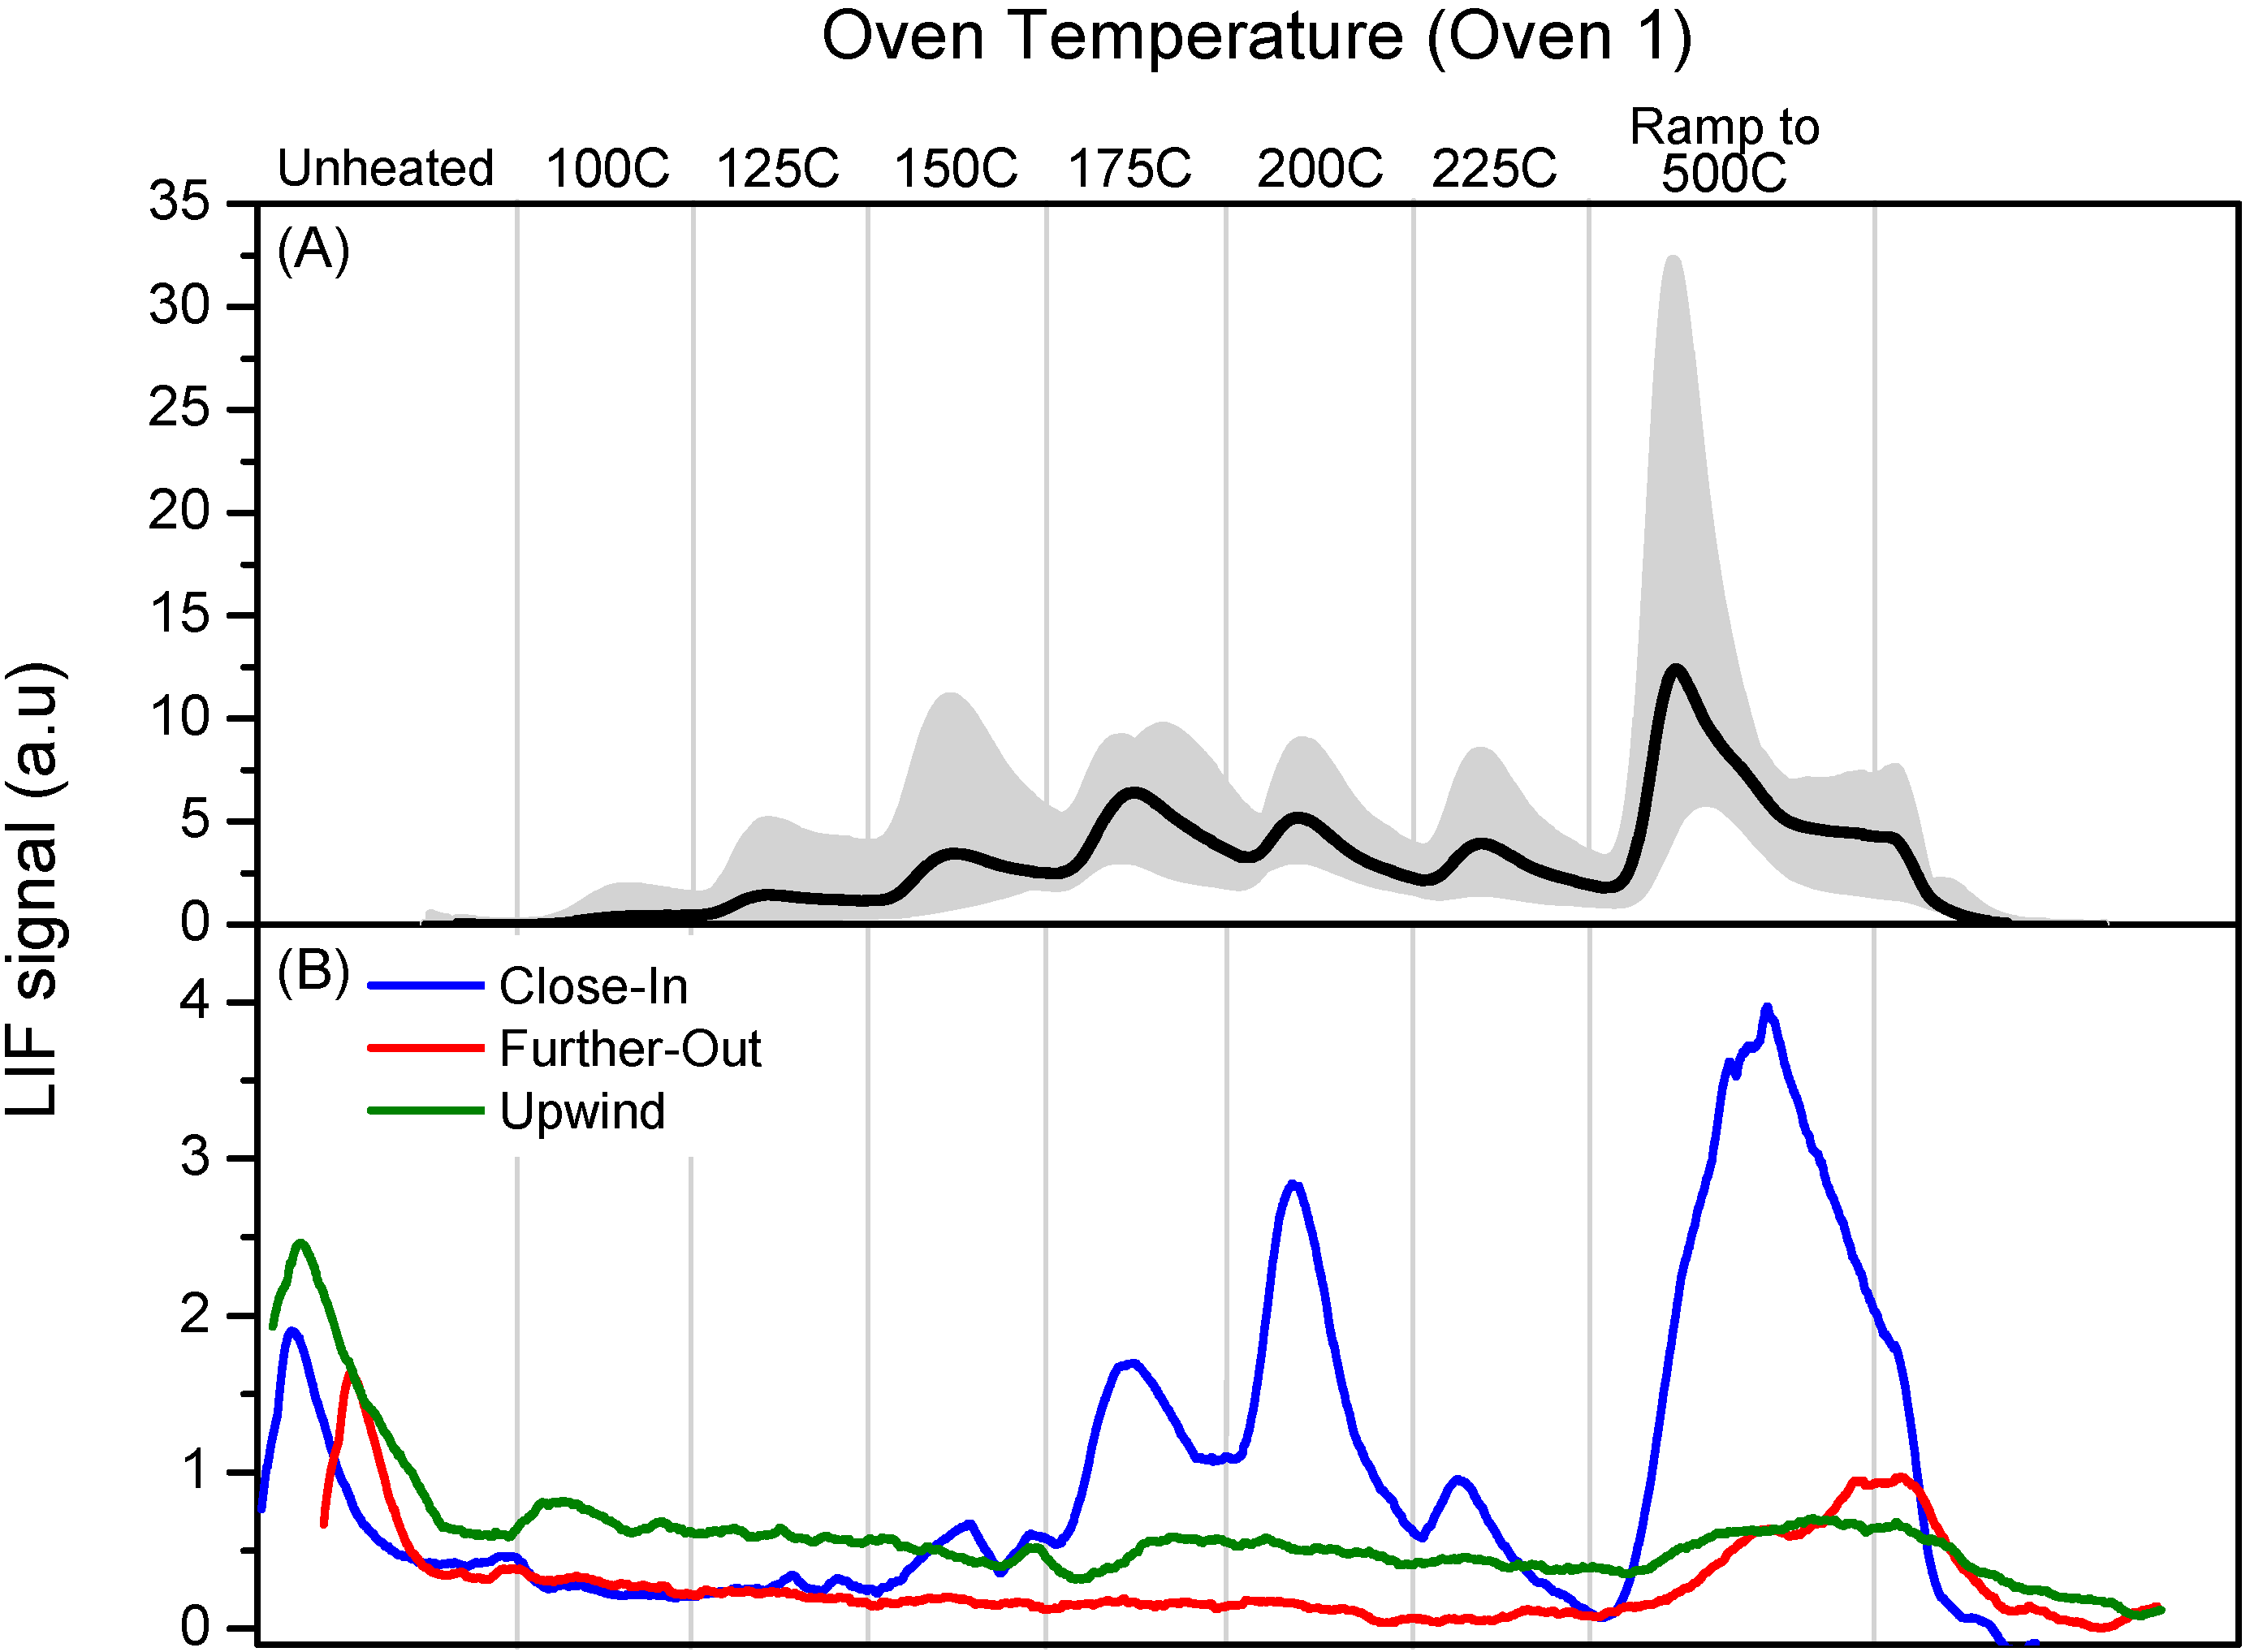
Figure 5b shows profiles from 28 February, showing the similarity in PTD profiles sampled in the stack and plume. The upwind sample was located approx. 4 km upwind of the Crist plant, Close-in was a sample collected approx. 0.6 km downwind of the Crist plant and further-out was a sample collected approx. 1.5 km downwind of the Crist plant.
Figure 5.
Panel (A): Calibration profile obtained from average of six PTD profiles using Oven 1 program for denuder loaded with pure HgCl2. The grey shading spans the minimum and maximum signals observed; Panel (B): Dissociation profiles obtained using Oven 1 program for airship samples collected 28 February 2008.
The “close-in” sample shows a well-defined thermal dissociation profile that is similar to the stack profile of the morning of the 29 February 2008, as seen in
Figure 4, burning an identical coal mixture. The airship profiles show a GEM signal that occurs prior to the heating cycle. This preheat mercury signal was observed in all of the airship samples including those that were not able to detect any plume RGM. No preheat mercury signal was observed in any of the stack samples. This could be a result of a contamination problem in the adapters used to plumb the screw-end denuders into the analysis gas flow system but its origin was not identified.
Figure 6 shows the PTD profiles of HgCl
2, the “close-in” blimp sample and the stack sample from the morning of the 29 February 2008.
The similarity between the PTD stack and blimp profiles and their similarity to the HgCl
2 profile suggest that the species sampled from the stack and the plume are the same and are consistent with the chemical speciation of the sampled RGM being HgCl
2. The coal that was used during this sampling period contained the highest level of chlorine seen during the Crist campaign, constituting 97% of the total halogens with a bromine content of 0.16% and fluorine as the balance. Comparing PTD profiles of HgCl
2 with the PTD profiles of the stack and plume samples suggests they are consistent with HgCl
2 as the specific chemical speciation of sampled stack RGM but, as discussed above, this does not prove that the stack RGM is HgCl
2. It could also consist of other oxidized mercury compounds that have a similar PTD profile to HgCl
2. One possible explanation of the observations of Edgerton
et al. [
1] is that a component of RGM undergoes slow thermal decomposition at ambient temperatures. No evidence for a significant component of the RGM sample that has a significantly lower decomposition temperature than HgCl
2 was observed.
Figure 6.
Panel (A): Calibration profile obtained from average of six PTD profiles using Oven 1 program for denuder loaded with pure HgCl2. The grey shading spans the minimum and maximum signals observed; Panel (B): Dissociation profiles obtained using Oven 1 program for “close-in” airship sample collected 28 February 2008; Panel (C): Dissociation profiles obtained using Oven 1 program for stack sample collected 29 February 2008.
2.5. Denuder Sampling Efficiencies
The objective of this component of the Crist study was to investigate the potential of PTD for chemical speciation of RGM. The collection efficiency of the denuder is not known and PTD will not give a quantitative measurement of RGM concentration under these conditions. However, the PTD profiles were also calibrated for Hg° as discussed in
Section 2.6. This provides an approximate measure of the total amount of RGM collected on the denuder. Since the RGM stack concentrations were measured independently, we can obtain an approximate measure of the sampling efficiency of the denuders as a check on the integrity of the measurements. For example, a sampling efficiency in excess of 100% would imply major problems with denuder contamination.
All denuder sampling was performed under laminar flow conditions and a theoretical sampling efficiency can be estimated using the Gormley-Kennedy equation [
14]. This assumes laminar flow and a sticking coefficient of 1 and requires a tube diameter and a flow rate, which are known, and a diffusion coefficient for the species of interest, which is not known. If a diffusion coefficient of 0.1 cm
2∙s
−1 is assumed, a typical value for molecules in air, we calculate a sampling efficiency of ~60% for the stack sampling and ~70% for plume sampling. If we assume that the chemical identity of the RGM is HgCl
2, we can estimate a diffusion coefficient of 0.04 cm
2∙s
−1 using the mass relationship from Schwarzenbach
et al. [
15] and this would give calculated sampling efficiencies of 35% and 43% at the stack and plume sampling flow rates.
To estimate the actual denuder sampling efficiencies, the total amount of RGM that was sampled was calculated from the stack RGM concentrations as measured by the CEMS instrumentation and sampling flow rate through the denuder. The RGM that was actually deposited on the denuder was taken from the total calibrated PTD profiles and included the final peak obtained during the temperature increase to 500 °C. The RGM actually deposited on the denuder was then divided by the calculated total sampled amount based on the flow and stack concentrations. This then gives an estimate of the denuder sampling efficiency, i.e., the amount of RGM collected on the denuder compared with the total amount of RGM that was sampled from the stack and then flowed through the denuder, but did not necessarily deposit on the walls. These sampling efficiencies are estimates since some RGM was deposited on the ends of the denuders and was not measured. As noted above, it is possible that some of the deposited RGM evaporated before decomposition to Hg° and this would not have been measured.
The efficiencies for stack profiles shown in the figures are given in
Table 1. A total of 28 stack profiles were analyzed with sampling efficiencies that ranged from ~1% to 55%. Sampling efficiencies from samples obtained with the particle filter in place were typically much lower than estimated from the Gormley–Kennedy equation, ranging from ~1% to 30%. Three PTD stack profiles were obtained without the particle filter in the sampling stream and the calculated sampling efficiencies were 50%, 55% and 37%, much closer to the estimated values so it appears that the presence of the filter significantly reduced the sampling efficiency. This does not appear to be due to collection of particulate mercury when the filter was removed. These samples were obtained downstream of the electrostatic precipitator and Ontario Hydro measurements found that the concentration of particulate mercury was below detection limits. We have looked at the variability in greater detail. Based on a total of 24 samples taken with the filter the mean and standard deviation of the RGM/m
3 is 0.46 ± 0.66 ug/m
3, taking only samples collected using etched denuders we obtain 0.25 ± 0.19 ug/m
3 and those analyzed using the oven 2 cycle 0.35 ± 0.24 ug/m
3. For the samples taken without the filter the average is 2.7 ± 1.0 ug/m
3. It is clear that the presence of the quartz filter significantly reduced the collection efficiency and we have no explanation for this. The significant variability is also clear and it does not appear to be explained by differences in analysis,
i.e., oven program, or tube etching.
In
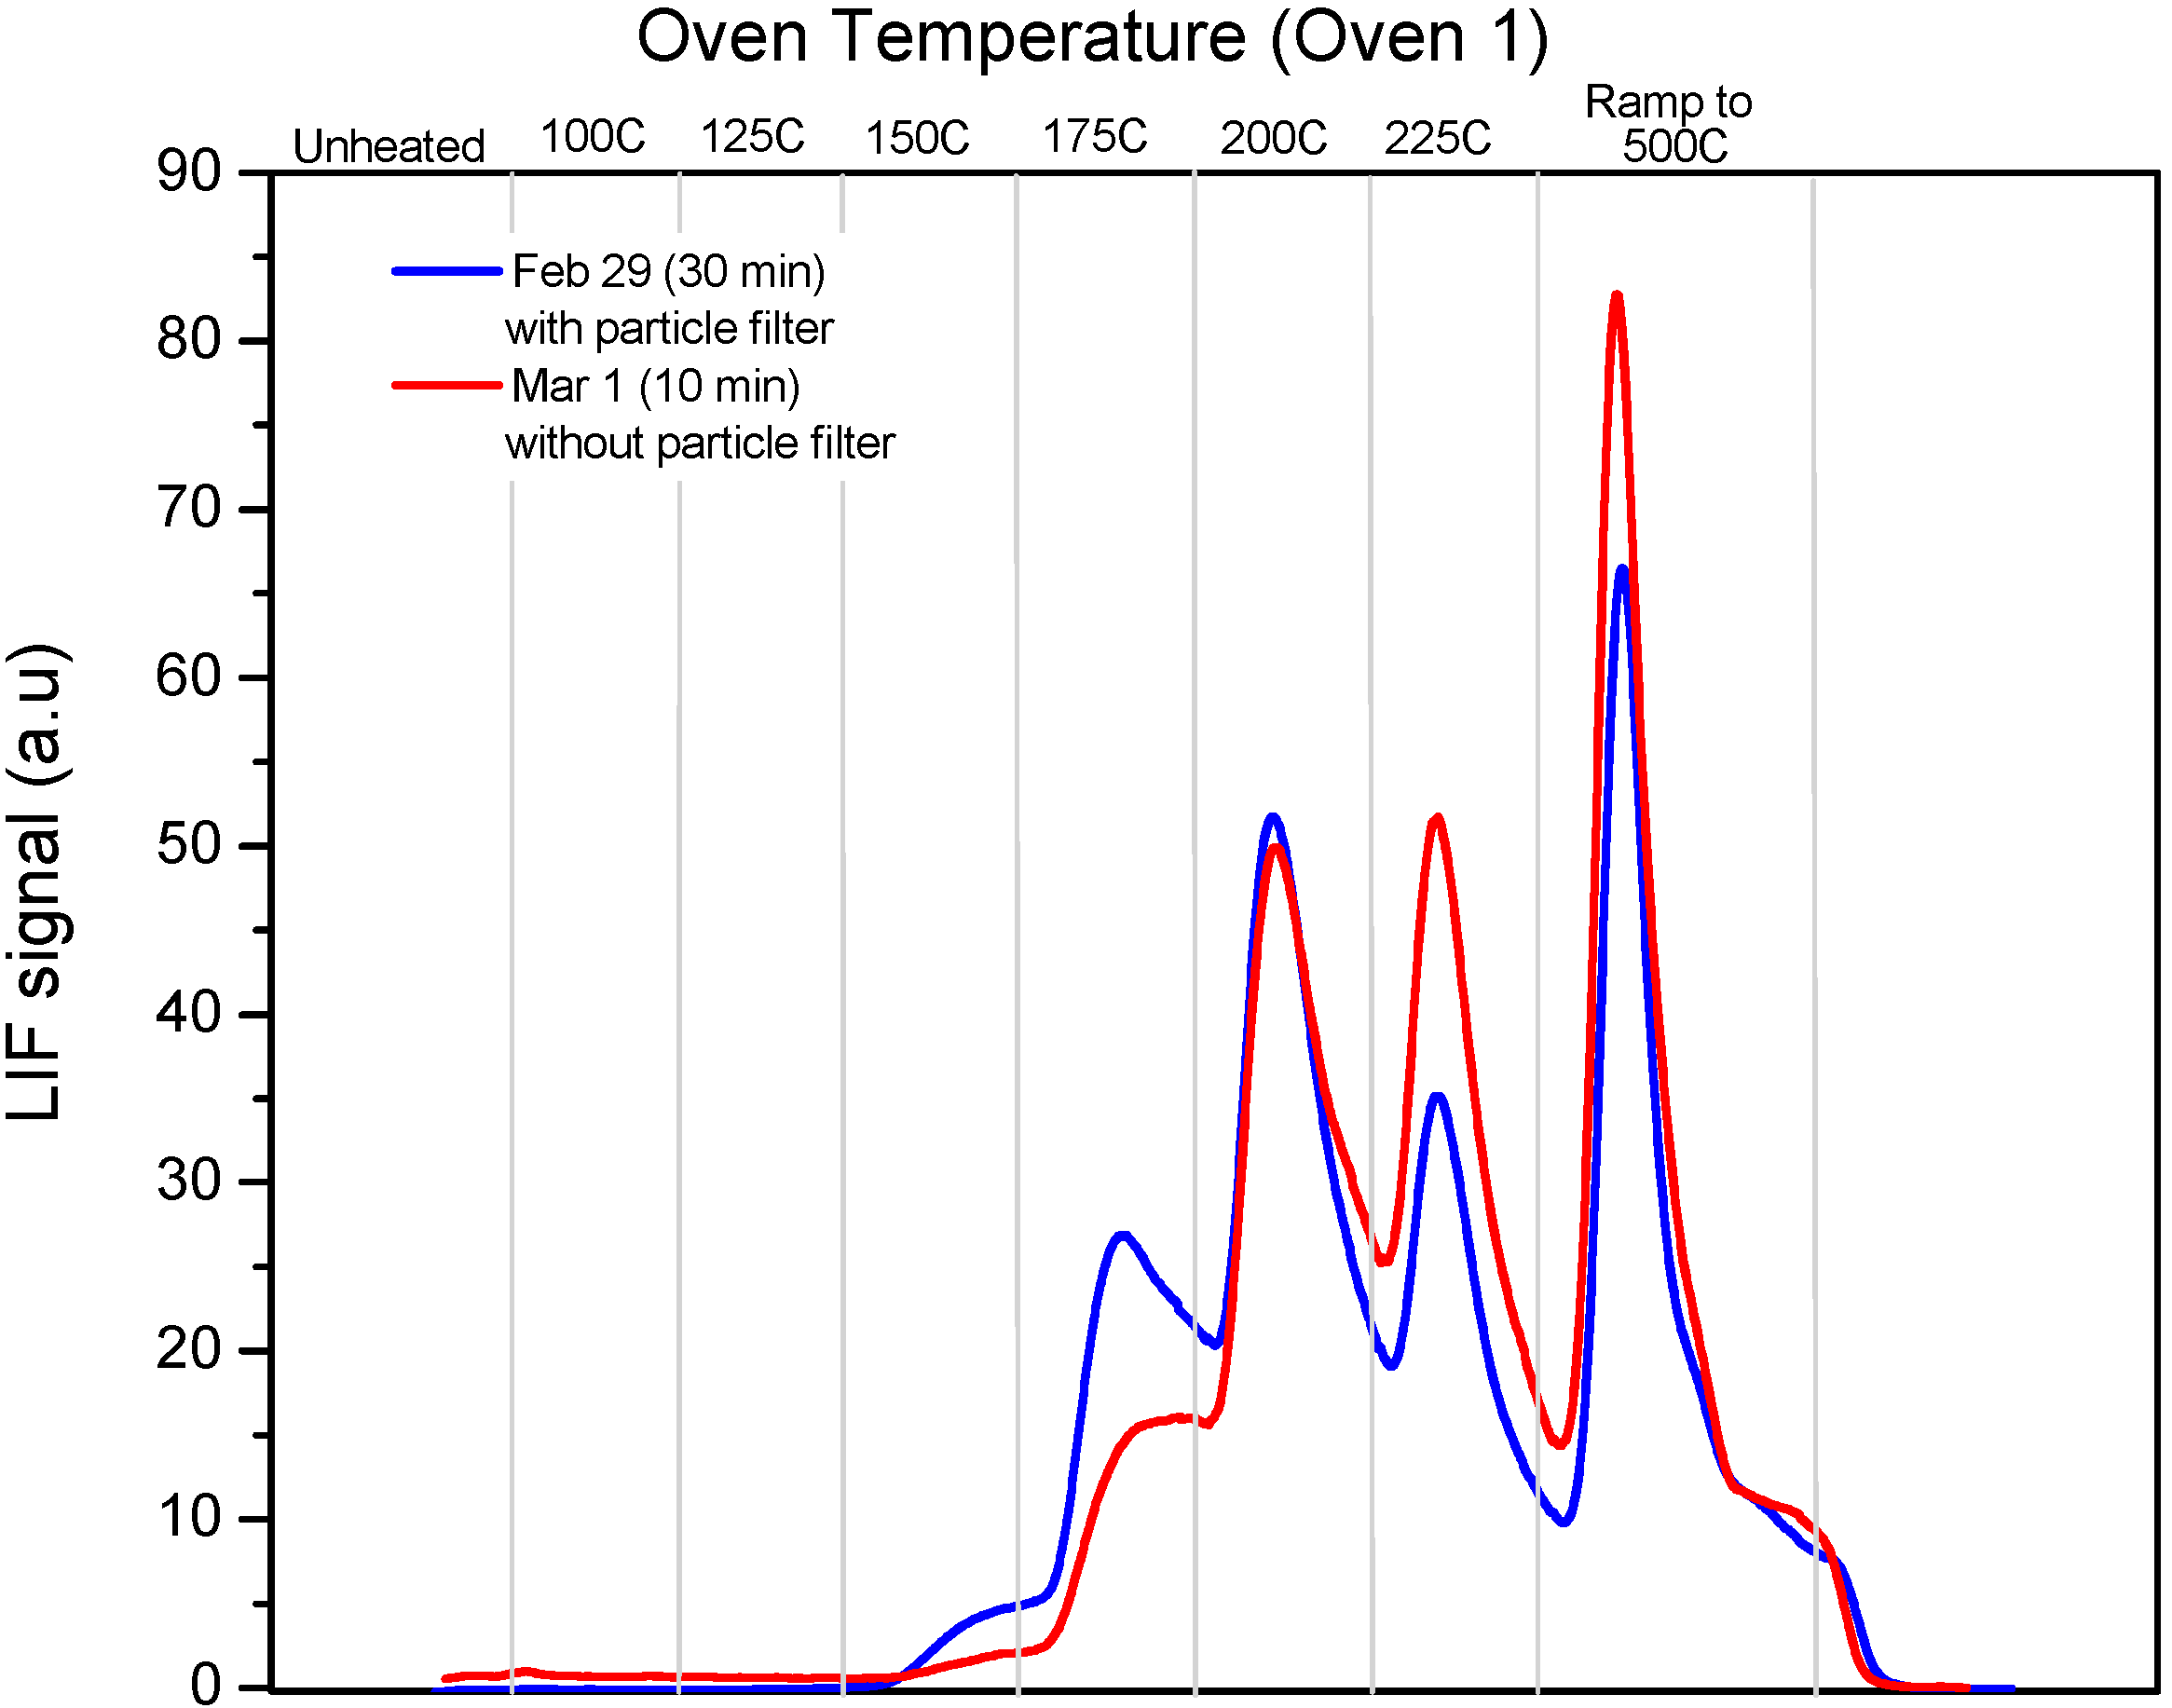
Figure 7 we show PTD profiles of two samples taken within a 24-h period burning identical coals. One, a 30 min stack sample from 29 February was taken with the filter in place, while the other, a 10 min stack sample from March 1st was taken without the filter. The similarity between the profiles suggests that the filter did not affect the speciation of the deposited RGM, while the difference in sampling time shows the reduced collection efficiency when the filter was in place. It is important to also recognize that the measured RGM in the stack gas was variable and there was disagreement of up to 40% in the stack RGM measurements using different approaches.
Figure 7.
Comparison of PTD profiles (using Oven 1 program) of a 30 min stack sample obtained on 29 February 2008 with the particle filter in place and a 10 min stack sample obtained on 1 March 2008 without the particle filter.
Figure 7.
Comparison of PTD profiles (using Oven 1 program) of a 30 min stack sample obtained on 29 February 2008 with the particle filter in place and a 10 min stack sample obtained on 1 March 2008 without the particle filter.
An estimate of the collection efficiency of the in-plume samples requires a comparison between sampled RGM and that predicted using the measured stack concentrations and calculated plume dilution ratios. Dilution ratios were based on the measured concentrations of three tracer gases, SO
2, NO
y and CO
2, which were measured in stack and also in the airship.
Figure 8 shows the “background corrected” concentrations of SO
2, NO
y and CO
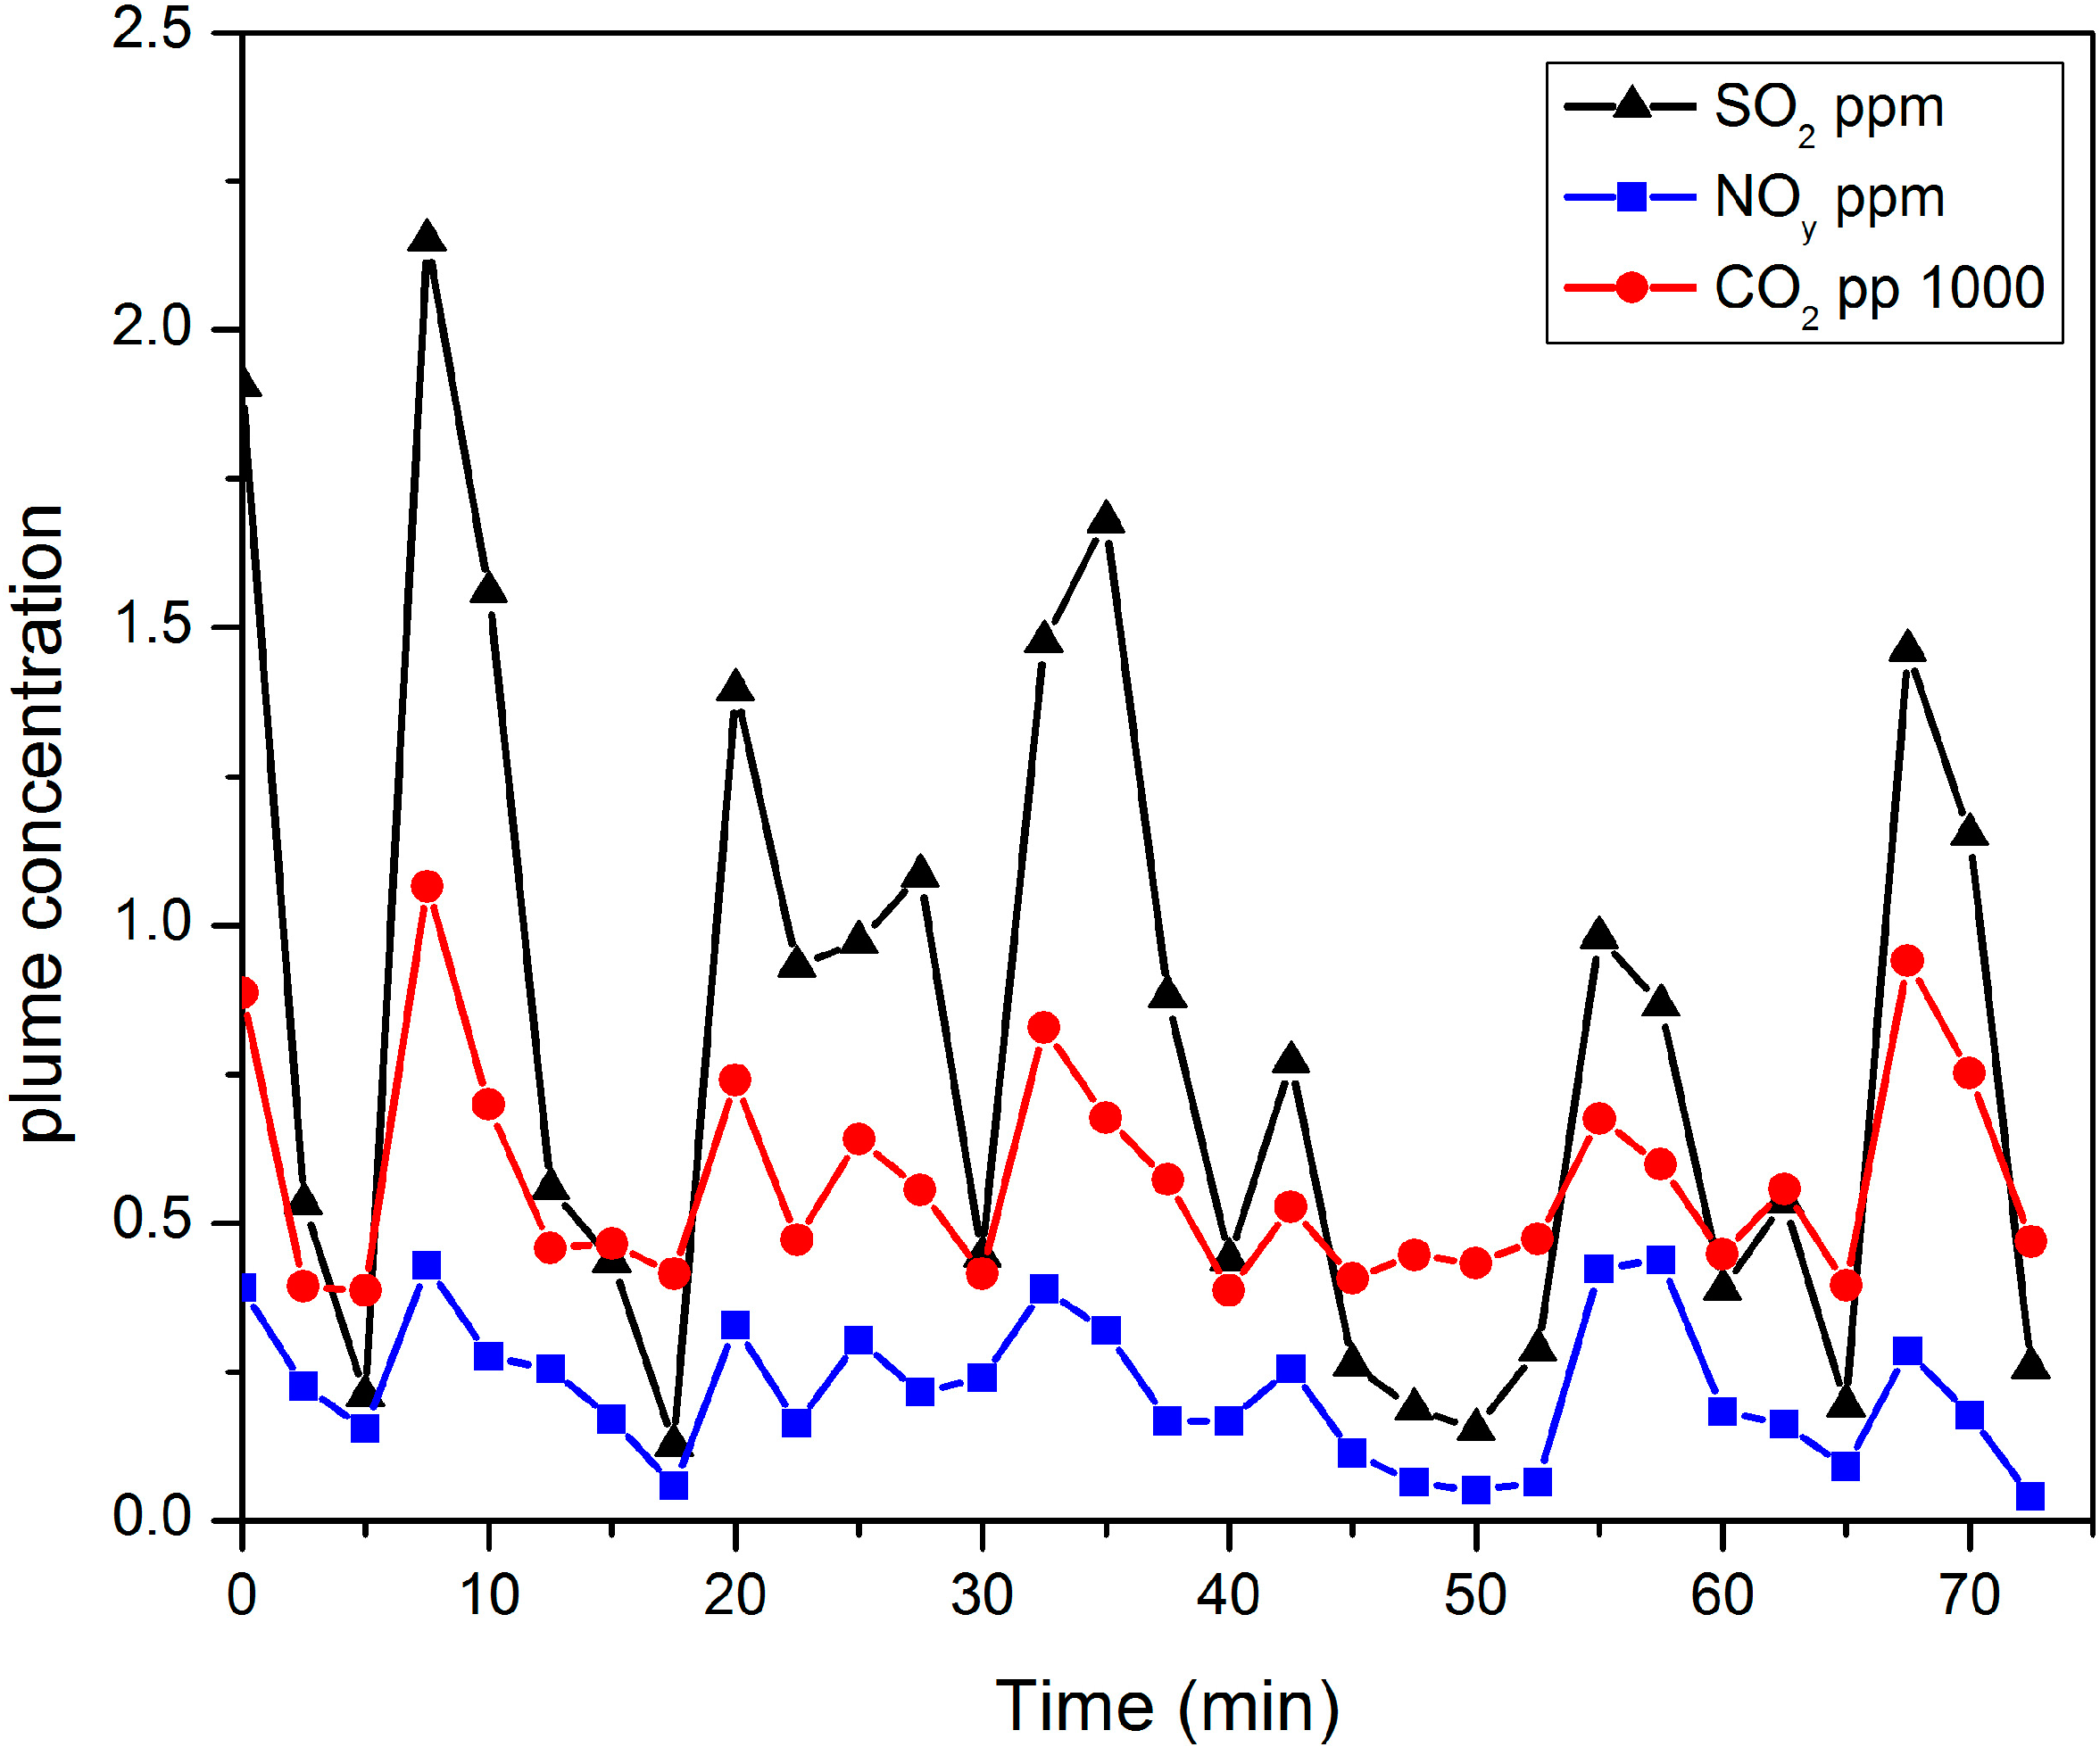
2 as measured by the airship’s sampling system during the 75-min “close-in” sampling run on 28 February.
Figure 8.
“Background corrected” concentrations of SO2, NOy and CO2 as measured by the airship’s sampling system during the “close-in” sampling run on 28 February.
Figure 8.
“Background corrected” concentrations of SO2, NOy and CO2 as measured by the airship’s sampling system during the “close-in” sampling run on 28 February.
The background correction was obtained by subtracting the concentrations measured upstream of the plume. The concentrations shown in
Figure 8 reflect the increase in the concentration of these gases over ambient as the plume gases mix with ambient air. There was little variation in the stack concentrations during the sampling period and the observed variations reflect the difficulties of keeping the airship’s sampling system in the plume. The measured airship concentrations of SO
2, NO
y and CO
2 can be used to calculate the dilution of the plume gases as the plume evolved and mixed with ambient air. Because of the variation in concentration, the dilution ratios were calculated for 2.5 min coincident time bins for each tracer gas. The calculated dilution ratio for each tracer gas was then multiplied by the stack RGM concentration measured by the CEMS instrumentation to calculate the mass of RGM sampled by the denuder during each 2.5 min bin. This was summed to calculate the total mass of RGM sampled by the denuder during the 75-min sampling period based on each tracer dilution ratio.
Table 1 shows the calculated total amount of RGM sampled by the denuders at the “close-in” and “further-out” positions. These amounts are calculated from the RGM concentration measured in the stack by the CEMS instrument and the calculated dilution ratio from each tracer. The difference between the values calculated using the three tracers reflects the fact that the three tracers give different integrated dilution ratios, an indication of the difficulty of the measurement.
Table 1.
Estimated denuder collection efficiencies for in-plume samples obtained 28 February 2008.
Table 1.
Estimated denuder collection efficiencies for in-plume samples obtained 28 February 2008.
| Airship Sample | Denuder Type | Actual RGM * Deposited on Denuder (ng) | Total RGM ** Sampled by Denuder (ng) as Calculated from Dilution Ratios | Denuder Collection Efficiency (%) as Calculated from Dilution Ratios |
|---|
| SO2 | NOy | CO2 | SO2 | NOy | CO2 |
|---|
| “Close-in” | unetched quartz | 1.19 | 1.78 | 2.16 | 1.19 | 67 | 55 | 100 |
| “Further-out” | unetched pyrex | 0.13 | 0.41 | 0.73 | 0.41 | 32 | 18 | 32 |
The observation of the early Hg° signal and the drifting baseline complicate the analysis of the dissociation profiles in
Figure 3. The “close-in” profile shows a well-defined dissociation profile between 150–225 °C and a larger area in the final ramp to 500 °C. Taking the total integrated sample gives ~1.3 ng of Hg°, 0.61 ng in the structured profile and 0.66 ng in the final ramp to 500 °C. If we take the 0.08 ng from the upwind sample as our field blank we calculate 0.13 ng of RGM deposited on the “further-out” denuder and 1.19 ng deposited on the “close-in” denuder. If we then compare this with the total RGM sampled by the denuders, as calculated from dilution ratios, we find sampling efficiencies of 67% and 55% using the SO
2 and NO
y dilution ratios and 100% from the CO
2 dilution ratio. For the “Further-out” denuder we calculate sampling efficiencies of 32%, 18% and 32% respectively. Given the large uncertainty in the dilution ratios these efficiencies suggest that the RGM sampled in-plume is consistent with the levels measured by the CEMS instrument in the stack. This, together with the PTD profiles of the stack and plume samples shown in
Figure 6 suggests that it is possible to use PTD to measure a component of RGM in the stack and follow its evolution in the plume. It also suggests that the speciation of the RGM is not changed during this period and that it is consistent with HgCl
2 as the speciation of RGM. This can be compared with the observations of Deeds
et al. [
4] who found greatly decreased levels of RGM and no mass balance.
2.6. RGM Speciation
As we have noted above, it is important to emphasize that the generally held opinion that HgCl
2 is the species of RGM emitted from coal-fired power plants is not based on any experimental evidence, or on any reasonable mechanism for homogeneous formation of HgCl
2 in coal combustion. The PTD profiles shown here are clearly consistent with identifying the speciation of stack and plume RGM as HgCl
2 and represent the first actual experimental evidence that is consistent with HgCl
2 speciation. It is reasonable to ask if any other mercury species is consistent with the observed PTD profiles. As we have noted previously, all of the mercuric halides are stable gas phase species; however, for most of the coal burned during the Crist campaign more than 95% was present as Cl and less than 1% was present as Br, hence HgBr
2 is not viable as an RGM candidate. Sulfur typically constituted 1% by weight of the coal burned; however, HgS is not a stable gas phase species [
16] and the PTD profiles of HgS are not consistent with our observations.
The reported PTD profiles for solid HgO [
11,
12,
13] are much more variable with peak decomposition temperatures ranging from 260 °C to 600 °C, but are not consistent with the decomposition seen in oven 1 profiles. Earlier work [
8] suggested that HgO could be a significant component of RGM at stack gas temperatures in excess of 450 °C. However, recent high level ab-initio calculations [
17] have shown that HgO cannot exist as a stable diatomic molecule in the gas phase. The implications of this for the atmospheric chemistry of mercury have been discussed in detail elsewhere [
18] but it is clear that even in lean flames HgO can play no role in Hg oxidation and cannot be a candidate for stack RGM. It should be noted that Donohoue [
9] reported PTD profiles for HgO that were thought to be from gas phase deposition. These profiles showed decomposition at low temperatures but it is now clear that these profiles were an artifact that resulted from contamination in sample lines. We have measured PTD profiles of solid HgO and find that it decomposes at a significantly higher temperature than HgCl
2.
It is clear, therefore, that HgCl2 is the only stable Hg(II) species with an observed PTD profile that is consistent with our stack and plume PTD profiles and is the most likely candidate for the actual species.
In spite of the caveats associated with the fact that this was the first attempt to do this kind of sampling and analysis in a working coal-fired power plant, our experimental evidence, sampling from both stack and plume, suggests that HgCl2 is indeed the emitted form of RGM. To the best of our knowledge this is the first and only set of experimental evidence that addresses this speciation issue. It suggests that attempts to understand and model in-plume reduction of RGM to GEM should use HgCl2 as the speciation of RGM.

