Article

Mercury Speciation at a Coastal Site in the Northern Gulf of Mexico: Results from the Grand Bay Intensive Studies in Summer 2010 and Spring 2011

by
Xinrong Ren
1,2,7,*,
Winston T. Luke
1,
Paul Kelley
1,2,
Mark Cohen
1,
Fong Ngan
1,2,
Richard Artz
1,
Jake Walker
3,
Steve Brooks
1,†,
Christopher Moore
4,
Phil Swartzendruber
5,§,
Dieter Bauer
5,
James Remeika
5,
Anthony Hynes
5,
Jack Dibb
6,
John Rolison
7,‡,
Nishanth Krishnamurthy
7,
William M. Landing
7,
Arsineh Hecobian
8,ǁ,
Jeffery Shook
8,¶ and
L. Greg Huey
8
1
Air Resources Laboratory, National Oceanic and Atmospheric Administration, 5830 University Research Court, College Park, MD 20740, USA
2
Cooperative Institute for Climate and Satellites, University of Maryland, 5825 University Research Court, College Park, MD 20740, USA
3
Grand Bay National Estuarine Research Reserve, 6005 Bayou Heron Road, Moss Point, MS 39562, USA
4
Division of Atmospheric Sciences, Desert Research Institute, 2215 Raggio Parkway, NV 89512, USA
5
Rosenstiel School of Marine and Atmospheric Science, University of Miami, 4600 Rickenbacker Causeway, Miami, FL 33149, USA
6
Earth Systems Research Center, Institute for the Study of Earth, Oceans and Space, University of New Hampshire, 8 College Road, Durham, NH 03824, USA
7
Department of Earth, Ocean, and Atmospheric Science, Florida State University, 117 North Woodward Avenue, Tallahassee, FL 32306, USA
8
School of Earth and Atmospheric Science, Georgia Institute of Technology, 311 Ferst Drive, Atlanta, GA 30332, USA
*
Author to whom correspondence should be addressed.
Current Affiliation: Department of Mechanical, Aerospace and Biomedical Engineering, University of Tennessee Space Institute, 411 BH Goethert Parkway, Tullahoma, TN 37388, USA.
§
Current Affiliation: Puget Sound Clean Air Agency, 1904 Third Avenue, Seattle, WA 98101, USA.
Current Affiliation: Department of Chemistry, Otago University, Dunedin 9016, New Zealand.
ǁ
Current Affiliation: Department of Atmospheric Science, Colorado State University, 200 West Lake Street, Fort Collins, CO 80523, USA
Current Affiliation: Talcott Mountain Science Center, 324 Montevideo Road, Avon, CT 06001, USA.
Atmosphere 2014, 5(2), 230-251; https://doi.org/10.3390/atmos5020230
Submission received: 28 February 2014 / Revised: 12 April 2014 / Accepted: 14 April 2014 / Published: 29 April 2014
(This article belongs to the Special Issue Atmospheric Mercury)

Abstract

:
During two intensive studies in summer 2010 and spring 2011, measurements of mercury species including gaseous elemental mercury (GEM), gaseous oxidized mercury (GOM), and particulate-bound mercury (PBM), trace chemical species including O3, SO2, CO, NO, NOY, and black carbon, and meteorological parameters were made at an Atmospheric Mercury Network (AMNet) site at the Grand Bay National Estuarine Research Reserve (NERR) in Moss Point, Mississippi. Surface measurements indicate that the mean mercury concentrations were 1.42 ± 0.12 ng∙m−3 for GEM, 5.4 ± 10.2 pg∙m−3 for GOM, and 3.1 ± 1.9 pg∙m−3 for PBM during the summer 2010 intensive and 1.53 ± 0.11 ng∙m−3 for GEM, 5.3 ± 10.2 pg∙m−3 for GOM, and 5.7 ± 6.2 pg∙m−3 for PBM during the spring 2011 intensive. Elevated daytime GOM levels (>20 pg∙m−3) were observed on a few days in each study and were usually associated with either elevated O3 (>50 ppbv), BrO, and solar radiation or elevated SO2 (>a few ppbv) but lower O3 (~20–40 ppbv). This behavior suggests two potential sources of GOM: photochemical oxidation of GEM and direct emissions of GOM from nearby local sources. Lack of correlation between GOM and Beryllium-7 (7Be) suggests little influence on surface GOM from downward mixing of GOM from the upper troposphere. These data were analyzed using the HYSPLIT back trajectory model and principal component analysis in order to develop source-receptor relationships for mercury species in this coastal environment. Trajectory frequency analysis shows that high GOM events were generally associated with high frequencies of the trajectories passing through the areas with high mercury emissions, while low GOM levels were largely associated the trajectories passing through relatively clean areas. Principal component analysis also reveals two main factors: direct emission and photochemical processes that were clustered with high GOM and PBM. This study indicates that the receptor site, which is located in a coastal environment of the Gulf of Mexico, experienced impacts from mercury sources that are both local and regional in nature.

1. Introduction

Mercury (Hg) is a ubiquitous and toxic pollutant in the environment. It exists in several distinct chemical and physical forms that dictate to a large degree, the ultimate impact of Hg on the environment. The main pathway of the release of mercury to the environment is through the atmosphere. The release of mercury compounds to the atmosphere, followed by their transport and deposition, often constitutes the main pathway for the global dispersion of mercury and the dominant loading mechanism of new mercury to water bodies and watersheds [1,2,3,4]. Human activities, such as smelting and coal burning, have significantly increased mercury levels in the atmosphere, surface soils, fresh waters, and oceans [2,5,6]. Mercury deposits to watersheds and receiving water bodies where it can be converted to methylmercury, a highly toxic form, and, thus, enters the food chain through bioaccumulation [7]. Methylmercury can adversely affect the nervous system, particularly those of fetuses and young children [8]. Human exposure to mercury is primarily from the consumption of contaminated fish and other aquatic organisms [5,8,9].
The mercury in the atmosphere arises from a variety of sources, both anthropogenic and natural [5,10,11]. Direct emissions of gaseous elemental mercury (GEM) and two operationally-defined forms of mercury, gaseous oxidized mercury (GOM), and particulate-bound mercury (PBM), from anthropogenic sources account for the bulk of mercury injected into the atmosphere [11]. GEM is also evaded from soils and the ocean surface; chemical reactions in the atmosphere transform natural and anthropogenic GEM into GOM and PBM species. Thus, it is important to understand where mercury emissions originate, how and where mercury is transported and deposited, and what changes will occur due to emission controls so that policy-makers and regulators can deal effectively with mercury emissions.
Studies have shown that the Gulf of Mexico region is plagued by persistently high total mercury in precipitation [12]. Data from the National Atmospheric Deposition Program’s Mercury Deposition Network (MDN) indicate that mercury concentrations in precipitation in the Gulf of Mexico region are some of the highest in the United States [13]. Meanwhile, fish consumption in coastal areas is typically much higher than the national average, and every state along the Gulf of Mexico has widespread fish consumption advisories for mercury. The reasons why mercury deposition in the Gulf of Mexico region is especially high are not entirely clear. Previous monitoring of atmospheric Hg in the Gulf of Mexico area shows a strong diel pattern for GOM with peaks in the afternoon [12,14]. The elevated GOM levels were attributed to the photochemical oxidation of GEM by atmospheric oxidants, with enhancement of GOM from local emissions [12]. An early morning enhancement of GOM at an urban site in Birmingham, Alabama was also observed and it was attributed to boundary layer processes such as the erosion of the nocturnal inversion and subsequent vertical mixing [14]. Long-term monitoring and intensive studies of mercury speciation are needed to characterize these processes and to assess both regional and global atmospheric budget and cycling of mercury.
In this paper, we present an analysis of two atmospheric mercury intensive studies at a coastal site in the northern Gulf of Mexico (see Figure 1 for the location of the site) in summer 2010 and in spring 2011. The main purpose of this study is to understand processes important to explain the variations in the observed mercury data. Back trajectory simulations and principal component analysis were conducted to try to examine the Hg source-receptor relationships in this costal environment.
Figure 1. (Left) location of the Grand Bay NERR monitoring station, along with large point sources of gaseous oxidized mercury (GOM) in the region, based on the US EPA’s 2005 National Emissions Inventory (NEI). (Right top) site view from the Grand Bay NERR atmospheric mercury measurement tower. (Right bottom) the measurement tower at Grand Bay NERR, and two sets of Tekran mercury speciation units in a climate-controlled shelter adjacent to the tower.
Atmosphere 05 00230 g001

2. Results and Discussion

2.1. Surface Observations

A statistical summary of the measurements at the monitoring site are listed in Table 1 for both intensive studies in summer 2010 and spring 2011. We chose these two particular seasons because of reactive photochemistry in summer and enhanced GOM levels in spring from the historical mercury observations at this site.

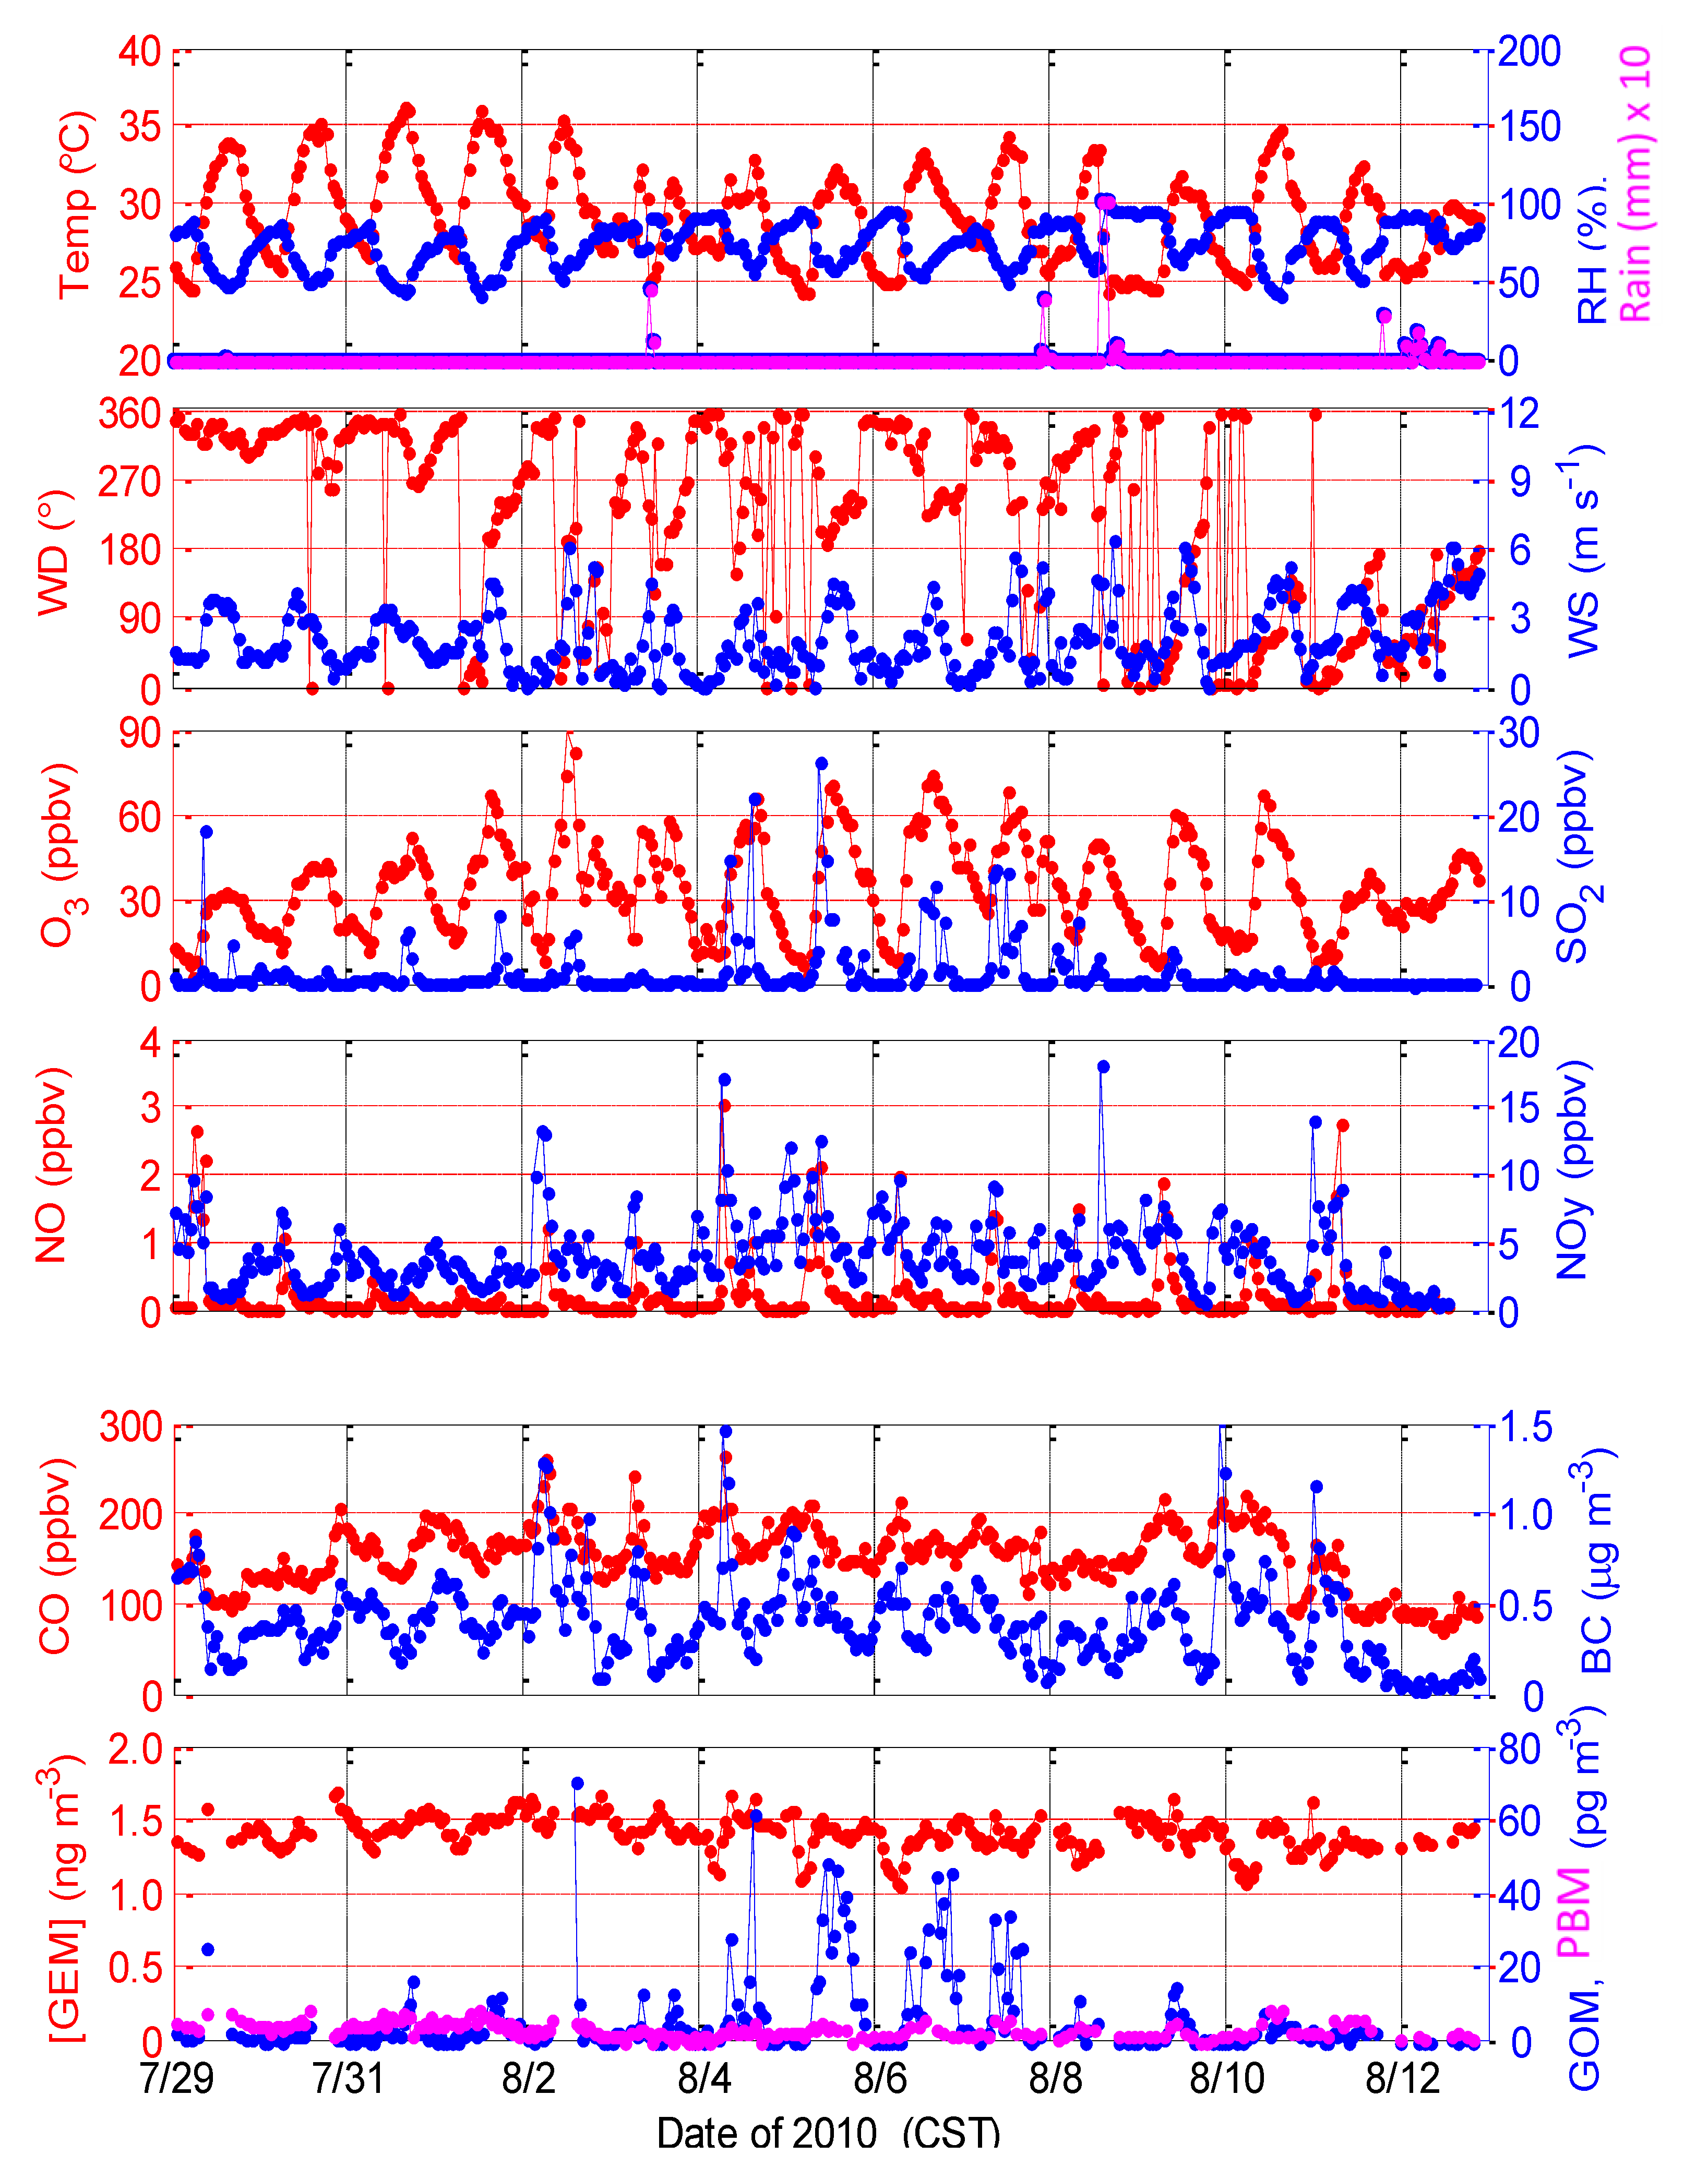
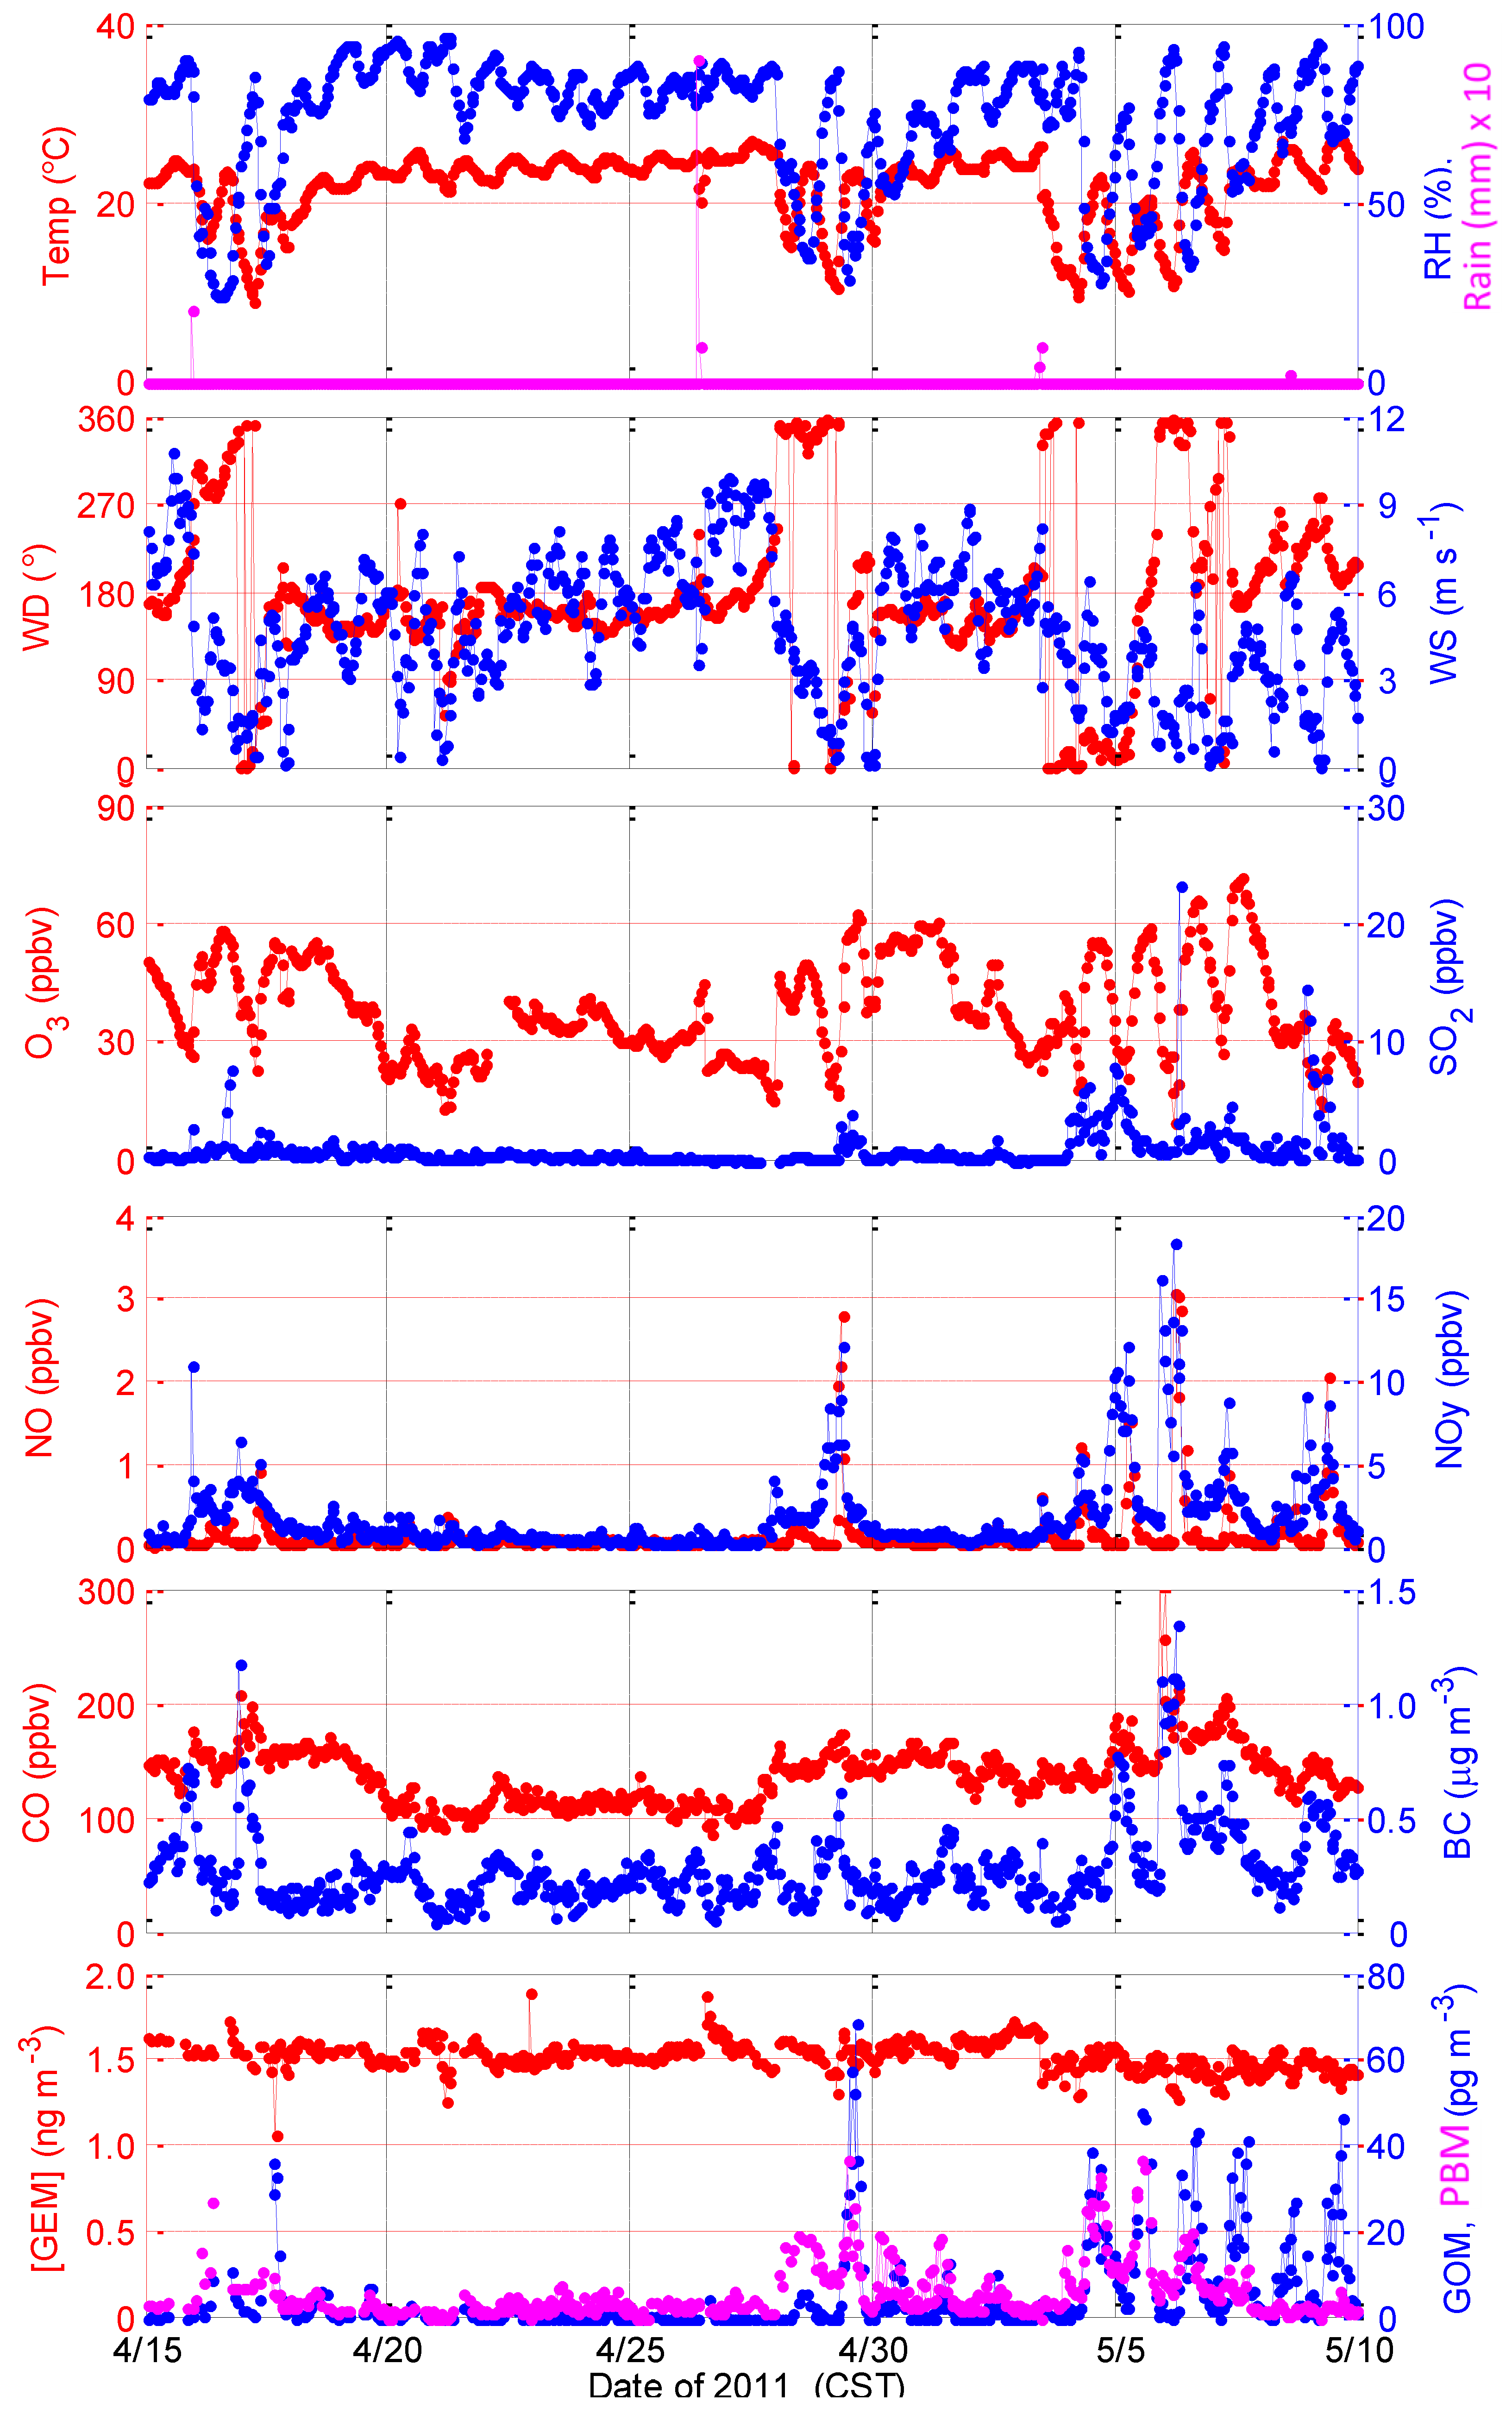
2.1.1. Intensive Study in Summer 2010

Meteorological conditions during the 2010 intensive study were intensely hot and humid but largely free of precipitation (Figure 2). In the beginning of the study period, a high-pressure system was dominant in the Gulf of Mexico. A high-pressure system with stagnant conditions can results in reactive photochemical oxidation at the site while a cold front passage can bring polluted air to the site, all of which can significantly affect the mercury observations at the site. On 2 August, as the high-pressure system relaxed a weak front was approaching the coast of Mississippi. Daytime peak temperatures ranged from 30 °C to 36 °C and nighttime minima were about 25 °C, while relative humidity ranged from 45% to 60% during mid-day and typically greater than 80%–90% overnight. Winds were commonly from northerly directions overnight and in the early morning, usually shifting to southerly-southwesterly during the day. Mid-day winds remained largely from the north from 29 July to 9 August, and were generally easterly-southeasterly toward the end of the intensive (10–12 August) as a tropical depression moved into the area, eventually passing to the south and west of the site. Wind speeds were light to moderate, with mid-day wind speeds ranging from 3 m∙s−1 to 5 m∙s−1. Precipitation events were recorded on 3 August, 7 August, 8 August, 11 August, and 12 August.
Table 1. Statistical summary of hourly measurements during the two intensives in summer 2010 (the first number in each cell) and spring 2011 (the second number in each cell).
ParameterMean ± StdMedianMaximumMinimum
[GEM] (ng∙m−3)1.42 ± 0.12, 1.53 ± 0.111.44, 1.531.70, 3.121.06, 1.07
[GOM] (ng∙m−3)5.4 ± 10.2, 5.3 ± 10.21.83, 0.970.8, 68.70.0, 0.0
[PBM] (ng∙m−3)3.1 ± 1.9, 5.7 ± 6.22.7, 3.28.8, 37.00.0, 0.0
Temperature (°C)29.4 ± 3.0, 21.9 ± 4.029.2, 23.436.3, 27.424.3, 8.9
Relative Humidity (%)75.1 ± 14.3, 73.9 ± 17.177.7, 79.597.2, 96.941.0, 23.6
Rain (mm, hour)0.12 ± 0.85, 0.023 ± 0.380, 010.2, 9.00, 0
Solar Radiation (W∙m−2)258 ± 328, 266 ± 33234, 451037, 9830, 0
Wind Speed (m∙s−1)2.2 ± 1.4, 4.7 ± 2.31.7, 4.86.5, 10.80.05, 0.02
[O3] (ppbv)34.5 ± 16.5, 38.4 ± 12.532.6, 36.691.0, 71.93.1, 9.5
[NO] (ppbv)0.24 ± ,0.43, 0.16 ± 0.320.08, 0.083.07, 3.060.028, 0.029
[NOy] (ppb)4.13 ± 2.63, 1.91 ± 2.363.64, 1.0318.2, 18.40.30, 0.22
[CO] (ppbv)155 ± 35, 139 ± 26156, 141267, 32172, 86
[Black Carbon] (μg∙m−3)0.40 ± 0.23, 0.28 ± 0.170.39, 0.241.59, 1.350.03, 0.05
Figure 2. Measurements of meteorological parameters, trace chemical pollutants, and mercury species during the Grand Bay Intensive in summer 2010.
Atmosphere 05 00230 g002
Concentrations of reactive nitrogen compounds (NO, NOY) typically peaked during the morning rush hour, when northerly flow transported mobile and stationary source emissions from upwind urban areas to the site. An interstate highway (I-10) and a state highway (Hwy 90) are located ~5 km to the north of the site. NO concentrations were typically less than 2 ppbv in the morning, decreasing to less than 0.2 ppbv during mid-day and to below the detection limit overnight. NOY concentrations decreased from about 6–10 ppbv during the morning rush hour (with occasional excursions to greater than 15 ppbv) to less than 5 ppbv at mid-day. Concentrations of CO and black carbon displayed similar behavior, with largest concentrations in the morning (150–250 ppbv for CO, 0.5–1.5 μg∙m−3 for black carbon) and lower levels at mid-day (100–150 ppbv for CO, 0.2–0.4 μg∙m−3 for black carbon). Under the clean easterly-southeasterly flow ahead of the tropical depression on 10–11 August, CO levels dropped to less than 100 ppbv, while NOY ranged from 1 ppbv to1.5 ppbv and black carbon levels were typically less than 0.1 μg∙m−3.
Concentrations of SO2 exhibited a very different behavior. These values were typically, but not always, low during the morning rush hour. Occasionally, the site was likely fumigated by specific upwind industrial sources (e.g., energy generating units or EGUs) to the west and southwest. In the absence of such plume impactions, however, SO2 in northerly flow was rather low. SO2 concentrations more often peaked during mid-day, when winds shifted from northerly to southwesterly. Such emissions may have come from the Chevron petroleum refinery plant located approximately 10 km to the southwest of the site.
Concentrations of GEM typically ranged from 1 ng∙m−3 to 1.7 ng∙m−3 at standard conditions (i.e., 0 °C and 1 atm) with an average of 1.42 ng∙m−3 and a standard deviation of 0.12 ng∙m−3 during the intensive and occasionally reached very low concentrations (approximately 1 ng∙m−3) in the early morning hours. GEM exhibited little dependence on wind direction, and no discernible diurnal pattern, which is consistent with observations at a few other sites in the region [14]. GOM concentrations were below the detection limit at night, only a few pg∙m−3 in the morning hours, and peaked typically around 10–20 pg∙m−3 by midday. The mean GOM concentration for the entire 2010 intensive was 5.4 pg∙m−3 with a standard deviation of 10.2 pg∙m−3. Much higher mid-day peaks in the range of 20–60 pg∙m−3 were observed on 2, 4, 5, 6, and 7 August. Highest concentrations were observed in winds from 190 to 330 degrees (south/southwest to north/northwest. Concentrations of particulate-bound mercury (PBM) were low, ranging from 4 pg∙m−3to 8 pg∙m−3 at mid-day with a mean concentration of 3.1 pg∙m−3 and a standard deviation of 1.9 pg∙m−3 for the entire 2010 intensive.
Interestingly, on 4–6 August 2010, a decrease of GEM (from ~1.4 to 1.1–1.2 ng∙m−3) was observed in the morning followed by GOM peaks in the afternoon. Similar behavior was observed on a few days during the spring intensive study in 2011, as discussed in Section 2.1.2.

2.1.2. Intensive in Spring 2011

During the 2011 intensive study, meteorological conditions were typical for spring with mild temperatures and infrequent precipitation during most of the study. Frontal activity was confined largely to the north of the Grand Bay region so the site area was dominated by southerly flows (Figure 3). Under southerly flow, temperatures ranged from 20 °C to 25 °C with little variations from day to day or over the diurnal cycle. On 16 April, 28 April, and 3 May, cold fronts passed through the region, bringing continental cold air masses to the monitoring station. Those days experienced typical post-frontal conditions—dry air, low night-time temperatures, and light northeasterly winds in the morning with southerly sea breezes in the afternoon. Wind speeds ranged from 0 m∙s−1to 10 m∙s−1. Precipitation events were observed on 16 April, 26 April, and 3 May. Temperature dropped to as low as 10 °C after the cold front passage on 3 May.
The average GEM concentration during the 2011 intensive was 1.53 ng∙m−3 with a standard deviation of 0.11 ng∙m−3, which is slightly higher than values measured during the summer 2010 intensive and can be explained by the seasonal variations as observed by some other studies in the region [12,14]. GEM exhibited little variation with no distinct dependence on wind direction. The mean concentration of GOM was 5.3 pg∙m−3 with a standard deviation of 10.2 pg∙m−3. Elevated GOM levels were observed on 17 April, 29 April and 4–9 May, with peak values in a range of 30–70 pg∙m−3 (Figure 3). The mean concentration of PBM was 5.7 pg∙m−3 with a standard deviation of 6.2 pg∙m−3 for the entire spring 2011 intensive.
Figure 3. Measurements of meteorological parameters, trace chemical pollutants, and mercury species during the Grand Bay Intensive in spring 2011.
Atmosphere 05 00230 g003
One interesting point to note is the period after 3 May when GEM dropped suddenly from ~1.6 to 1.4 ng∙m−3 and remained lower while GOM and PBM were high for the next few days. At the same time, NOy, CO, BC, SO2, and NO were also enhanced during this period. It seems that both enhanced transport of pollution and more active photochemistry were observed during this period. We note that on 3 May, the wind shifted from south to north at the same time when GEM concentration dropped and it rained for a few hours. It is most likely that an air mass change behind the cold front is responsible for the change in GEM concentration.
Similar to our observations in summer 2010, a decrease of GEM in the morning followed by a GOM peak in the afternoon was observed on 17 April, 29 April, and, to a lesser extent, on 4–7 May. The reasons for this GEM decrease are not clear and require more investigation. Similar GEM decrease events have been observed in middle latitude regions [12,15,16]. For example, [16] found nearly 100% depletion of GEM, suggesting that the residence time of GEM can be as short as hours to days under those conditions [16]. The GEM depletion events in the two intensive studies were usually associated with high relative humidity. Similar to what was observed by [16], the GEM decreases we observed are not accompanied by simultaneous depletion of ozone, which distinguishes them from the halogen driven atmospheric mercury depletion events (AMDEs) observed in polar regions [17,18] and other areas [19]. We also found that the decrease of GEM we observed occurred typically in the morning before sunrise when relative humidity was typically the highest of the day, which is consistent with observations of [12] and [14], but different from the afternoon events observed by [16]. We suspect that heterogeneous processes might be responsible for the decrease of GEM we observed and additional measurements of possible mercury oxidants are hence called for to reveal the chemical mechanism to assess its importance on larger scales. Similar GEM depletion events have also been observed at a suburban site in the mid-Atlantic US [20].
Concentrations of reactive nitrogen compounds (NO and NOY), CO, SO2, and black carbon were generally low from 18 April to 27 April and from 30 April to 3 May, when southerly winds dominated and brought clean marine air masses to the site. During frontal passage periods when the wind shifted from southerly to northerly, transport of mobile and stationary source emissions from upwind urban areas to the site occurred, with hourly averaged NOY concentrations from a few ppbv up to 18 ppbv, and SO2 concentrations from a few ppbv up to 23 ppbv, and elevated CO concentration up to 320 ppbv.
Figure 4. (Left) Time series of GEM and altitude during the flight on 6 August 2010. (Right) vertical profiles of aircraft GEM concentration and ozonesonde data, including ozone, relative humidity, and temperature. The ozonesonde was launched at 10:55 CST on 6 August 2010.
Atmosphere 05 00230 g004

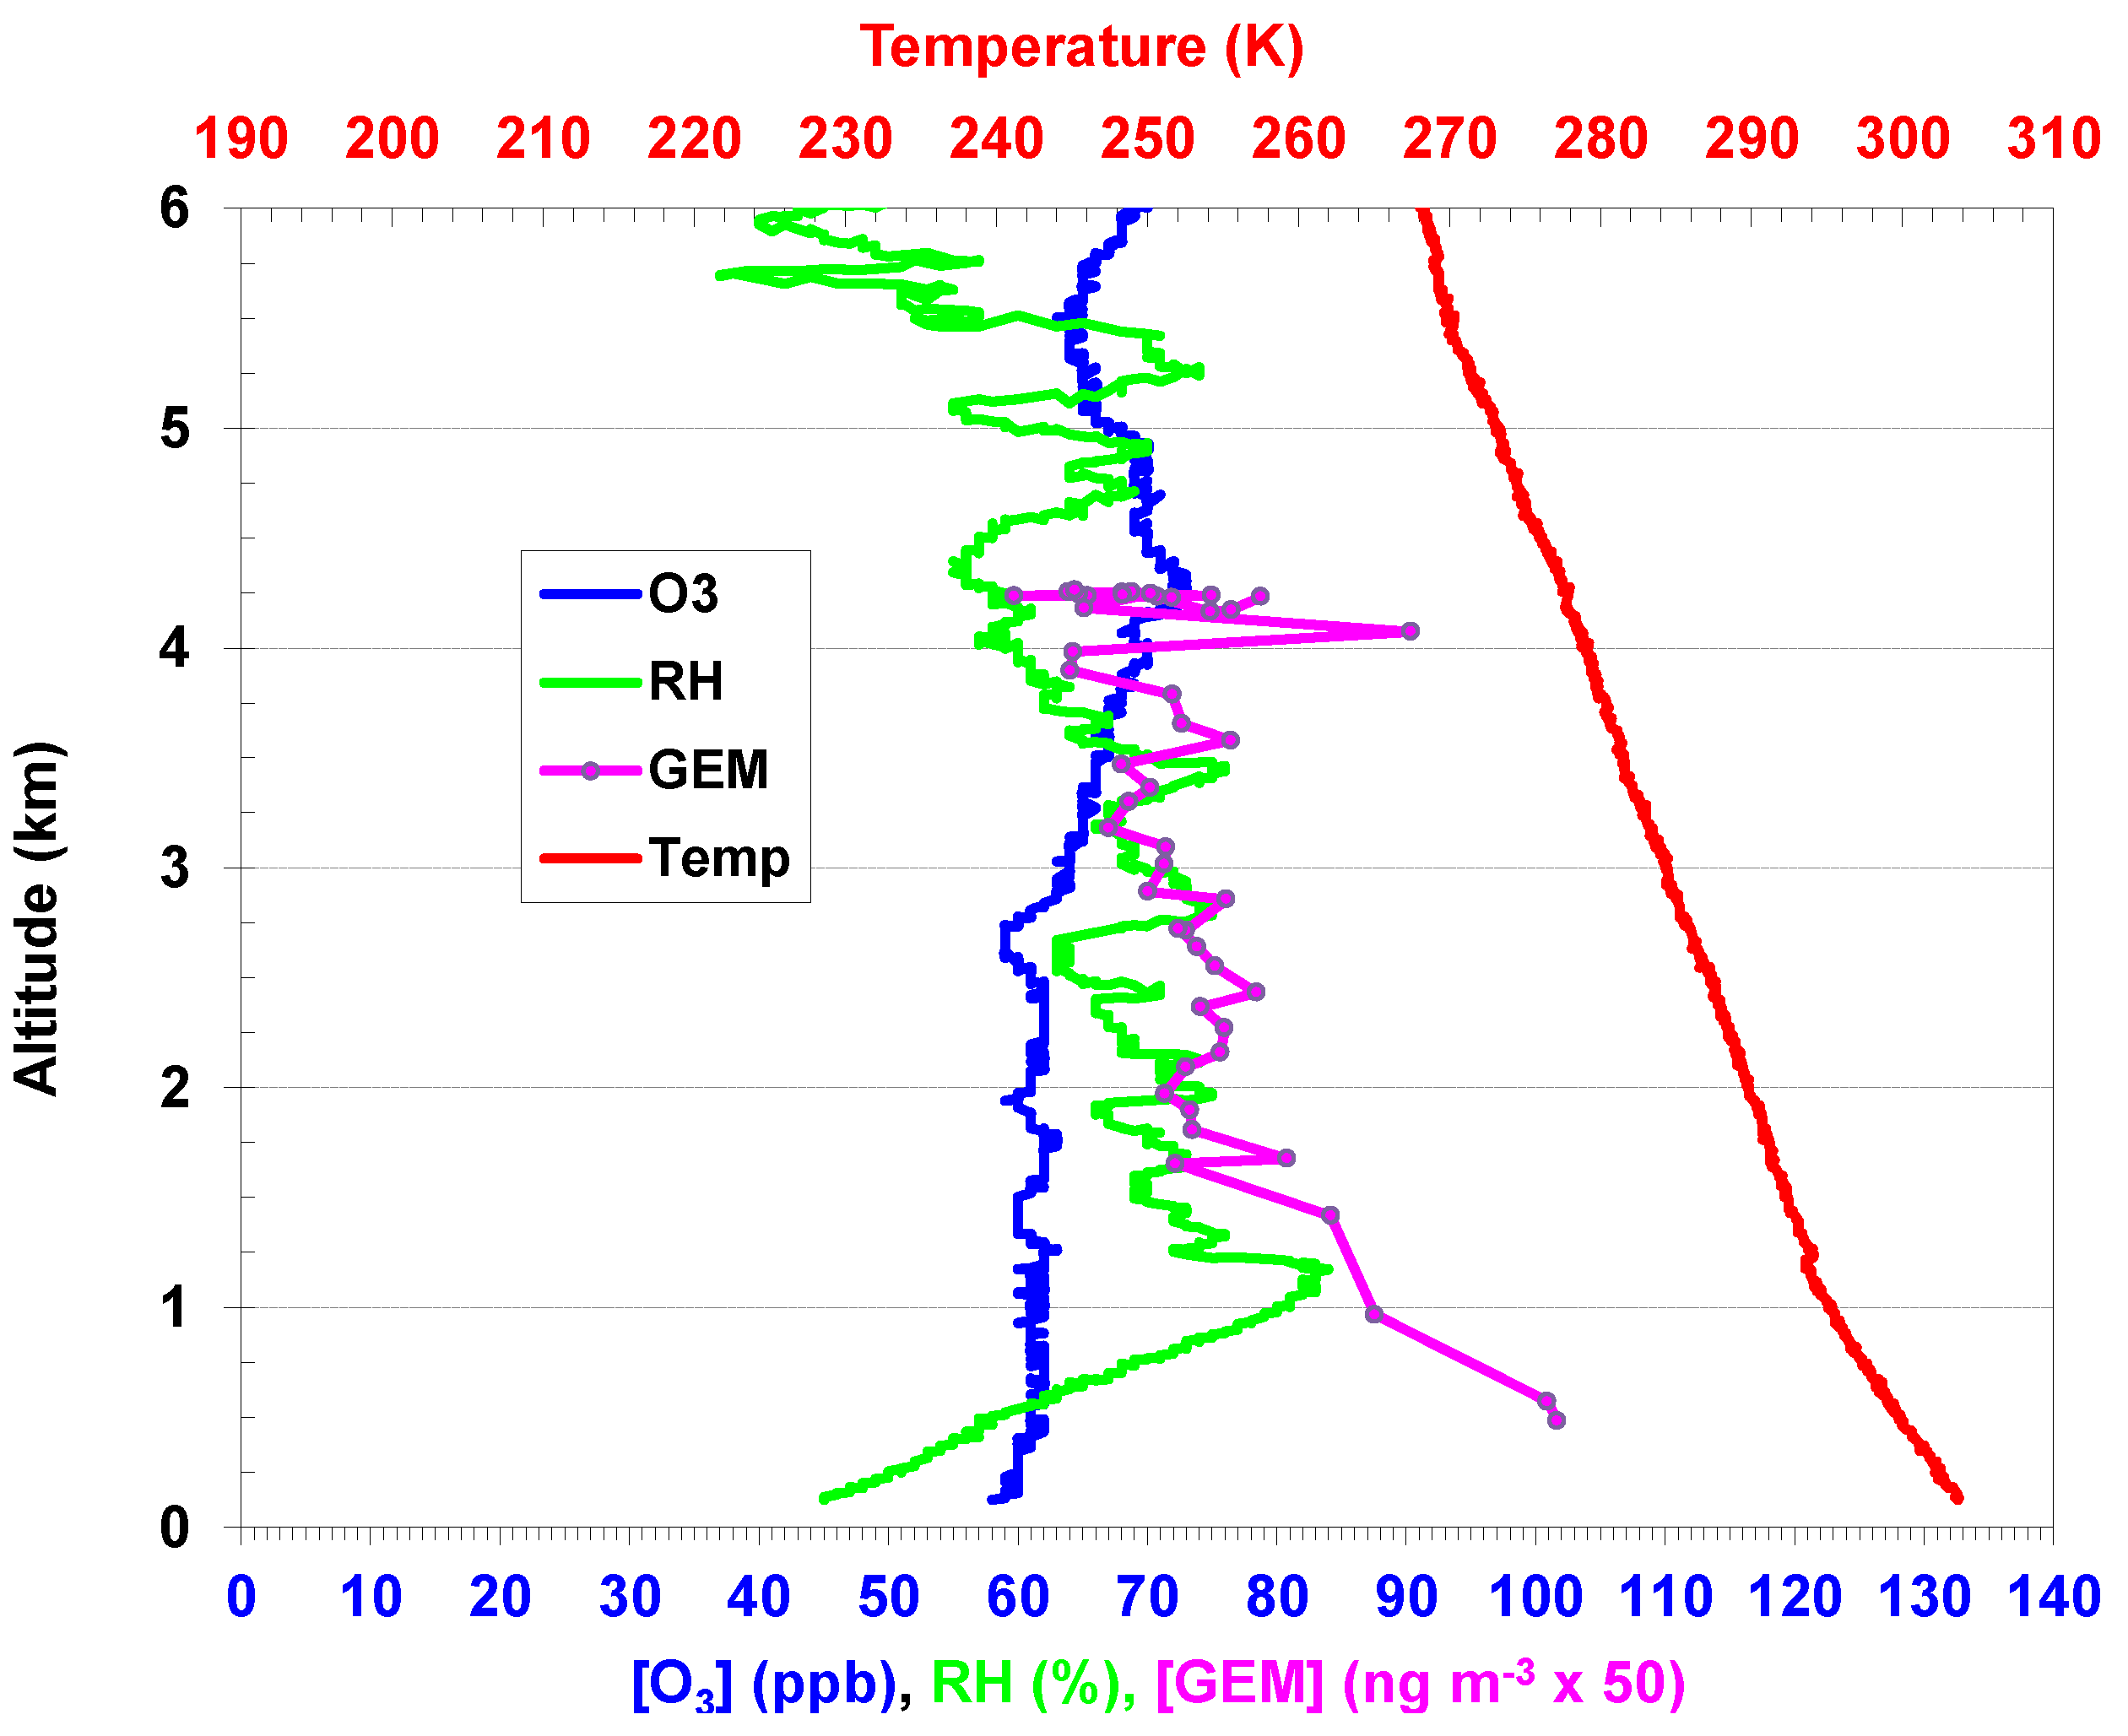
2.2. Aircraft and Ozonesonde Measurements

Vertical profiles of GEM, GOM, ozone, SO2, and condensation nuclei (CN) were measured during four flights in the summer 2010 study and 11 flights in the spring 2011 study. Details of these measurements will be presented elsewhere (Hynes et al., manuscript in preparation). Figure 4 shows an example of the aircraft GEM measurement as well as ozonesonde data on 6 August 2010. In the free troposphere between 2 km and 4 km, GEM concentrations were relatively constant, ranging between 1.3 ng∙m−3 and 1.5 ng∙m−3. GEM concentrations increased from ~1.5 to 2 ng∙m−3 when the airplane flew into the mixing layer with its top height of about 1.5 km. A high-pressure system with stagnant conditions (low wind speeds of 0–10 m∙s−1 from surface to ~10 km) was dominant in the area on this day after a weak cold front passage on 2 August. The ozonesonde was launched at 10:55 Central Standard Time (CST) on this day and it indicated the mixing layer height was about 1.3 km. A slightly higher mixing layer was observed by the aircraft about an hour later during its descent prior to landing, indicating the mixing layer was still rising in height and did not reach its maximum until around 13:00–14:00 CST in this area.

2.3. Correlation between Mercury Species and Ancillary Measurements

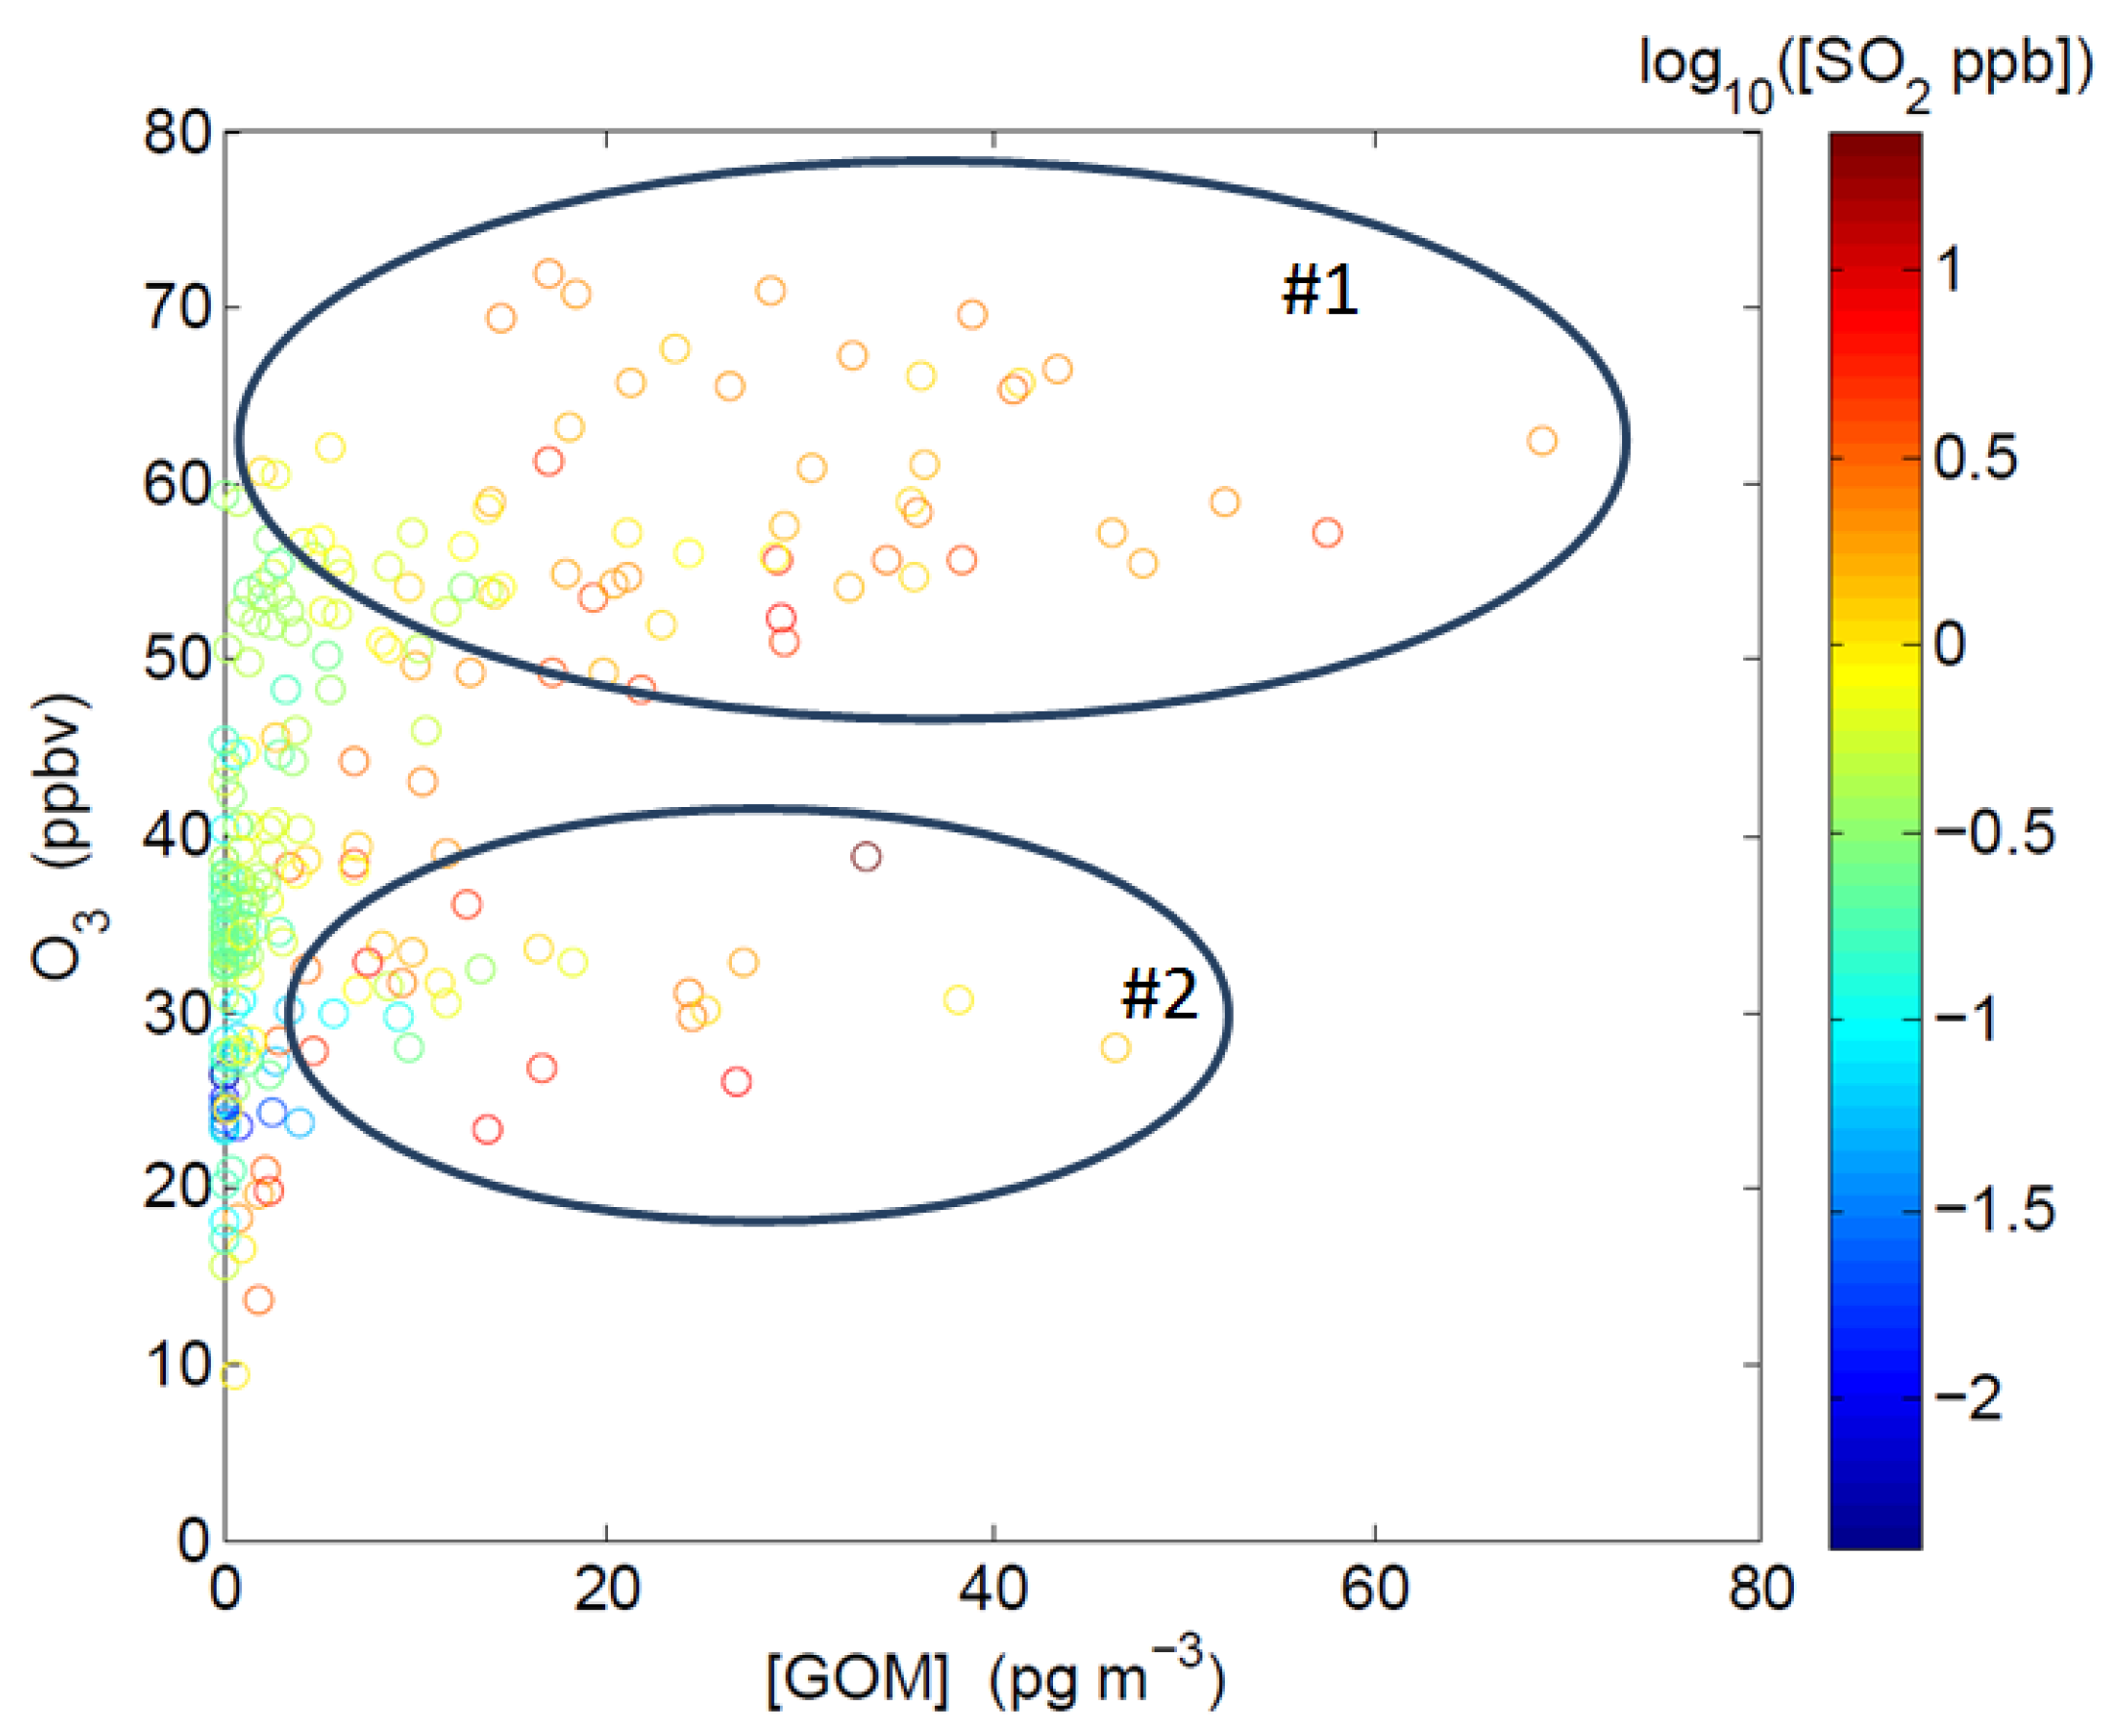
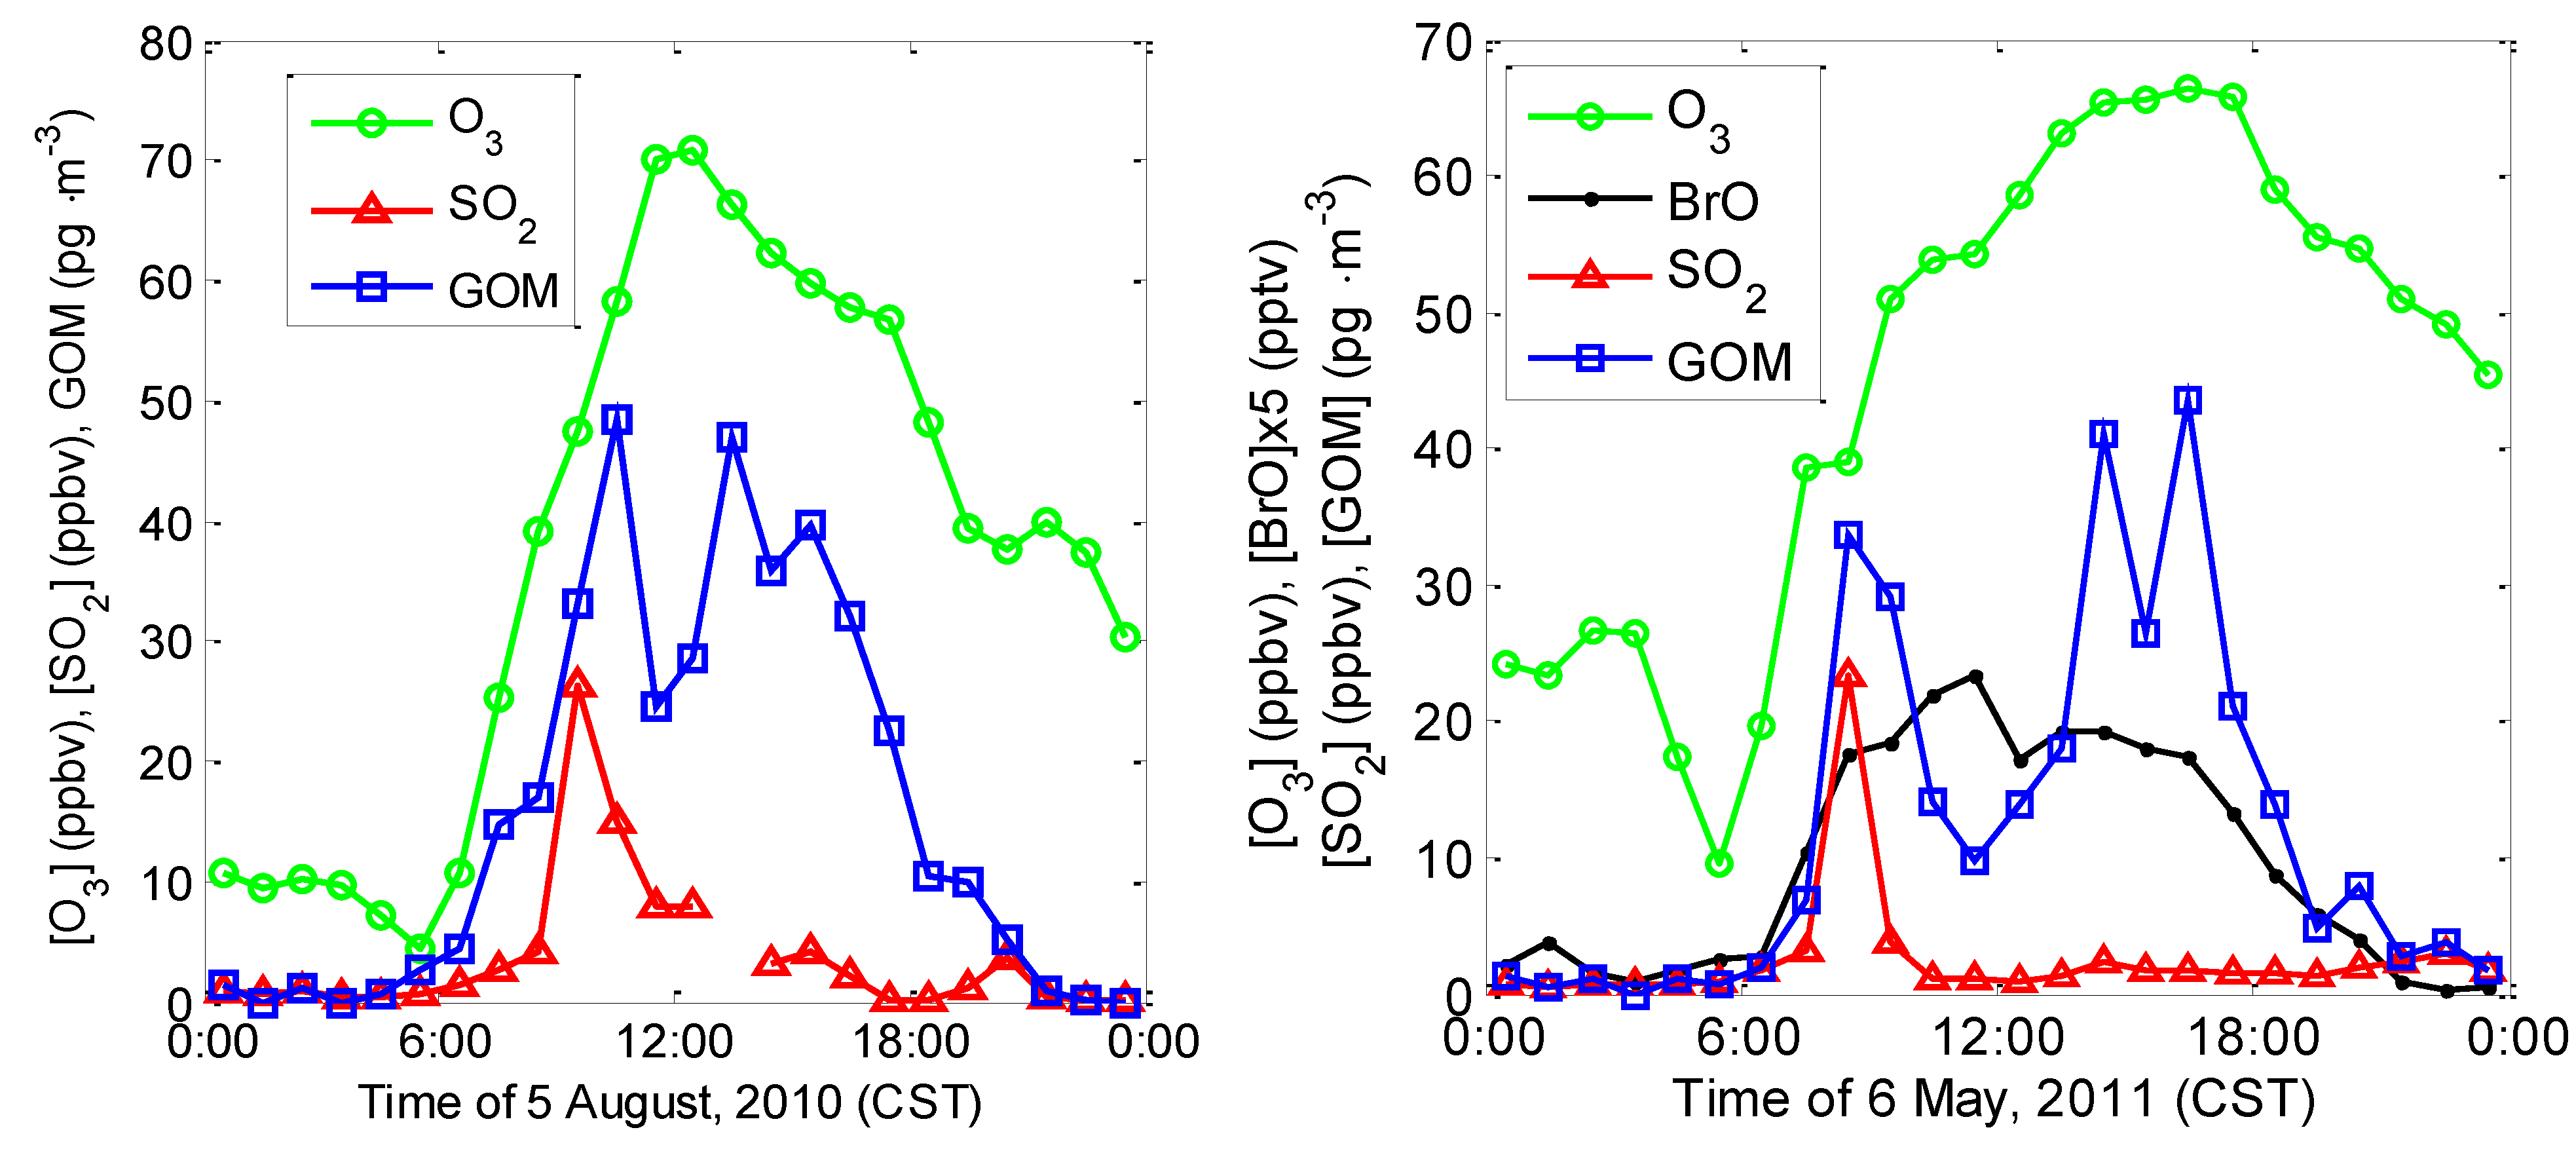
2.3.1. Correlation among GOM, O3, SO2, and BrO

Results from the spring 2011 intensive study show that elevated GOM values during the day were usually associated with two different sets of chemical and physical conditions, as shown by two groups of data points in Figure 5. For the data points in Group #1, GOM concentrations are positively correlated with O3 in air masses associated with high O3 levels (>50 ppbv) and high solar radiation (>500 W∙m−2). Lower O3 levels (20–40 ppbv) but elevated SO2 levels (> a few ppbv) were observed for the data points in Group #2. Similar correlations between GOM and O3/SO2 have been observed in two previous studies in the Gulf of Mexico region [12,14]. This is consistent with two possible processes that could lead to elevated GOM levels: (1) photochemical conversion of GEM under conditions when ozone levels are high during the midday, and (2) direct emissions of GOM from local emission sources in which high SO2 levels were present.
Figure 5. Hourly averaged ozone versus GOM color-coded with log10([SO2]) during daytime in the spring 2011 intensive.
Atmosphere 05 00230 g005
The diurnal variations of GOM, ozone, and SO2 can also be used to differentiate between direct emissions (with narrow plumes of SO2 and GOM fumigating the site, leading to short-term spikes) and photochemistry (with longer term increases during midday), for example, on 5 August 2010 around 9:30 CST, simultaneous SO2 and GOM spikes were observed (Figure 6). After 10:30 CST, the SO2 level decreased sharply and remained low for the remainder of the day. GOM dropped from a peak after 10:30 CST, but increased again after 11:30 CST and remained elevated for the rest of the day before decreasing in the late afternoon and early evening. Similar variations of SO2, GOM, BrO, and ozone levels were also observed on 6 May 2011 (Figure 6). Even though we cannot completely rule out transport from regional emissions as a source of GOM during the afternoon periods on these two days, these emissions would have to be large and widespread to produce GOM perturbations of the observed duration and amplitude, and by inference over a broadly diluted plume if regional sources are significantly involved. This suggests that the two different GOM production processes (i.e., direct emissions and photochemical oxidation) can happen on the same day under certain conditions at this site.
Figure 6. Diurnal variations of ozone, SO2, and GOM observed on 5 August 2010 (Left) and 5 May 2011 (Right).
Atmosphere 05 00230 g006
Figure 7. Wind rose plots for GOM with [GOM] > 2 pg∙m−3 (Left) and SO2 with [SO2] > 1 ppbv (Right) during the summer 2010 campaign.
Atmosphere 05 00230 g007
Enhanced levels of GOM (~60–80 pg∙m−3) and SO2 (~20–30 ppbv) were also observed in winds from the west and southwest, as shown by the wind rose plots in Figure 7, further confirming intermittent sources of SO2 and GOM shown in Figure 6 from the nearby petroleum refinery located in Pascagoula, Mississippi, ~10 km to the southwest of the monitoring site. The slightly elevated SO2 and GOM levels are most likely due to source emissions, e.g., from the coal-fired power plant (Daniel) (Figure 1) located to the northwest of the site.

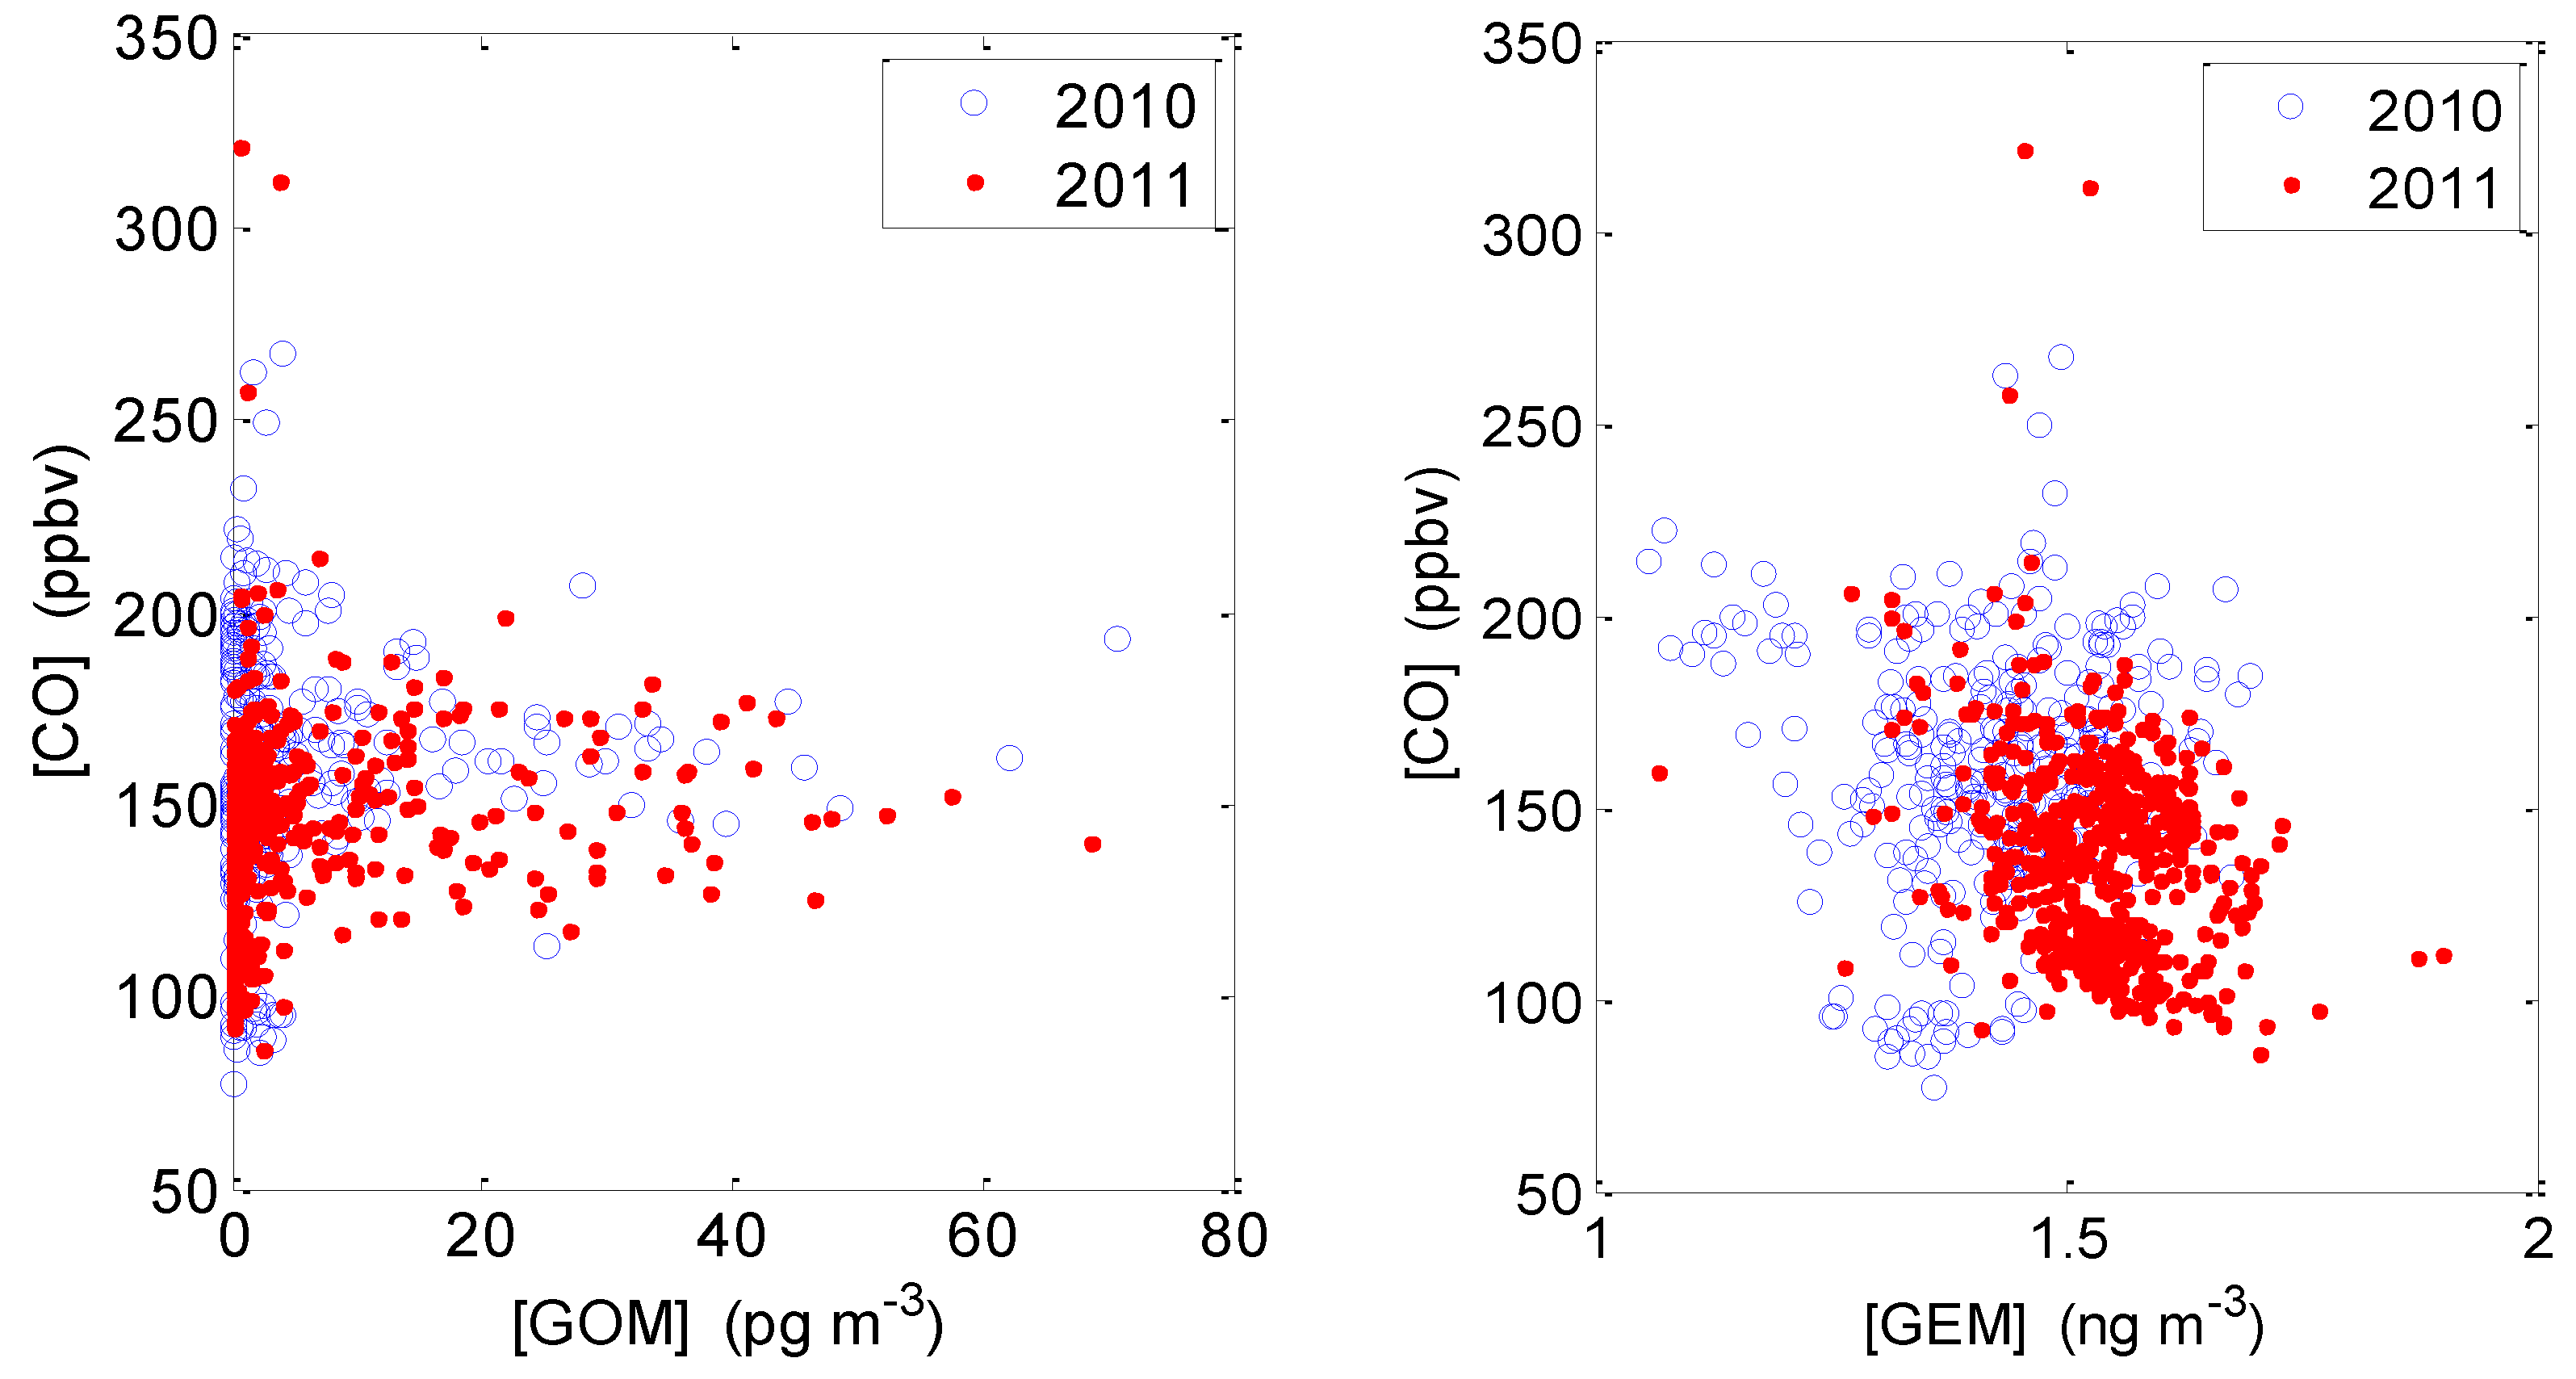
2.3.2. Correlation between GOM/GEM and CO

Correlation between GOM and CO in both studies reveals that the highest GOM levels were observed in air masses with CO concentrations centered at ~150 ppbv (Figure 8). This indicates that the high GOM levels observed during the studies likely existed in air masses associated with continental emissions, as opposed to marine-associated air masses, where CO concentrations are usually close to or below ~100 ppbv. It is possible that any GOM produced in marine air would be quickly deposited to the ocean surface or adsorbed onto sea salt aerosols. This is consistent with elevated PBM concentrations observed in the air masses transported from south during the spring 2011 intensive. It is also interesting to note that GOM concentrations were low in the strongest CO plumes, typically encountered in the early morning or at night when solar radiation was close to zero and photochemical processes were not active.
Figure 8. Correlation between CO and GOM (Left) and between CO and GEM (Right) during the summer 2010 intensive (blue circles) and the spring 2011 intensive (red dots).
Atmosphere 05 00230 g008
No significant correlation between CO and GEM was observed in either of the intensive studies (Figure 8), indicating that vehicle emissions are not a significant source of GEM. In addition, lower GEM concentrations were observed in summer 2010 than in spring 2011 (Figure 8). This is consistent with the seasonal GEM variation at most sites of northern mid-latitudes (e.g., [14]).

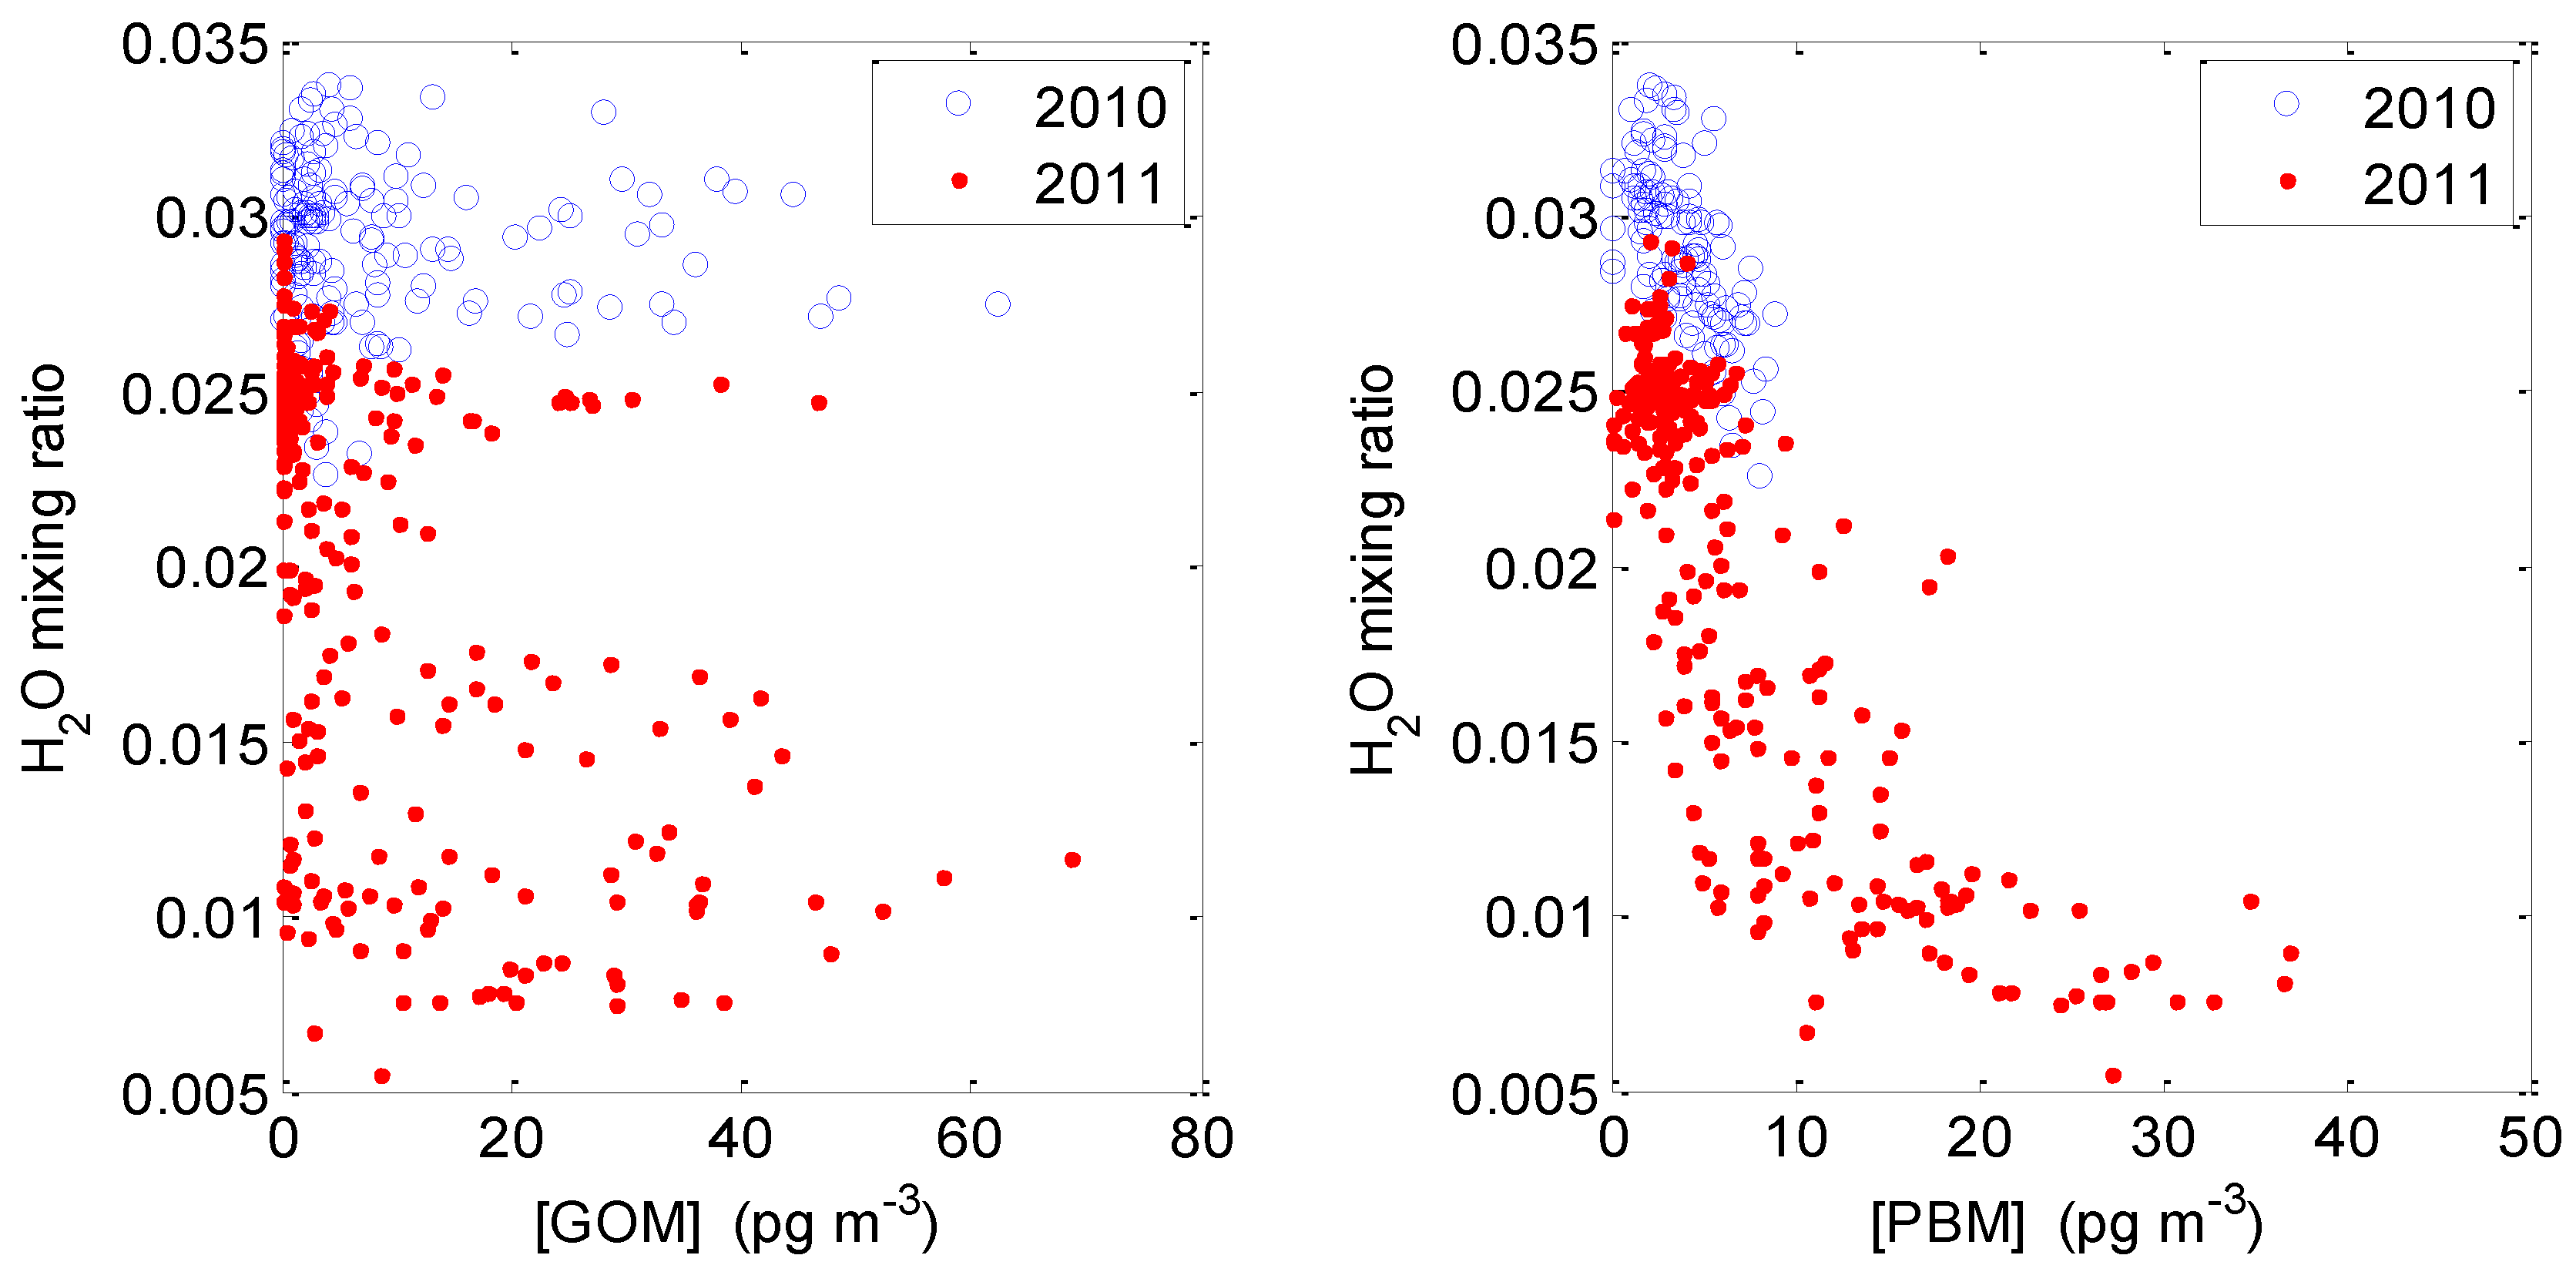
2.3.3. GOM/PBM and Humidity

Strong negative correlation between absolute humidity (water volume mixing ratio) and GOM or PBM was observed in both the 2010 and 2011 intensive studies (Figure 9), with better correlation for PBM than for GOM, especially in spring 2011 (e.g., water volume mixing ratio versus PBM: r2 = 0.63, (n = 332) for the spring 2011 intensive). We use water volume mixing ratio rather than relative humidity (RH) as the latter is influenced by temp: even at similar water volume mixing ratio RH sometimes approached 100% simply because of lower temperatures in the early morning. This indicates high moisture in the air could scavenge both GOM and PBM into particles or the ground surfaces in this environment. During the 2010 intensive the water volume mixing ratio stayed greater than 2%, the correlation between GOM and humidity was poor. Significant negative correlation was also found at two different sites in the same region [14].
Figure 9. (Left) hourly averaged water volume mixing ratio versus GOM concentration during the 2010 intensive (blue circles) and the 2011 intensive (red dots). (Right) hourly averaged water volume mixing ratio versus PBM concentration during the 2010 intensive (blue circles) and the 2011 intensive (red dots). Data collected during the day with solar radiation greater than 10 W∙m−2 are plotted.
Atmosphere 05 00230 g009

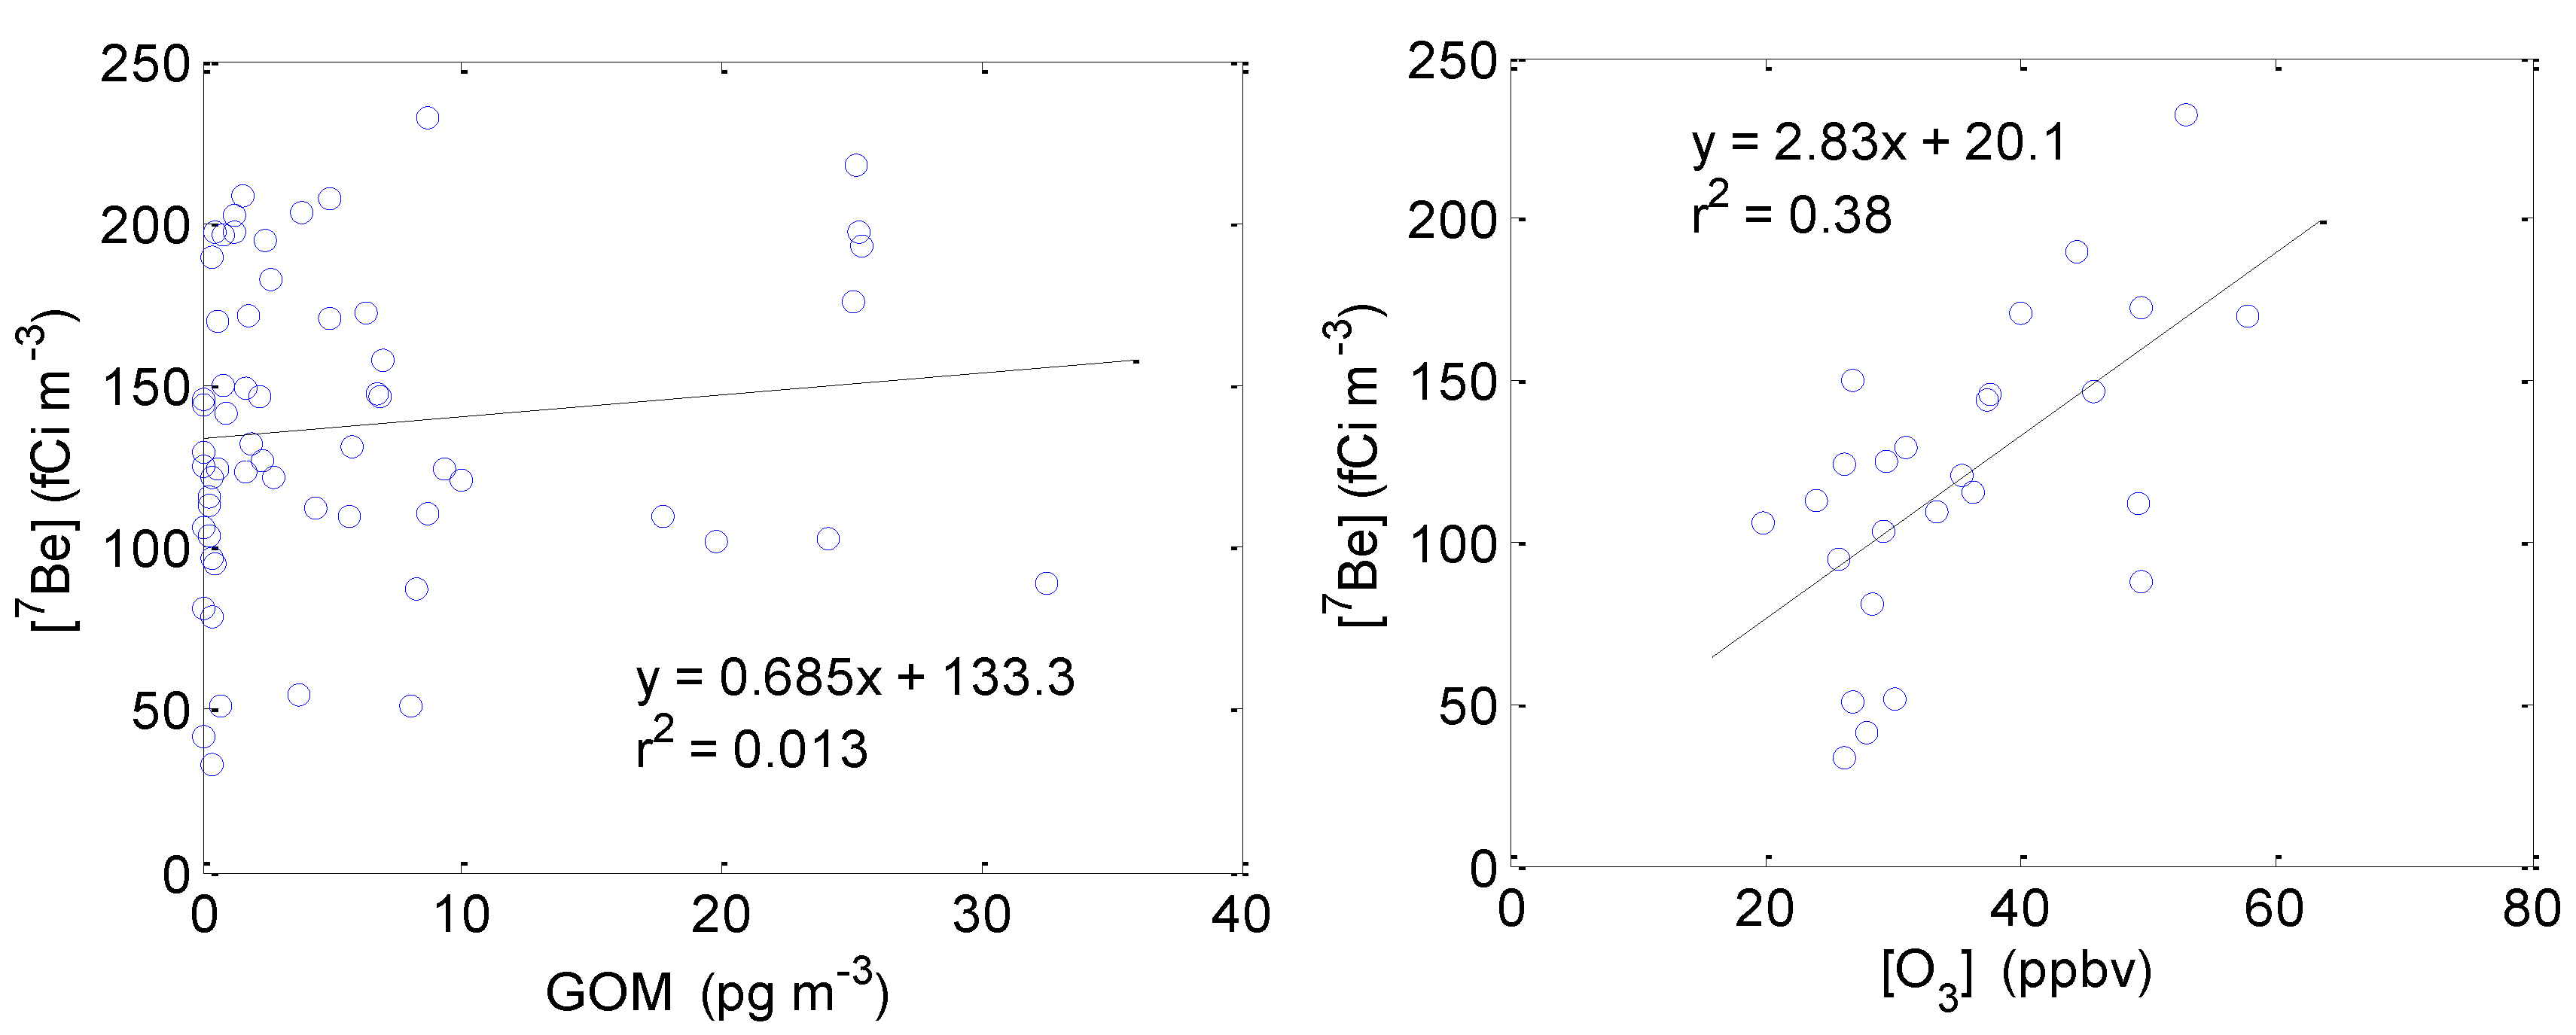
2.3.4. Correlation between GOM/Ozone and Beryllium-7

Beryllium-7 (7Be) is a cosmogenic radionuclide produced by spallation reactions of cosmic rays with N2 and O2. Because 7Be is predominantly produced in the stratosphere and upper troposphere and high levels of GOM can be produced via oxidation of GEM in the upper troposphere and observed at some high elevation sites (e.g., [21]), it is reasonable to assume that high concentrations GOM and 7Be observed at the surface may be due in part to transport from the upper troposphere and lower stratosphere.
It was surprising to find that there was little correlation between GOM and Beryllium-7 (7Be) when the data plotted for the entire spring 2011 intensive (Figure 10) or considered only during post-frontal passage periods. HYSPLIT back trajectories suggest that downward mixing occurred during these post-frontal passage periods, with air masses transported from 2 km to 3 km to surface within a course of 2–3 days. This indicates that the downward mixing of air masses from aloft possibly with high GOM levels had little influence on surface GOM concentrations, although we did observe a slight positive correlation (r2 = 0.38, n = 26) between O3 and 7Be during the nighttime (Figure 9), which may indicate a common source (i.e., transport from the upper troposphere) for ozone and 7Be. While 7Be can be considered to be a stratospheric tracer [22,23], many studies have found that surface 7Be concentrations can be highly affected by local meteorological variables and solar activities given the special characteristics of different sample sites [24,25]. Rain/washout is one of the reasons to complicate the GOM levels in the atmosphere and partially responsible for the poor correlation between GOM and 7Be.
Figure 10. Correlation between 7Be and GOM for the entire study (Left) and between 7Be and ozone for nighttime periods when the solar radiation was less than 200 W∙m−2 (Right) during the spring 2011 intensive. Hourly GOM and ozone measurements were averaged based on the time periods when 7Be samples were collected.
Atmosphere 05 00230 g010

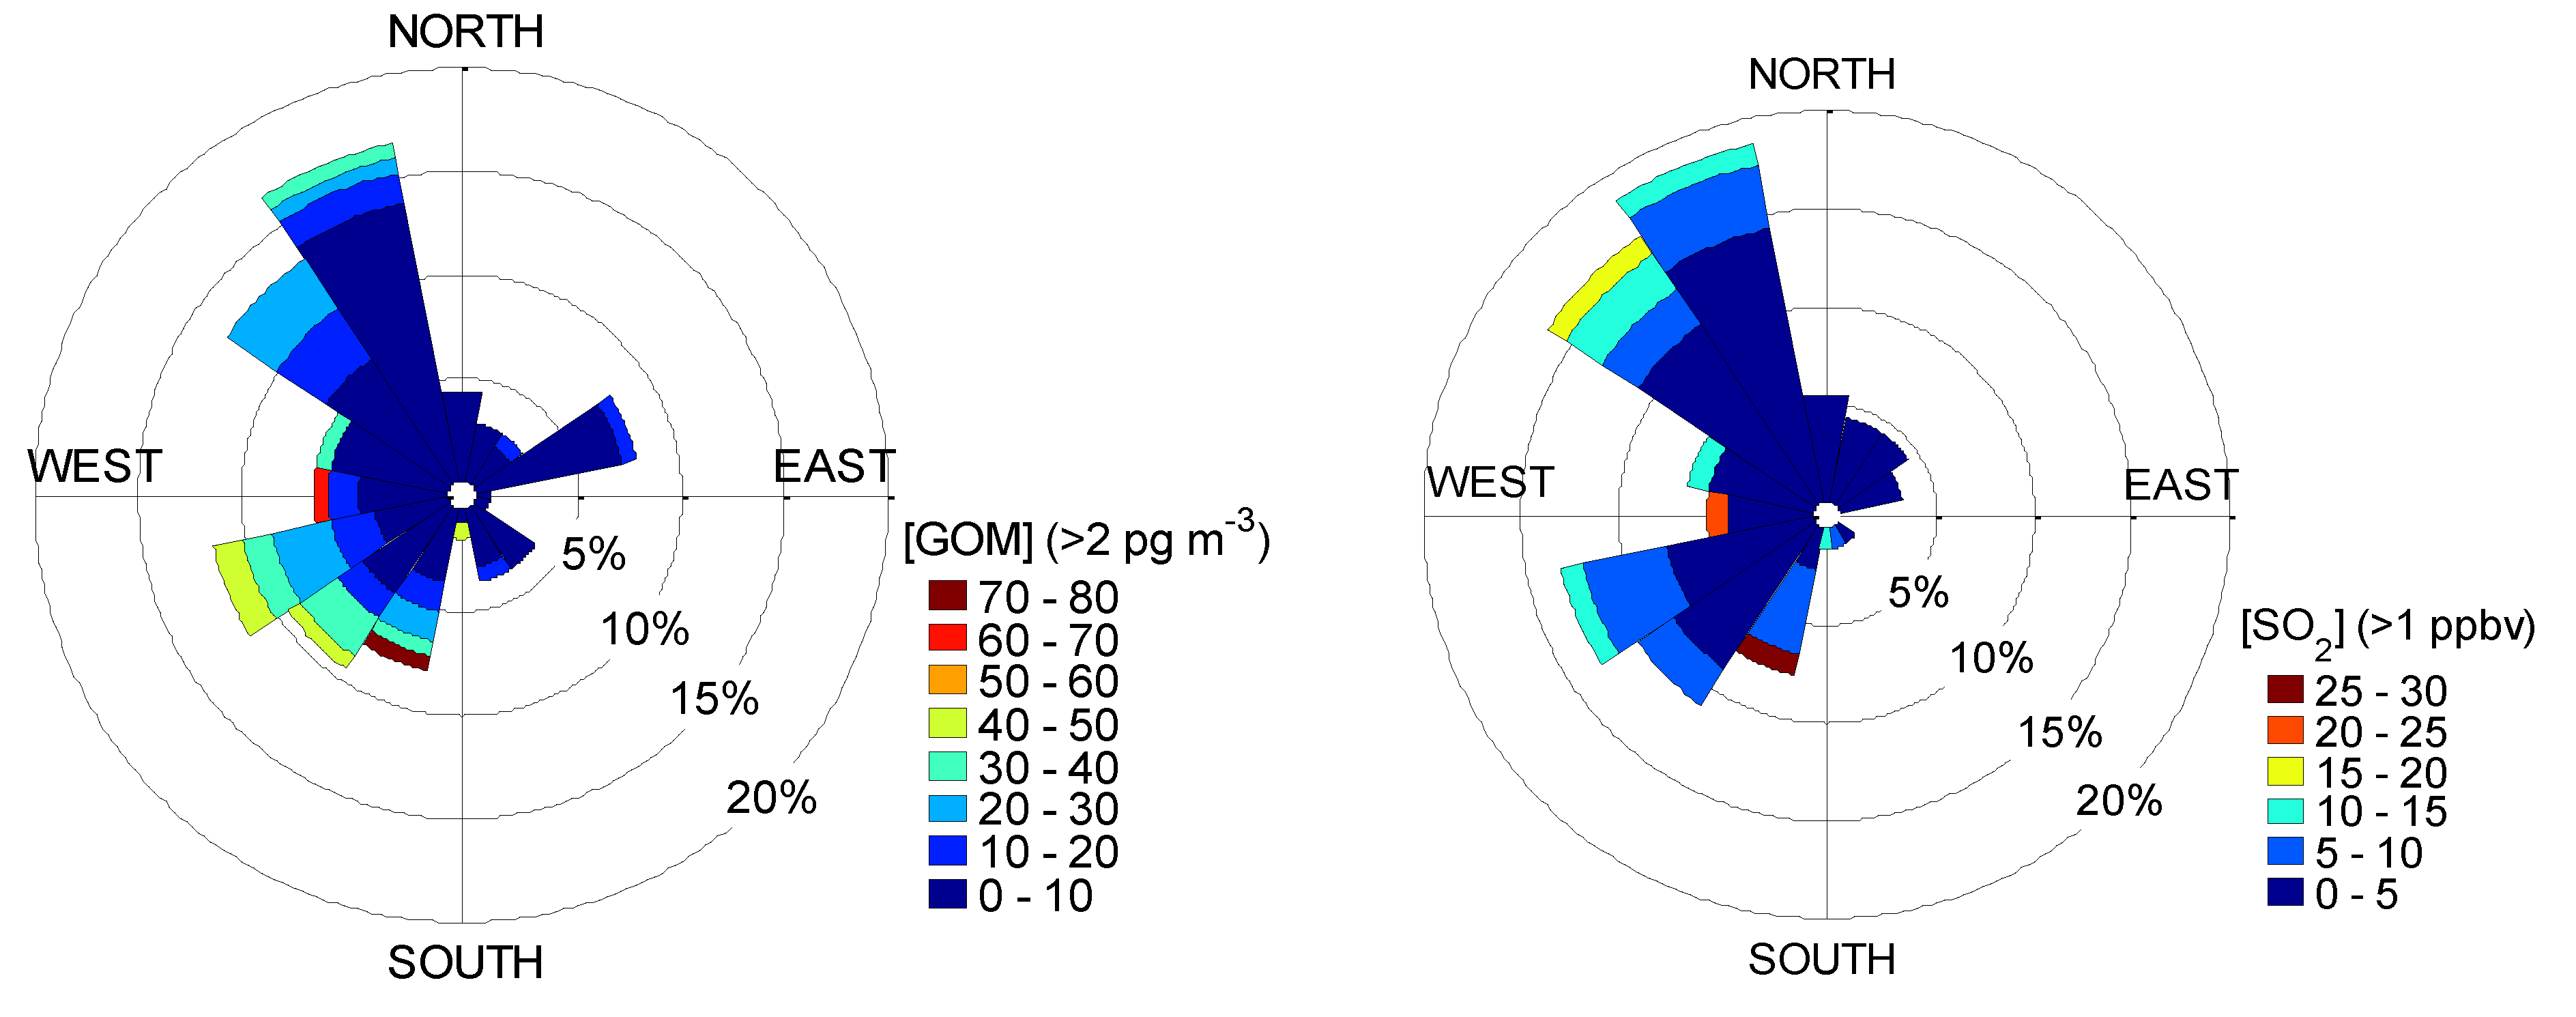
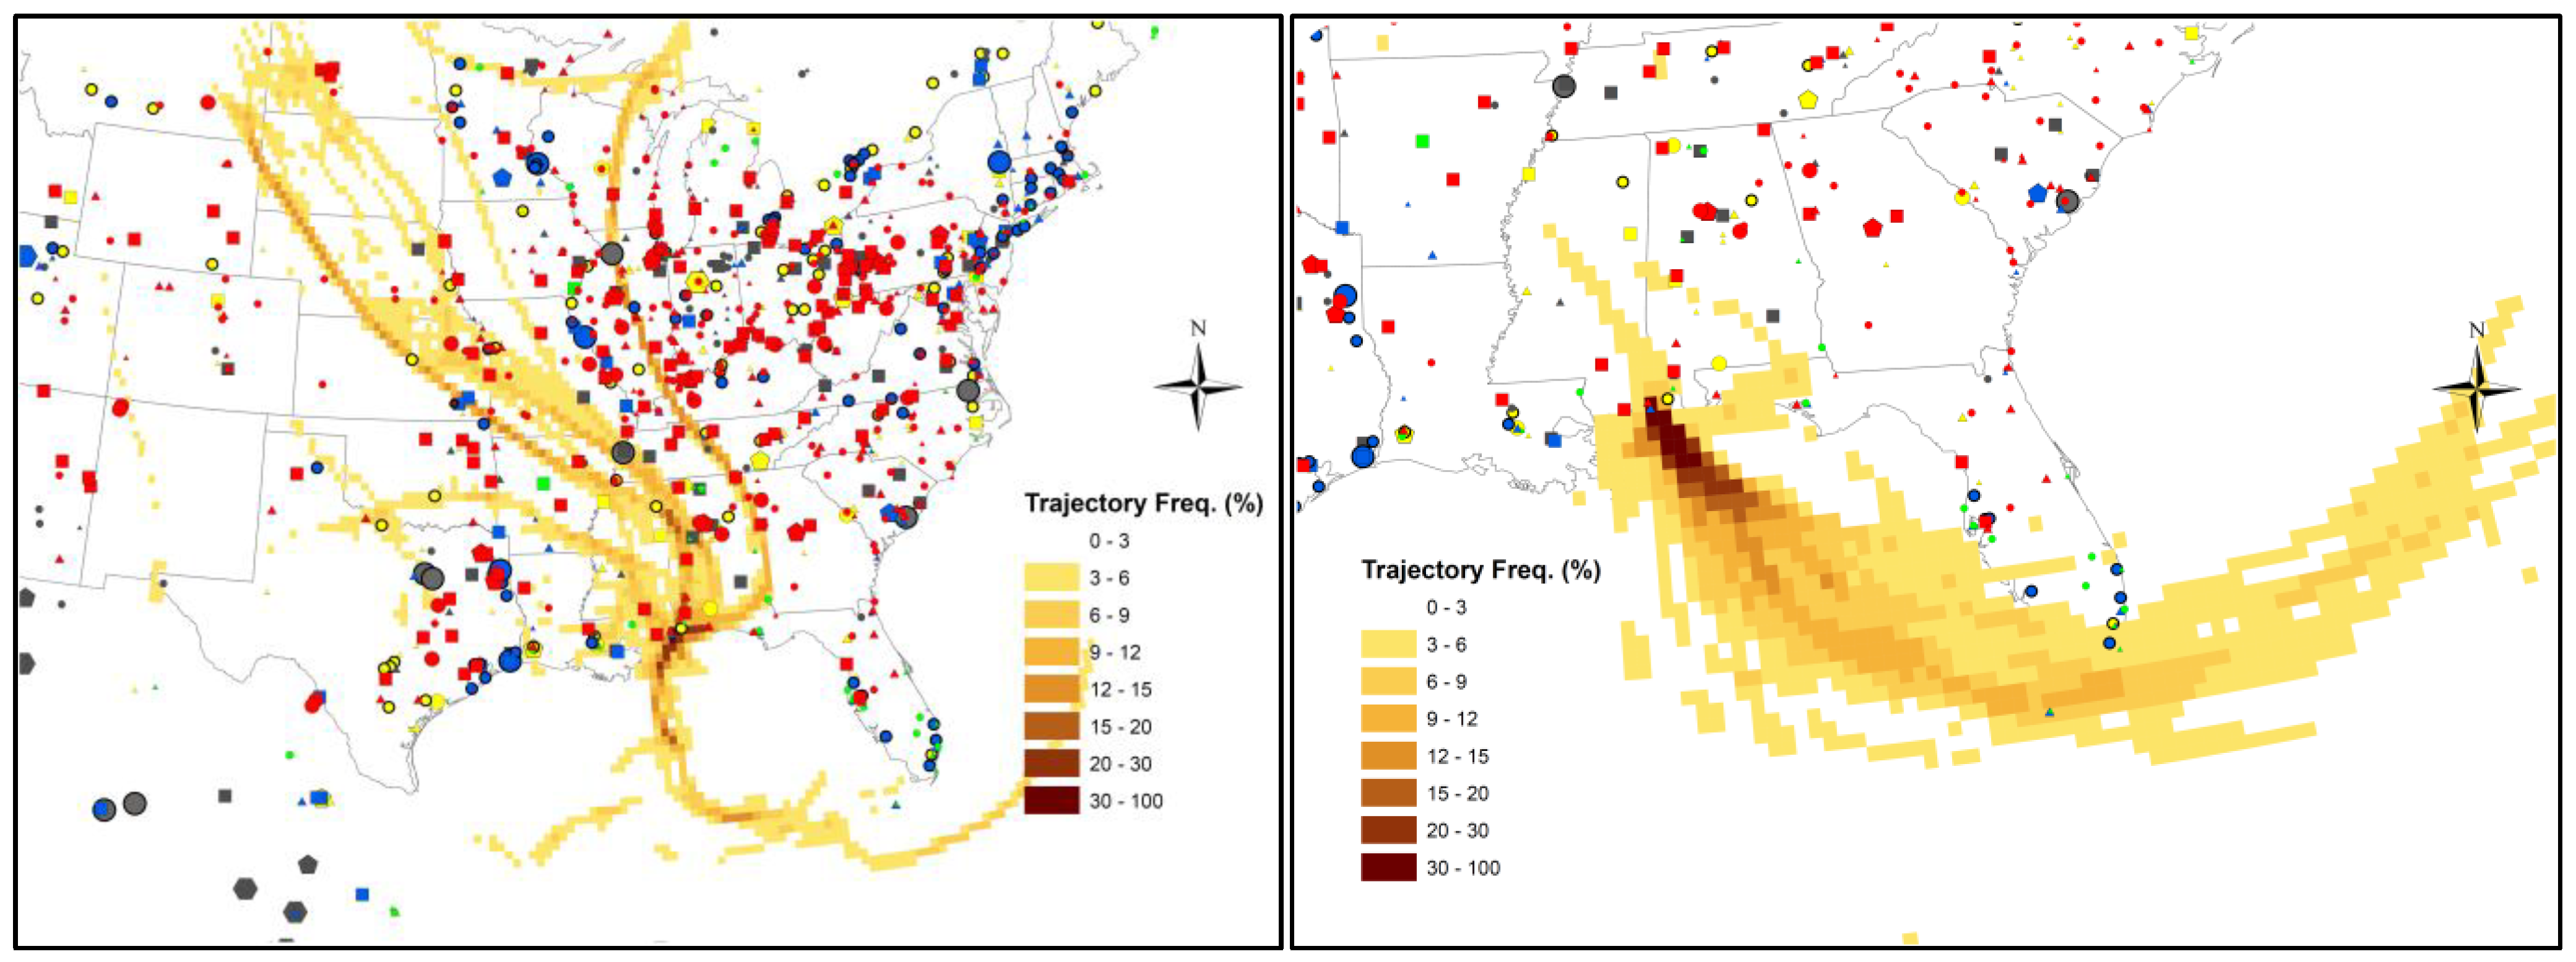
2.4. Back Trajectory Frequency Analysis

In spring 2011, trajectory frequency analysis shows that periods with [GOM] < 2 pg∙m−3 were largely associated with air masses coming from Gulf of Mexico (southeasterly), while events with [GOM] > 20 pg∙m−3 were typically associated with frequent transport passing over the areas with high mercury emissions, mainly from power plants (Figure 11). A similar signature of back trajectory frequency was observed in Hg isotopes observed during the spring 2011 intensive [26]. Trajectory frequency analysis was also conducted for the summer 2010 intensive, but no clear trends arose, possibly due to stagnant conditions and variable light winds during this study. There were only a few short periods with wind speeds greater than 5 m∙s−1 (Figure 2).

2.5. Principal Component Analysis

Principal component analysis (PCA) can be used to identify potential source-receptor correlationship at this site. PCA is a mathematical technique that reduces the dimensions of a data set based on covariance of variables, and has been applied to source identification in numerous air quality studies [27,28,29,30]. Our principal component analysis reveals that during the 2010 intensive, the measurements with highest loadings in the first three principal components include: GEM, O3 and temperature in the first principal component, GOM and SO2 in the second principal component, and PBM, NO and black carbon in the third principal component. During the 2011 intensive study, the first principal component includes GOM, O3 and BrO; the second principal component includes GEM, CO and black carbon; and the third principal component includes GEM and SO2. This analysis reveals two possible factors that were clustered with GEM, GOM, and PBM: direct emissions and photochemical process. This study indicates that the receptor site, which is located in a coastal environment of the Gulf of Mexico, experienced impacts from mercury sources that are both local and regional in nature.
With these PCA results, we can qualitatively interpret the Hg source-receptor relationship at this site. High SO2 events could be associated with plumes from nearby point sources such as power plants and refineries, resulting in the direct emission of GOM. High GOM and PBM events were typically observed in the passage of cold fronts, indicating the impact of northerly flow at the site, which brings in emissions from upwind sources with high GOM and PBM. Such episodes were also accompanied by high O3 and ambient temperatures, and likely reflect a photochemical origin of GOM. High black carbon, NO and CO cases are indicators for biomass burning, industrial and mobile source activities.
Figure 11. Back trajectory frequencies of high GOM (>20 pg∙m−3, (Left)) and low GOM (<2 pg∙m−3, (Right)) events during the spring 2011 intensive study. The color-coded trajectory frequency at each grid represents the percentage of trajectories passing through the gridded area. Symbols represent the major mercury emission sources with source types and strengths as the same as in Figure 1.
Atmosphere 05 00230 g011

3. Experimental Section

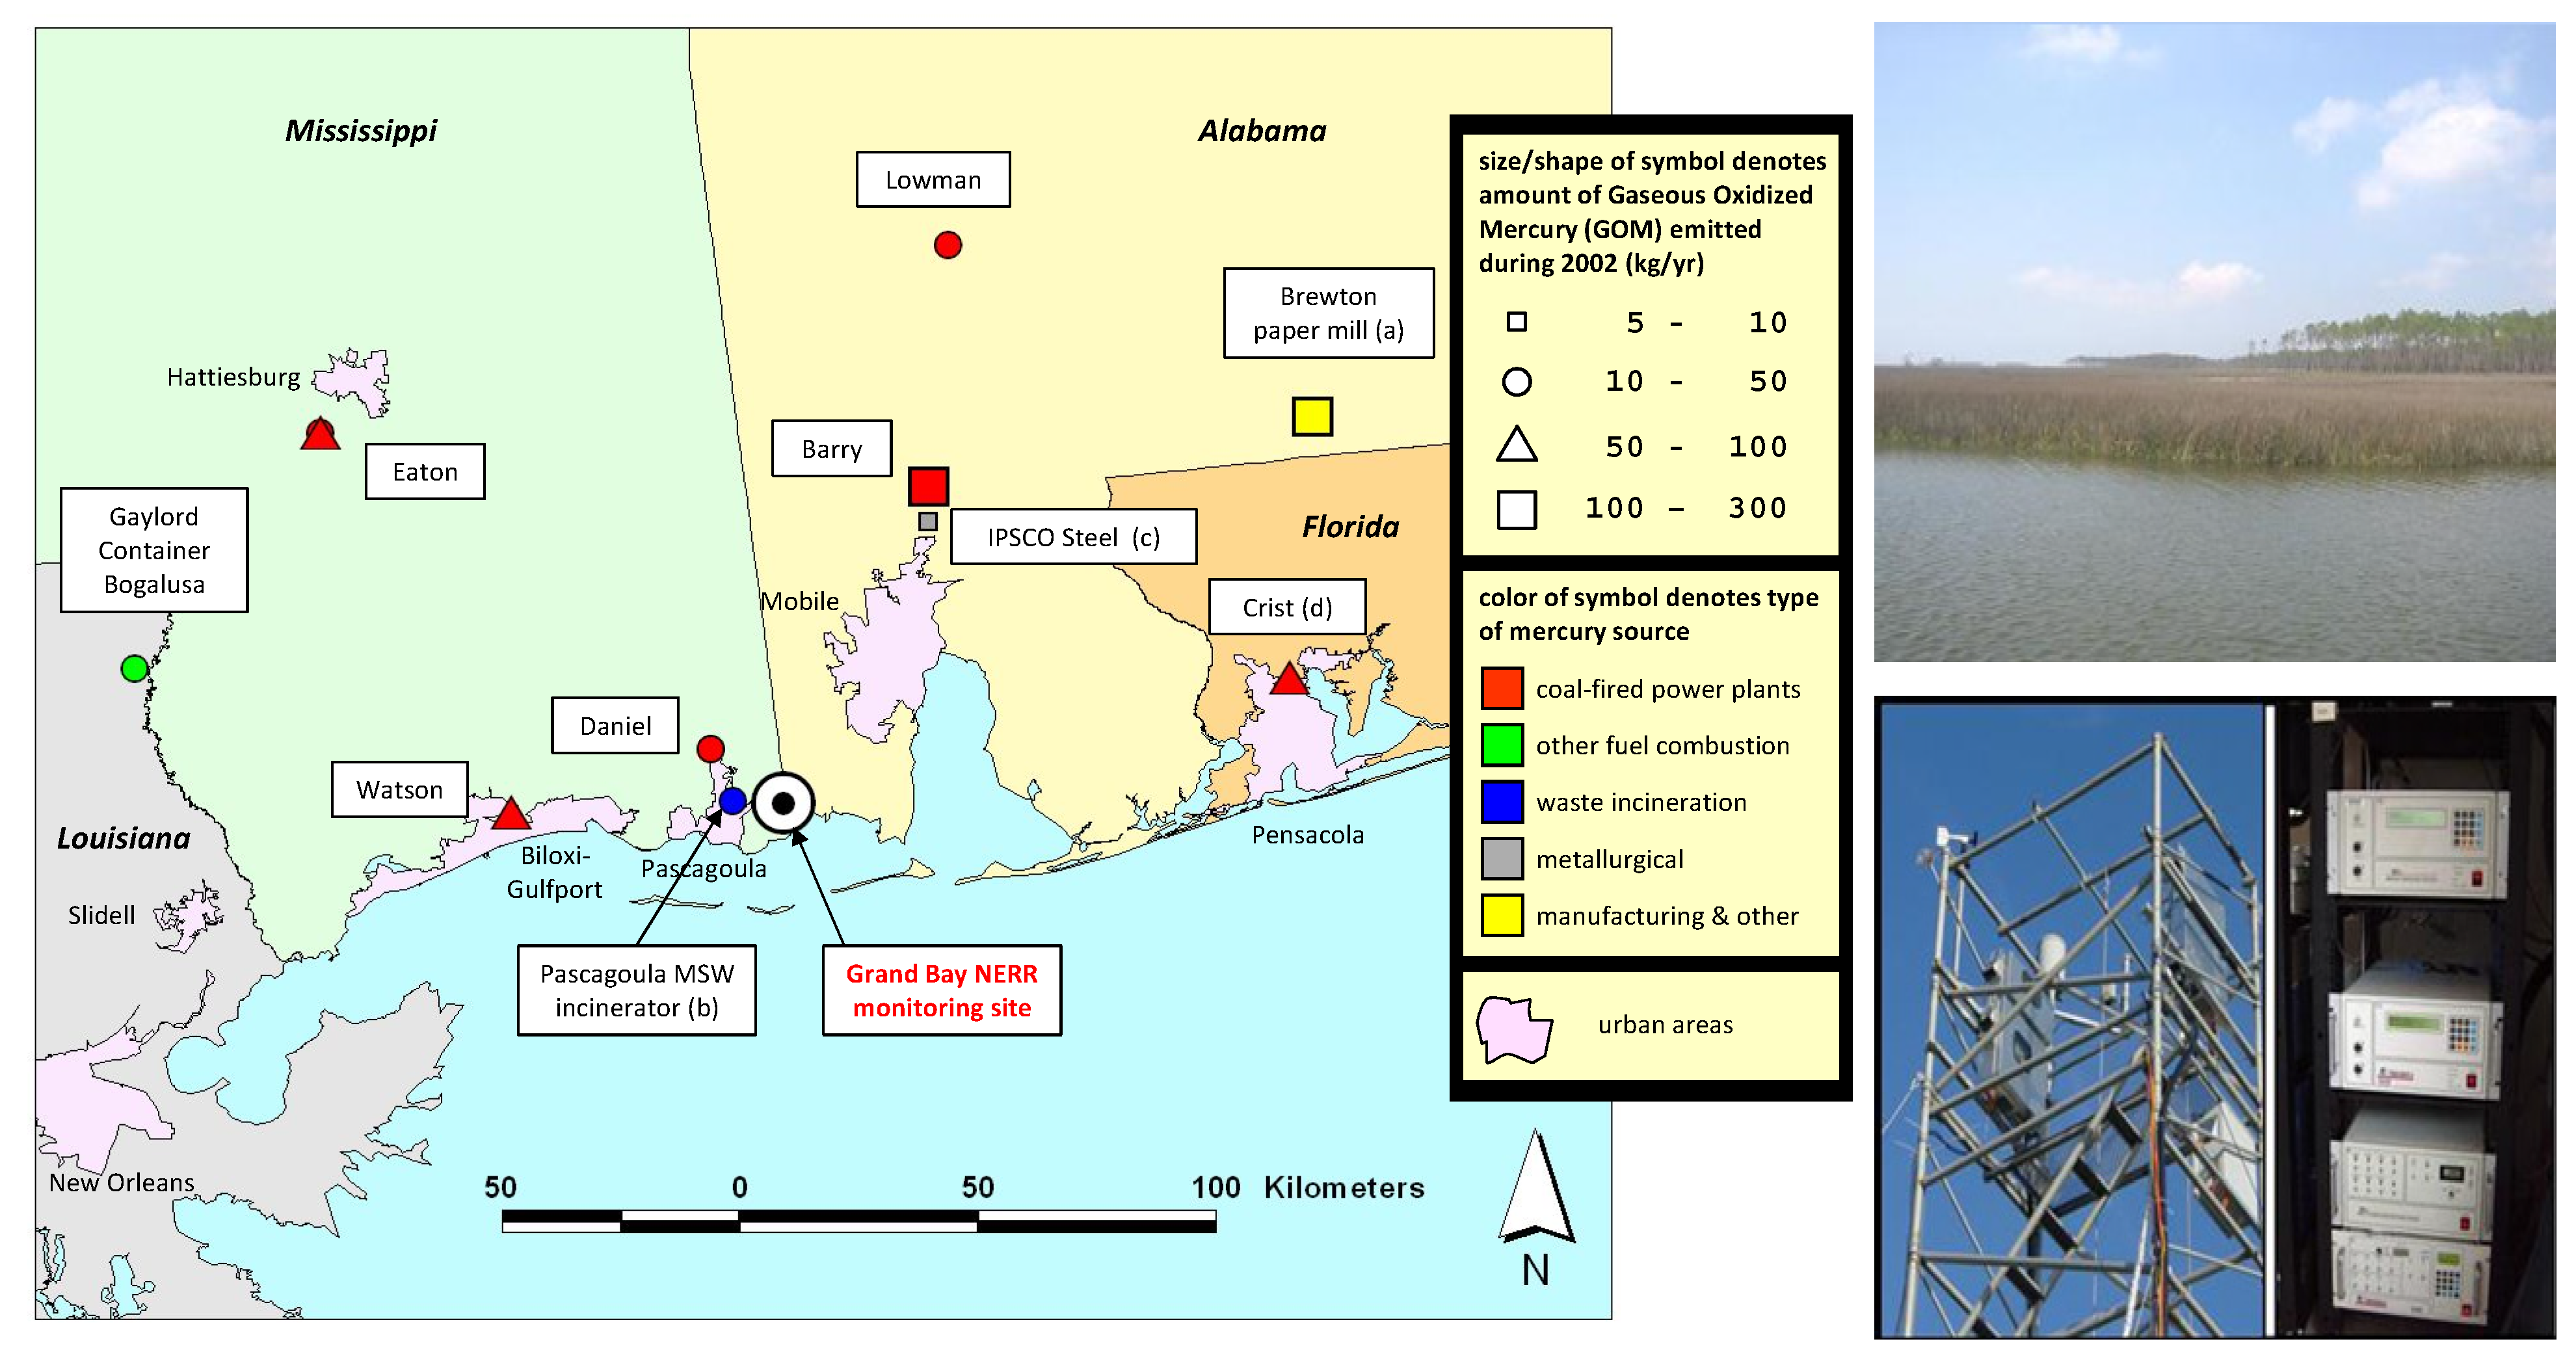
3.1. Site Description

The monitoring station is located at the NOAA Grand Bay National Estuarine Research Reserve (NERR) in Moss Point, Mississippi (30.412°N, 88.404°W), one of the National Atmospheric Deposition Program’s Atmospheric Mercury Network (AMNet) sites (site ID: MS12). The reserve is located in Southeastern Mississippi between Pascagoula, Mississippi, and the Alabama state line. The area contains a variety of wetland habitats, both tidal and non-tidal, as well as terrestrial habitats that are unique to the coastal zone, such as maritime forests of pine savannah (individual pine trees in mostly swampy grassland). The location of the monitoring site and major regional point sources of GOM are shown in Figure 1. The site is located about 5 km from the waters of Grand Bay, and approximately 30 km from the open waters of the Gulf of Mexico.
A 10-m walk-up tower was established at the edge of a marsh grass/bayou on the grounds of the Grand Bay NERR, while all chemical analyzers were housed in a climate-controlled shelter adjacent to the tower. Measurements of speciated Hg, ancillary chemical species, and meteorological parameters were made from the top of the tower. The two intensive studies were conducted from 29 July to 12 August 2010, and from 15 April to 9 May 2011.

3.2. Experimental Description

3.2.1. Surface Measurements

Two Tekran speciation systems (Tekran Instrument Corporation, Ontario, Canada) were used to measure GEM, GOM and PBM. Each system uses a Tekran 1130/1135 speciation unit coupled with a Tekran 2537 Cold Vapor Atomic Fluorescence Spectrometer (CVAFS). Details about the system are described by [31] and [32]. The standard protocols for AMNet were followed for data collection and reduction [21]. Briefly, as ambient air flows through the system, GOM is collected on a KCl-coated annular denuder followed by the collection of PBM (with particle diameter < 2.5 μm) on a regenerable quartz filter (RPF) and GEM on gold traps. The collected GOM on the denuder and PBM on the quartz filter are then thermally desorbed and analyzed by the Tekran 2537 as GEM. Every two hours each Hg speciation system provides 12 consecutive GEM measurements with a 5-min temporal resolution and one measurement of GOM and PBM in 1-hour integration time. Because air is only sampled during the first hour of the 2-hour period, the two speciation systems, operating out-of-phase by one hour, provided truly continuous measurements of atmospheric mercury speciation. The two collocated mercury speciation systems at the site also provided quality control and quality assurance information by comparing the concentrations measured with the two systems. The agreement between the two systems was good for GEM (with a slope of 1.05 ± 0.06 for 2010 and a slope of 0.99 ± 0.04 for 2011), GOM (with a slope of 0.98 ± 0.03 for 2010 and a slope of 0.81 ± 0.03 for 2011), and PBM (with a slope of 1.19 ± 0.05 for 2010 and a slope of 1.10 ± 0.03 for 2011).
The use of KCl-coated denuders, either as part of the automated Tekran speciation system or using manual analysis, is the approach that is currently accepted as the standard method for the measurement of GOM. We note, however, that in recent work, Jaffe and co-workers have suggested that this approach does not quantitatively measure GOM and is biased low [33,34]. In a limited set of measurements during the RAMIX intercomparison, we used a laser induced fluorescence (LIF) technique [35] to simultaneously measure both ambient GEM and total mercury (TGM). The total mercury concentrations were obtained by converting GOM to GEM by pyrolysis. Our GOM concentrations, obtained from the difference between the GEM and TGM measurements, were in much better agreement with the measurements reported by the two Tekran speciation systems deployed at RAMIX compared with the DOHGS instrument deployed by [33] that also pyrolyzes the sample to calculate TGM. In this work we are assuming that the KCl denuder approach gives a quantitative measurement of GOM. It is clear that this issue of the discrepancy in the GOM measurements requires further investigation.
Measurements of ancillary chemical species, including ozone, NO, NOY, CO, SO2, and black carbon were made with modified commercial analyzers (Thermo Fisher Scientific, Waltham, MA). Details of the trace gas measurements may be found in [36]. BrO was measured by chemical ionization mass spectrometry (CIMS) [37]. Meteorological sensors provided continuous measurements of temperature, pressure, relative humidity, wind speed and direction, precipitation, and solar radiation. Precipitation collectors gathered weekly rainfall for subsequent analysis of total and methyl mercury, major ions, and trace metals.
Activities of Beryllium-7 (7Be) and lead-210 (210Pb) were determined during the 2011 intensive by nondestructive gamma spectroscopy as described previously [38,39]. To collect 7Be sample, aerosol particles were collected onto Whatman GF/A glass fiber filters using a high-volume (Hi-Vol) sampler in an open field next to the Grand Bay NERR building, which is located about 3 km to the northwest of the monitoring site. Either 24-h or 12-h Hi-Vol samples were collected during the spring 2011 intensive. Samples were usually analyzed for 7Be radioactivity within a week of collection.

3.2.2. Aircraft Measurements

Measurements of GEM, ozone, SO2, and condensation nuclei (CN) were made aboard the University of Tennessee Space Institute (UTSI) Piper Navajo aircraft during the research intensives. The airplane was based at Trent Lott Regional Airport, Moss Point, MS, about 14 km to the northwest of the monitoring site. The trace-gas and meteorological instrumentation was fully automated, and ran largely unattended on each flight. Meteorological parameters (temperature, pressure, relative humidity, solar radiation) were measured as part of the aircraft’s standard instrumentation package. Water vapor was measured with a chilled mirror hygrometer. Concentrations of ozone (O3) and sulfur dioxide (SO2) were measured at 1s time resolution with modified commercial sensors (Thermo Fisher Scientific) equipped with custom electronics. Particles with diameter >0.014 µm were measured with a TSI Incorporated (Shoreview, MN) Model 3760 Condensation Nucleus Counter. Further descriptions of the instrumentation may be found in [40].
GOM was collected on KCl-coated denuders and uncoated quartz tubes, followed by thermal desorption and analysis with a Tekran Model 2537 ambient mercury vapor analyzer for the KCl-coated denuders and with a laser induced fluorescence (LIF) techniques for uncoated quartz tubes [41],. Sampling was conducted at flight altitudes ranging from the surface to 4.5 km above mean sea level (MSL). By characterizing the burden of primary and secondary trace gas and aerosol pollutants in the lower and middle troposphere, GEM and GOM measurements made from the Navajo can be interpreted.

3.2.3. Ozonesonde Launches

Ozonesondes were launched at the Grand Bay NERR monitoring site on several days. The GPS-enabled radiosonde, with FM-band data telemetry and an optional electrochemical cell ozonesonde (Ensci Corporation (now Droplet Measurement Technology), Boulder, CO, USA), transmitted data to a ground receiving station in the site trailer. The following variables were measured from the surface to the burst altitude of the sonde, typically above 30,000 meters: temperature, pressure, relative humidity, wind speed, wind direction, and O3 mixing ratio.

3.3. HYSPLIT Back Trajectory Model

Five-day back trajectory simulations were conducted for high (>20 pg∙m−3) and low (<2 pg∙m−3) GOM events observed at the Grand Bay NERR monitoring site to establish the transport history of the associated air masses and source-receptor co-relationships. The back trajectories were simulated using the NOAA Hybrid Single-Particle Lagrangian Integrated Trajectory model (HYSPLIT, v4.9) [42] and high resolution meteorological data simulated using the WRF-ARW model (Version 3.2, [43]), with a horizontal resolution of 4 km and a time resolution of 3 h. Trajectories were initialized from the Grand Bay surface at the middle point of the mixing layer for the hours when the high and low GOM were observed.

3.4. Principal Component Analysis

Principal component analysis (PCA) was applied to try to identify potential source-receptor co-relationship at this site. A data matrix was first constructed by using 11 surface observations, including GEM, GOM, PBM, NO, CO, SO2, O3, BrO, black carbon, air temperature, and relative humidity. A MATLAB function of principal component analysis was then used to calculate the principal coefficients and scores. The original data were standardized and filtered for data points with solar radiation greater than 10 W∙m−2 to represent daytime data only.

4. Conclusions

The two mercury intensive studies at Grand Bay, Mississippi in summer 2010 and spring 2011 show that the monitoring site typically exhibits rural/remote characteristics with generally low concentrations of anthropogenic chemical species, but with occasional transport-related episodes with higher concentrations. Measured GEM concentrations exhibited little variation, little or no dependence on wind direction, and no discernible diurnal pattern. PBM had more transport related episodes and a modest diurnal profile. GOM exhibits a more pronounced diurnal profile. Diurnal profiles of GOM show increases in daytime, coincident with O3, BrO, and SO2 peaks, illustrating the importance of photochemical production of oxidized mercury and direct emissions from local sources. Elevated GOM levels are associated with dryer air, characteristic of continental emissions ([CO] ca 150 ppbv). These results suggest GOM is transported from northerly continental sources following cold-frontal penetration in spring. There was no evidence of strong, substantial GOM production or transport in marine air masses.
Back-trajectory analysis of enhanced GOM events suggests that GOM concentrations at the sites are influenced episodically by local and regional sources, while low GOM levels were largely associated the trajectories passing through relatively clean areas. Principal component analysis reveals two main factors: direct emissions and photochemical processes that were clustered with high GOM and PBM. This study indicates that the receptor site which is located in a coastal environment of the Gulf of Mexico experienced impacts from mercury sources that are both local (within ~50 km) and regional (within ~50 km) in nature. Further modeling studies on atmospheric mercury in this region would be required to provide source-attribution information and estimated impacts of alternative future climate scenarios, while measurements from intensive studies as these can then be used to evaluate model performance.

Acknowledgments

The authors thank the NOAA Grand Bay NERR for cooperation in facilitating the field studies and the UTSI flight crew for their dedicated work to make the airborne measurements successful. This study was funded by NOAA (NA09OAR4600198 and NA10OAR4600209). Support for this research was also partially provided by the Cooperative Institute for Climate and Satellites agreement funded by NOAA's Office of Oceanic and Atmospheric Research under a NOAA Cooperative Agreement.

Author Contributions

Xinrong Ren wrote the majority of the manuscript and performed much of the data analysis. Winston Luke and Paul Kelley worked on data processing and quality control. Xinrong Ren, Winston Luke, Paul Kelley, Jake Walker, Steve Brooks, Christopher Moore, Phil Swartzendruber, Dieter Bauer, James Remeika, Anthony Hynes, Jack Dibb, John Rolison, Nishanth Krishnamurthy, William M. Landing, Arsineh Hecobian, Jeffreery Shook and L. Greg Huey collected data in the field intensives. Jack Dibb performed analysis of 7Be samples and contributed valuable scientific insight and editing. Mark Cohen performed HYSPLIT trajectory simulations and provided scientific insight and editing. Fong Ngan provided high-resolution WRF-ARM meteorological data used for HYSPLIT trajectory simulations.

Conflicts of Interest

The authors declare no conflict of interest.

References and Notes

  1. Mason, R.; Fitzgerald, W.F.; Morel, F.M. The biogeochemical cycling of elemental mercury: Anthropogenic influences. Geochim. Cosmochim. Act. 1994, 58, 3191–3198. [Google Scholar] [CrossRef]
  2. Schroeder, W.H.; Munthe, J. Atmospheric mercury—An overview. Atmos. Environ. 1998, 32, 809–822. [Google Scholar] [CrossRef]
  3. Fitzgerald, W.F.; Engstrom, D.R.; Mason, R.P.; Nater, E.A. The case for atmospheric mercury contamination in remote areas. Environ. Sci. Technol. 1998, 3, 1–7. [Google Scholar]
  4. Lin, C.-J.; Pehkonen, S.O. The chemistry of atmospheric mercury: A review. Atmos. Environ 1999, 33, 2067–2079. [Google Scholar] [CrossRef]
  5. Selin, N.E. Global Biogeochemical Cycling of Mercury: A Review. Ann. Rev. Environ. Res. 2009, 34, 43–63. [Google Scholar] [CrossRef]
  6. AMAP/UNEP. Technical Background Report for the Global Mercury Assessment 2013; Arctic Monitoring and Assessment Programme, Oslo, Norway/UNEP Chemicals Branch: Geneva, Switzerland, 2013. [Google Scholar]
  7. Morel, F.M.M.; Kraepiel, A.M.L.; Amyot, M. The chemical cycle and bioaccumulation of mercury. Annu. Rev. Ecol. Syst. 1998, 29, 543–566. [Google Scholar] [CrossRef]
  8. Choi, A.L.; Grandjean, P. Methylmercury exposure and health effects in humans. Environ. Chem. 2008, 5, 112–120. [Google Scholar] [CrossRef] [Green Version]
  9. Sunderland, E. Mercury exposure from domestic and imported estuarine and marine fish in the U.S. Seafood Market. Environ. Health Perspect. 2007, 115, 235–242. [Google Scholar] [CrossRef]
  10. Gustin, M.S.; Lindberg, S.E.; Weisberg, P.J. An update on the natural sources and sinks of atmospheric mercury. Appl. Geochem. 2008, 23, 482–493. [Google Scholar] [CrossRef]
  11. UNEP. Global Mercury Assessment 2013: Sources, Emissions, Releases and Environmental Transport. UNEP Chemicals Branch: Geneva, Switzerland, 2013. Available online: http://www.unep.org/PDF/PressReleases/GlobalMercuryAssessment2013.pdf (accessed on 25 February 2014).
  12. Engle, M.A.; Tate, M.T.; Krabbenhoft, D.P.; Kolker, A.; Olson, M.L.; Edgerton, E.S.; DeWild, J.F.; McPherson, A.K. Characterization and cycling of atmospheric mercury along the central U.S. Gulf Coast. Appl. Geochem. 2008, 23, 419–437. [Google Scholar] [CrossRef]
  13. National Atmospheric Deposition Program’s Mercury Deposition Network (MDN), Monitoring Mercury Deposition: A Key Tool to Understanding the Link between Emissions and Effects. Available online: http://nadp.sws.uiuc.edu/lib/brochures/mdn.pdf (accessed on 15 February 2014).
  14. Nair, U.S.; Wu, Y.; Walters, J.; Jansen, J.; Edgerton, E.S. Diurnal and seasonal variation of mercury species at coastal-suburban, urban, and rural sites in the southeastern United States. Atmos. Environ. 2012, 47, 499–508. [Google Scholar] [CrossRef]
  15. Weiss-Penzias, P.; Jaffe, D.E.; McClintick, A.; Prestbo, E.M.; Landis, M.S. Gaseous elemental mercury in the marine boundary layer: evidence for rapid removal in anthropogenic pollution. Environ. Sci. Technol. 2003, 37, 3755–3763. [Google Scholar] [CrossRef]
  16. Brunke, E.-G.; Labuschagne, C.; Ebinghaus, R.; Kock, H.H.; Slemr, F. Gaseous elemental mercury depletion events observed at Cape Point during 2007–2008. Atmos. Chem. Phys. 2010, 10, 1121–1131. [Google Scholar] [CrossRef]
  17. Schroeder, W.H.; Anlauf, K.G.; Barrie, L.A.; Lu, J.Y.; Steffen, A.; Schneeberger, D.R.; Berg, T. Arctic springtime depletion of mercury. Nature 1998, 394, 331–332. [Google Scholar] [CrossRef]
  18. Ebinghaus, R.; Kock, H.H.; Temme, C.; Einax, J.W.; Löwe, A.G.; Richter, A.; Burrows, J.P.; Schroeder, W.H. Antarctic springtime depletion of atmospheric mercury. Environ. Sci. Technol. 2002, 36, 1238–1244. [Google Scholar] [CrossRef]
  19. Tas, E.; Obrist, D.; Peleg, M.; Matveev, V.; Faïn, X.; Asaf, D.; Luria, M. Measurement-based modelling of bromine-induced oxidation of mercury above the Dead Sea. Atmos. Chem. Phys. 2012, 12, 2429–2440. [Google Scholar] [CrossRef]
  20. Ren, X.; Luke, W.T.; Kelley, P.; Cohen, M.; Tong, D.; Artz, R.; Olsen, M.L.; Schmeltz, D. Mercury speciation at a suburban site in the Mid-Atlantic United States: Seasonal and diurnal variations and source-receptor correlationship. Atmos. Chem. Phys. 2014. in preparation. [Google Scholar]
  21. Gay, D.A.; Schmeltz, D.; Prestbo, E.; Olson, M.; Sharac, T.; Tordon, R. The Atmospheric Mercury Network: measurement and initial examination of an ongoing atmospheric mercury record across North America. Atmos. Chem. Phys. 2013, 13, 11339–11349. [Google Scholar] [CrossRef]
  22. Tremblay, J.; Servranckx, R. Beryllium-7 as a tracer of stratospheric ozone: A case study. J. Radioanal. Nucl. Chem. 1993, 172, 49–56. [Google Scholar] [CrossRef]
  23. Dibb, J.E.; Talbot, R.W.; Lefer, B.L.; Scheuer, E.; Gregory, G.L.; Browell, E.V.; Bradshaw, J.D.; Sandholm, S.T.; Singh, H.B. Distributions of beryllium 7 and lead 2109, and soluble aerosol-associated ionic species over the western Pacific: PEM West B, February–March 1994. J. Geophys. Res.: Atmos. 1997, 102, 28287–28302. [Google Scholar] [CrossRef]
  24. Kikuchi, S.; Sakurai, H.; Gunji, S.; Tokanai, F. Temporal variation of 7Be concentrations in atmosphere for 8 y from 2000 at Yamagata, Japan: Solar influence on the 7Be time series. J. Environ. Radioact. 2009, 100, 515–521. [Google Scholar] [CrossRef]
  25. Piñero Garcíaa, F.; Ferro Garcíaa, M.A.; Azahrab, M. 7Be behaviour in the atmosphere of the city of Granada January 2005 to December 2009. Atmos. Environ. 2012, 47, 84–91. [Google Scholar] [CrossRef]
  26. Rolison, J.M.; Landing, W.M.; Luke, W.; Cohen, M.; Salters, V.J.M. Isotopic composition of species-specific atmospheric Hg in a coastal environment. Chem. Geol. 2013, 336, 37–49. [Google Scholar] [CrossRef]
  27. Thurston, G.D.; Spengler, J.D. A quantitative assessment of source contributions to inhalable particulate matter pollution in metropolitan Boston. Atmos. Environ. 1985, 19, 9–26. [Google Scholar] [CrossRef]
  28. Buhr, M.; Parrish, D.; Elliot, J.; Holloway, J.; Carpenter, J.; Goldan, P.; Kuster, W.; Trainer, M.; Montzka, S.; McKeen, S.; Fehsenfeld, F. Evaluation of ozone precursor source types using principal component analysis of ambient air measurements in rural Alabama. J. Geophys. Res. 1995, 100, 22853–22860. [Google Scholar] [CrossRef]
  29. Statheropoulos, M.; Vassiliadis, N.; Pappa, A. Principal component and canonical correlation analysis for examining air pollution and meteorological data. Atmos. Environ. 1998, 32, 1087–1095. [Google Scholar] [CrossRef]
  30. Guo, H.; Wang, Tao; Louie, P.K.K. Source apportionment of ambient non-methane hydrocarbons in Hong Kong: Application of a principal component analysis/absolute principal component scores (PCA/APCS) receptor model. Environ. Pollut. 2004, 129, 489–498. [Google Scholar] [CrossRef]
  31. Landis, M.S.; Stevens, R.K.; Schaedlich, F.; Prestbo, E.M. Development and characterization of an annular denuder methodology for the measurement of divalent inorganic reactive gaseous mercury in ambient air. Environ. Sci. Technol. 2002, 36, 3000–3009. [Google Scholar] [CrossRef]
  32. Lindberg, S.; Brooks, S.; Lin, C.-J.; Scott, K.; Landis, M.; Stevens, R.; Goodsite, M.; Richter, A. Dynamic oxidation of gaseous mercury in the Arctic troposphere at polar sunrise. Environ. Sci. Technol. 2002, 36, 1245–1256. [Google Scholar] [CrossRef]
  33. Ambrose, J.L.; Lyman, S.N.; Huang, J.; Gustin, M.S.; Jaffe, D.A. Fast time resolution oxidized mercury measurements during the Reno Atmospheric Mercury Intercomparison Experiment (RAMIX). Environ. Sci. Technol. 2013, 47, 7285–7294. [Google Scholar]
  34. Gustin, M.S.; Huang, J.; Miller, M.B.; Peterson, C.; Jaffe, D.A.; Ambrose, J.; Finley, B.D.; Lyman, S.N.; Call, K.; Talbot, R.; et al. Do we understand what the mercury speciation instruments are actually measuring? Results of RAMIX. Environ. Sci. Technol. 2013, 47, 7295–7306. [Google Scholar]
  35. Bauer, D.; Campuzano-Jost, P.; Hynes, A.J. Rapid, ultra-sensitive detection of gas phase elemental mercury under atmospheric conditions using sequential two-photon laser induced fluorescence. J. Environ. Monit. 2002, 4, 339–343. [Google Scholar] [CrossRef]
  36. Luke, W.T.; Kelley, P.; Lefer, B.L.; Flynn, J.; Rappenglück, B.; Leuchner, M.; Dibb, J.E.; Ziemba, L.D.; Anderson, C.H.; Buhr, M. Measurements of primary trace gases and NOy composition in Houston, Texas. Atmos. Environ. 2010, 44, 4068–4080. [Google Scholar] [CrossRef]
  37. Liao, J.; Huey, L.G.; Tanner, D.J.; Brough, N.; Brooks, S.; Dibb, J.E.; Stutz, J.; Thomas, J.L.; Lefer, B.; Haman, C.; et al. Observations of hydroxyl and peroxy radicals and the impact of BrO at Summit, Greenland in 2007 and 2008. Atmos. Chem. Phys. 2011, 11, 8577–8591. [Google Scholar] [CrossRef] [Green Version]
  38. Dibb, J.E.; Talbot, R.W.; Klemm, K.I.; Gregory, G.L.; Singh, H.B.; Bradshaw, J.D.; Sandholm, S.T. Asian influence over the western North Pacific during the fall season: Inferences from lead 210, soluble ionic species, and ozone. J. Geophys. Res. 1996, 101, 1779–1792. [Google Scholar] [CrossRef]
  39. Dibb, J.E.; Talbot, R.W.; Scheuer, E.; Seid, G.; DeBell, L.; Lefer, B.; Ridley, B. Stratospheric influence on the northern North American free troposphere during TOPSE: 7Be as a stratospheric tracer. J. Geophys. Res.: Atmos. 2003. [Google Scholar] [CrossRef]
  40. Luke, W.T.; Arnold, J.R.; Gunter, R.L.; Watson, T.B.; Wellman, D.L.; Dasgupta, P.K.; Li, J.; Riemer, D.; Tate, P. The NOAA Twin Otter and its role in BRACE: Platform description. Atmos. Environ. 2007, 41, 4177–4189. [Google Scholar] [CrossRef]
  41. Ernest, C.T.; Donohoue, D.; Bauer, D.; Ter Schure, A.; Hynes, A.J. Programmable thermal dissociation of reactive gaseous mercury—A potential approach to chemical speciation: results from a field study. Atmos. Chem. Phys. Discuss. 2012, 12, 33291–33322. [Google Scholar] [CrossRef]
  42. Draxler, R.R.; Rolph, G.D. HYSPLIT (HYbrid Single-Particle Lagrangian Integrated Trajectory) Model; NOAA Air Resources Laboratory: Maryland, MD, USA, 2014. Available online: http://ready.arl.noaa.gov/HYSPLIT.php (accessed on 25 April 2013).
  43. Ngan, F.; Cohen, M.; Luke, W.; Ren, X.; Draxler, R. Meteorological modeling using WRF-ARW model for Grand Bay Intensive studies of atmospheric mercury. Atmosphere 2014. in preparation. [Google Scholar]

