Article

Air-Sea Exchange of Legacy POPs in the North Sea Based on Results of Fate and Transport, and Shelf-Sea Hydrodynamic Ocean Models

by
Kieran O'Driscoll
School of Planning, Architecture and Civil Engineering, Queen's University Belfast, David Keir Building, Stranmillis Road, Belfast BT9 5AG, Northern Ireland, UK
Atmosphere 2014, 5(2), 156-177; https://doi.org/10.3390/atmos5020156
Submission received: 30 October 2013 / Revised: 20 January 2014 / Accepted: 21 January 2014 / Published: 4 April 2014

Abstract

:
The air-sea exchange of two legacy persistent organic pollutants (POPs), γ-HCH and PCB 153, in the North Sea, is presented and discussed using results of regional fate and transport and shelf-sea hydrodynamic ocean models for the period 1996–2005. Air-sea exchange occurs through gas exchange (deposition and volatilization), wet deposition and dry deposition. Atmospheric concentrations are interpolated into the model domain from results of the EMEP MSC-East multi-compartmental model (Gusev et al, 2009). The North Sea is net depositional for γ-HCH, and is dominated by gas deposition with notable seasonal variability and a downward trend over the 10 year period. Volatilization rates of γ-HCH are generally a factor of 2–3 less than gas deposition in winter, spring and summer but greater in autumn when the North Sea is net volatilizational. A downward trend in fugacity ratios is found, since gas deposition is decreasing faster than volatilization. The North Sea is net volatilizational for PCB 153, with highest rates of volatilization to deposition found in the areas surrounding polluted British and continental river sources. Large quantities of PCB 153 entering through rivers lead to very high local rates of volatilization.

1. Introduction

Although primary emissions of legacy persistent organic pollutants (POPs) have generally declined in recent years, concentrations of some POPs (e.g., PCBs, which are hydrophobic) in the atmosphere over open ocean areas have not reduced accordingly [1,2] which may be due to secondary emissions in capacitors such as oceans, soil and sediments [2]. For less hydrophobic POPs, multi-hopping can contribute to meridional (north-south) transport. For example, modeling global cycling of γ-HCH, the authors of [3] found that over 20% of the global burden had accumulated in the Arctic after 10 yr.
In this paper, we investigate the importance of air-sea exchange processes at the regional sea level. The North Sea is a shallow marginal sea that is connected to the open North Atlantic Ocean at its deep (open) end. It is surrounded by highly populated and developed countries. POPs released in this industrially and agriculturally intense region enter the North Sea either at the ocean surface or in rivers. These POPs are stored in sediment (hydrophobic) or the water column (less hydrophobic), and can be resuspended, advected or revolatilized back to the atmosphere where they can contribute to long range atmospheric, or meridional (north-south), transport.
In this paper, results of simulations of air-sea exchange of PCB 153 and γ-HCH in the North Sea from a hydrodynamic shelf ocean circulation model (Hamburg Shelf Ocean Model, HAMSOM) and a fate and transport ocean model (FANTOM) for the period 1996–2005 are presented and discussed. Using a sub-domain of the present model configuration, Ilyina and co-workers [4] were the first to discuss air-sea fluxes in the southern North Sea for the period 1995–2002. In its present configuration, the FANTOM model uses output from the European Monitoring and Evaluation Programme (EMEP) Meteorological Synthesizing Centre–East (MSC-E) POP multi-compartment model [5].
The results are discussed for the North Sea in general and locally, but fluxes have also been calculated for the International Council for the Sea (ICES) areas, or boxes, for the North Sea. These boxes are based on hydrodynamics, ecology (ecosystem and fisheries), and physical features, see, for example, the discussions in [6,7].

2. Modeling System

2.1. Model Description

We present here a brief description of the modeling system and approach. Both models have previously been described [8]. For full details of the FANTOM see [9] and for the HAMSOM see [10,11].

2.1.1. Model Configuration

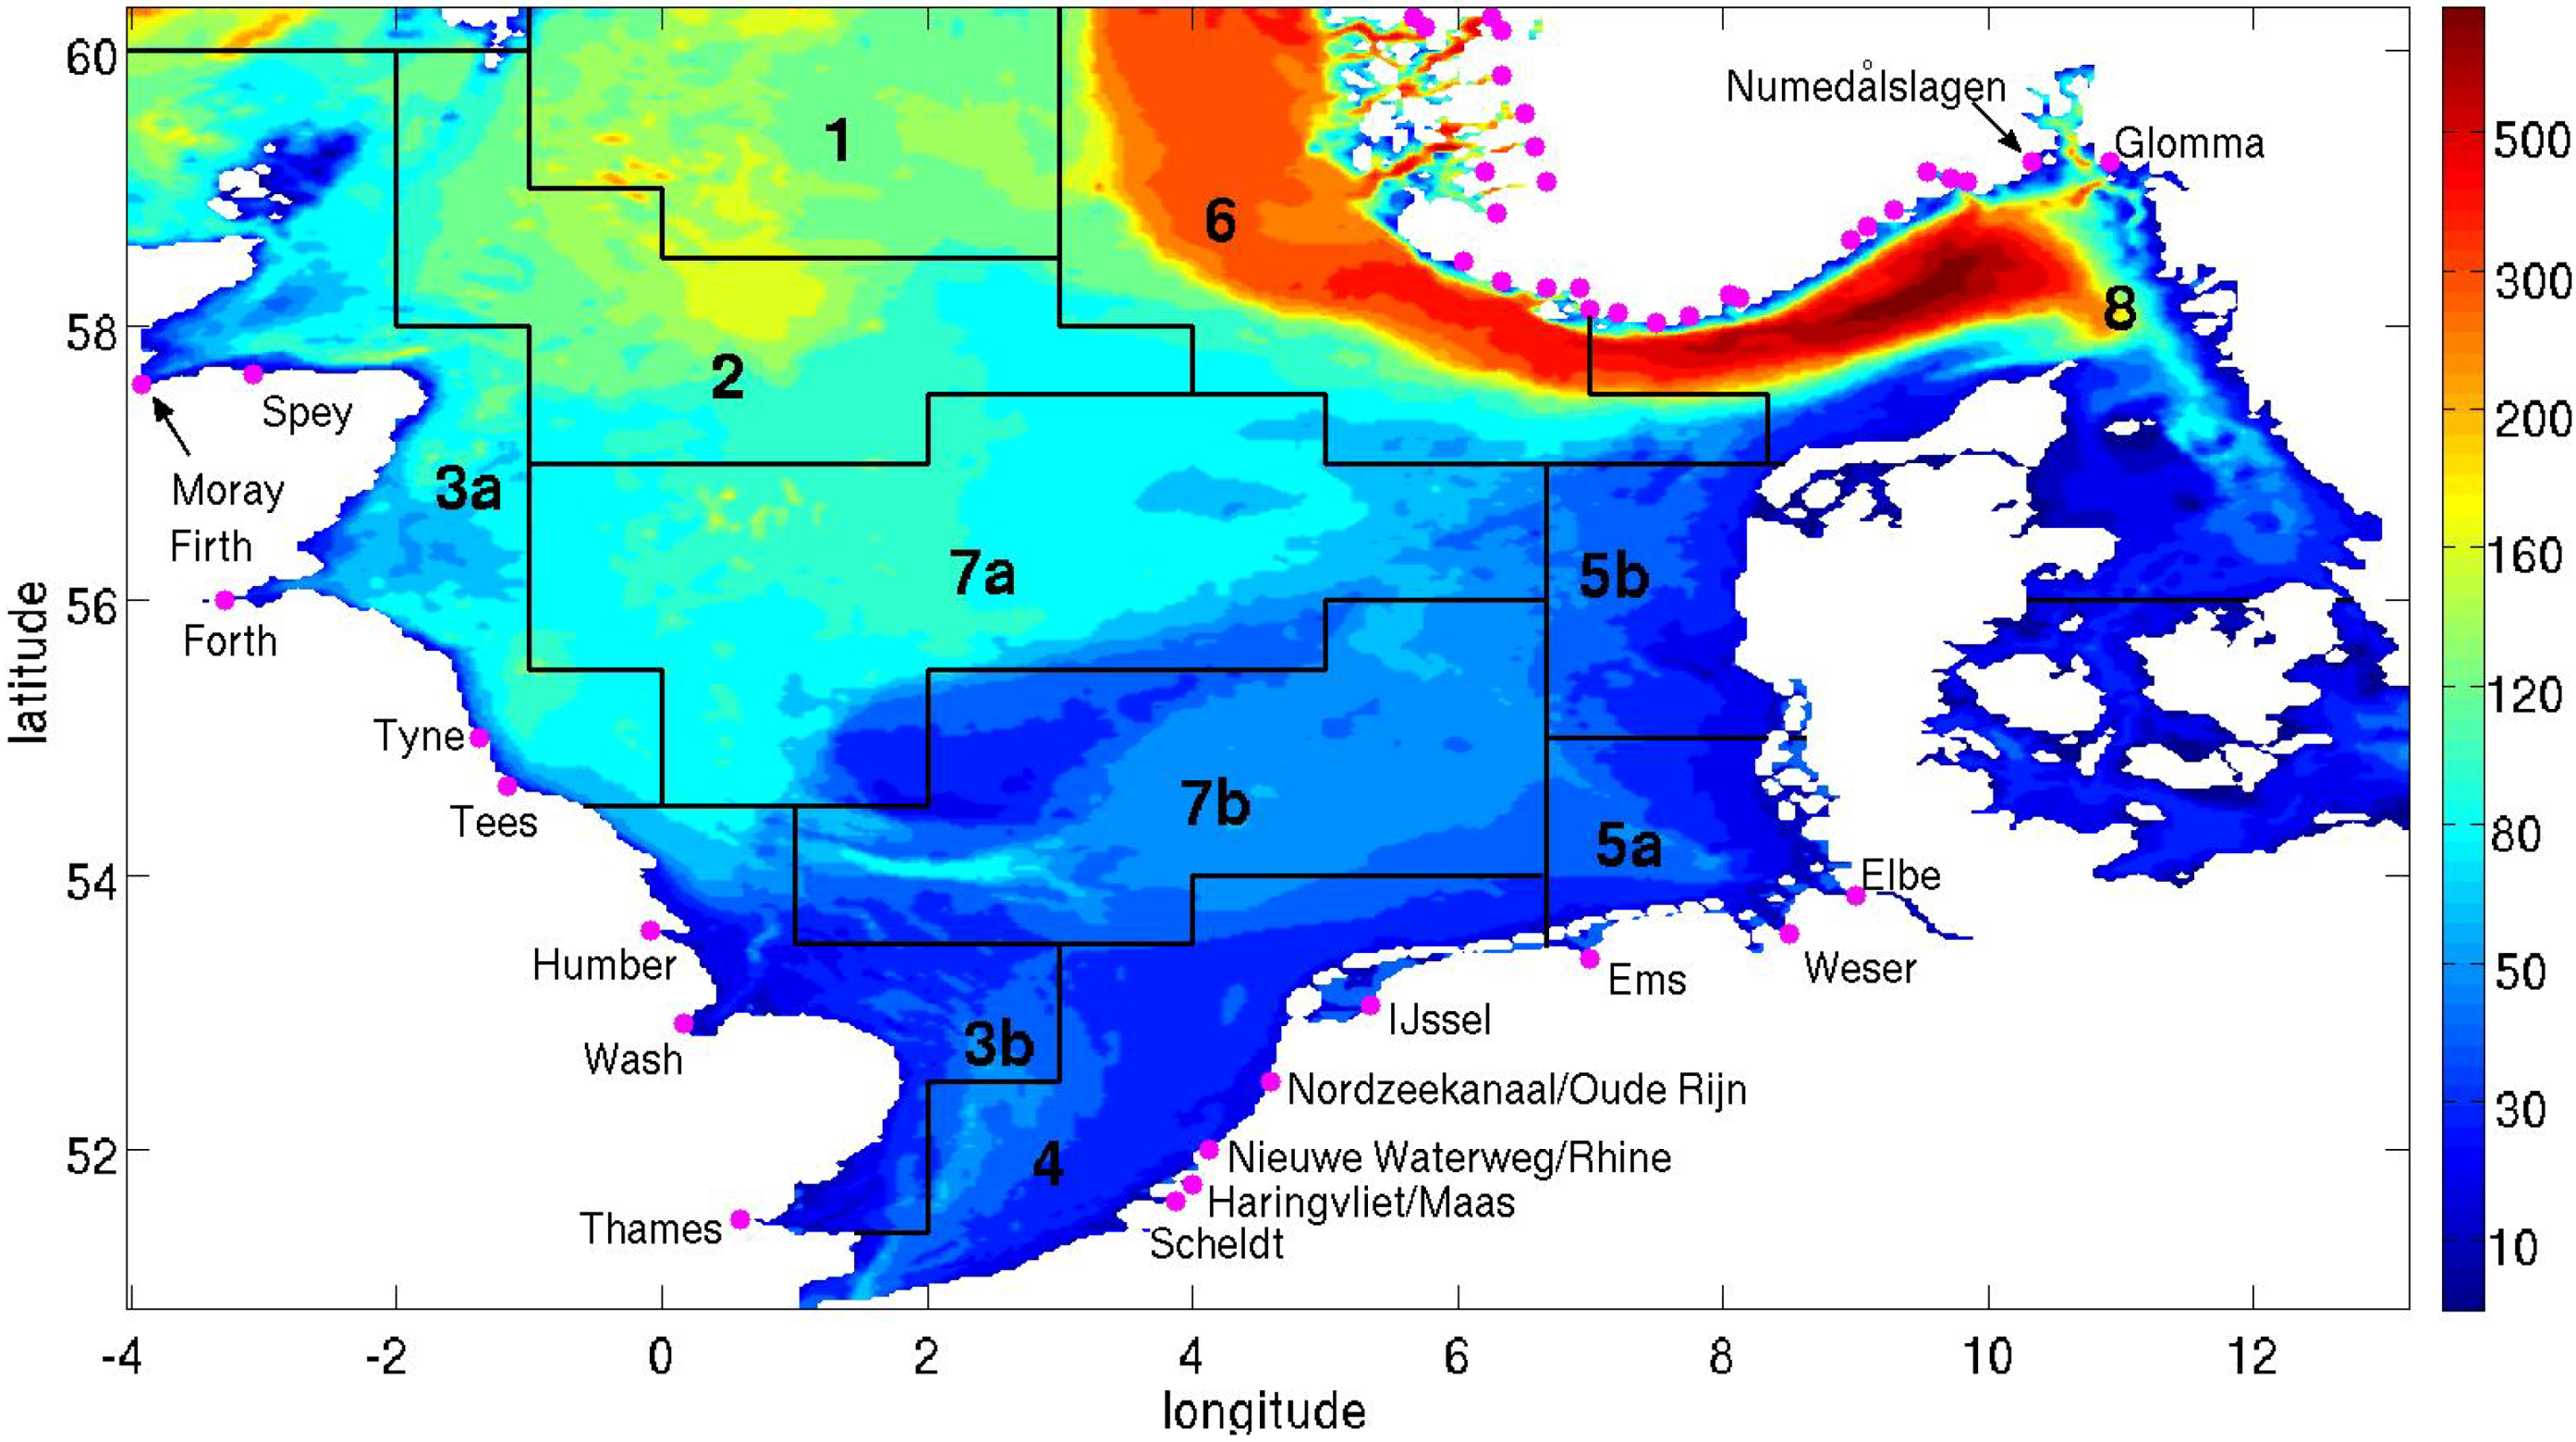
The model domain (both models) includes the entire North Sea, extending from the English Channel in the south to the Shetland Islands in the north, and from the Orkney Islands in the west to the Kattegat and Danish Belts in the east (Figure 1). There are four open boundaries; one each along the western and northern boundaries connecting to the North Atlantic Ocean; one in the south toward the English Channel; and one in the east at the entrance to the Baltic Sea.
Horizontal resolution is 1.5° latitude × 2.5° longitude (2.78 km in latitude and less than 3 km in longitude). There are 30 layers in the vertical with 10 layers in the upper 50 m, 5 layers between 50–100 m, 5 layers between 100–200 m, and 10 layers 200–700 m. Topography is interpolated onto the grid from the improved DYNOCS topography [12]. FANTOM has an additional 20 layers to represent the upper 2 cm of sediment. Time steps are 5 and 10 min for the HAMSOM and FANTOM, respectively.
Figure 1. Model domain (both models) with topography (meters) and river sources of freshwater and persistent organic pollutants (POPs) (magenta dots) with names of major rivers. International Council for the Sea (ICES) boxes are superimposed in black.
Atmosphere 05 00156 g001

2.1.2. HAMSOM

The HAMSOM was developed in the 1980s to study shelf circulation in different regions of the ocean. The NCEP reanalysis [13,14] has been interpolated into the model grid to provide atmospheric forcing. Forcing parameters are near surface atmospheric temperature, humidity, cloud cover, precipitation, sea level pressure, and near surface wind velocity. At the open boundaries, conditions are interpolated from a coarser version of the model. Sea surface height is prescribed with a zero gradient condition, while temperature and salinity are calculated following the radiation condition of Orlanski [15] with a relaxation term under inflow conditions. Initial temperature and salinity conditions are interpolated from Levitus climatology [16].
Since the flushing time of the North Sea is 1–2 years, the model was initially spun up for two years to remove any influence of the initial conditions on the solution. Horizontal sub-grid-scale diffusion is parameterized according to Smagorinsky [17], while vertical diffusion is parameterized according to Kochergin [18]. Bottom form stress is calculated using a semi-implicit form for the quadratic bottom stress [10], and a bottom friction velocity is included to account for deposition and erosion due to storm and wind waves. Climatological values of river runoff are given as point sources [19,20]. HAMSOM has a 5 min time step.

2.1.3. FANTOM

The FANTOM was first developed in 2006 [9] to study the cycling of POPs and other pollutants including persistent, bioaccumulative, and toxic (PBTs) chemicals and substances of very high concern (SVHCs) in shallow coastal and shelf seas. The model simulates air-sea exchange processes; advection and turbulent diffusion due to currents and shear, respectively; phase distributions; degradation; and water-sediment exchange processes.
Net air-sea exchange at the surface (Fsurf) is calculated as the sum of dry deposition (Fdry) on particles (aerosols), gas (Fa) and wet deposition (Fwet) with precipitation minus volatilization (Fw) as follows:
Fsurf = Fa−w + Fdry + Fwet
Gas exchange processes are based on the stagnant two-film theory [21,22] with a fugacity formulation after [23,24], where chemical equilibrium between the air and water is controlled by temperature and the physical-chemical properties of the compound and its abundance in the environment. Fugacity capacities in air and water (Equation 2), respectively, are calculated as:
Atmosphere 05 00156 i001
where R is the ideal gas constant, Ta and Tw are temperature in air and water, respectively, and HC is Henry’s law constant at Tw, and the effects of salinity have not been considered since they are small relative to temperature. The volatilizational exchange rate is calculated following [23] and [24] as:
Atmosphere 05 00156 i002
where Aw is water surface area and u1 and u2 are mass transfer coefficients which are functions of wind speed [25]. The exchange rate for gas deposition is similarly calculated. Wind speeds have been interpolated from the NCEP reanalysis [13,14] onto the model grid in space and time (our model grid has less than 3 km horizontal resolution and the 6-hourly reanalysis is interpolated into the 10 min time step) and will thus impact volatilization in the model. Since volatilization is sensitive to wind speed, and the NCEP reanalysis is taken from a much coarser grid, we can expect to find reduced local winds, the effects of local wind bursts, and consequently wave breaking and sea spray, are not included, so we can expect that volatilization will be reduced due to the wind product used in the model. Note that there were no numerical issues relating to the air-sea transfer of the POPs.
Total rate of change of concentration at a point is calculated as the sum of the advection (along stream velocity) times the concentration gradient, calculated horizontal and vertical diffusivity rates times concentration gradients, sources, and sinks.
POPs are either freely dissolved or bound to suspended particulate matter (SPM) in seawater. The organic carbon fraction of SPM, particulate organic carbon (POC), is calculated and used as a sorbing matrix for POPs. The fraction of a POP bound to POC, fPOC, is calculated as:
Atmosphere 05 00156 i003
where the organic carbon–water equilibrium partition coefficient, KOC (L/kg), is compound specific and CPOC (kg/L) is the concentration of POC in solution. Since most POC in seawater is in particle form, it sinks to the bottom with sinking velocity, vset, implying a downward settling flux of POPs with sinking particles, Fset (μg∙m2∙s1):
Fset = vsetFPOCCPOC
POP mass degradations in water and sediment are given by the product of the concentration with the degradation rate.
Sediment-water exchange of POPs is due to deposition and erosion. POPs sorbed to POC settle in sediment. This material can be eroded and resuspended due to bottom friction. Such episodes are often found in shallow seas and coastal waters, particularly in winter storms and windy conditions, and at spring tides.
Atmospheric POP concentrations from the European Monitoring and Evaluation Programme (EMEP) Meteorological Synthesizing Centre—East (MSC-E) POP multi-compartment model [1] are used. Concentrations at the open boundaries have been estimated from available observations and model results [9,26,27,28,29,30,31]. POPs in rivers enter the model domain as point sources with concentrations taken from available sources [8].
POC in the water column have been interpolated from the ecosystem model of [32], while sediment POC is calculated in the FANTOM. The initial condition was established by spinning the model up from a cold start (zero concentrations everywhere in the water column and sediment) using 1995 atmospheric, open boundary and river concentrations. At the end of each 1 year run, concentrations were compared with available measurements and the model was spun up for another year until model concentrations were reasonable and the model was in a quasi-steady state, which required 24 yr of model spin up time.
The reader should note that a limited number of processes are included in the FANTOM model. Since the model is coupled offline, that is that atmospheric concentrations are used to force the ocean POP model but not in the other direction, volatilization effects are not included in the atmospheric POP model. Likewise, several processes, for example sea spray, are not included in the atmospheric POP model. This is another model limitation; we are presently working on developing an online coupled atmosphere-ocean POP model.
Both models have been validated with available observational data for the North Sea model domain [8]. Model results have been shown to be in very satisfactory agreement with available observations. Concerning γ-HCH and PCB 153 data, observations are limited to just a number of points around the North Sea perimeter, while concentrations were generally measured in the summer months only [8]. Therefore, validation was accomplished by comparing time series of model concentrations with measurements at the same point. For γ-HCH, model concentrations in water decrease from a maximum between 1996 and 1998 after which there is a downward trend toward the end of the time series in 2005. Maximum measured concentrations are found in 1997, decrease in 1999, decreasing further towards the end of the time series. In sediment, highest concentrations are generally found up to 1999, trending downwards after 2000. Observed values are slightly higher before 2000 but follow a downward trend thereafter, and are in generally very good agreement with observations. Concerning PCB 153 in the water column, concentrations decrease slowly throughout the time series, while measurements follow the same pattern and model concentrations are in excellent agreement with measured values. In sediment, PCB 153 model values are also in excellent agreement with observed concentrations.
Concerning model confidence, model validation shows that we can expect the model to diligently reproduce measured values with reasonable accuracy, so we say we have good confidence in the model. However, we can expect the model to repeat only those processes described by the model, so the model has its limitations, as do all models. For example, as mentioned above, the model will underestimate volatilization due to the coarseness and time step of the wind reanalysis product, and due to limited processes.

3. Results and Discussion

3.1. Gas Deposition

3.1.1. γ-HCH
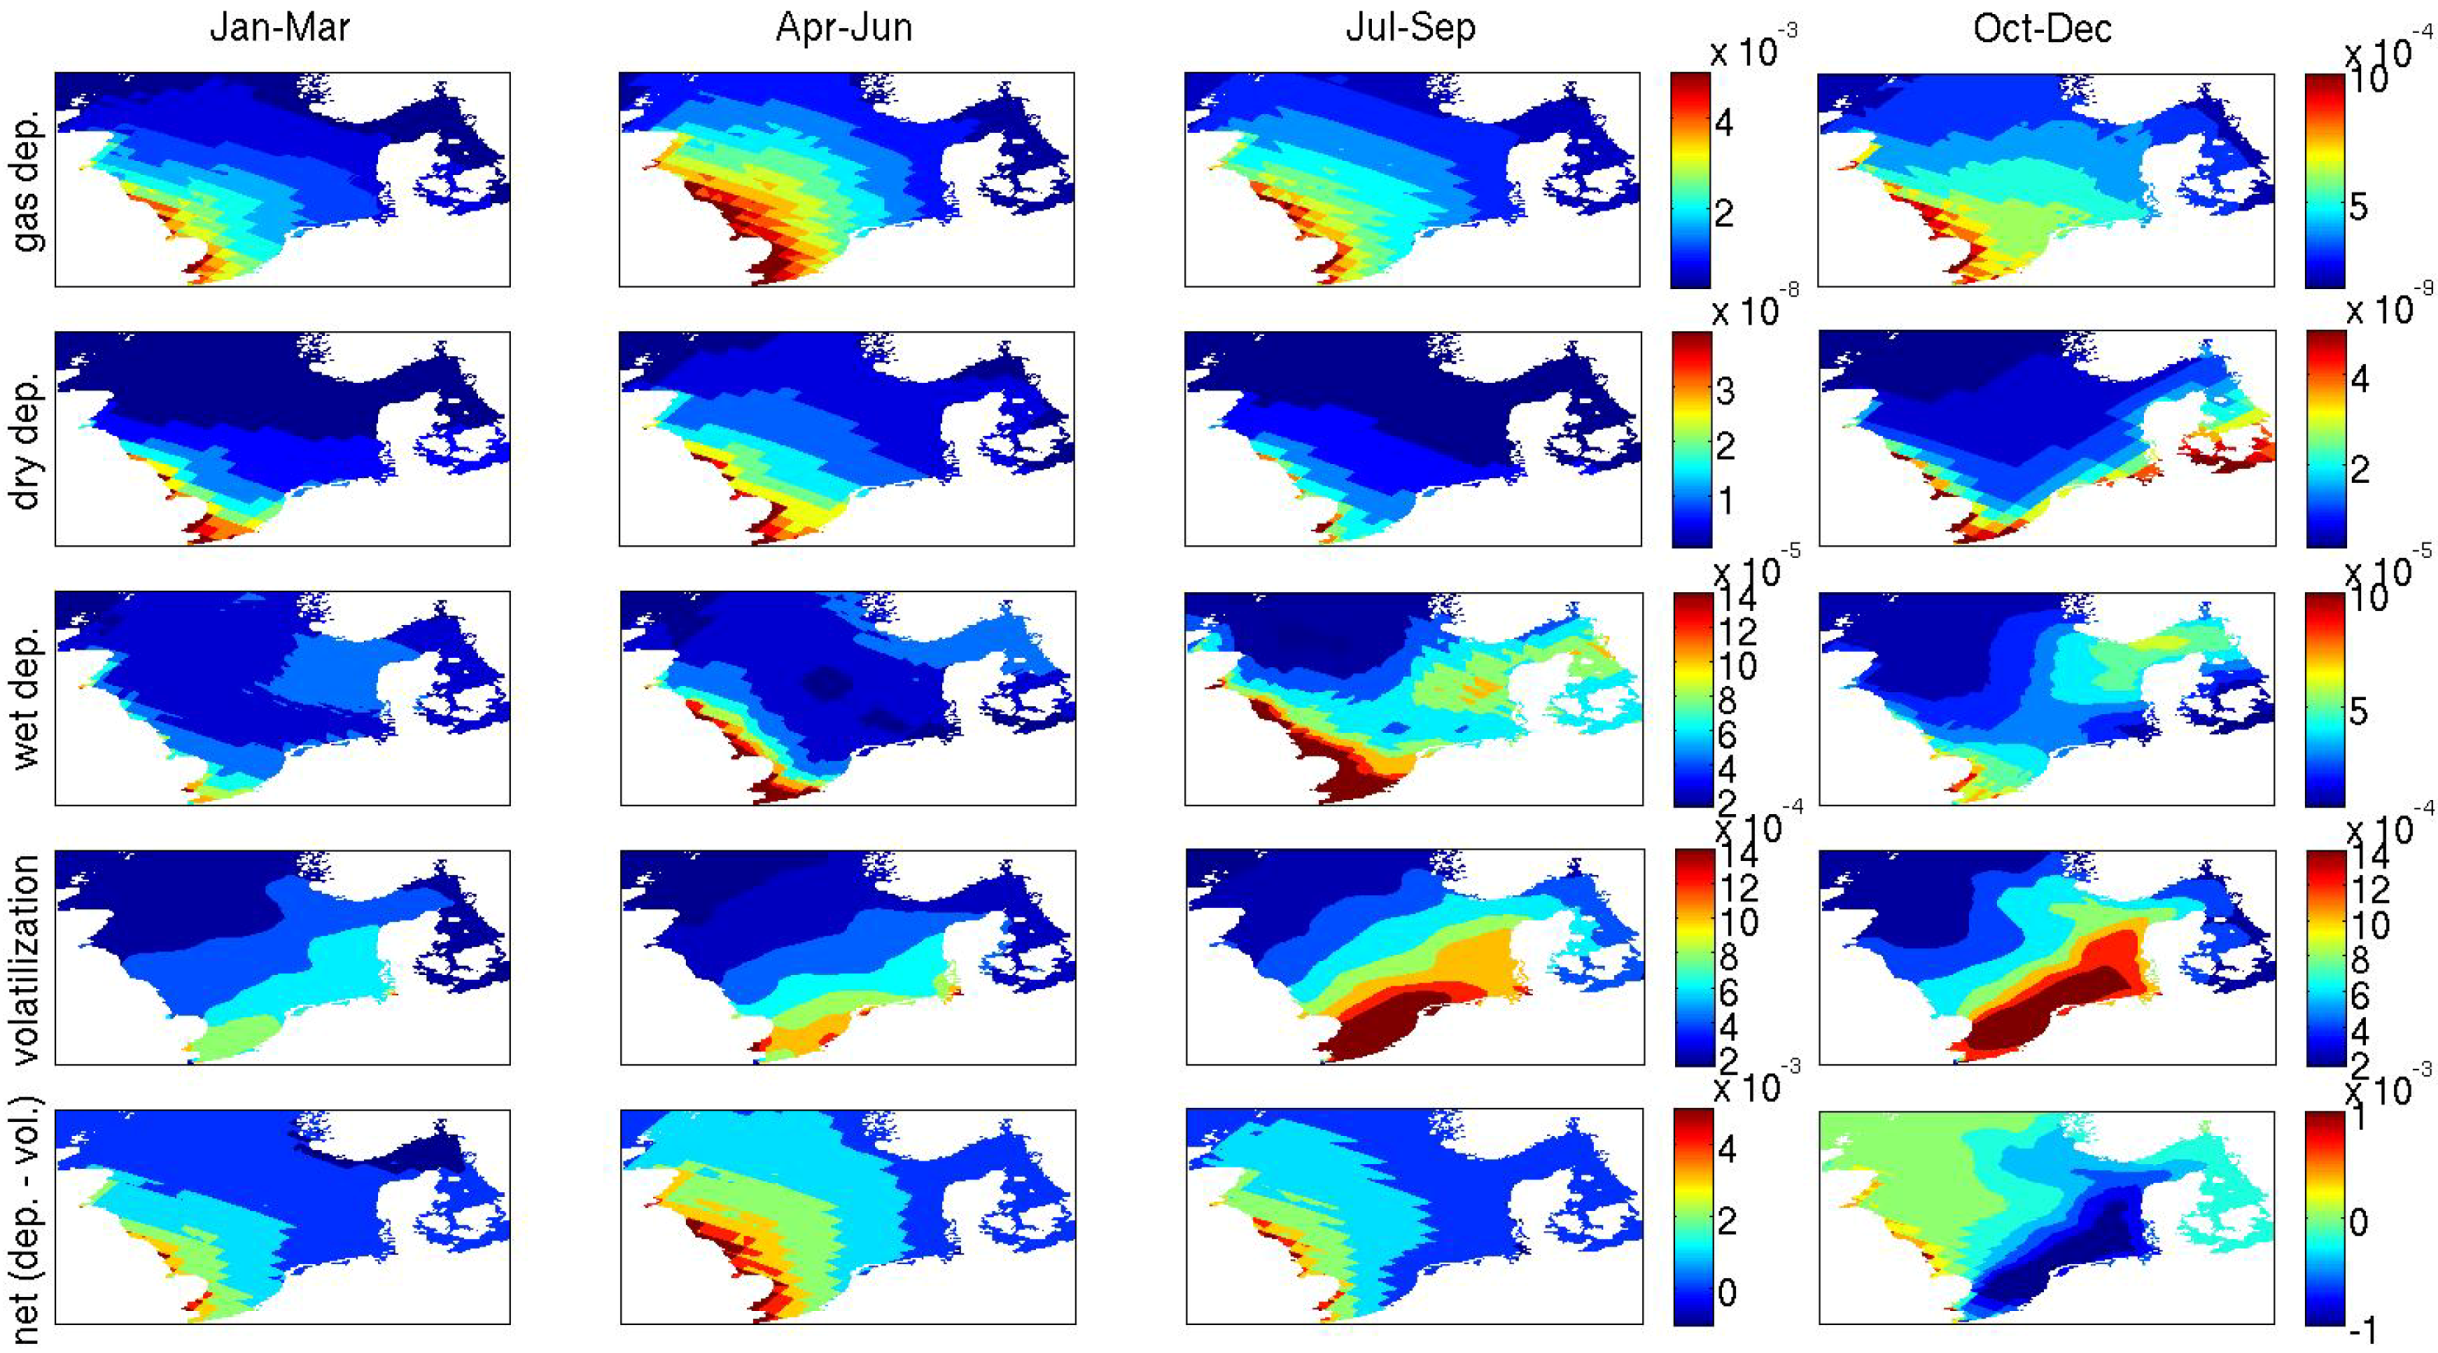
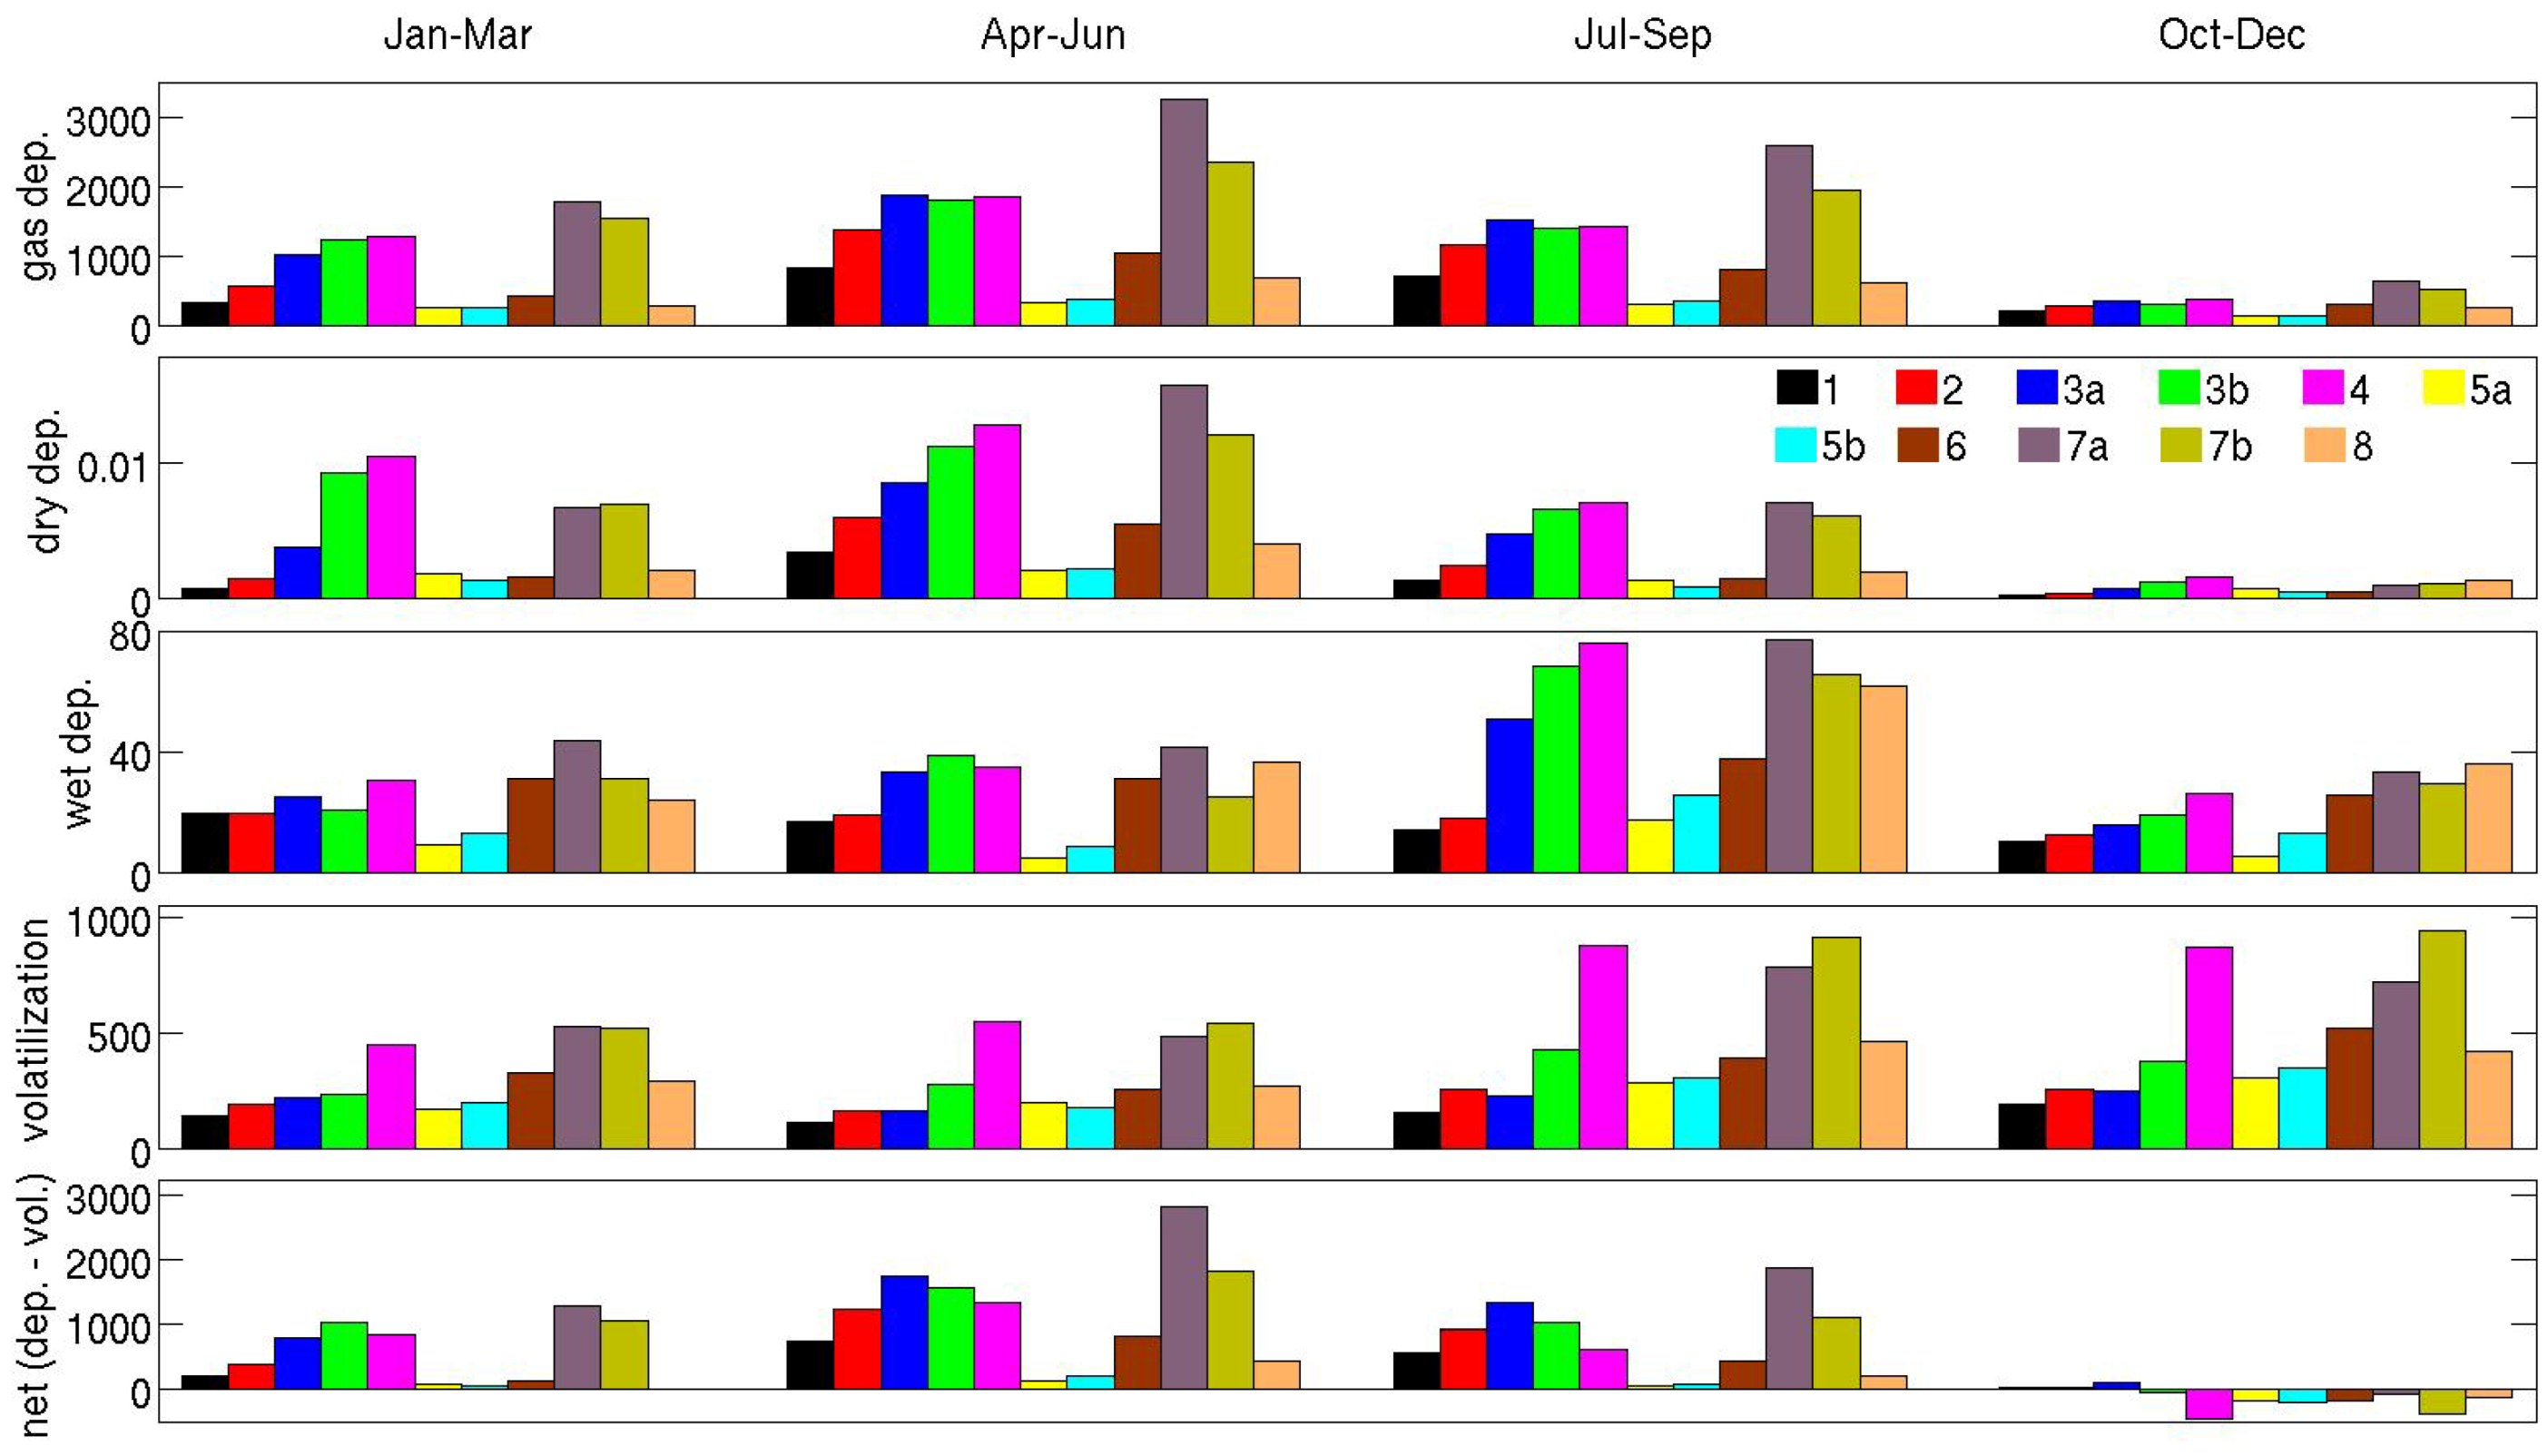
Gas deposition of γ-HCH is greatest in the western North Sea, with highest rates found adjacent to the British coast, extending southward to the French and Belgian coastlines (Figure 2, Figure 3 and Figure 4 top panels). Rates decrease to the east and north of Britain with smallest values found around the Norwegian coast and into the Skagerrak and Kattegat regions. There is notable seasonal variability with highest values found in spring (April–June) with rates, on average, in excess of 10−2 (ng∙m−2∙s−1) to the east of Britain, decreasing to values of ~5 × 10⁻³ (ng∙m−2∙s−1) in the central North Sea and ~10−3 (ng∙m−2∙s−1) around the Norwegian coast area and less in the Skagerrak and Kattegat regions. Rates decrease by factors of around 2, 3–4 and 5–10 in summer (July–September), winter (January–March) and autumn (October–December), respectively. Relative to 1996, rates are generally decreased by factors of around 2 in 2000 and 5 in 2004.
Figure 2. Distributions of quarterly (3 month) averaged rates of gas deposition (top row), dry deposition (2nd row), wet deposition (3rd row), volatilization (4th row), and net air-sea exchange (bottom row) for γ-HCH in 1996. Rates are in (ng∙m−2∙s−1). Note: colorbar scales shown on 3rd column panels are used in connection with the left 3 panels. Note the change in scales for autumn (right figures), which are reduced relative to winter, spring and summer. Scales vary from row to row.
Atmosphere 05 00156 g002
Figure 3. Distributions of quarterly (3 month) averaged rates of gas deposition (top row), dry deposition (2nd row), wet deposition (3rd row), volatilization (4th row), and net air-sea exchange (bottom row) for γ-HCH in 2000. Rates are in (ng∙m−2∙s−1). Note: colorbar scales shown on 3rd column panels are used in connection with the left 3 panels. Note the change in scales for autumn (right figures), which are reduced relative to winter, spring and summer. Scales vary from row to row.
Atmosphere 05 00156 g003
Figure 4. Distributions of quarterly (3 month) averaged rates of gas deposition (top row), dry deposition (2nd row), wet deposition (3rd row), volatilization (4th row), and net air-sea exchange (bottom row) for γ-HCH in 2004. Rates are in (ng∙m−2∙s−1). Note: colorbar scales shown on 3rd column panels are used in connection with the left 3 panels. Note the change in scales for autumn (right figures), which are reduced relative to winter, spring and summer. Scales vary from row to row.
Atmosphere 05 00156 g004
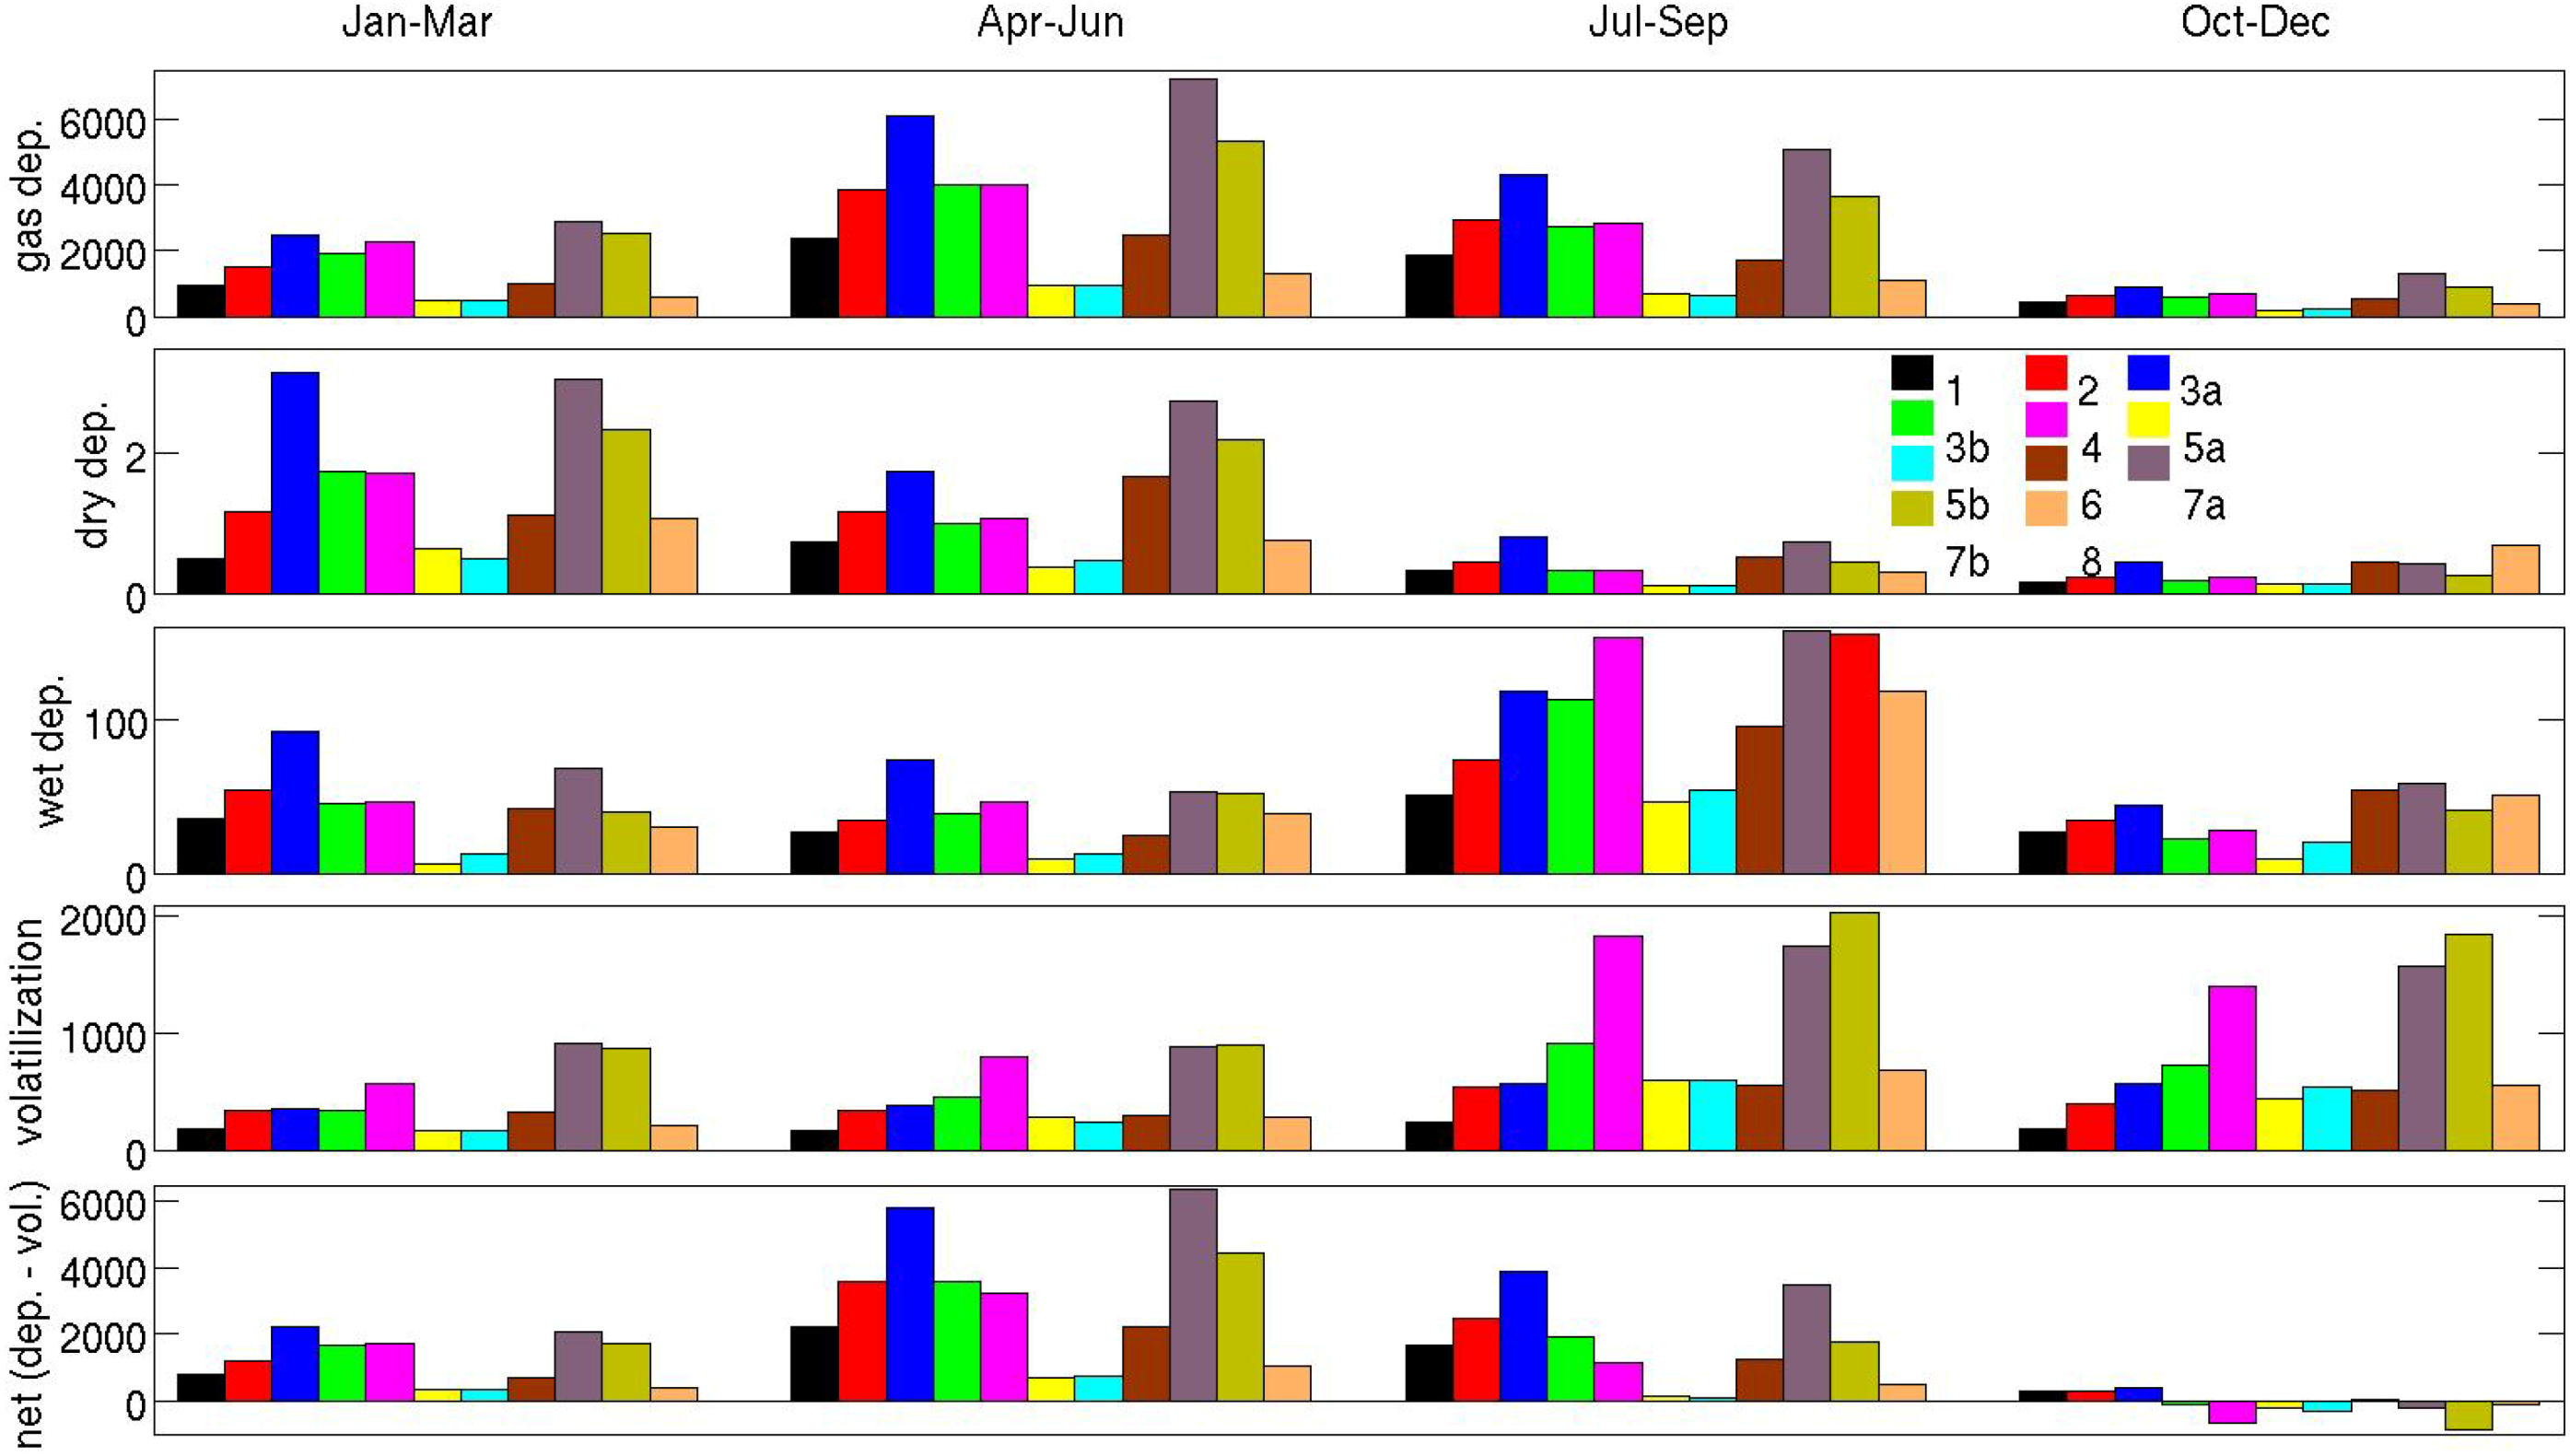
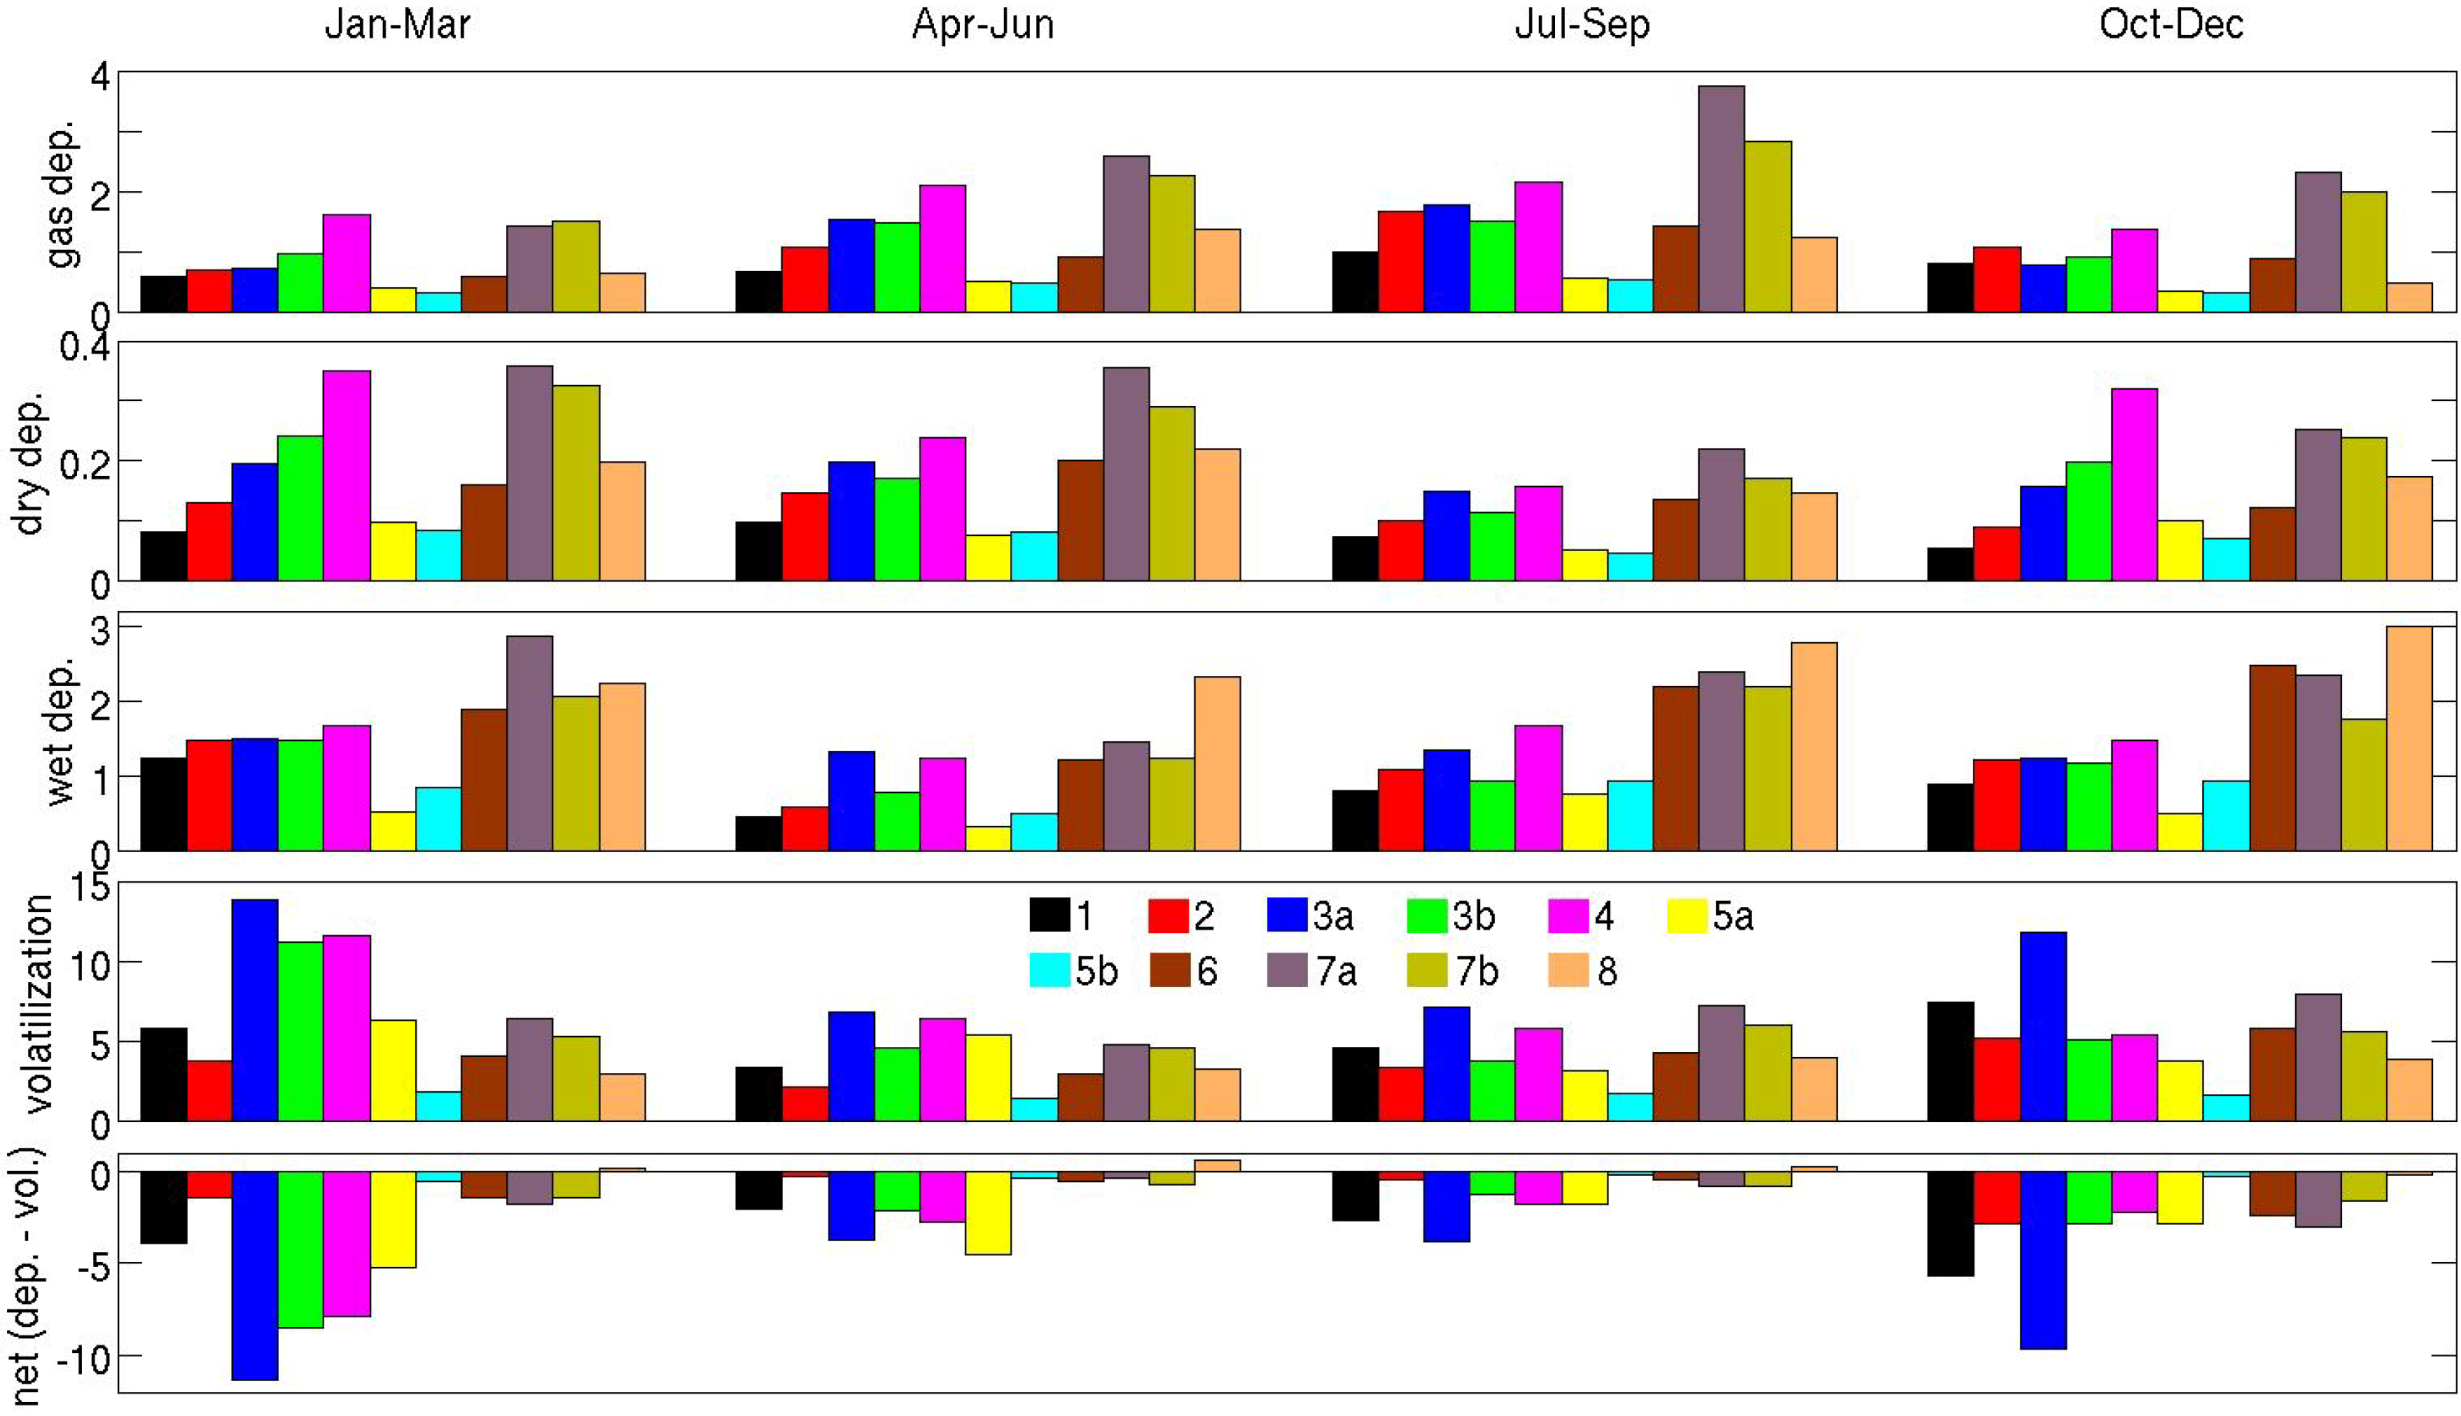
Figure 5. Bar charts of integrated quarterly (3 month) fluxes (kg) by ICES boxes (Figure 1) of γ-HCH in 1996: gas deposition (top row), dry deposition (2nd row), wet deposition (3rd row), volatilization (4th row), and net air-sea exchange (bottom row).
Atmosphere 05 00156 g005
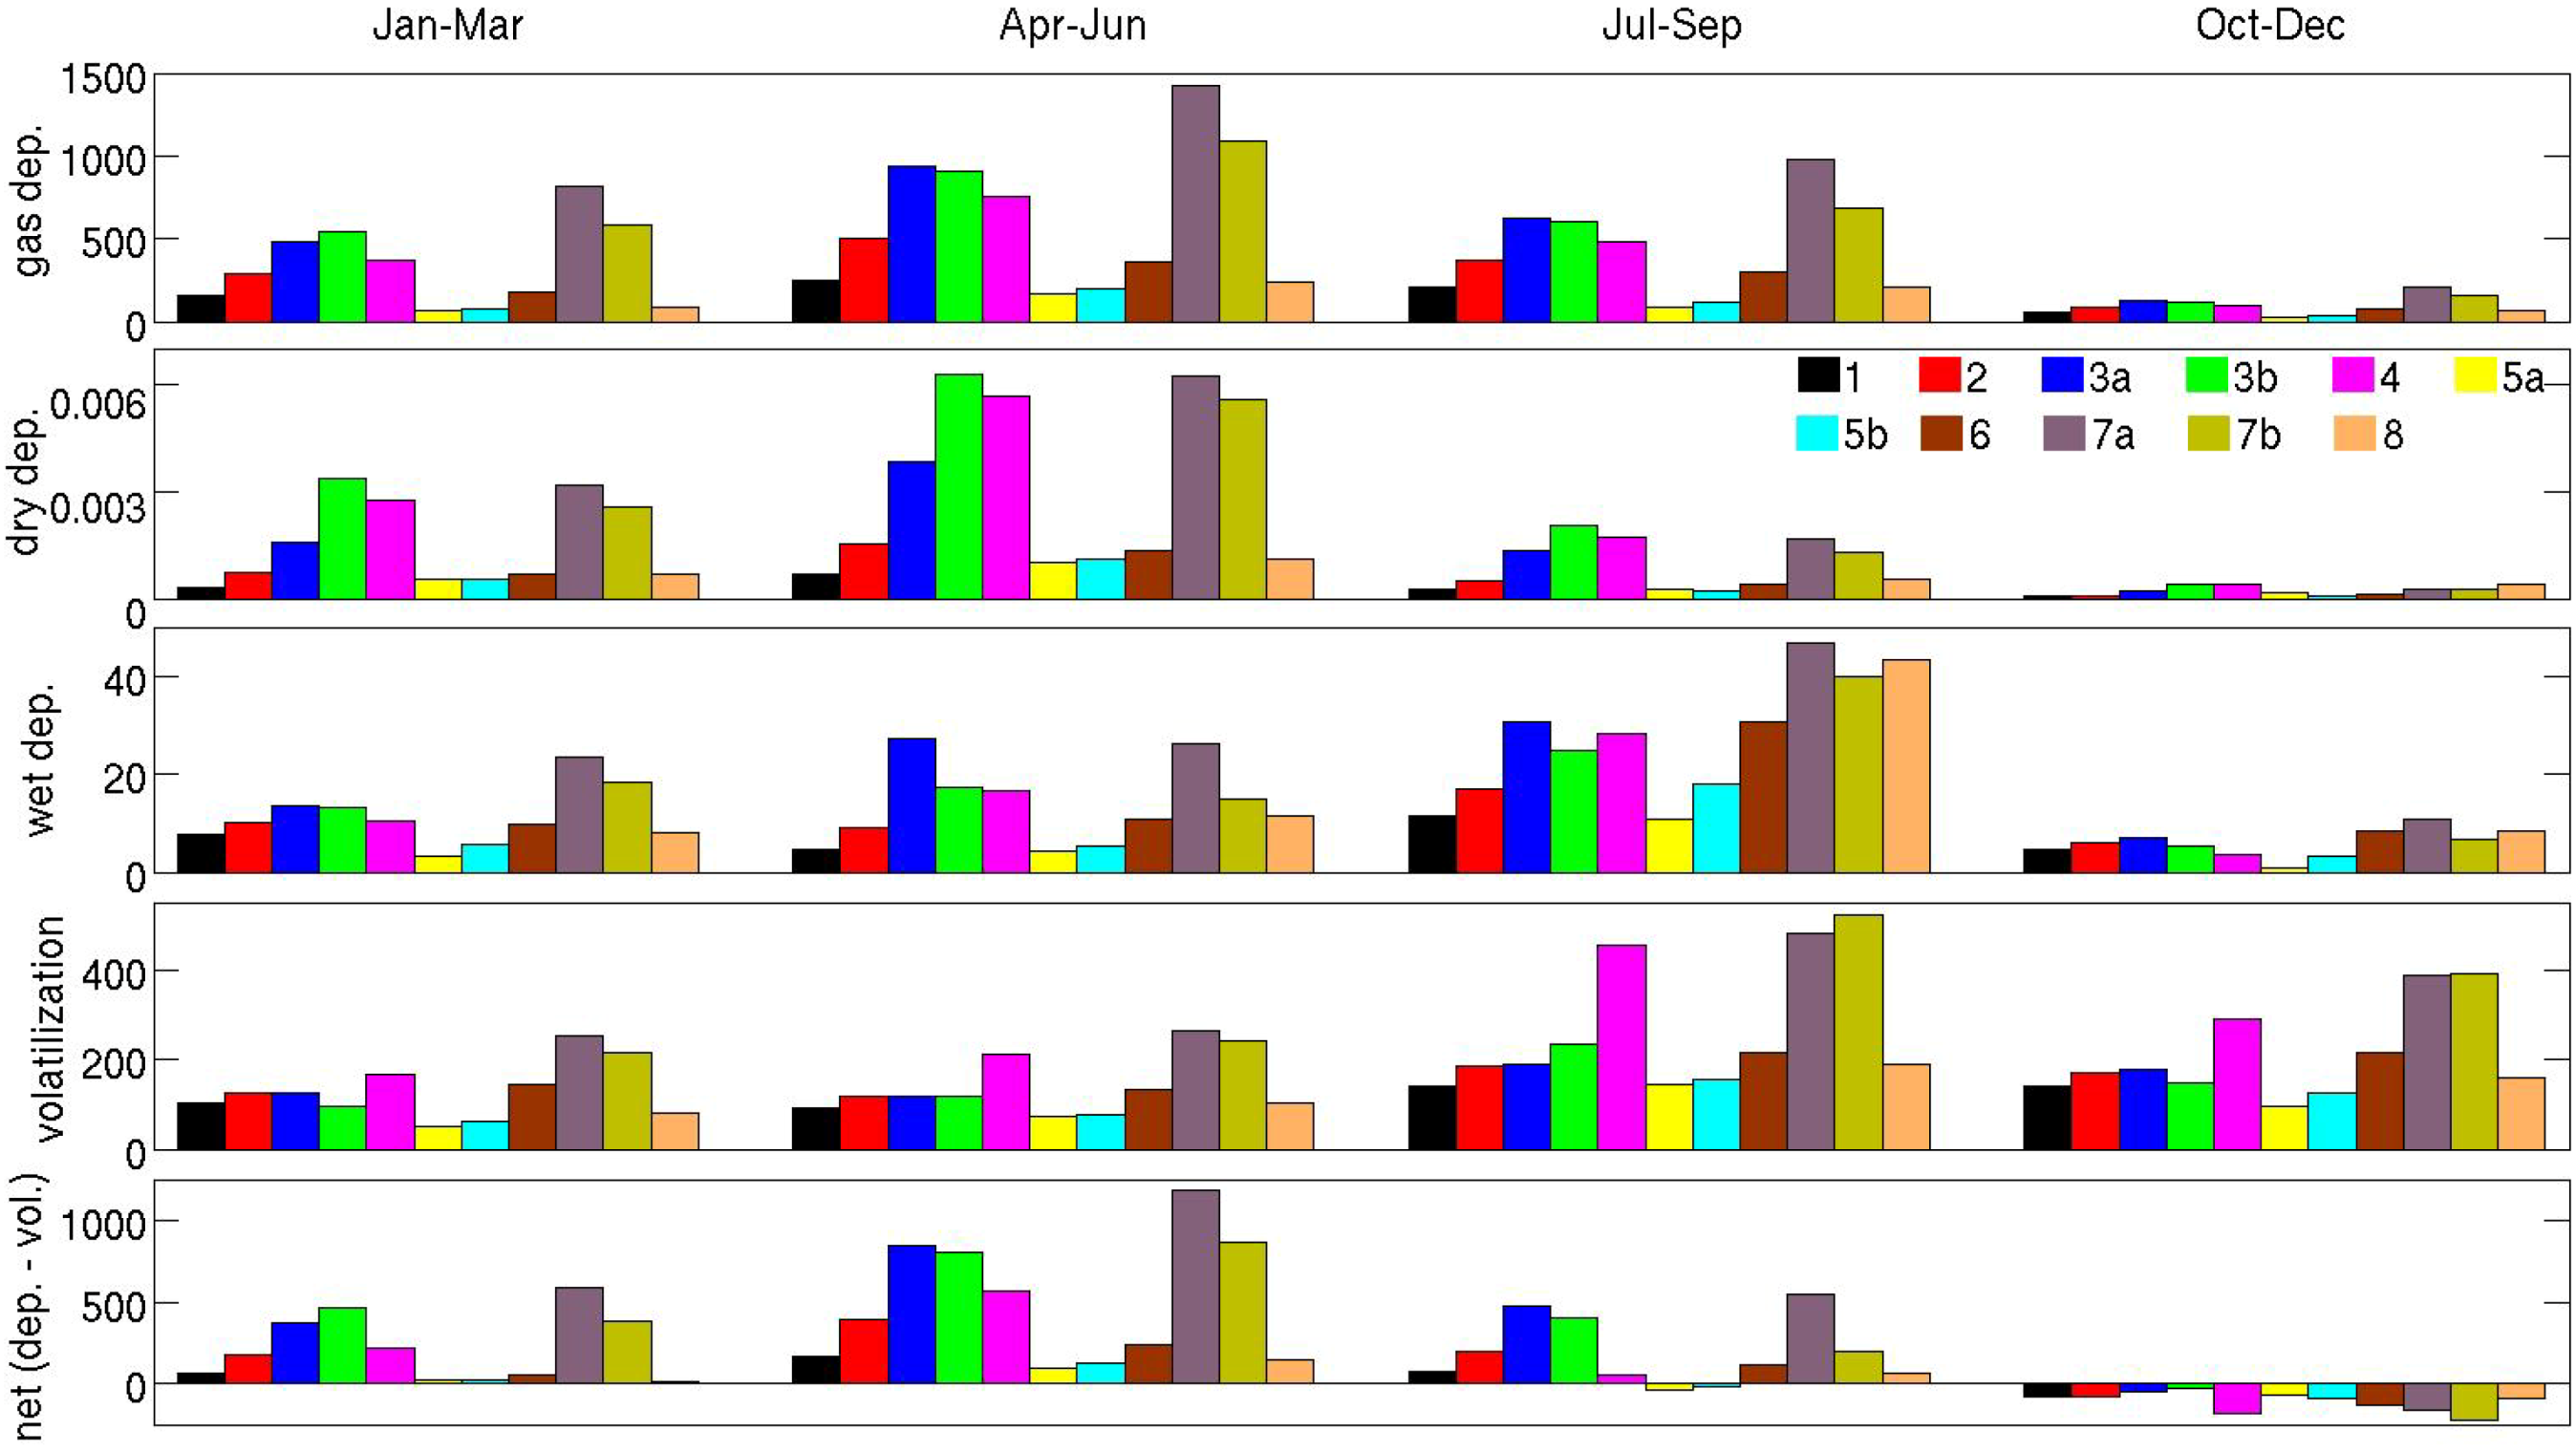
Figure 6. Bar charts of integrated quarterly (3 month) fluxes (kg) by ICES boxes (Figure 1) of γ-HCH in 2000: gas deposition (top row), dry deposition (2nd row), wet deposition (3rd row), volatilization (4th row), and net air-sea exchange (bottom row).
Atmosphere 05 00156 g006
Near surface atmospheric gas concentrations and distributions of γ-HCH, interpolated into the model domain from the 50 km EMEP grid [1], are highest in spring and summer (slightly higher in summer), with greatest values of over 2, ~1.5 and less than 1 (ng∙m−3) found in 1996, 2000 and 2004, respectively, extending from the southern half of the east British coast to the French and Belgian coastlines (not shown). Factors are generally reduced by factors of 2–3 and 3–5 in winter and autumn, respectively. Distributions do not change much over the 10 year period, reflecting highest atmospheric concentrations over Britain and France (not shown) [33,34]. The high concentrations over the western North Sea are due to the predominantly westerly (to southwesterly) winds [13,14] carrying the POP over land, primarily France and Britain, out to sea.
Figure 7. Bar charts of integrated quarterly (3 month) fluxes (kg) by ICES boxes (Figure 1) of γ-HCH in 2004: gas deposition (top row), dry deposition (2nd row), wet deposition (3rd row), volatilization (4th row), and net air-sea exchange (bottom row).
Atmosphere 05 00156 g007
Although deposition rates in spring are twice those in summer, atmospheric concentrations are similar in spring and summer. This reflects the fact that deposition rates are not proportional to atmospheric concentrations but that air-sea exchange chemical equilibrium of the POP is a non-linear and complicated function of wind speed, air and water temperature, concentration of the chemical in air and water, and physico-chemical properties of the substance (see details in Equations (1–3) above). For the North Sea, winds are strongest in winter, least in summer, and greater in autumn than in spring [13,14], water and air temperatures are greatest in summer and least in winter [8,13], while concentrations in water are greatest in summer [8].
Considering the North Sea ICES boxes, gas deposition in box 7a is always greatest (Figure 5, Figure 6 and Figure 7 top panels), which is reasonable since it is the largest area (Figure 1, Table 1), and covers a region that experiences relatively high gas deposition rates. In spring 1996, total mass deposition in 7a is over 7200 kg, followed by 6100 kg in 3a and 5300 kg in 7b. Deposition in 3a exceeds 7b throughout 1996 but is less in the following years because of relatively less gas concentrations off the north coast of Britain (not shown [1]). Boxes 2, 3b and 4 each receive about 4000 kg due to gas deposition in spring 1996. After 1996, fluxes into 2 are decreased relative to 3b and 4, again because of reduced concentrations off the north British coast. Boxes 1 and 6 receive around 2000 kg in spring 1996, while 5a and 5b receive less than 1000 kg and 8 receives 1300 kg. These ratios remain fairly steady throughout the simulation period.
Table 1. North Sea ICES box numbers with areas.
Box Number123a345a5b67a7b8
Area (km2)23,56629,99531,40416,11325,31410,41511,85532,88552,55437,94331,961

3.1.2. PCB 153

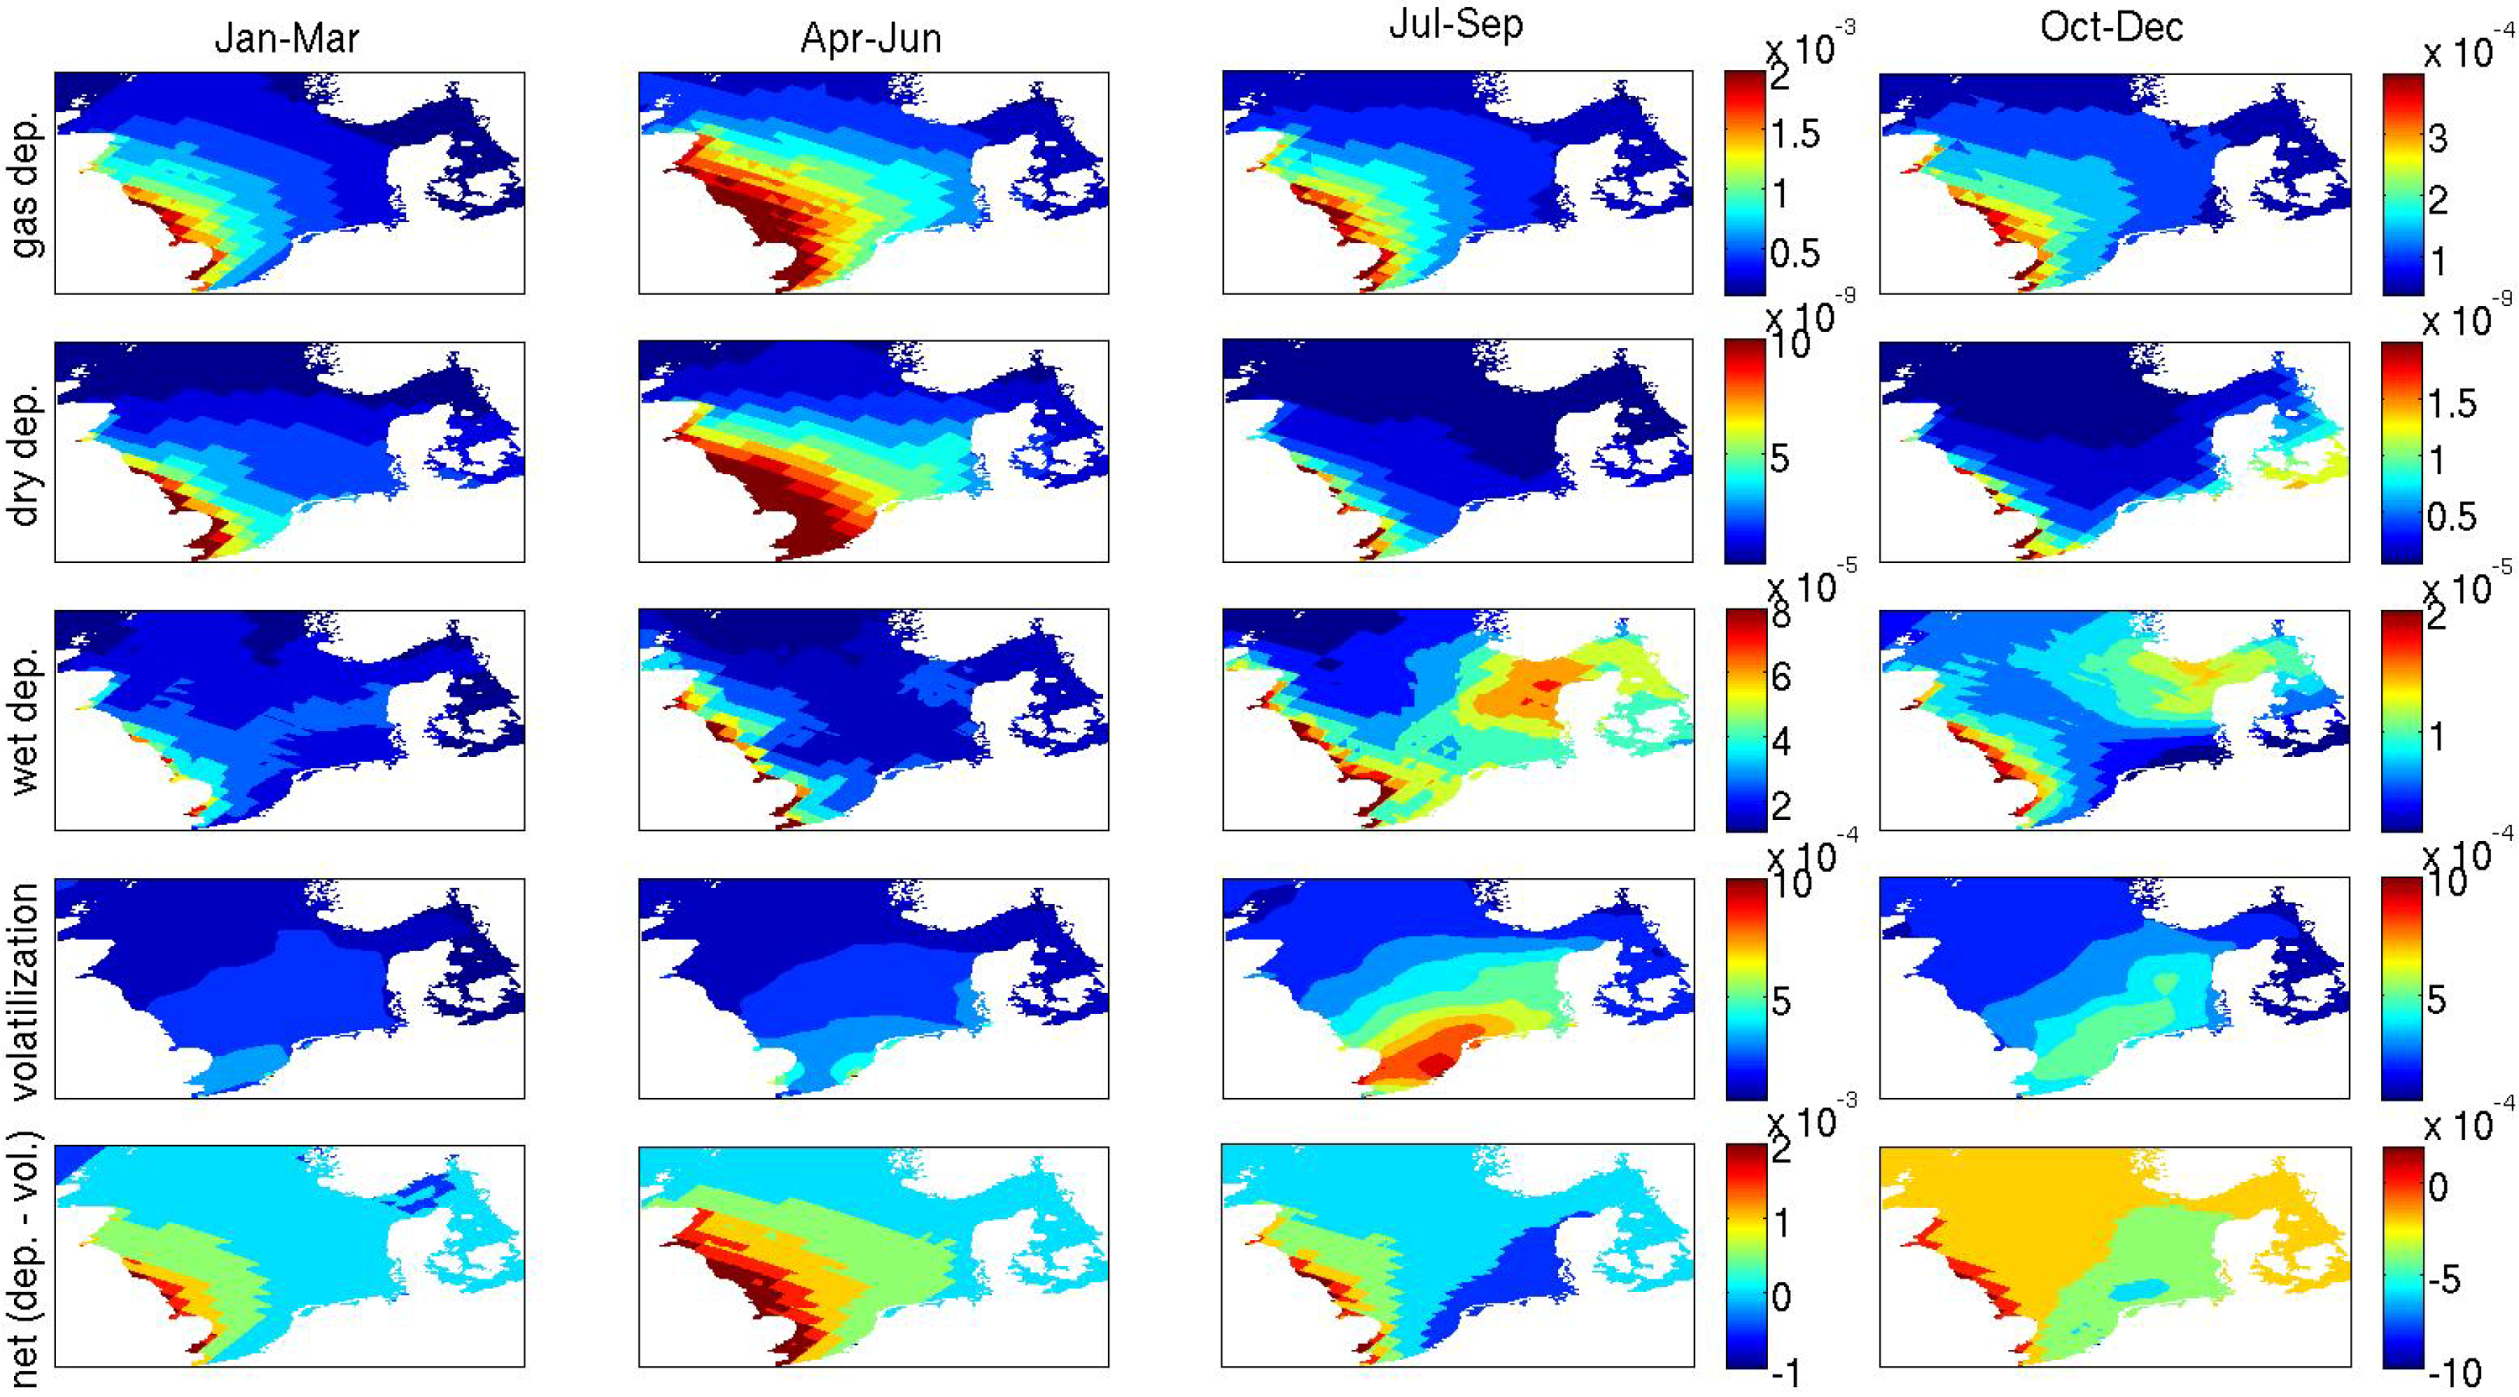
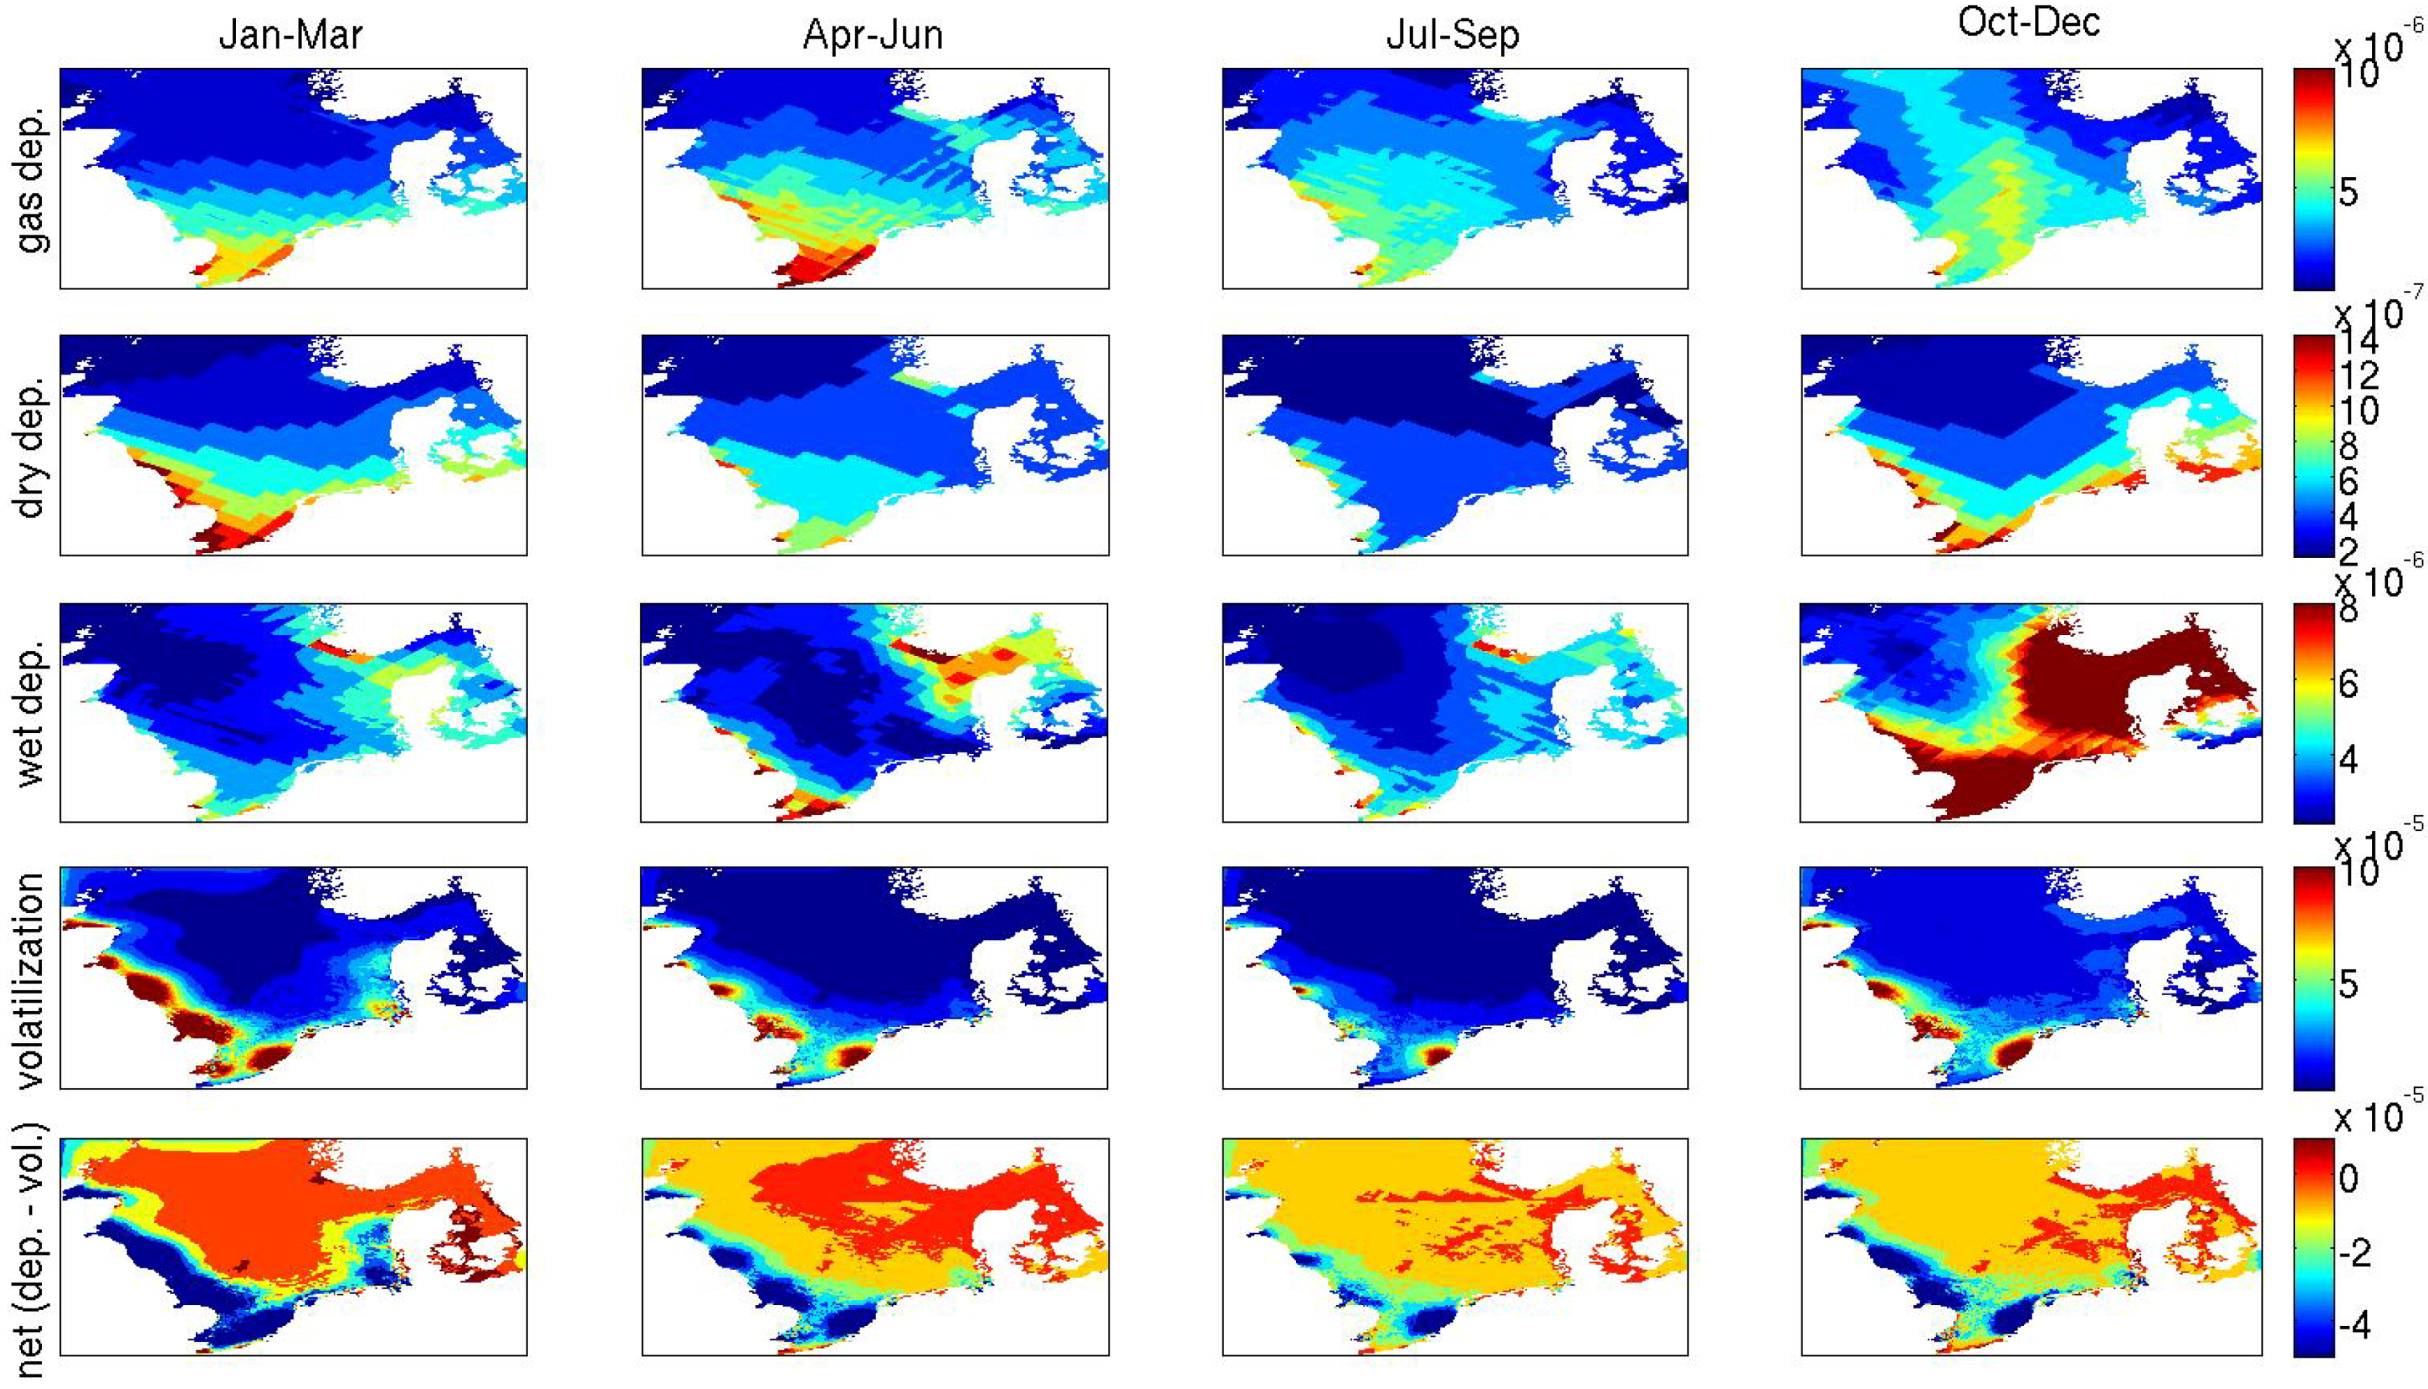
Distributions of gas deposition for PCB 153 are fairly similar throughout the year, with highest rates found in the southern and central North Sea, decreasing in the north and, generally, around the Skagerrak and Kattegat regions (Figure 8, Figure 9, Figure 10 and Figure 11 top panels). In 1996, maximum rates of 10−5 (ng∙m−2∙s−1) or more are found off the southern British coast, particularly off East Anglia, and extend to the Dutch coast in winter and spring. The highest values are found in the central North Sea in summer. Rates are somewhat reduced in 2000 and by a factor of 2 in 2004, relative to 1996.
Figure 8. Distributions of quarterly (3 month) averaged rates of gas deposition (top row), dry deposition (2nd row), wet deposition (3rd row), volatilization (4th row), and net air-sea exchange (bottom row) for PCB 153 in 1996. Rates are in (ng∙m−2∙s−1). Note: colorbar scales shown on 3rd column panels are used in connection with the left 3 panels. Note the change in scales for autumn (right figures), which are reduced relative to winter, spring and summer. Scales vary from row to row.
Atmosphere 05 00156 g008
Figure 9. Distributions of quarterly (3 month) averaged rates of gas deposition (top row), dry deposition (2nd row), wet deposition (3rd row), volatilization (4th row), and net air-sea exchange (bottom row) for PCB 153 in 2000. Rates are in (ng∙m−2∙s−1). Note: colorbar scales shown on 3rd column panels are used in connection with the left 3 panels. Note the change in scales for autumn (right figures), which are reduced relative to winter, spring and summer. Scales vary from row to row.
Atmosphere 05 00156 g009
Figure 10. Distributions of quarterly (3 month) averaged rates of gas deposition (top row), dry deposition (2nd row), wet deposition (3rd row), volatilization (4th row), and net air-sea exchange (bottom row) for PCB 153 in 2004. Rates are in (ng∙m−2∙s−1). Note: colorbar scales shown on 3rd column panels are used in connection with the left 3 panels. Note the change in scales for autumn (right figures), which are reduced relative to winter, spring and summer. Scales vary from row to row.
Atmosphere 05 00156 g010
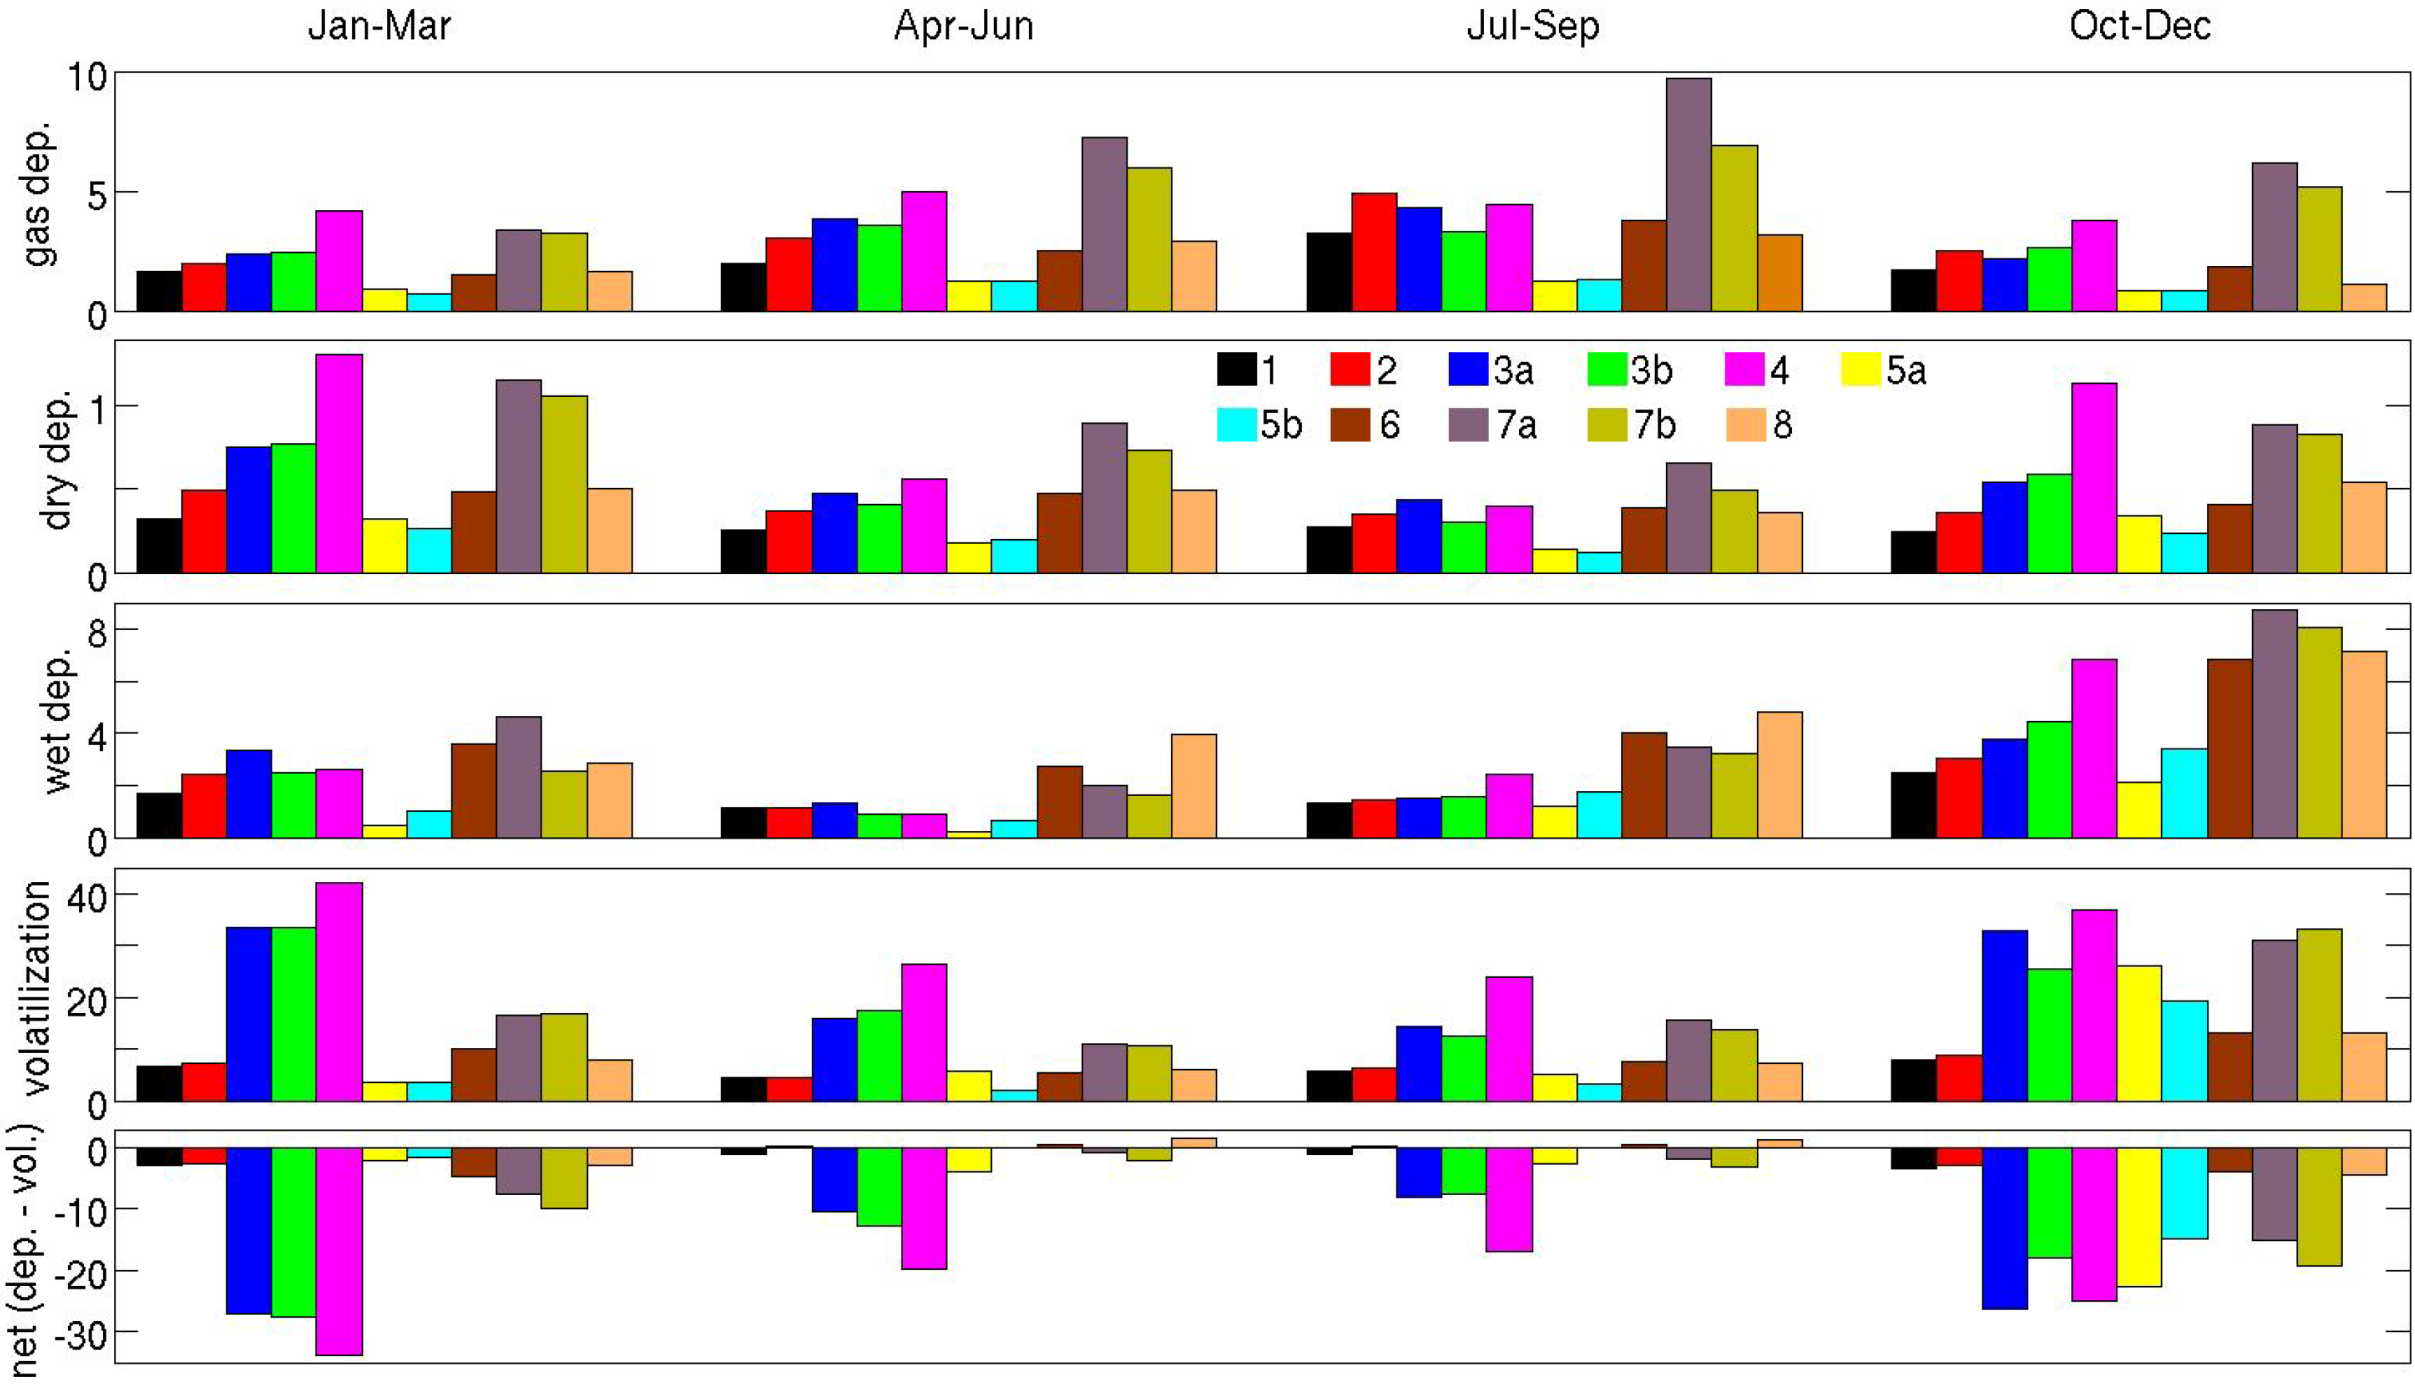
Figure 11. Bar charts of integrated quarterly (3 month) fluxes (kg) by ICES boxes (Figure 1) of PCB 153 in 1996: gas deposition (top row), dry deposition (2nd row), wet deposition (3rd row), volatilization (4th row), and net air-sea exchange (bottom row).
Atmosphere 05 00156 g011
Figure 12. Bar charts of integrated quarterly (3 month) fluxes (kg) by ICES boxes (Figure 1) of PCB 153 in 2000: gas deposition (top row), dry deposition (2nd row), wet deposition (3rd row), volatilization (4th row), and net air-sea exchange (bottom row).
Atmosphere 05 00156 g012
Atmospheric distributions of PCB 153 are similar throughout the year with highest values generally found off the southern British coast and extending to the IJsselmeer, with greatest concentrations in summer, decreasing by factors of 1.5, 2–3 and 5–10 in spring, autumn and winter (not shown), respectively [1]. The relatively high deposition rates in the southernmost part of the domain in winter are due to strong winds, which lead to increased transfer coefficients.
Figure 13. Bar charts of integrated quarterly (3 month) fluxes (kg) by ICES boxes (Figure 1) of PCB 153 in 2004: gas deposition (top row), dry deposition (2nd row), wet deposition (3rd row), volatilization (4th row), and net air-sea exchange (bottom row).
Atmosphere 05 00156 g013
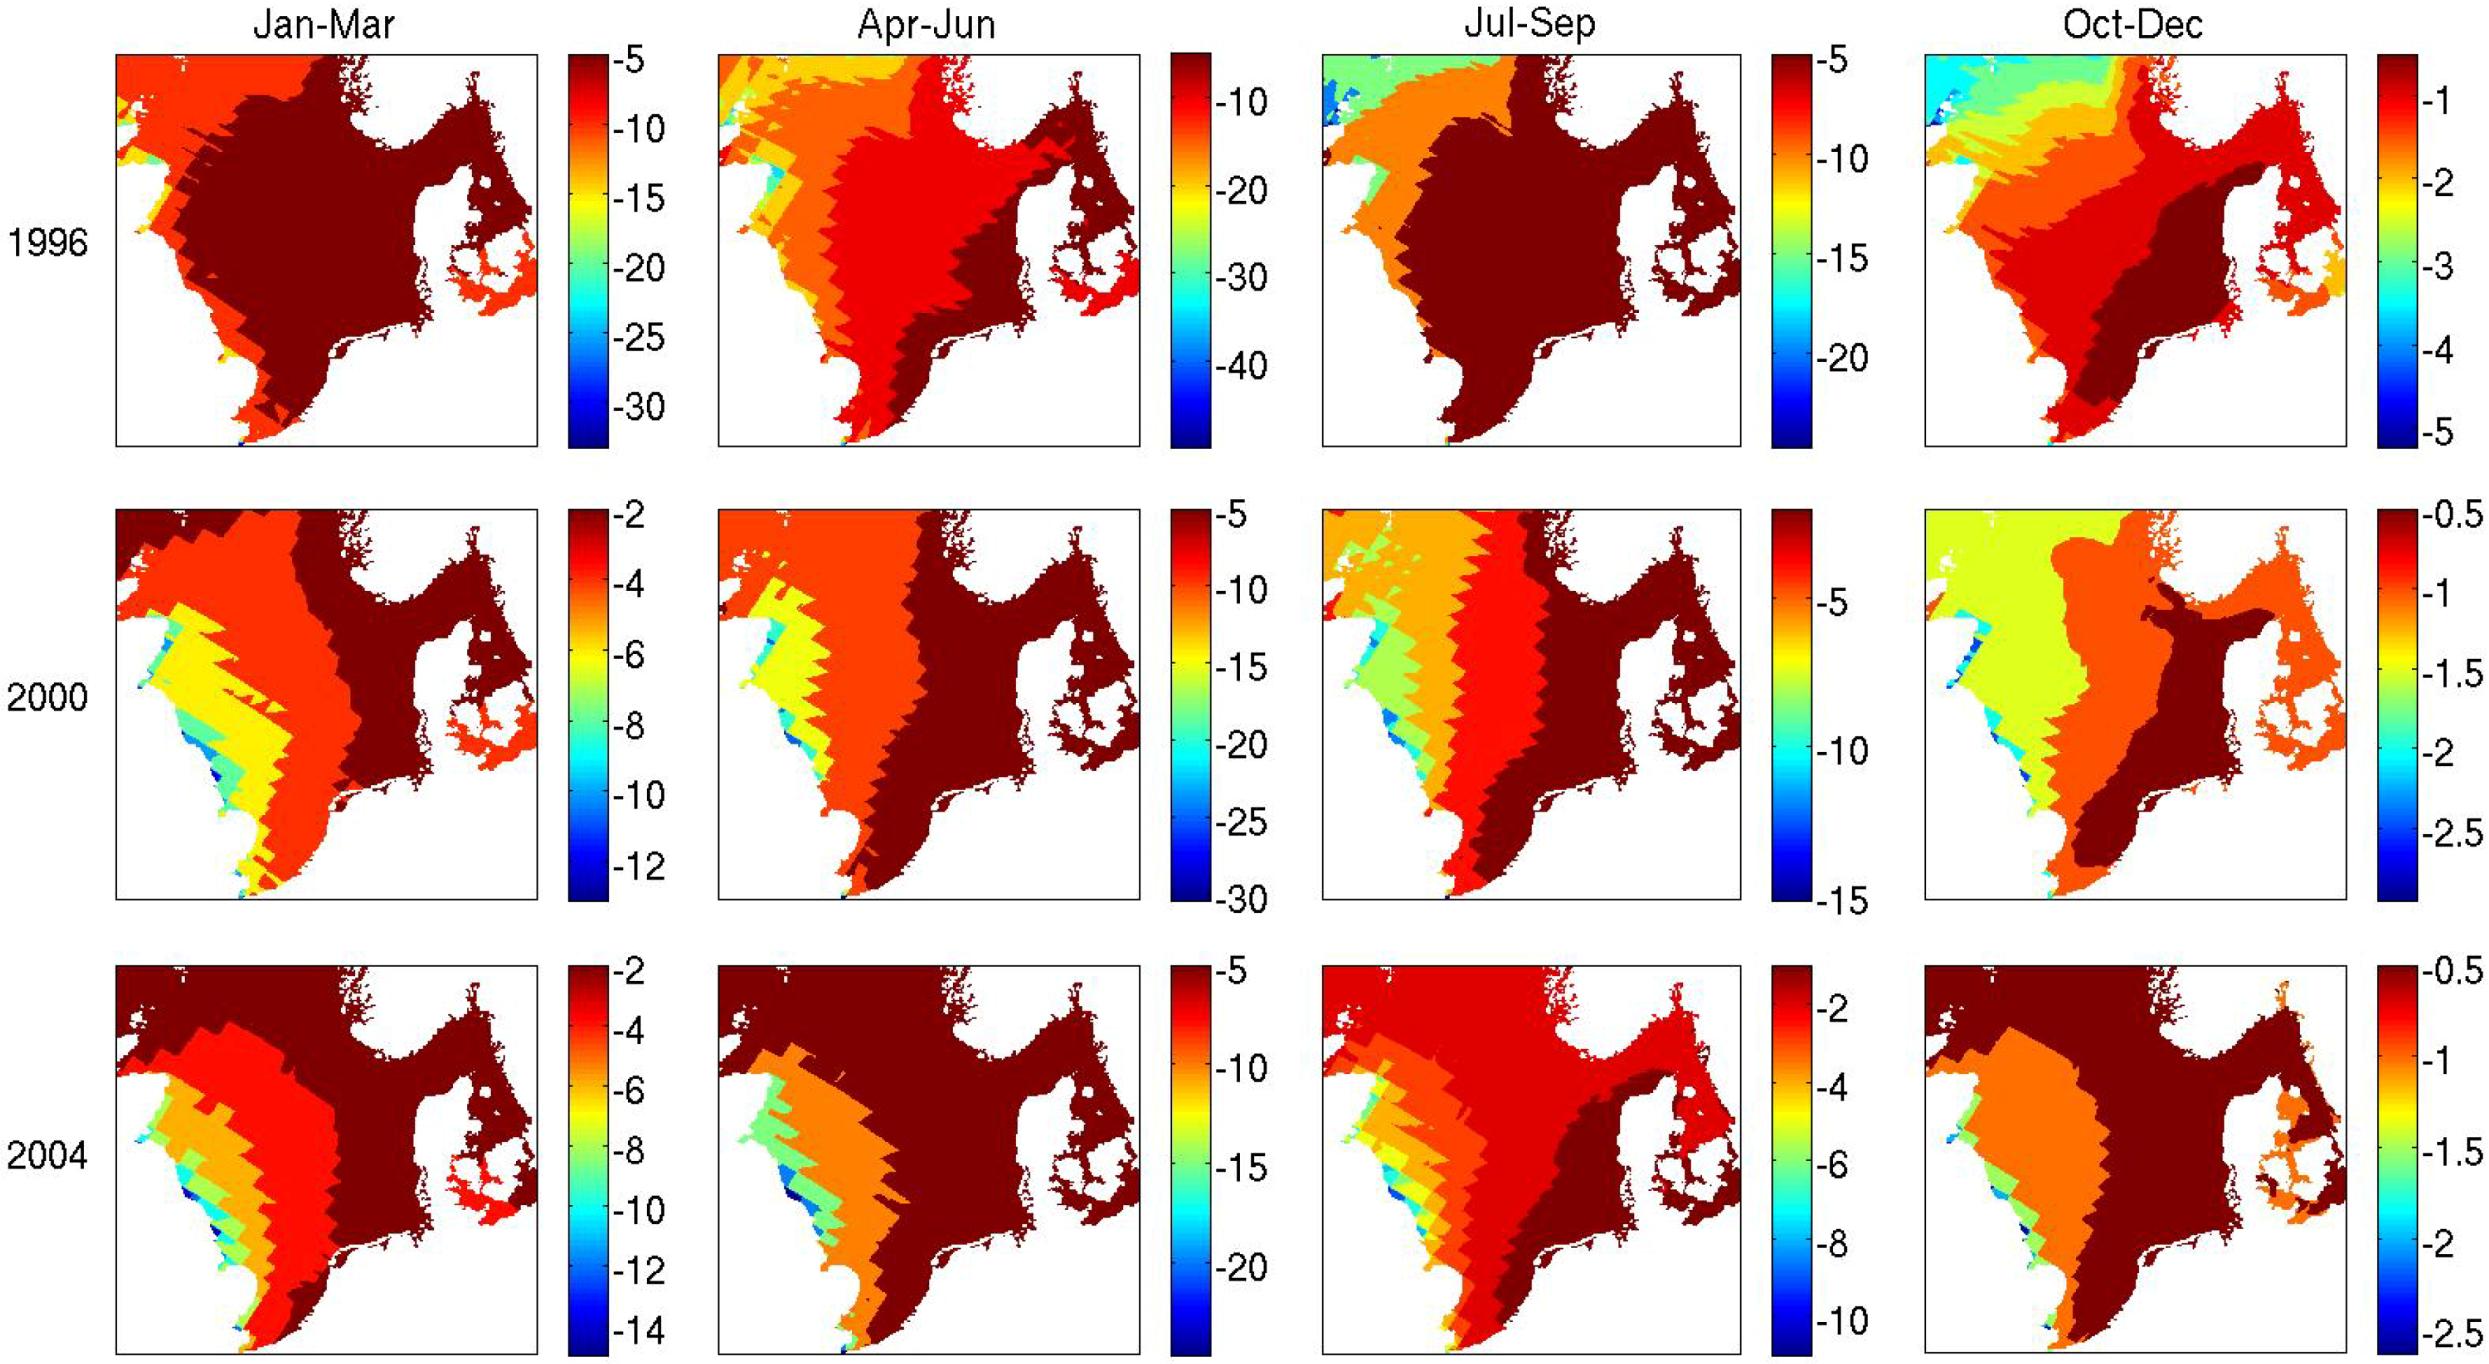
Figure 14. Distributions of quarterly (3 month) averaged fugacity ratios for γ-HCH in 1996, 2000 and 2004, calculated as minus the ratio of gas deposition to volatilization.
Atmosphere 05 00156 g014
Concerning the ICES boxes, deposition is greatest in box 7a in spring, summer and autumn, followed by 7b, while deposition in 4 is greatest in winter (Figure 12, Figure 13 and Figure 14 top panels), also reflecting the impact of winter winds.

3.2. Dry Deposition

3.2.1. γ-HCH
Dry deposition is greatest in winter and spring and least in autumn (Figure 2, Figure 3, Figure 4, Figure 5, Figure 6 and Figure 7 second row panels). Deposition distributions are similar to those for γ-HCH gas deposition in winter, spring and summer, whereas in autumn rates are highest in most coastal areas including the Kattegat area and, particularly in 1996, the Skagerrak and Norwegian and Swedish coastal areas. Deposition rates are proportional to atmospheric concentrations of γ-HCH on aerosols (not shown [1,30,31]), which is to be expected since the flux is a product of the concentration times a dry deposition velocity. Deposition rates are generally three orders of magnitude or more less than gas deposition in 1996, are reduced by a further two orders of magnitude in 2000 and by another factor of two in 2004. Concerning ICES boxes, deposition is greatest in boxes 3a, 7a and 7b in 1996. By 2000, deposition in 3b and 4 are similar to 7a and 7b while 3a has decreased somewhat. A similar situation is found in 2004.

3.2.2. PCB 153

Dry deposition of PCB 153 displays an annual cycle with lowest rates found in summer, increasing in autumn to maximum in winter, and decreasing in spring (Figure 8, Figure 9, Figure 10, Figure 11, Figure 12 and Figure 13 second panels). High values extend across the entire southern North Sea and into the Kattegat, and values decrease to the north. Total deposition is an order of magnitude less than dry deposition, and decreases by 30%–50% in 2000 from 1996 and by another 20%–30% in 2004. Highest deposition rates are usually found in ICES boxes 4, 7a and 7b in autumn and winter, and in 7a and 7b in spring and summer, which is reasonable given that atmospheric concentration of PCB 153 on aerosols is highest in coastal regions of the southern North Sea in autumn and winter but large values extend out into the central north sea in spring and summer [1,33].

3.3. Wet Deposition

3.3.1. γ-HCH
Wet deposition in precipitation is greatest in summer, about a factor of two greater than both winter and spring, and slightly greater again than in autumn (Figure 2, Figure 3, Figure 4, Figure 5, Figure 6 and Figure 7 third row panels). Concentrations of precipitation are highest in spring and summer and least in autumn (not shown, [1]). However, since wet deposition is the product of precipitation rate with atmospheric concentration (from both gas and particles), the higher precipitation rates in the summer months (they are least in spring, [13,14]), lead to the highest deposition rates occurring at this time. Deposition rates are an order of magnitude or more less than for gas deposition but at least two orders of magnitude greater than dry deposition. Relatively high rates are found adjacent to the British coast throughout the year, extending to the entire southern and eastern North Sea, in summer, including the Skagerrak and Kattegat regions, and extending offshore of the Norwegian coast in autumn.
Total depositions are somewhat reduced in 2000 relative to 1996, up to a factor of 2 in summer but less so in the other seasons, and then almost a factor of two in 2004 relative to 2000. Concerning the ICES boxes, the greatest depositional fluxes are generally found in 3a, 3b, 4, 6, 7a, 7b, and 8. Box 3a has the greatest flux in winter and spring 1996 but decreases relatively thereafter due to decreased fluxes adjacent to the Scottish coast in the following years.

3.3.2. PCB 153

Wet deposition of PCB 153 occurs throughout the North Sea and is significant in all seasons, with highest rates found to the west and south of the Norwegian coast and to the east of the southern half of the British coast (Figure 8, Figure 9, Figure 10, Figure 11, Figure 12 and Figure 13 third panels). In 1996 and 2000, deposition rates were greatest in autumn, exceeding gas deposition, and they were similar in the other three seasons and throughout 2004, when they were about equal to gas deposition.
Regarding ICES boxes, the highest rates generally occur in boxes 6, 7a, 7b and 8. Although concentration in precipitation is fairly even distributed throughout the North Sea in different months and years, deposition in box 8 is usually highest. The high deposition rates in boxes 6 and 8 is due to the high rainfall levels around the Norwegian coast, generally twice or more greater than average North Sea precipitation rates [35].

3.4. Volatilization

3.4.1. γ-HCH

Volatilization rates of γ-HCH are generally greatest in summer and slightly less in autumn (when concentrations in water are highest [8]). They are lowest in winter and start to increase in spring, so a clear annual cycle is observed (Figure 2, Figure 3, Figure 4, Figure 5, Figure 6 and Figure 7 fourth row panels). They are a factor of 2–3 less than gas deposition in winter, spring and summer but greater in autumn. Rates are generally greatest in the south, extending from southern Britain to the French, Belgian, Dutch and German coasts, to the Wadden Sea in summer and autumn, decreasing as you move northward and into the Skagerrak and Kattegat. This area diminishes in winter and starts to expand again in the spring.
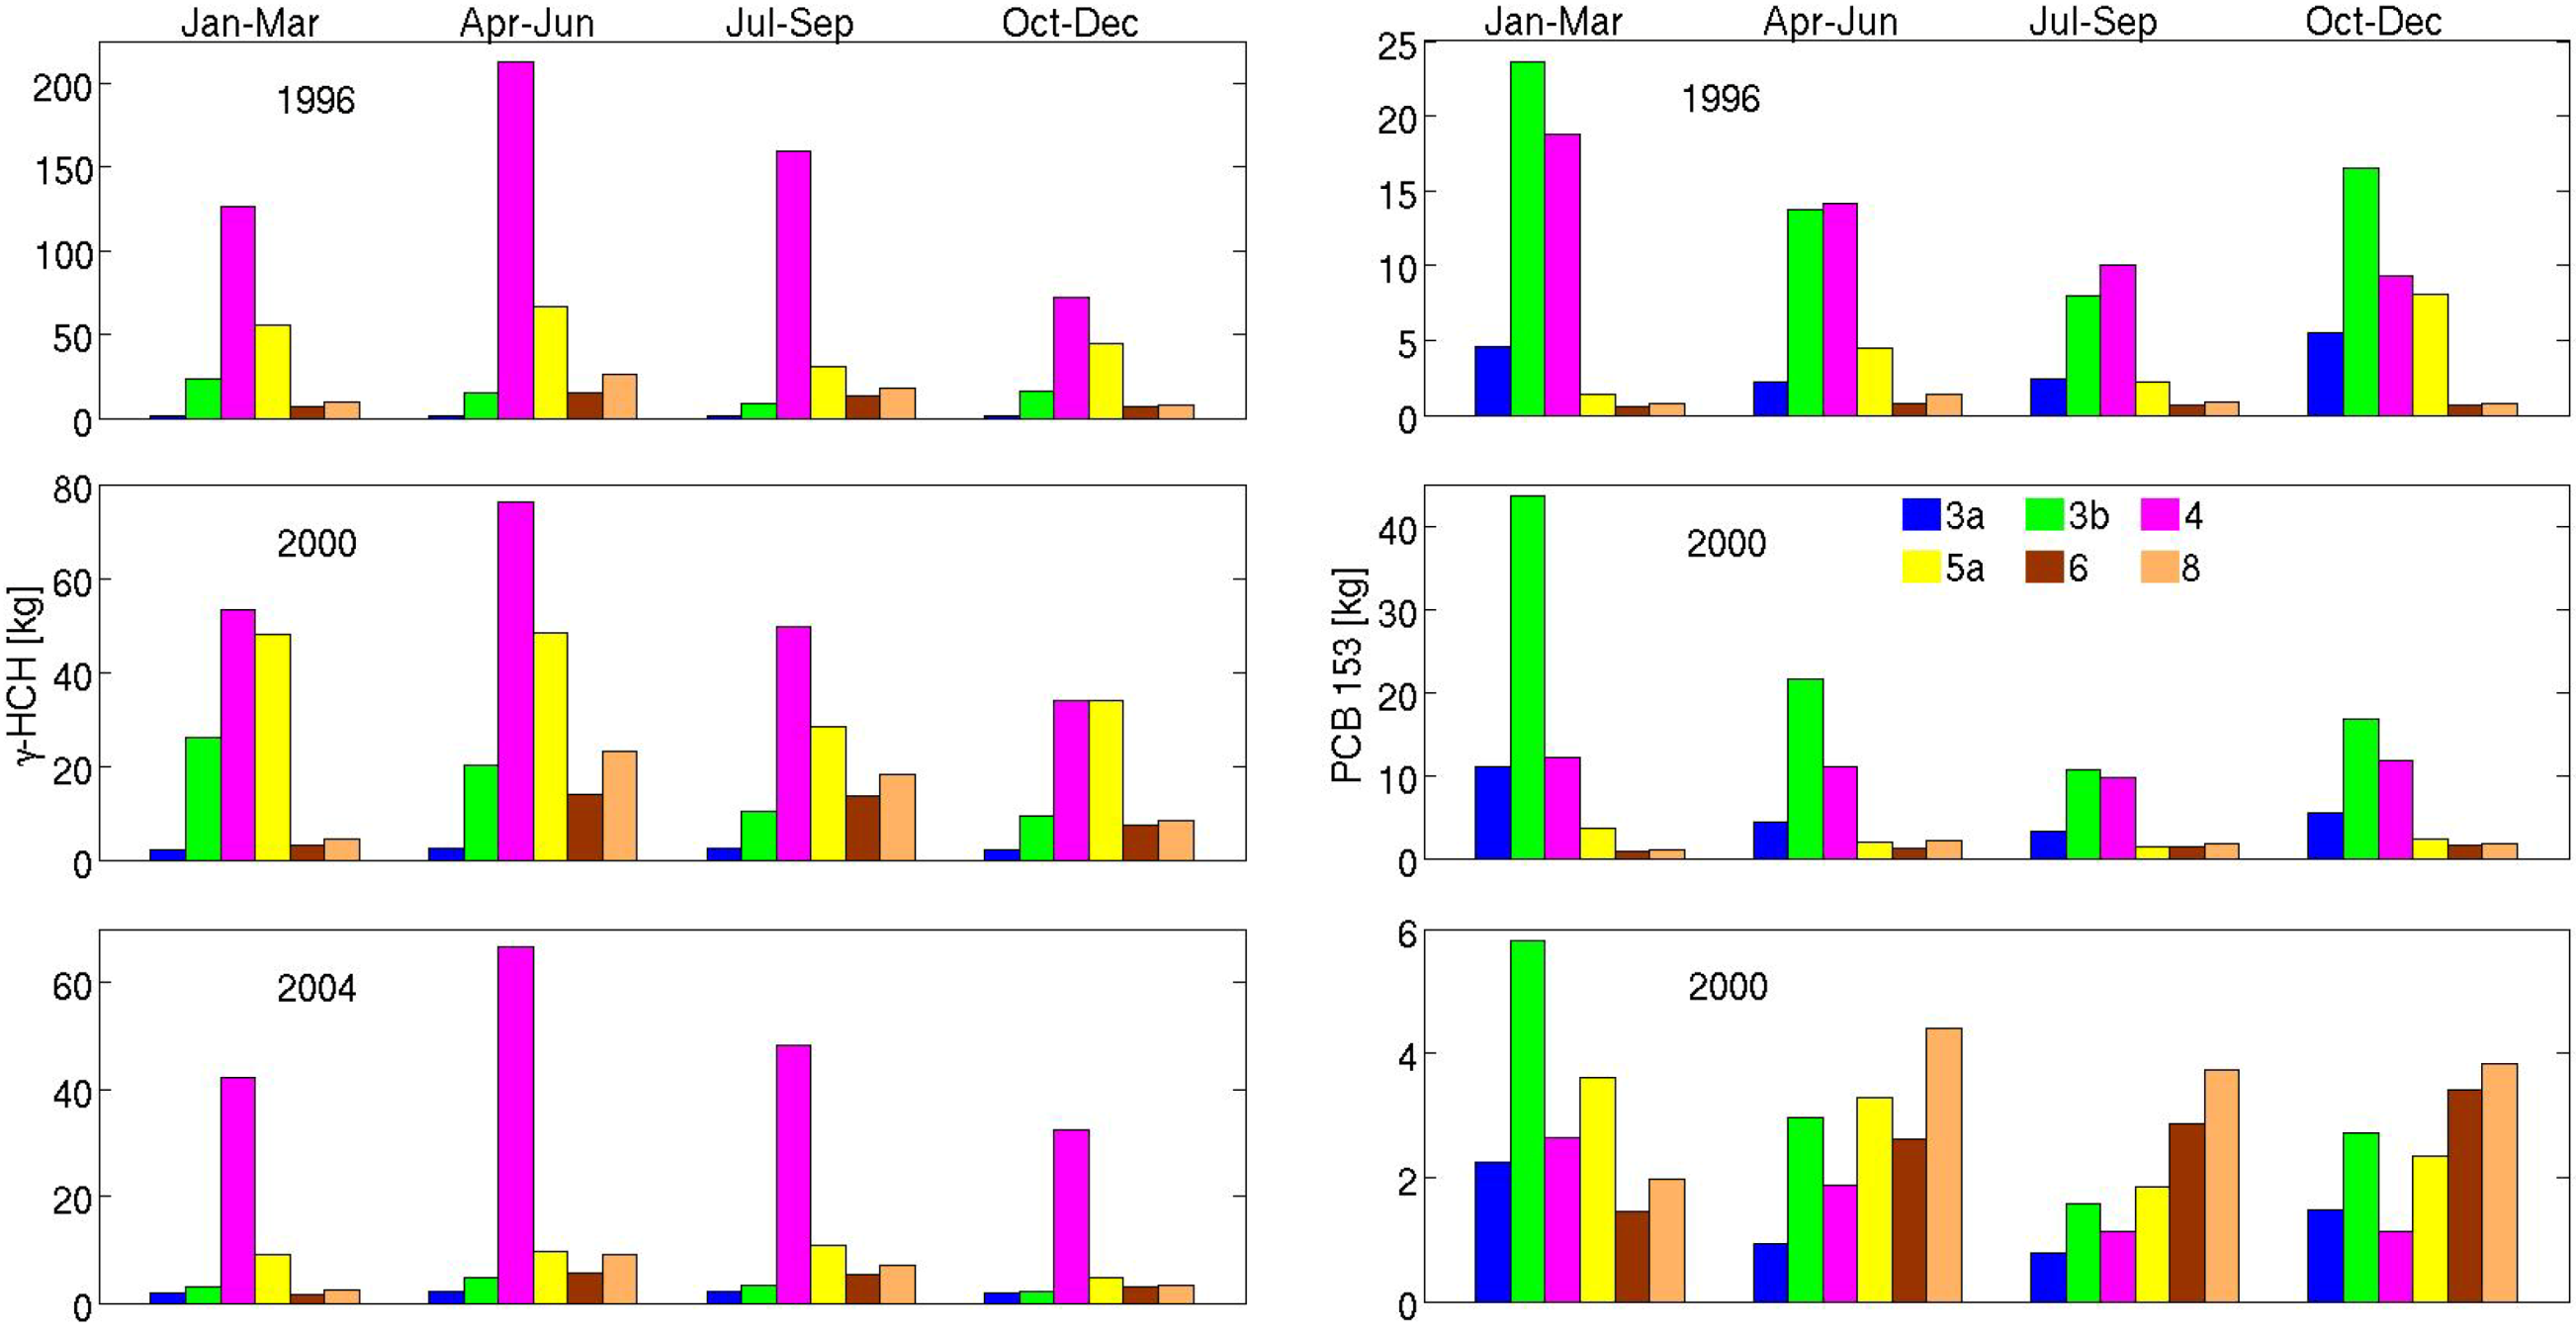
Total volatilization is reduced by a factor of two in 2000 relative to 1996 and by another factor of two in 2004. The major volatilization areas are ICES boxes 4, 7a and 7b. Note that regions around river sources in southern Britain and the continent are also important areas of volatilization, particularly in spring but also in the other seasons. Total river mass fluxes per ICES box are shown in Figure 14 (right panels). Although total river input fluxes are at least a factor of five (box 4) less than volatilization fluxes, it is clear that they are substantial and important locally.

3.4.2. PCB 153

Volatilization rates are greatest in the areas surrounding polluted British and continental river sources (Figure 8, Figure 9 and Figure 10 fourth panels). Highest rates are found in autumn and winter when concentrations in the North Sea are greatest due to resuspension (due to stronger winds and storms) of the hydrophobic PCB 153 stored in sediment in the vicinity of these polluted river sources [8]. ICES boxes 3a, 3b and 4 (Figure 11, Figure 12 and Figure 13 fourth panels) usually exhibit the highest rates because of the high levels of pollution in British, Belgian and Dutch rivers. High rates can also be found in the German Bight and Wadden Sea areas, boxes 5a and 5b, in autumn and winter, particularly in autumn 1996 which resulted from a strong storm in the region [8]. We note here the large amount of PCB 153 entering through rivers (Figure 15 right panels), particularly in boxes 3b and 4 in 1996 which are larger than the sum of wet, gas and dry deposition, that lead to very high local rates of volatilization.
The trend is generally downward with rates reduced by a factor of two in 2004 relative to 1996, even though rates in 3a and 3b increased by a factor of two in winter 2000 relative to winter 1996 also the result of a storm at that time (and high river input Figure 14) [8]. Total volatilization generally exceeds total deposition by up to an order of magnitude in 1996 and 2000, reducing to a factor of 4–5 in 2004.
Figure 15. Bar charts of quarterly (3 month) POP river input into ICES boxes (kg) of γ-HCH (left) and PCB 153 (right) for 1996, 2000 and 2004. All rivers entering any particular box are included.
Atmosphere 05 00156 g015

3.5. Net Air-Sea Exchange and Fugacity Ratios

3.5.1. γ-HCH

The North Sea is generally net depositional for γ-HCH (Figure 2, Figure 3, Figure 4, Figure 5, Figure 6 and Figure 7 bottom panels). Since gas deposition dominates over particle and wet deposition, air-sea exchange is essentially the difference between gas deposition and volatilization. Net deposition is greatest in spring, particularly in the western half of the North Sea, decreases in summer, when gas deposition decreases and volatilization increases in the southern North Sea, becomes generally net volatilizational in autumn, and returns to being net depositional in winter.
Concerning ICES boxes, the highest net deposition rates are found in 2, 3a, 3b, 4, 7a, and 7b. All of the ICES boxes are net depositional in winter, spring and summer for 1996 and 2000, while only boxes 1, 2 and 3a are net depositional in autumn of these years. In 2004, boxes 5a and 5b are net depositional in summer, as are all boxes in autumn. There is a generally downward trend because, even though gas deposition and volatilization decrease by factors of 5 and 4, respectively, between 1996 and 2004, there is a greater total decrease in gas deposition.
Fugacity ratios (note that fugacity ratios are concerned with air-sea gas exchange only, and do not include wet and dry deposition) were calculated as −fa/fw [36] where fw and fa are fugacities in water and air, respectively, and the term thus represents minus the ratio of gas deposition to volatilization, so that values less than −1 (large negative) are net depositional and values greater than −1 are net volatilizational (Figure 14). Ratios are almost everywhere less than −1 in winter, spring and summer, with highest values in summer. In autumn, large swathes of the North Sea are net volatilizational (greater than −1). The general trend is that the North Sea is becoming less depositional, with less negative fugacity ratios in winter to summer and the North Sea becoming almost completely net volatilizational in 2004 with the exception of the area adjacent to the British coast. Other regions that have become net volatilizational include the Skagerrak and the Norwegian coastal areas in winter 2000 and 2004, parts of the Wadden Sea, and the region extending from the Rhine to the German Bight to the Wadden Sea as far as the Skaggerak and the Kattegat in 2004 (full details not shown).
Using the fugacity fraction calculation of [37], calculated as ffw = fw/(fw+ fa) (where fw and fa are again fugacities in water and air, respectively) [38] calculated a mean annual value of around 0.4 for the Kattegat Sea region from monthly paired air-water samples for the period December 1998 to November 1999. This corresponds to a fugacity ratio −1.5 for the method used here, and is in fair agreement with model results for this area. For the year 2000, model results exhibit an annual cycle, going from ~ −1 in winter, to less than −1 in spring, back to ~ −1 in summer and to less than −1 in autumn.

3.5.2. PCB 153

The North Sea is net volatilizational for PCB 153 (Figure 8, Figure 9, Figure 10, Figure 11, Figure 12 and Figure 13 bottom panels). It is almost exclusively net volatilizational in autumn and winter, with the highest rates extending from the Scottish coast, along Britain to the Dutch coast (ICES boxes 3a, 3b and 4) in all years, occasionally extending along the Dutch coast to the German Bight and the Wadden Sea (boxes 5a and 5b). High rates are also found along this path in the other seasons, although rates decrease significantly in 2004. The remainder of the North Sea is generally net volatilizational, though less so, with box 8 being slightly net depositional in all summers and autumn 1996 and 2004, and box 6 also slightly net depositional.
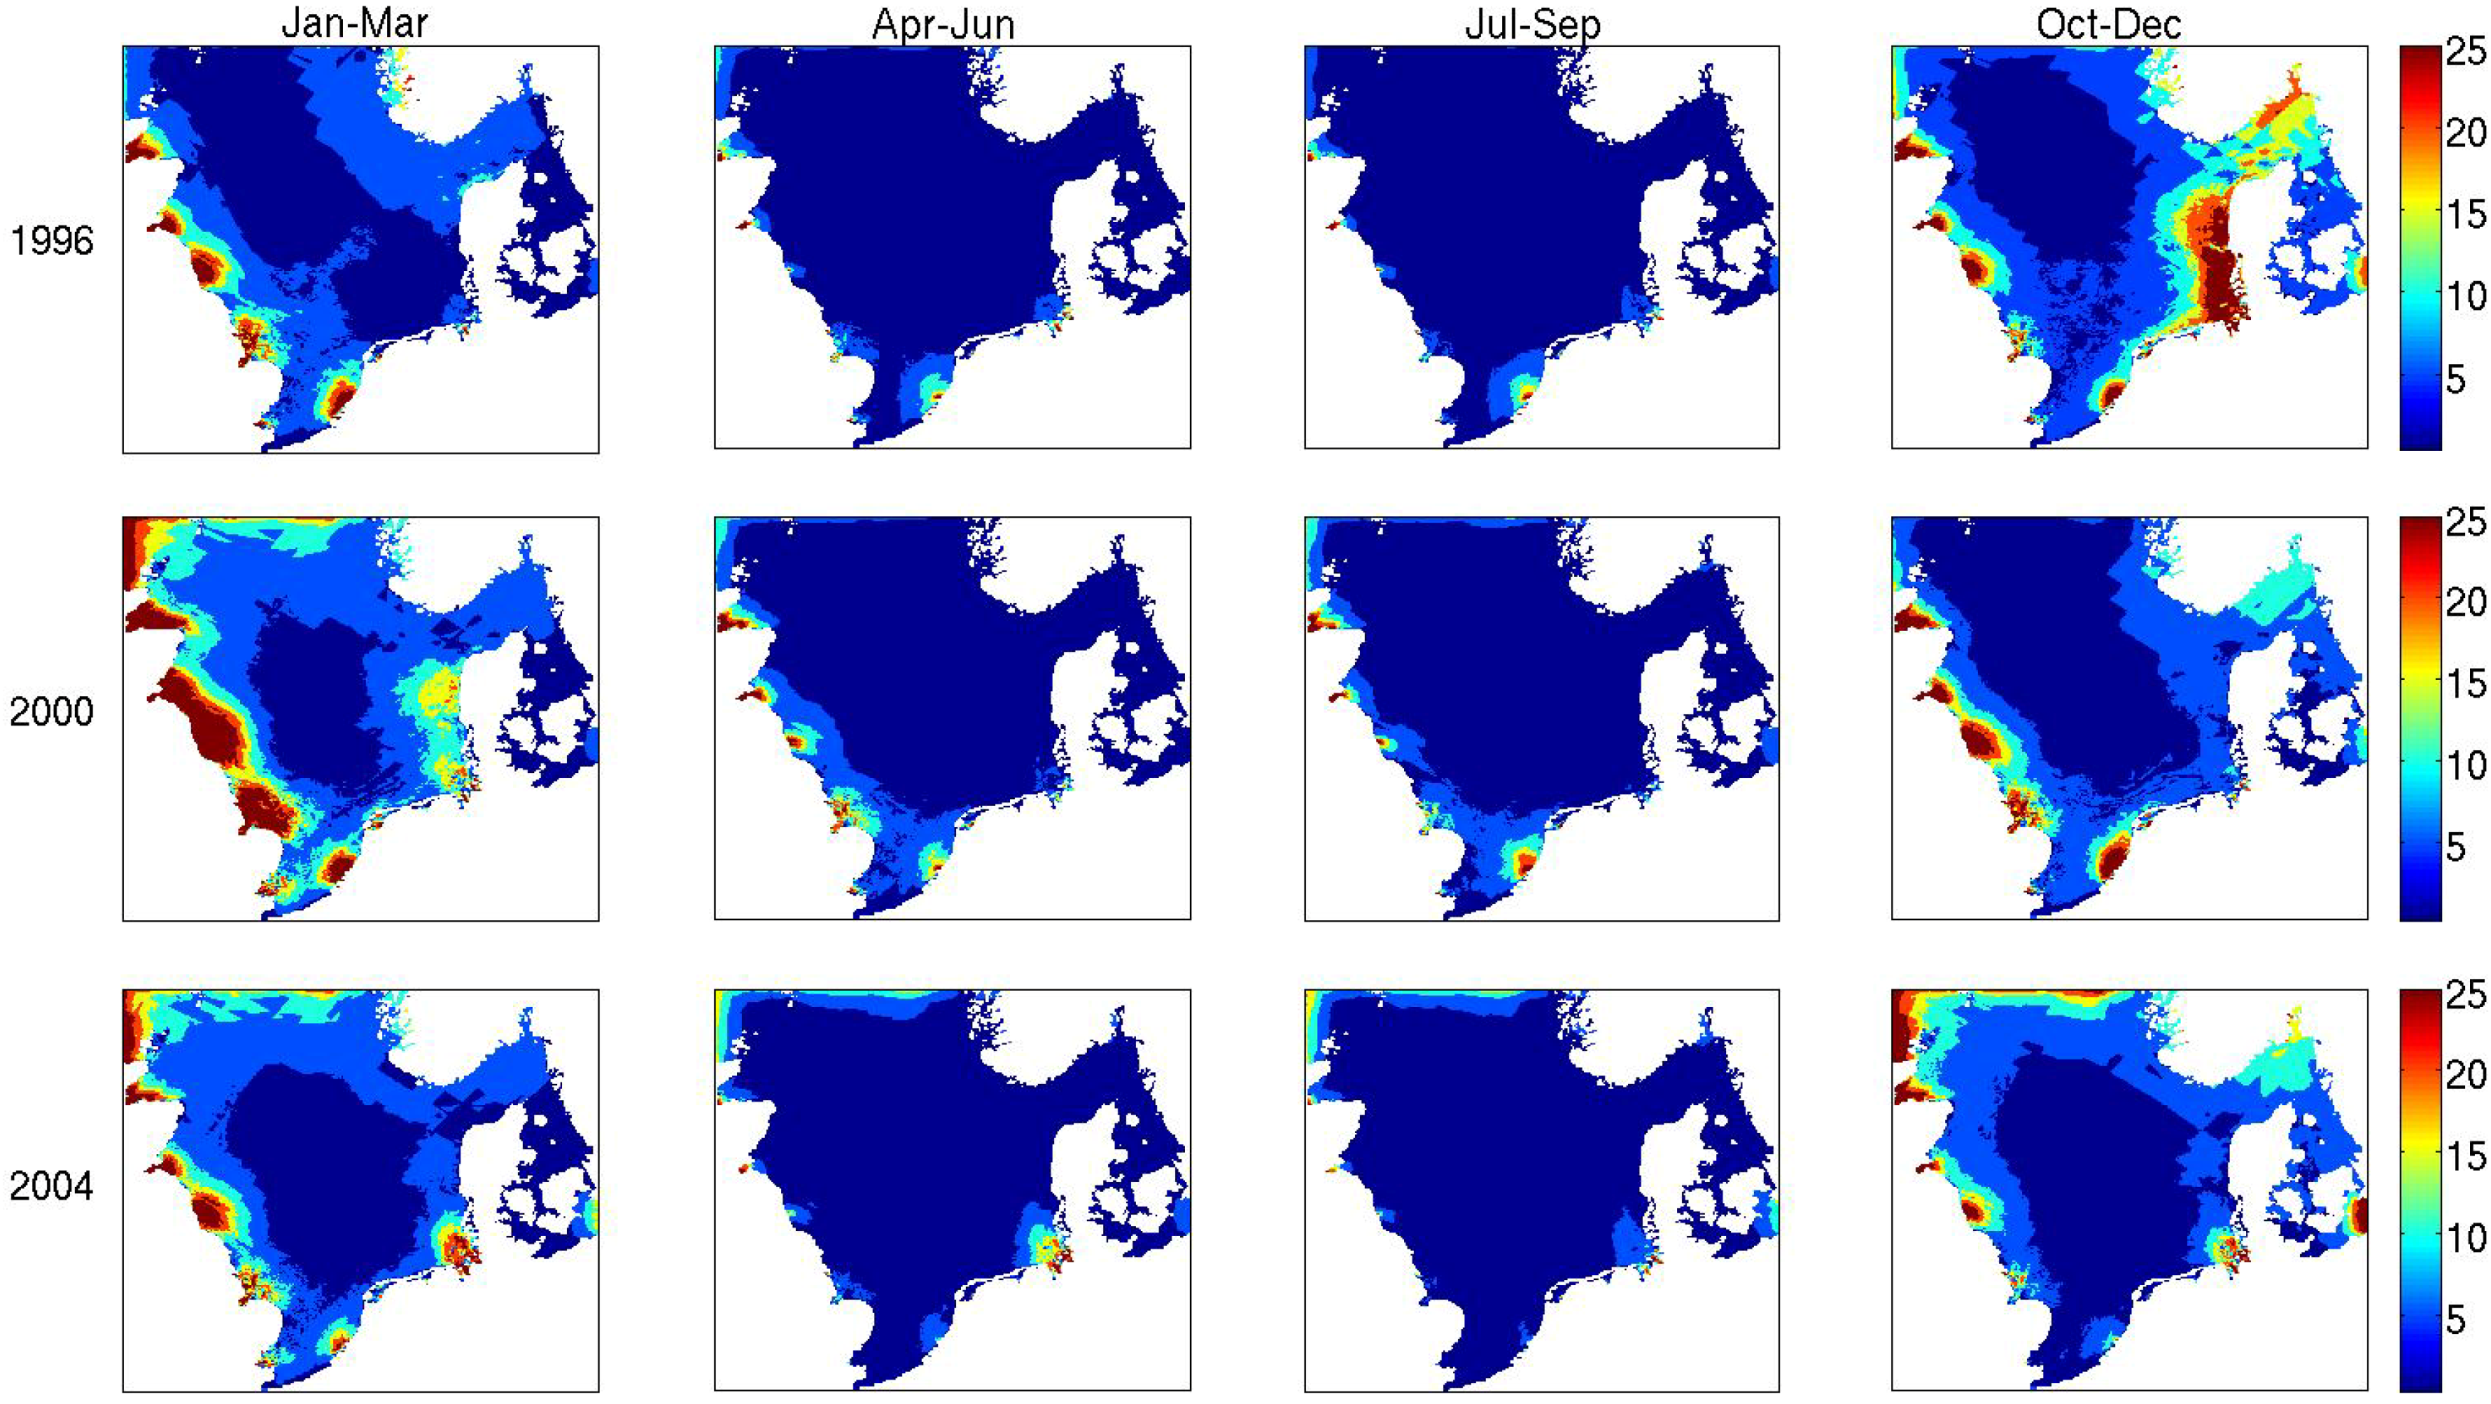
Fugacity ratios were calculated as the ratio of volatilization to gas deposition (fwa/fa) ([37] so that values greater than 1 are net volatilizational. Fugacity ratios are almost exclusively greater than 1 (Figure 16) with largest values found near British and continental rivers, particularly in winter and autumn, extending into the German Bight and Wadden Sea in autumn 1996 and winter 2000, and around the Skagerrak and Norwegian coastal region in autumn. (High values around open boundaries in the north and at the Baltic Sea are model artifacts and should be ignored.) Areas of higher ratio are more extensive in 2000 relative to 1996 but are diminished relative to both in 2004, due, perhaps, to reduced gas deposition to relatively sustained river input.
Using the method of [37], the authors of [38] calculated a mean annual fugacity fraction of around 0.8 for the Kattegat Sea region from monthly paired air-water samples for the period December 1998 to November 1999, corresponding to a fugacity ratio of 4 for the method used here. This is in reasonable agreement with model results for this area for the year 2000, which is always net volatilizational and exhibits an annual cycle, with seasonal values of ~3–4 in winter, ~2 in spring, ~3 in summer and 6–7 in autumn. Similar calculations in the Arkona Sea, to the south of the Kattegat, in spring 1999 gives average values of about 2 [36] (their westernmost stations only), similar to model results in the Kattegat and Danish belts. For a Swedish fjord in the Skagerrak, the authors of [39] calculated summer and winter fugacity ratios of over 5 and 8, respectively, again in very good agreement with model results.
Figure 16. Distributions of quarterly (3 month) averaged fugacity ratios for PCB 153 in 1996, 2000 and 2004, calculated as the ratio of volatilization to gas deposition.
Atmosphere 05 00156 g016

4. Summary and Conclusions

Air-sea exchange of two legacy POPs, γ-HCH and PCB 153, have been presented and discussed for the period 1996–2005 using the results of regional fate and transport (FANTOM) and shelf-sea hydrodynamic (HAMSOM) ocean models.
The North Sea is net depositional for γ-HCH, and is dominated by gas deposition (at least an order of magnitude greater than wet deposition and a further two greater than dry deposition). Rates are highest in the western North Sea, particularly adjacent to British, French and Dutch coastlines, and least around in the east, around the Skagerrak, Kattegat, and Norwegian coastal areas. There is notable seasonal variability, and annual cycle, with highest values found in spring, decreasing in summer, and further so autumn and winter. There is a downward trend with rates generally reduced by factors of 2 and 5 in 2000 and 2004 relative to 1996, respectively. For North Sea ICES boxes, gas deposition is always greatest in box 7a, the largest box in the North Sea with a large portion of it adjacent to high atmospheric concentrations off the British coast.
Volatilization rates of γ-HCH are generally a factor of 2–3 less than gas deposition in winter, spring and summer but greater in autumn when the North Sea is net volatilizational. Rates are generally greatest in the south, decreasing as you move northward and into the Skagerrak and Kattegat. Total volatilization is reduced by a factor of two in 2000 relative to 1996 and by another factor of two in 2004. The major volatilization areas are ICES boxes 4, 7a and 7b. Areas around river sources in southern Britain and the continent are important local areas of volatilization.
Fugacity ratios of γ-HCH are similar to net deposition distributions, since gas dominates over wet and dry deposition. A downward trend in fugacity ratios is found since gas deposition is decreasing faster than volatilization. Large swaths of the North Sea are net volatilizational in autumn, becoming almost totally net volatilizational in 2004 other than off the British coast. The areas around the Norwegian coast, Skagerrak and Kattegat also become net volatilizational in winter 2000 and 2004, and around parts of the Wadden Sea and the southern North Sea. Model results agree quite well with fugacity ratios calculated from observations.
The North Sea is net volatilizational for PCB 153, with highest rates of volatilization to deposition found in the areas surrounding polluted British and continental river sources, ICES boxes 3a, 3b, 4, 5a and 5b, particularly in autumn and winter, when resuspension in these polluted areas is greatest due to wind and storms. Large quantities of PCB 153 entering through rivers lead to very high local rates of volatilization, particularly in boxes 3b and 4 in 1996. A downward trend in net volatilization is observed since it is generally greater than gas, dry and wet deposition by up to an order of magnitude in 1996 and 2000, reducing to a factor of 4–5 in 2004. Highest gas deposition rates are found in the southern and central North Sea, while rates are fairly steady throughout the year. Wet deposition is significant and fairly widespread throughout the year. Dry deposition displays an annual cycle with highest/lowest rates in winter/summer, and is an order of magnitude less than wet and gas deposition.
Fugacity ratios are almost always greater than 1 (volatilization greater than gas deposition). Large values are found in the regions surrounding British and continental river sources, and extending into the German Bight, Wadden Sea, Skagerrak and coastal Norwegian areas. Higher ratio areas are more extensive in 2000 relative to 1996, because of increased river input, but are diminished in 2004.

Acknowledgments

Funding for this project was provided by the German Science Foundation (DFG), grant No. PO 614/8-1. Publication costs were paid for by the Queen’s University of Belfast. The author thanks three reviewers for thoughtful comments which helped improve the manuscript.

Conflicts of Interest

The authors declare no conflict of interest.

References

  1. Gioia, R.; Nizzetto, L.; Lohmann, R.; Dachs, J. Polychlorinated biphenyls (PCBs) in air and seawater of the Atlantic Ocean: Sources, trends and processes. Environ. Sci. Tech. 2008, 42, 1416–1422. [Google Scholar] [CrossRef]
  2. Nizzetto, L.; Lohmann, R.; Gioia, R.; Dachs, J.; Jones, K.C. Atlantic Ocean surface waters buffer declining atmospheric concentrations of persistent organic pollutants. Environ. Sci. Tech. 2010, 44, 6978–6984. [Google Scholar] [CrossRef]
  3. Guglielmo, F.; Lammel, G.; Maier-Reimer, E. Global environmental cycling of γHCH and DDT in the 1980s: A study using a coupled atmosphere and ocean general circulation model. Chemosphere 2009, 76, 1509–1517. [Google Scholar] [CrossRef]
  4. Ilyina, T.; Lammel, G.; Pohlmann, T. Mass budgets and contribution of individual sources and sinks to the abundance of gamma-HCH, alpha-HCH and PCB 153 in the North Sea. Chemosphere 2008, 72, 1132–1137. [Google Scholar] [CrossRef]
  5. Gusev, A.; Rozovskaya, O.; Shatalov, V.; Sokovyh, V.; Aas, W.; Breivik, K. Persistent Organic Pollutants in the Environment; Status Report 3; EMEP Meteorological Synthesizing Centre-East: Moscow, Russia, 2009. [Google Scholar]
  6. Lenhart, H.-J.; Pohlmann, T. The ICES-boxes approach in relation to results of a North Sea circulation model. Tellus 1997, 49, 139–160. [Google Scholar]
  7. Luff, R.; Pohlmann, T. Calculation of water exchange times in the ICES-boxes with a eulerian dispersion model using a half-life time approach. Deut. Hydrogr. Z. 1996, 47, 287–299. [Google Scholar] [CrossRef]
  8. O’Driscoll, K.; Mayer, B.; Ilyina, T.; Pohlmann, T. Modelling the cycling of persistent organic pollutants (POPs) in the North Sea system: Fluxes, loading, seasonality, trends. J. Mar. Syst. 2013, 111/112, 69–82. [Google Scholar] [CrossRef]
  9. Ilyina, T.; Pohlmann, T.; Lammel, G.; Sündermann, J. A fate and transport ocean model for persistent organic pollutants and its application to the North Sea. J. Mar. Syst. 2006, 63, 1–19. [Google Scholar] [CrossRef]
  10. Backhaus, J. A three-dimensional model for the simulation of shelf sea dynamics. Deut. Hydrogr. Z. 1985, 38, 165–187. [Google Scholar] [CrossRef]
  11. Pohlmann, T. A meso-scale model of the central and southern North Sea: Consequences of an improved resolution. Cont. Shelf Res. 2006, 26, 2367–2385. [Google Scholar] [CrossRef]
  12. Larsen, J.; She, J. Optimisation of a Bathymetry Database for the North European Shelf Seas; Technical Report 01–21; Danish Meteorological Institute: Copenhagen, Denmark, 2001.
  13. Kalnay, E.; Kanamitsu, M.; Kistler, R.; Collins, W.; Deaven, D.; Gandin, L.; Iredell, M.; Saha, S.; White, G.; Woollen, J.; et al. The NCEP/NCAR 40-year reanalysis project. Bull. Am. Meteorol. Soc. 1996, 77, 437–471. [Google Scholar] [CrossRef]
  14. Kistler, R.; Kalnay, E.; Collins, W.; Saha, S.; White, G.; Woollen, J.; Chelliah, M.; Ebisuzaki, W.; Kanamitsu, M.; Kousky, V.; et al. The NCEP/NCAR 50-year reanalysis: Monthly means CD-ROM and documentation. Bull. Am. Meteorol. Soc. 2001, 82, 247–267. [Google Scholar] [CrossRef]
  15. Orlanski, I. A simple boundary condition for unbounded hyperbolic flows. J. Comput. Phys. 1976, 21, 251–269. [Google Scholar] [CrossRef]
  16. Boyer, T.; Levitus, S.; Garcia, H.; Locarnini, R.; Stephens, C.; Antonov, J. Objective analyses of annual, seasonal, and monthly temperature and salinity for the world ocean on a 0.25° grid. Int. J. Climatol. 2005, 25, 931–945. [Google Scholar] [CrossRef]
  17. Smagorinsky, J. General circulation experiments with the primitive equations. I. The basic experiment. Mon. Weather Rev. 1963, 91, 99–164. [Google Scholar]
  18. Kochergin, V.P. Three-Dimensional PrognosticModels. In Coastal and Estuarine Science; American Geophysical Union: Washington, DC, USA, 1987. [Google Scholar]
  19. Damm, P.E. Die Saisonale Salzgehalts- und Frischwasserverteilung in der Nordsee und ihre Bilanzierung; Institut für Meereskunde: Hamburg, Germany, 1997. [Google Scholar]
  20. Lewin, J.; Weir, M.J.C. Morphology and recent history of the Lower Spey. Scott. Geogr. J. 1977, 93, 45–51. [Google Scholar]
  21. Whitman, W.G. The two-film theory of gas absorption. Chem. Metall. Eng. 1923, 29, 146–150. [Google Scholar]
  22. Liss, P.S.; Slater, P.G. Flux of gases across the air–sea interface. Nature 1977, 247, 181–184. [Google Scholar] [CrossRef]
  23. Mackay, D. Multimedia Environmental Models: The Fugacity Approach, 2nd ed.; Lewis: Boca Raton, FL, USA, 2001. [Google Scholar]
  24. Wania, F.; Persson, J.; di Guardo, A.; McLachlan, M. The Popcycling-Baltic Model.A Non-steady State Multicompartment Mass Balance Model of the Fate of Persistent Organic Pollutants in the Baltic Sea Environment; Tech. Rep. OR 10/2000; U-96069; Norwegian Institution Air Research: Kjeller, Norway, 2003. [Google Scholar]
  25. Schwarzenbach, R.E.; Gschwend, P.M.; Imboden, D.M. Environmental Organic Chemistry, 1st ed.; Wiley: New York, NY, USA, 1993. [Google Scholar]
  26. Malanichev, A.; Mantseva, E.; Shatalov, V.; Strukov, B.; Vulykh, N. Numerical evaluation of the PCB transport over the northern hemisphere. Environ. Pollut. 2004, 128, 279–289. [Google Scholar] [CrossRef]
  27. Wodarg, D.; Kömp, P.; McLachlan, M.S. A baseline study of polychlorinated biphenyl and hexachlorobenzene concentrations in the western Baltic Sea and Baltic proper. Mar. Chem. 2003, 87, 23–36. [Google Scholar] [CrossRef]
  28. Schulz-Bull, D.E.; Petrick, G.; Bruhn, R.; Duinker, J.C. Chlorobiphenyls (PCB) and PAHS in water masses of the northern North Atlantic. Mar. Chem. 1998, 61, 101–114. [Google Scholar] [CrossRef]
  29. Schulz-Bull, D.E.; Hand, I.; Lerz, A.; Trost, E.; Wodarg, D. Regionale Verteilung Chlorierter Kohlenwasserstoffe (CKW) und Polycyclischer aromatischer Kohlenwasserstoffe (PAK) im Pelagial und Oberflchensediment der Ostsee 2008; Auftrag des Bundesamtes fürSeeschifffahrt und Hydrographie; Leibniz-Institut für Ostseeforschung an der Universität Rostock: Rostock, Germany; p. 2009.
  30. Iwata, H.; Tanabe, S.; Sakai, N.; Tatsukawa, R. Distribution of persistent organochlorines in the oceanic air and surface seawater and the role of ocean on their global transport and fate. Environ. Sci. Tech. 1993, 27, 1080–1098. [Google Scholar] [CrossRef]
  31. Lakaschus, S.; Weber, K.; Wania, F.; Bruhn, R.; Schrems, O. The air-sea equilibrium and time trend of hexachlorocyclohexanes in the Atlantic ocean between the Arctic and Antarctica. Environ. Sci. Tech. 2002, 36, 138–145. [Google Scholar] [CrossRef]
  32. Lorkowski, I.; Pätsch, J.; Moll, A.; Kühn, W. Interannual variability of carbon fluxes in the North Sea (1970–2006)—Abiotic and biotic drivers of the gas-exchange of CO2. Estuar. Coast. Shelf Sci. 2012, 100, 38–57. [Google Scholar] [CrossRef]
  33. Shatalov, V.; Dutchak, S.; Fedyunin, M.; Mantseva, E.; Strukov, B.; Varygina, M.; Vulykh, N.; Aas, W.; Mano, S. Persistent Organic Pollutants in the Environment; Status Report 3; EMEP Meteorological Synthesizing Centre-East: Moscow, Russia, 2003. [Google Scholar]
  34. Gusev, A.; Mantseva, E.; Rozovskaya, O.; Shatalov, V.; Vulykh, N.; Aas, W.; Breivik, K. Persistent Organic Pollutants in the Environment; Status Report 3; EMEP Meteorological Synthesizing Centre-East: Moscow, Russia, 2006. [Google Scholar]
  35. OSPAR Commission. Quality Status Report 2000, Region II—Greater North Sea; OSPAR Commission: London, UK, 2000. [Google Scholar]
  36. Bruhn, R.; Lakaschus, S.; McLachlan, M.S. Air/sea gas exchange of PCBs in the southern Baltic Sea. Atmos. Environ. 2003, 37, 3445–3454. [Google Scholar] [CrossRef]
  37. Sundqvist, K.L.; Wingfors, H.; Brorstöm-Lundén, E.; Wiberg, K. Air-sea gas exchange of HCHs and PCBs and enantiomers of α-HCH in the Kattegat Sea region. Environ. Pollut. 2004, 128, 73–83. [Google Scholar] [CrossRef]
  38. Harner, T.; Bidleman, T.F.; Jantunen, L.M.M.; Mackay, D. Soil-air exchange model of persistent pesticides in the US Cotton Belt. Environ. Toxicol. Chem. 2001, 20, 1612–1621. [Google Scholar]
  39. Palm, A.; Cousins, I.; Gustafsson, Ö.; Axelman, J.; Grunder, K.; Broman, D.; Brorstöm-Lundén , E. Evaluation of sequentially-coupled POP fluxes estimated from simultaneous measurements in multiple compartments of an air-water-sediment system. Environ. Pollut. 2004, 128, 85–97. [Google Scholar] [CrossRef]