Article

Comparison between Vegetation and Rainfall of Bioclimatic Ecoregions in Central Africa

1
Laboratory for Environmental Modeling and Atmospheric Physics (LAMEPA), Faculty of Sciences, University of Yaounde I, P.O. Box 812, Yaounde, Cameroon
2
Laboratory of Engineering for Industrial Systems and Environment (LISIE), IUT-FV, University of Dschang, P.O. Box 134, Bandjoun, Cameroon
3
Department of Physics, Faculty of Sciences, University of Douala, P.O. Box 24157, Douala,Cameroon
4
Geographic Information Science Center of Excellence, South Dakota State University, Brookling, SD 57007, USA
*
Author to whom correspondence should be addressed.
Atmosphere 2013, 4(4), 411-427; https://doi.org/10.3390/atmos4040411
Submission received: 5 September 2013 / Revised: 30 September 2013 / Accepted: 19 October 2013 / Published: 13 November 2013

Abstract

:
This paper investigates the relationship between the Normalized Difference Vegetation Index (NDVI) and extracted rainfall in the Global Precipitation Climatology Project (GPCP) in Central Africa between latitudes 15 S and 20 N and longitudes 0 E and 31 E. Monthly NDVI and GPCP datasets for the period 1982–2000 have been used. The Index of Segmentation of Fourier Components (ISFC) has been applied on the NDVI dataset to segment Central Africa into four bioclimatic ecoregions (BCERs). In order to compare the differential response of vegetation growth to rainfall, an analysis of the inter-annual, intra-annual and seasonal variability for each BCER has been carried out, and the correlations between NDVI and rainfall have been assessed. The plot of the annual cycles of both variables revealed a coherent onset, peak and decay, with a time lag of 1 month for almost all the zones, except the zones, semi-desert and steppe, where a season of short and intense rainfall was observed. The correlation coefficients computed between the two variables are relatively high, especially in brush-grass savannah, where they reach up to 0.90 at a time lag of 1 month. The phenological transition points and phases show that the range between the + 1 and 1 time lags corresponds to the duration of the maturity of vegetation. Overall, there is a strong similarity between temporal patterns of NDVI and rainfall, showing that the NDVI can be considered a sensitive indicator of the interannual variability of rainfall.

1. Introduction

Vegetation is very sensitive to climatic fluctuations and has strong control over the flows of water, carbon and energy between land and atmosphere. Climatic changes have taken an immense toll on the environment of our planet and have become one of the most important issues within the global change debate.
Remote sensing observations offer the opportunity to monitor, quantify and examine regional changes in vegetation, in response to human actions and the climate. Vegetation influences the energy balance, climate, hydrologic and biogeochemical cycles and can serve as a sensitive indicator of climatic and anthropogenic influences on the environment [1]. Satellite-derived vegetation indices are being integrated in interactive biosphere models as part of global climate modeling [2,3,4,5] and production efficiency models [6,7]. The Normalized Difference Vegetation Index (NDVI) is a satellite-based vegetation index, which is commonly used and based on the differential reflection of green vegetation in the visible and infrared portions of the magnetic spectrum [8,9,10,11,12]. A large number of studies have investigated the NDVI pattern over the world. Moulin et al. [8] carried out a description of vegetation dynamics on a continental scale. Wang et al. [13] examined the spatial patterns of NDVI in response to precipitation and temperature in the Central Great Plains. Liu et al. [14] have worked on land cover classification in China. The classification of African ecosystems at a 1-km resolution using multiannual Satellite Pour l’Observation de la Terre Vegetation (SPOT/VEGETATION) data and a hybrid clustering approach has been carried out by Kaptué et al. [15]. Verhegghen et al. [16] have made a map of Congo Basin forest types from 300-m and 1-km multi-sensor time series for carbon stocks and forest area estimation.
For vegetation, higher NDVI values correspond to an increase in vegetation “greenness” or vigor, controlled by a combination of vegetation type, health, photosynthetic activity and canopy density [17,18]. Through time series analysis, interpretation of NDVI data has been extended to indicate land surface-climate interactions [19,20], landscape change [21,22], vegetation stress (e.g., drought) [23] and phenology [18]. NDVI time series data can be reliable indicators of eco-climatologic variables, such as temperature [18,24] and precipitation, although these relationships are explicitly regional in nature, because of the sensitivity of vegetation to the climate.
Although several studies have investigated the interannual relationship between vegetation and precipitation, only a few have examined this interaction on vegetation types in Central Africa. Nicholson et al. [23] studied the case of East Africa and Sahel using the major bioclimatic ecoregions (BCERs) made by Olson et al. [25] and Camberlin et al. [26], exploring the response of photosynthetic activity to interannual rainfall variations in Africa. More work still has to be done to reinforce the understanding of the interaction between both parameters. The BCERs are considered to be similar regions from a climatic point of view and from ecological and spectral behavior.
Our work aims to explore the relationship between NDVI and rainfall by various vegetation types in Central Africa. We have used the method of the Index of Segmentation of Fourier Components (ISFC) made by Kaptué et al. [15] for the classification of African ecosystems to segment the vegetation of Central Africa into four BCERs. After this, we standardized the values of NDVI and precipitation for each BCER zone and studied the seasonal, intra- and inter-annual variation. Finally, the correlation between both parameters, stratified by BCER, was computed.

2. Study Area and Data

The study area covers Central Africa, part of Sahel and West Africa, which extends between latitudes 15 S and 20 N and longitudes 0 E and 31 E. It contains many of the major BCERs of Africa [27]. The Central and West Africa vegetation overview shows the latitudinal vegetation pattern, which extends from subtropical desert to the equatorial forest, through savannah and Sahelian steppes (see [29]). This bioclimatic variability relies on three essential factors: the nature of the physiological green land characteristics; the paleoclimatic conditions; and the edaphic and climatic natural variability [28].
Data used in this study from both the Global Precipitation Climatology Project (GPCP) and NOAA were from 1981 to 2001. The monthly mean NDVI dataset is calculated from the NOAA-AVHRR global area coverage data, with 1 × 1 spatial resolution. NDVI is frequently, even “usually”, calculated from any sensor data that has a red and near-infrared band. MSS (Multi-Spectral Scanner), of course, has not been widely used since 1984, when it was, for most purposes, replaced in Landsat usage by the higher resolution and quality TM (Thematic Mapper) and, later, ETM+ (Enhanced Thematic Mapper Plus) and ALI (Advanced Land Imager) sensors. For a summary of the current radiometrics for Landsat MSS, TM, ETM+ and ALI sensors, see [30]. Data used in this study were processed by the GIMMS (Global Inventory Modeling and Mapping Studies) group at NASA’s Goddard Space Flight Center, as described by [31,32].
The GPCP monthly precipitation analysis [33,34] is a globally complete, monthly estimate of surface precipitation at 2 . 5 × 2 . 5 latitude-longitude resolution, which spans the period of 1979 to the present. It is a merged, monthly analysis that employs precipitation estimates from multiple satellites. These multi-satellite estimates are combined with rain-gauge analyses (over land) in a two-step process that adjusts the satellite estimates to a large-scale bias of the gauges and then combines the adjusted satellite and gauge fields with weighting by inverse error variance. The monthly product is typically produced about two months after the end of the observation month.
The difference in reflectance at different wavelengths of the electromagnetic spectrum for vegetated surfaces allows for the recognition of vegetation and vegetation character using satellite remote sensing. Vegetation typically reflects relatively weakly in the wavelengths of the visible band (VIS) compared to its strong reflectance in the near-infrared (NIR) wavelengths [17]. This property can be exploited to create an index that measures the difference between the reflectance of the two bands and that yields information about the vegetated surface. The NDVI is generally calculated as the following [35]:
N D V I = N I R reflectance V I S reflectance N I R reflectance + V I S reflectance
The satellite-based NDVI is influenced by a number of non-vegetation factors: atmospheric conditions (e.g., clouds and atmospheric path-specific variables, aerosols, water vapor), satellite geometry and calibration (view and solar angles), as well as soil backgrounds and crop canopy ([36,37,38]). The angle of incidence of solar radiation also has a strong effect on vegetation indices (Pinter [39]). A cloud mask was applied by using channel 5 (10–12 μm) and labeling everything colder than 12 C as cloud. Daily values were formed into monthly composite images by using the maximum NDVI for each pixel within the compositing period, as described by Holben [36]. This minimizes the effect of atmosphere, scan angle and cloud contamination. The definition of the NDVI as the ratio minimizes the influences of varying solar zenith angles and surface topography on the dataset.

3. Method

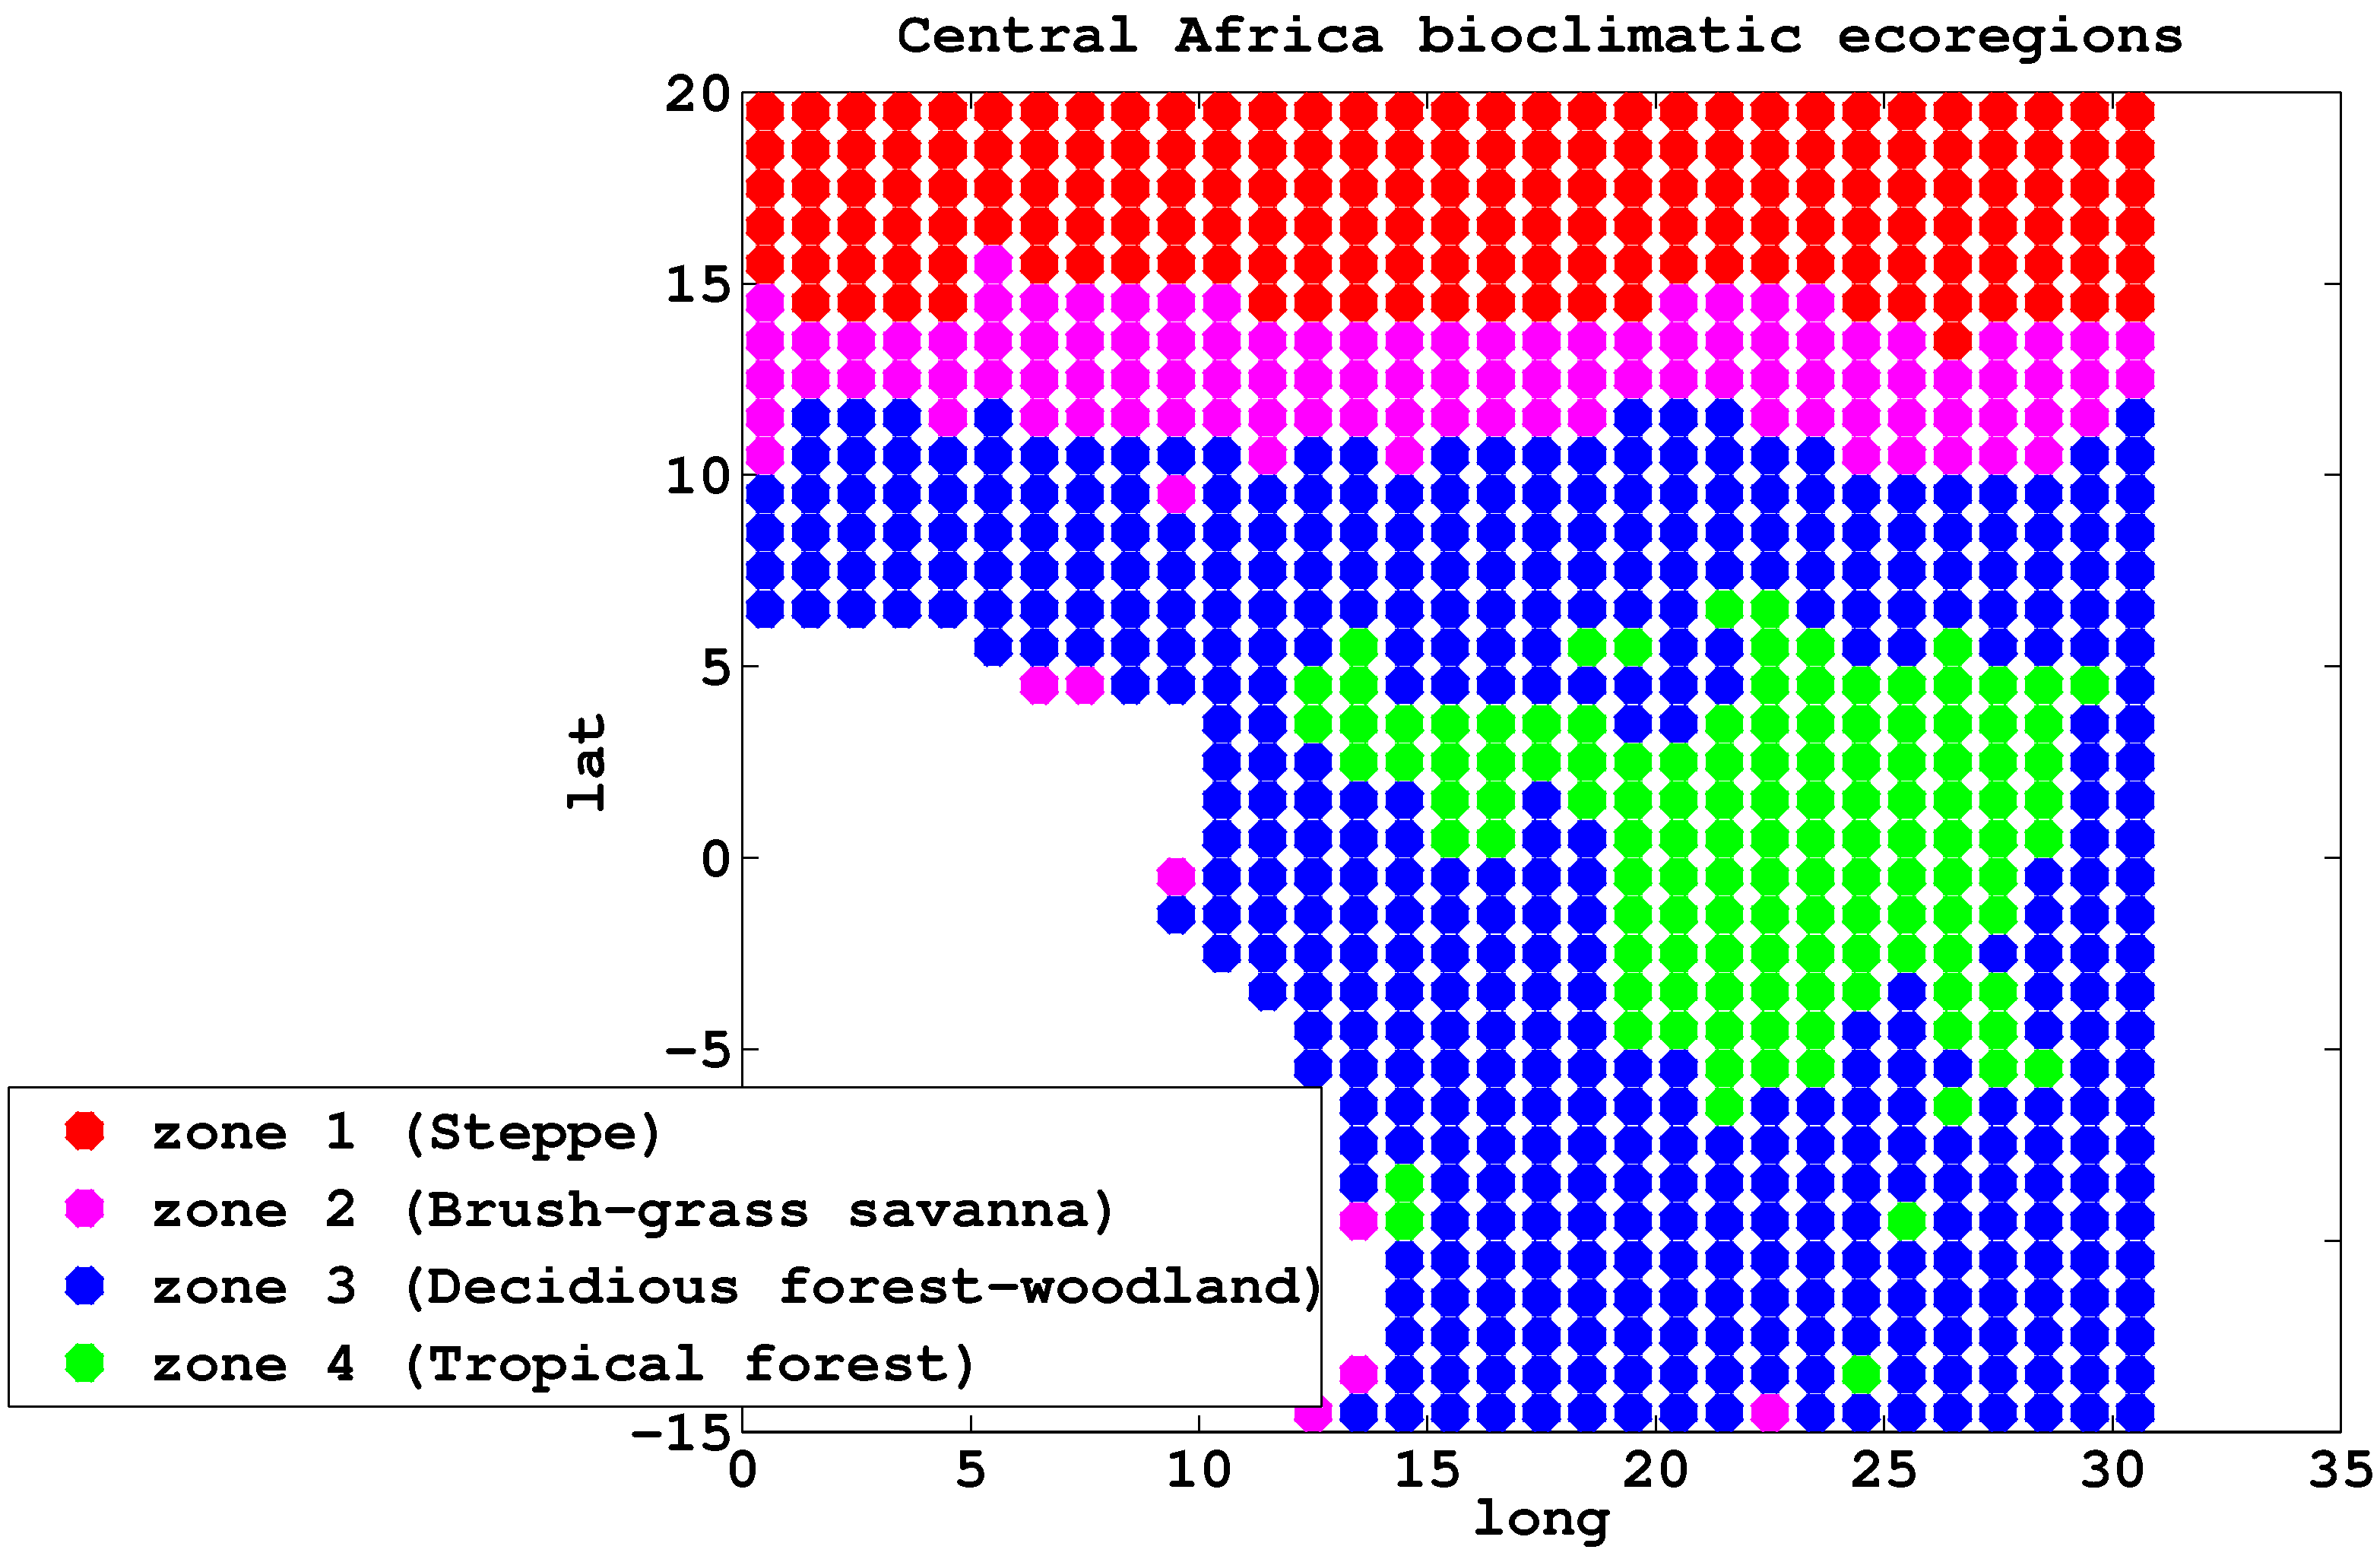
3.1. Vegetation Partitioning

The method of the Index of Segmentation of Fourier Component (ISFC), made by Kaptué et al. [15] for classification of African ecosystems, has been used in this study to classify our study area into four BCERs.
The ISFC is a quantitative measurement based on Discrete Fourier Transformation (DFT) analysis of NDVI datasets; it is an unsupervised, hierarchical classification. This segmentation was obtained using Equations (2–4):
I S F C = r = 0 D 1 W r f * , r
where W r is the weighted coefficient, relative to an r t h Fourier component over its total power [40]:
W r = f * , r 2 r = 0 D 1 f * , r 2
The constants, f * , r ( t ) , are determined from the developed Fourier transformation on the NDVI:
N D V I * ( d ) = r = 0 D f * , r ( t ) cos 2 π d r Δ D + φ r
where Δ is the sample interval in daily units, f * , r refers to amplitude and φ r to phase.
The Fourier decomposition separates the temporal data into discrete waves, each with a characteristic time period and amplitude. In regions like Africa, where maximum greenness varies from place to place and the length of the growing season also varies, the coefficients derived from these equations can separate BCER efficiently. The usefulness of the DFT to study the phenological cycles of vegetation has been demonstrated by authors, such as Andres et al. [41, Azzali and Menenti [42, Immerzeel and Quiroz [43] and Moody and Johnson [44]. The criteria for defining BCER ISFC were set by Kaptué et al. [15].
Generally speaking, seasonal climatic changes drive four successive phases of vegetation phenology in a cycle: green-up, maturity, senescence and dormancy [45]. These periods can be defined by the date of onset of vegetation growth, the subsequent date of growth end, resulting in maturity, the date of onset of senescence and the date of onset of full dormancy.

3.2. Formatting GPCP and NDVI Data

Both datasets, NDVI and the precipitation GPCP, after being extracted for each BCER, have been standardized, so as to compare them on a common scale. Standardization of the data was performed using the following equation:
S t d ( X ) = X i X ¯ σ X
where X represents the value of NDVI or precipitation and X ¯ and σ X , the mean value and standard deviation of the parameter on the observation period.
To have a common grid with NDVI and GPCP data, we used the standard methods based on kriging interpolation proposed by a toolbox of Matlab (version 2010).

4. Result and Discussion

4.1. Spatial NDVI Pattern

The four main BCERs over Central Africa are shown in Figure 1. The mean annual satellite NDVI from 1982 to 2000 was integrated, applying the unsupervised classification method (ISFC).
Figure 1. Supervised classification, with 1 × 1 spatial resolution, of four bioclimatic ecoregions in the area of Central Africa.
Atmosphere 04 00411 g001
The Central Africa NDVI spatial pattern is as expected, whereas BCER zone 1 displays the steppe vegetation type, situated between latitudes 15 N and 20 N and longitudes 0 and 31 E. BCER zone 2 shows brush-grass savannah, which extends between latitudes 10 N and 15 N and longitudes 0 E and 31 E. BCER zone 3 is humid tropical forest between latitudes 15 S and 10 N and longitudes 0 N and 31 N and corresponds to deciduous forest-woodland. Finally, BCER zone 4 illustrates the tropical rain forest, which is located between latitudes 7 S and 7 N and longitudes 13 E and 29 E.

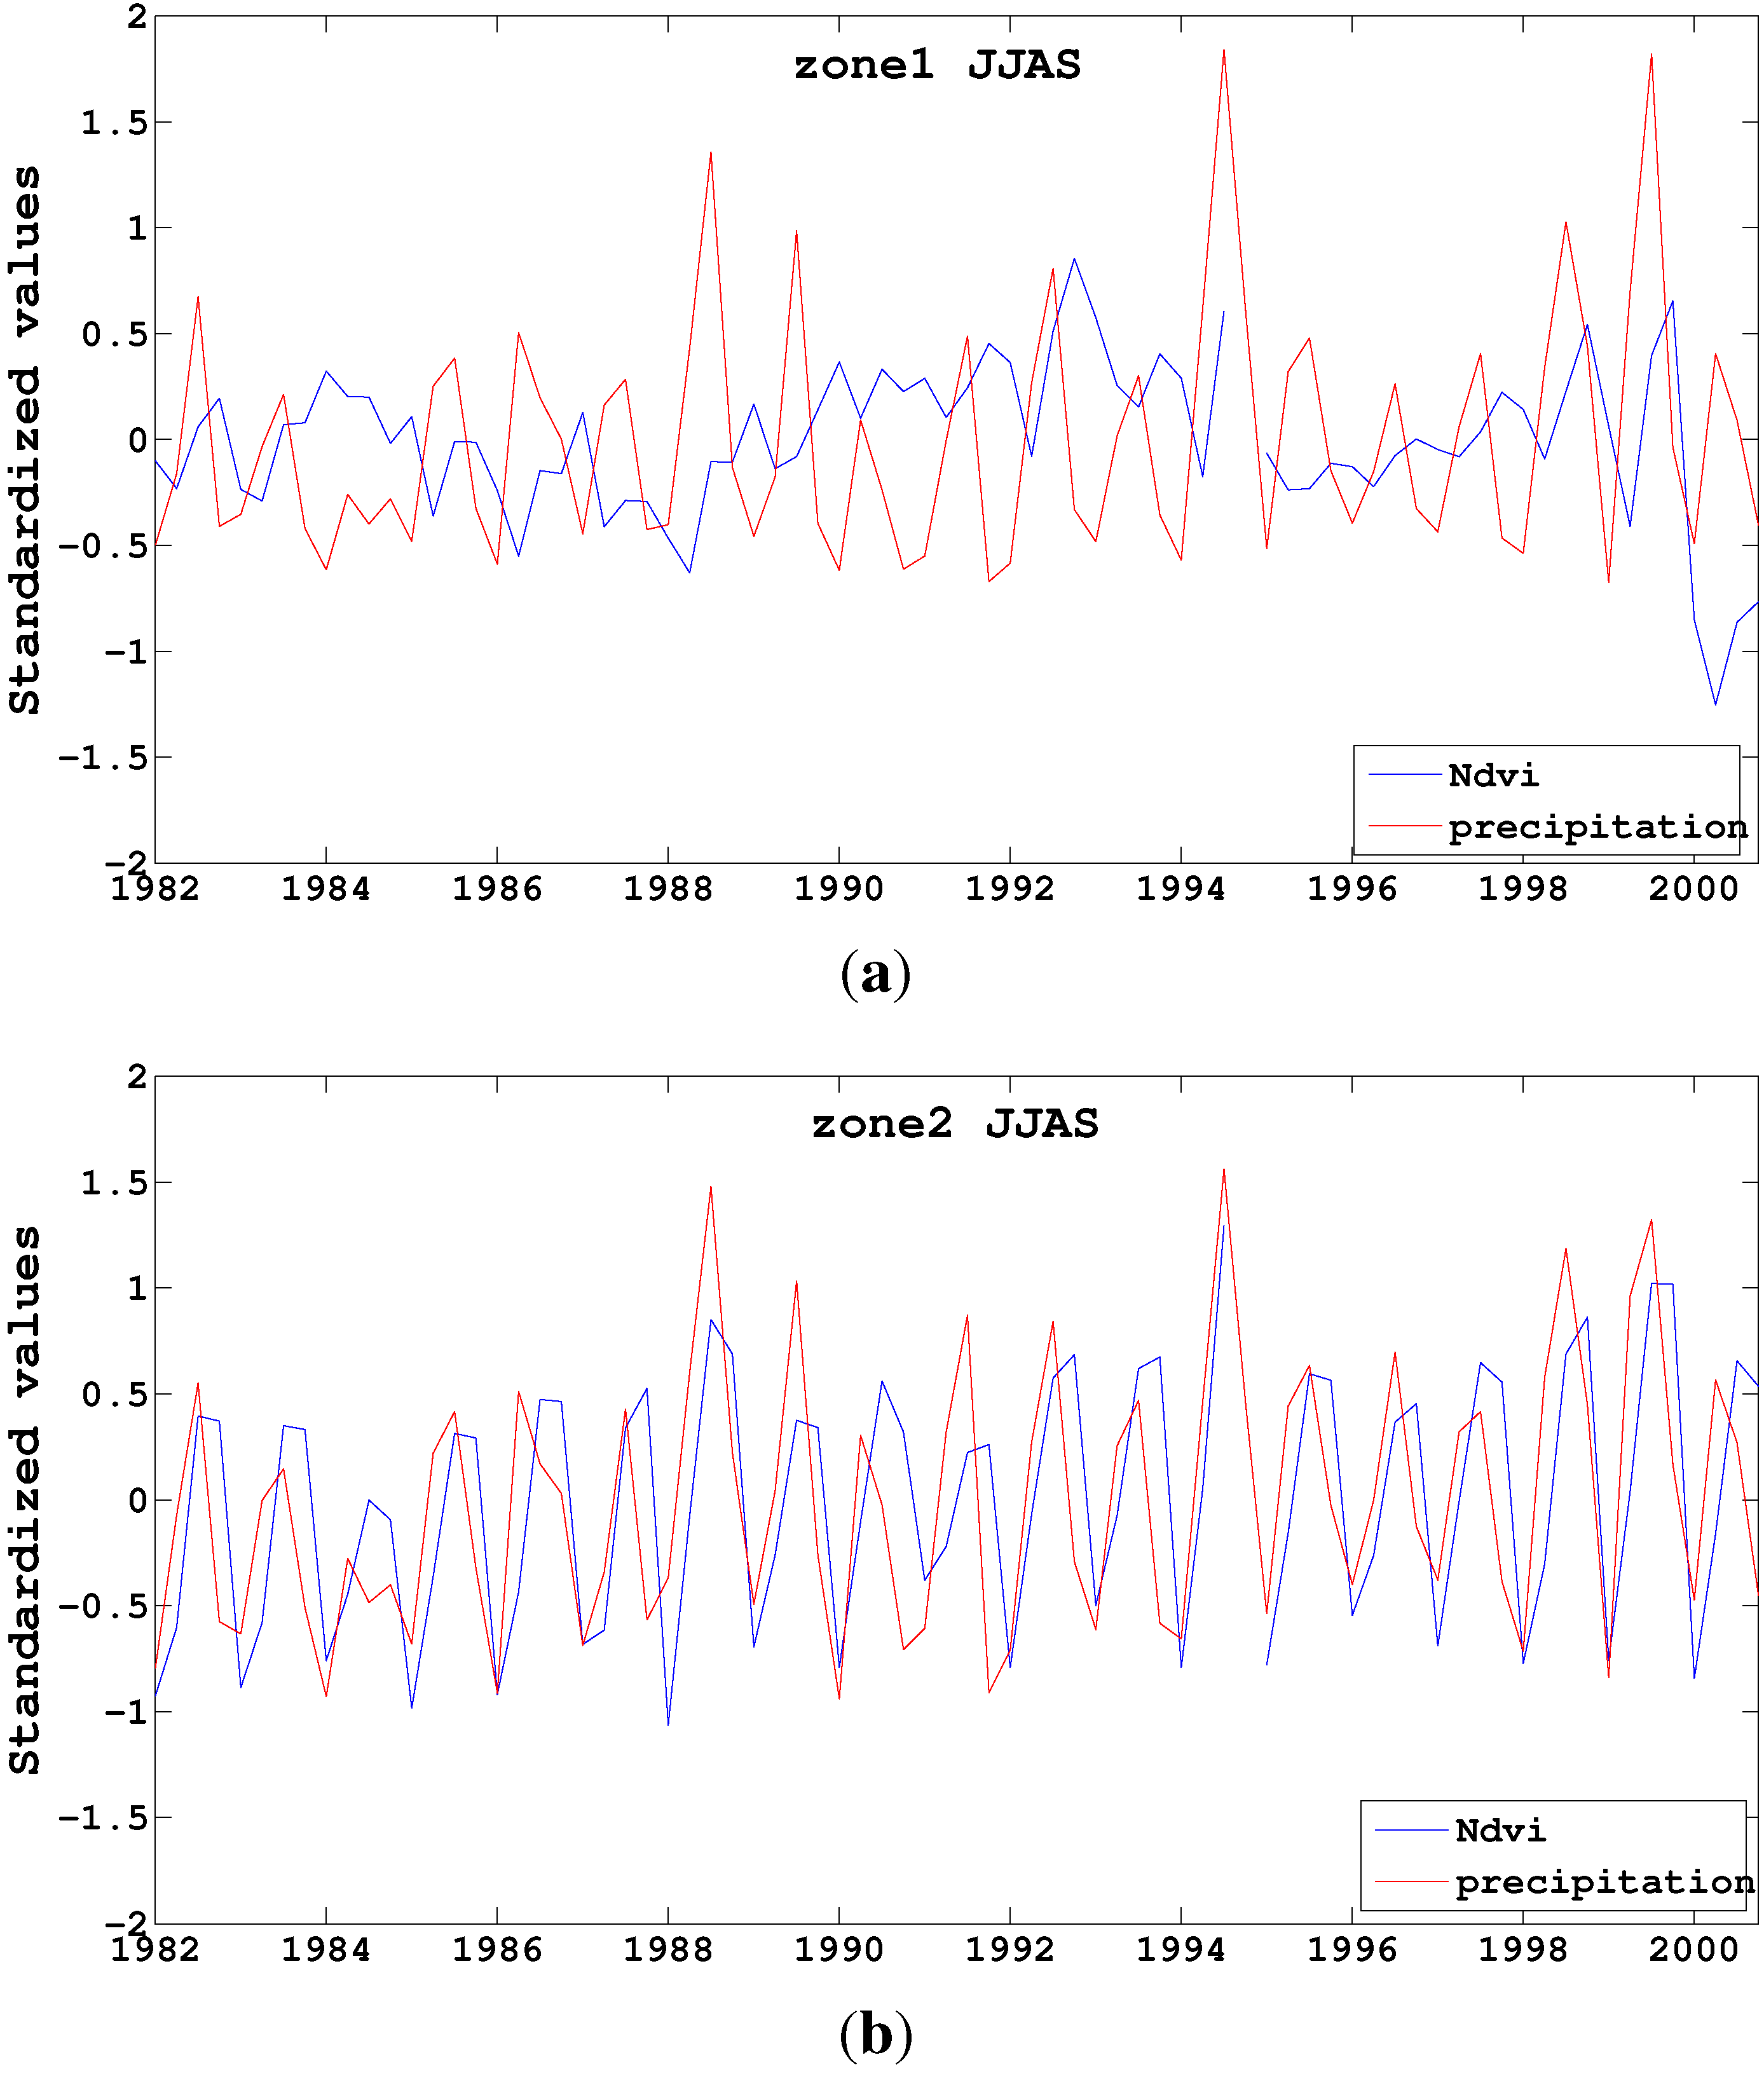
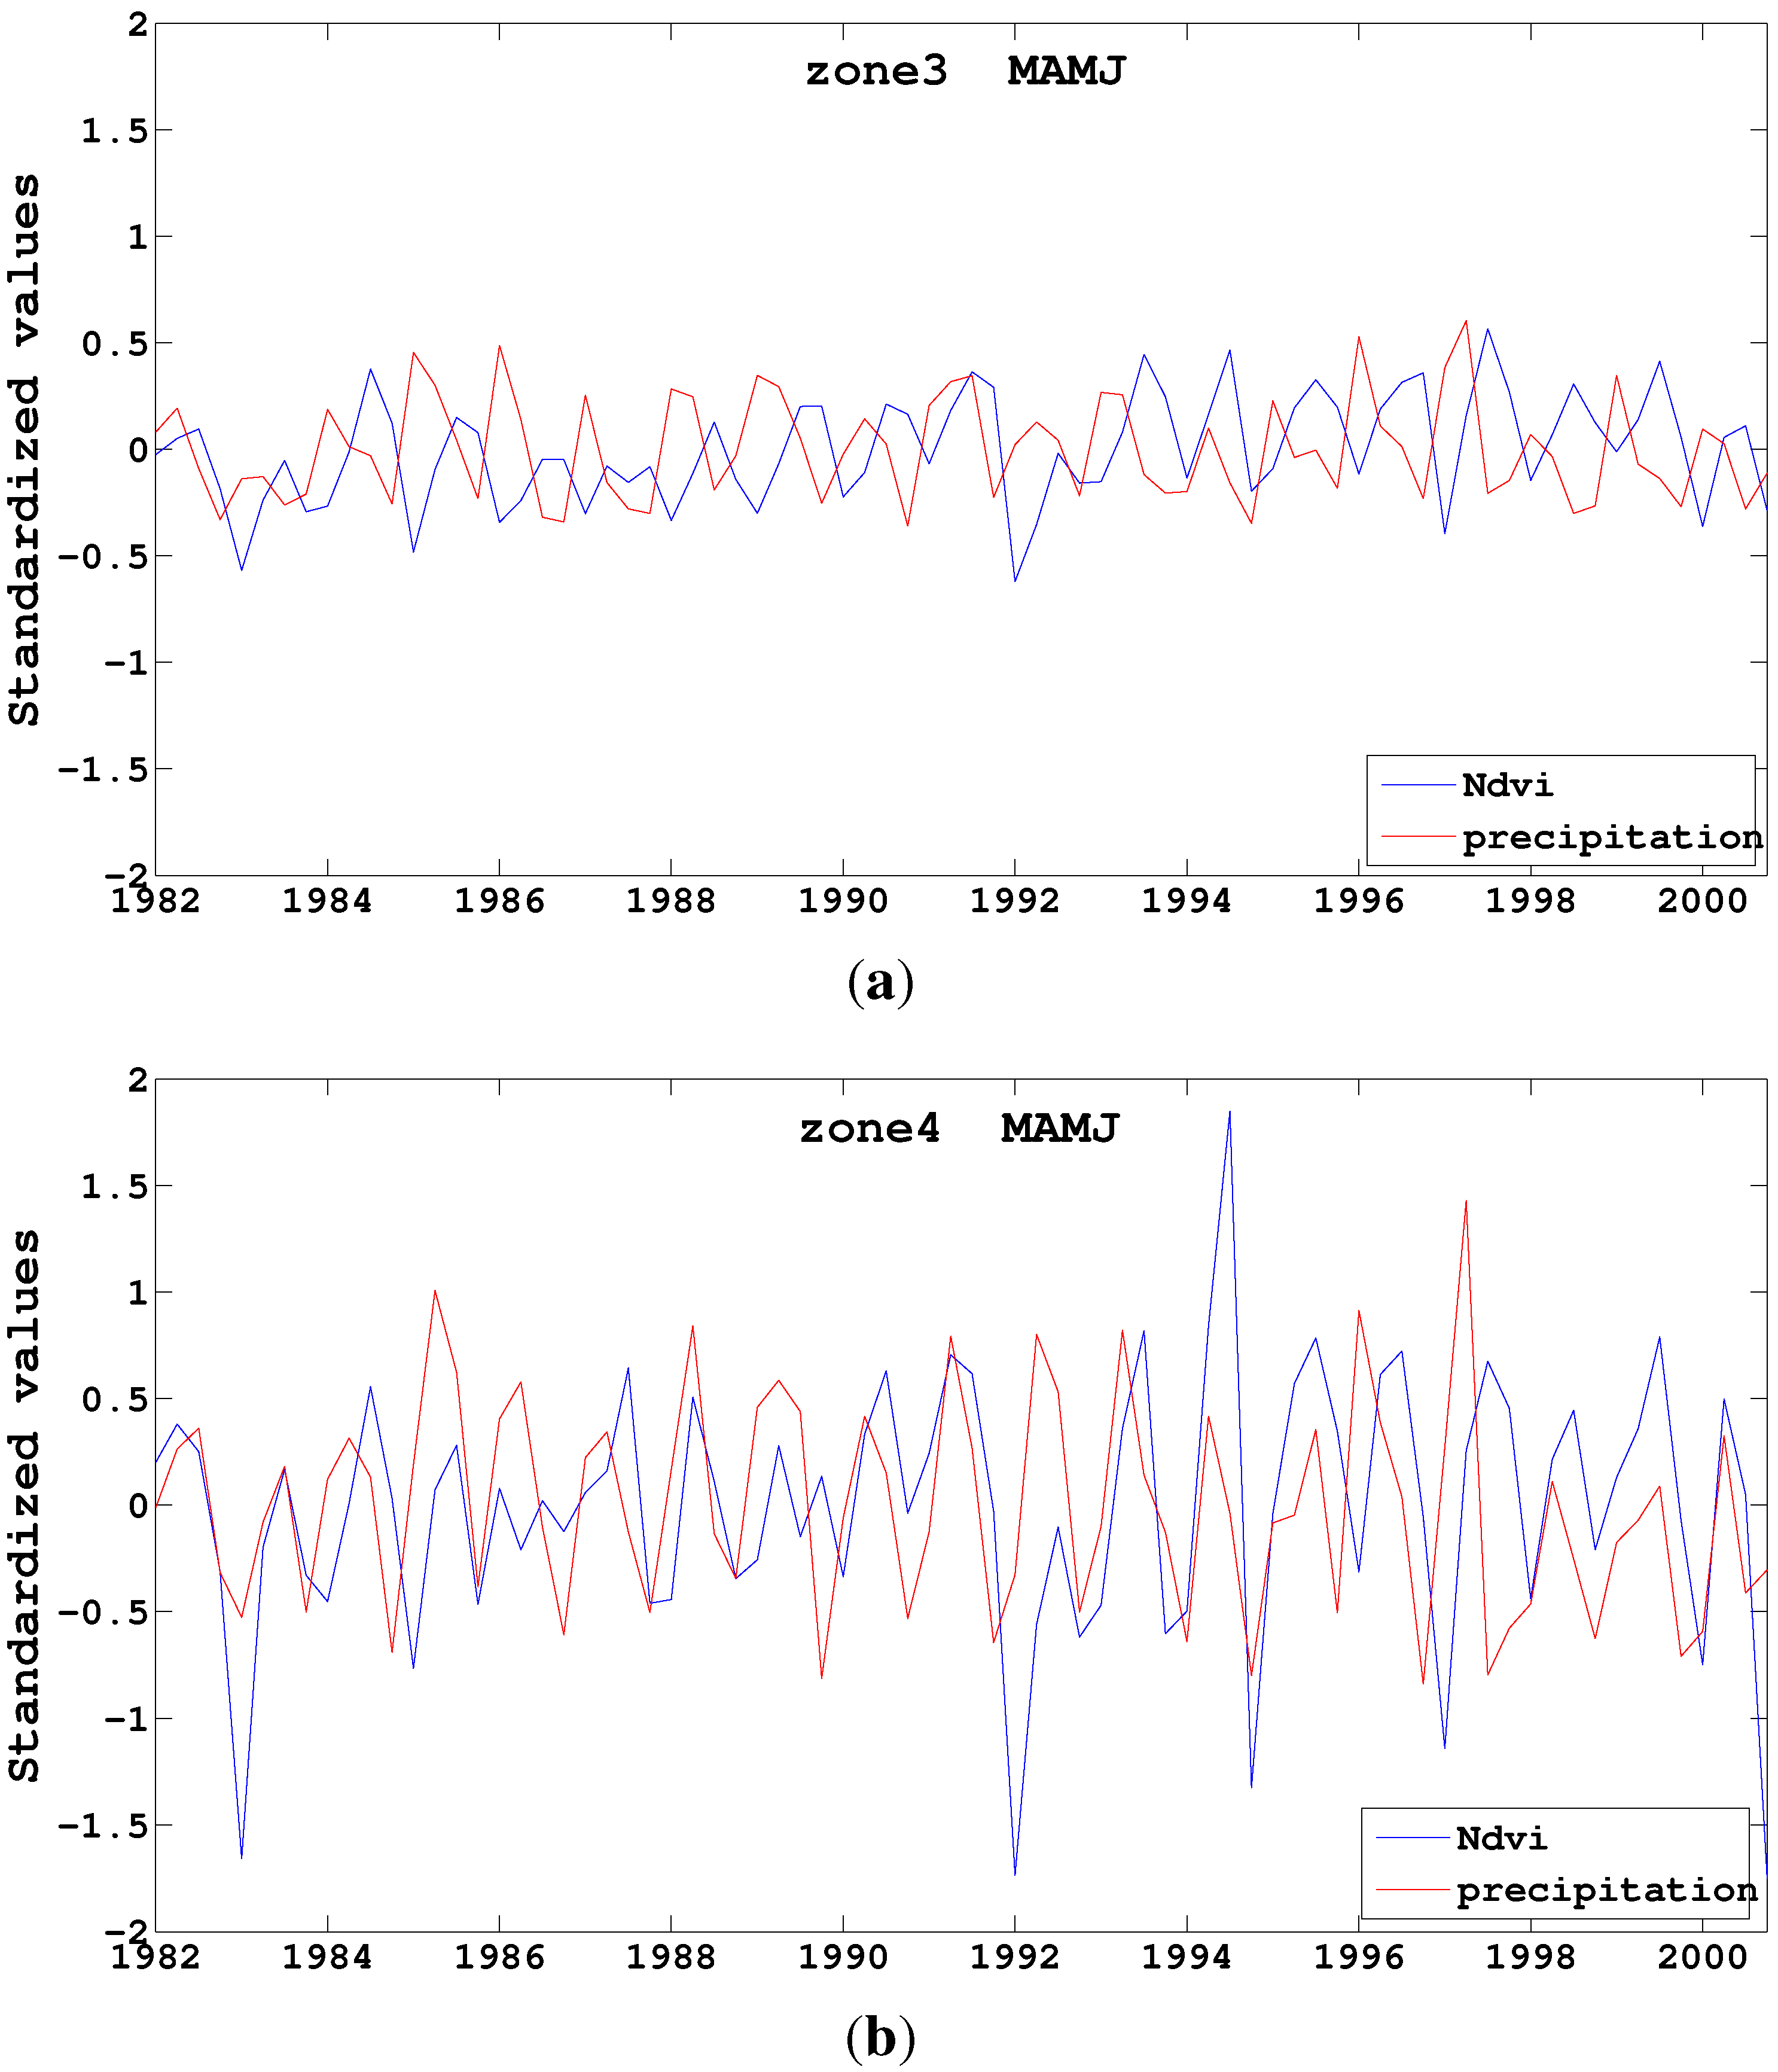
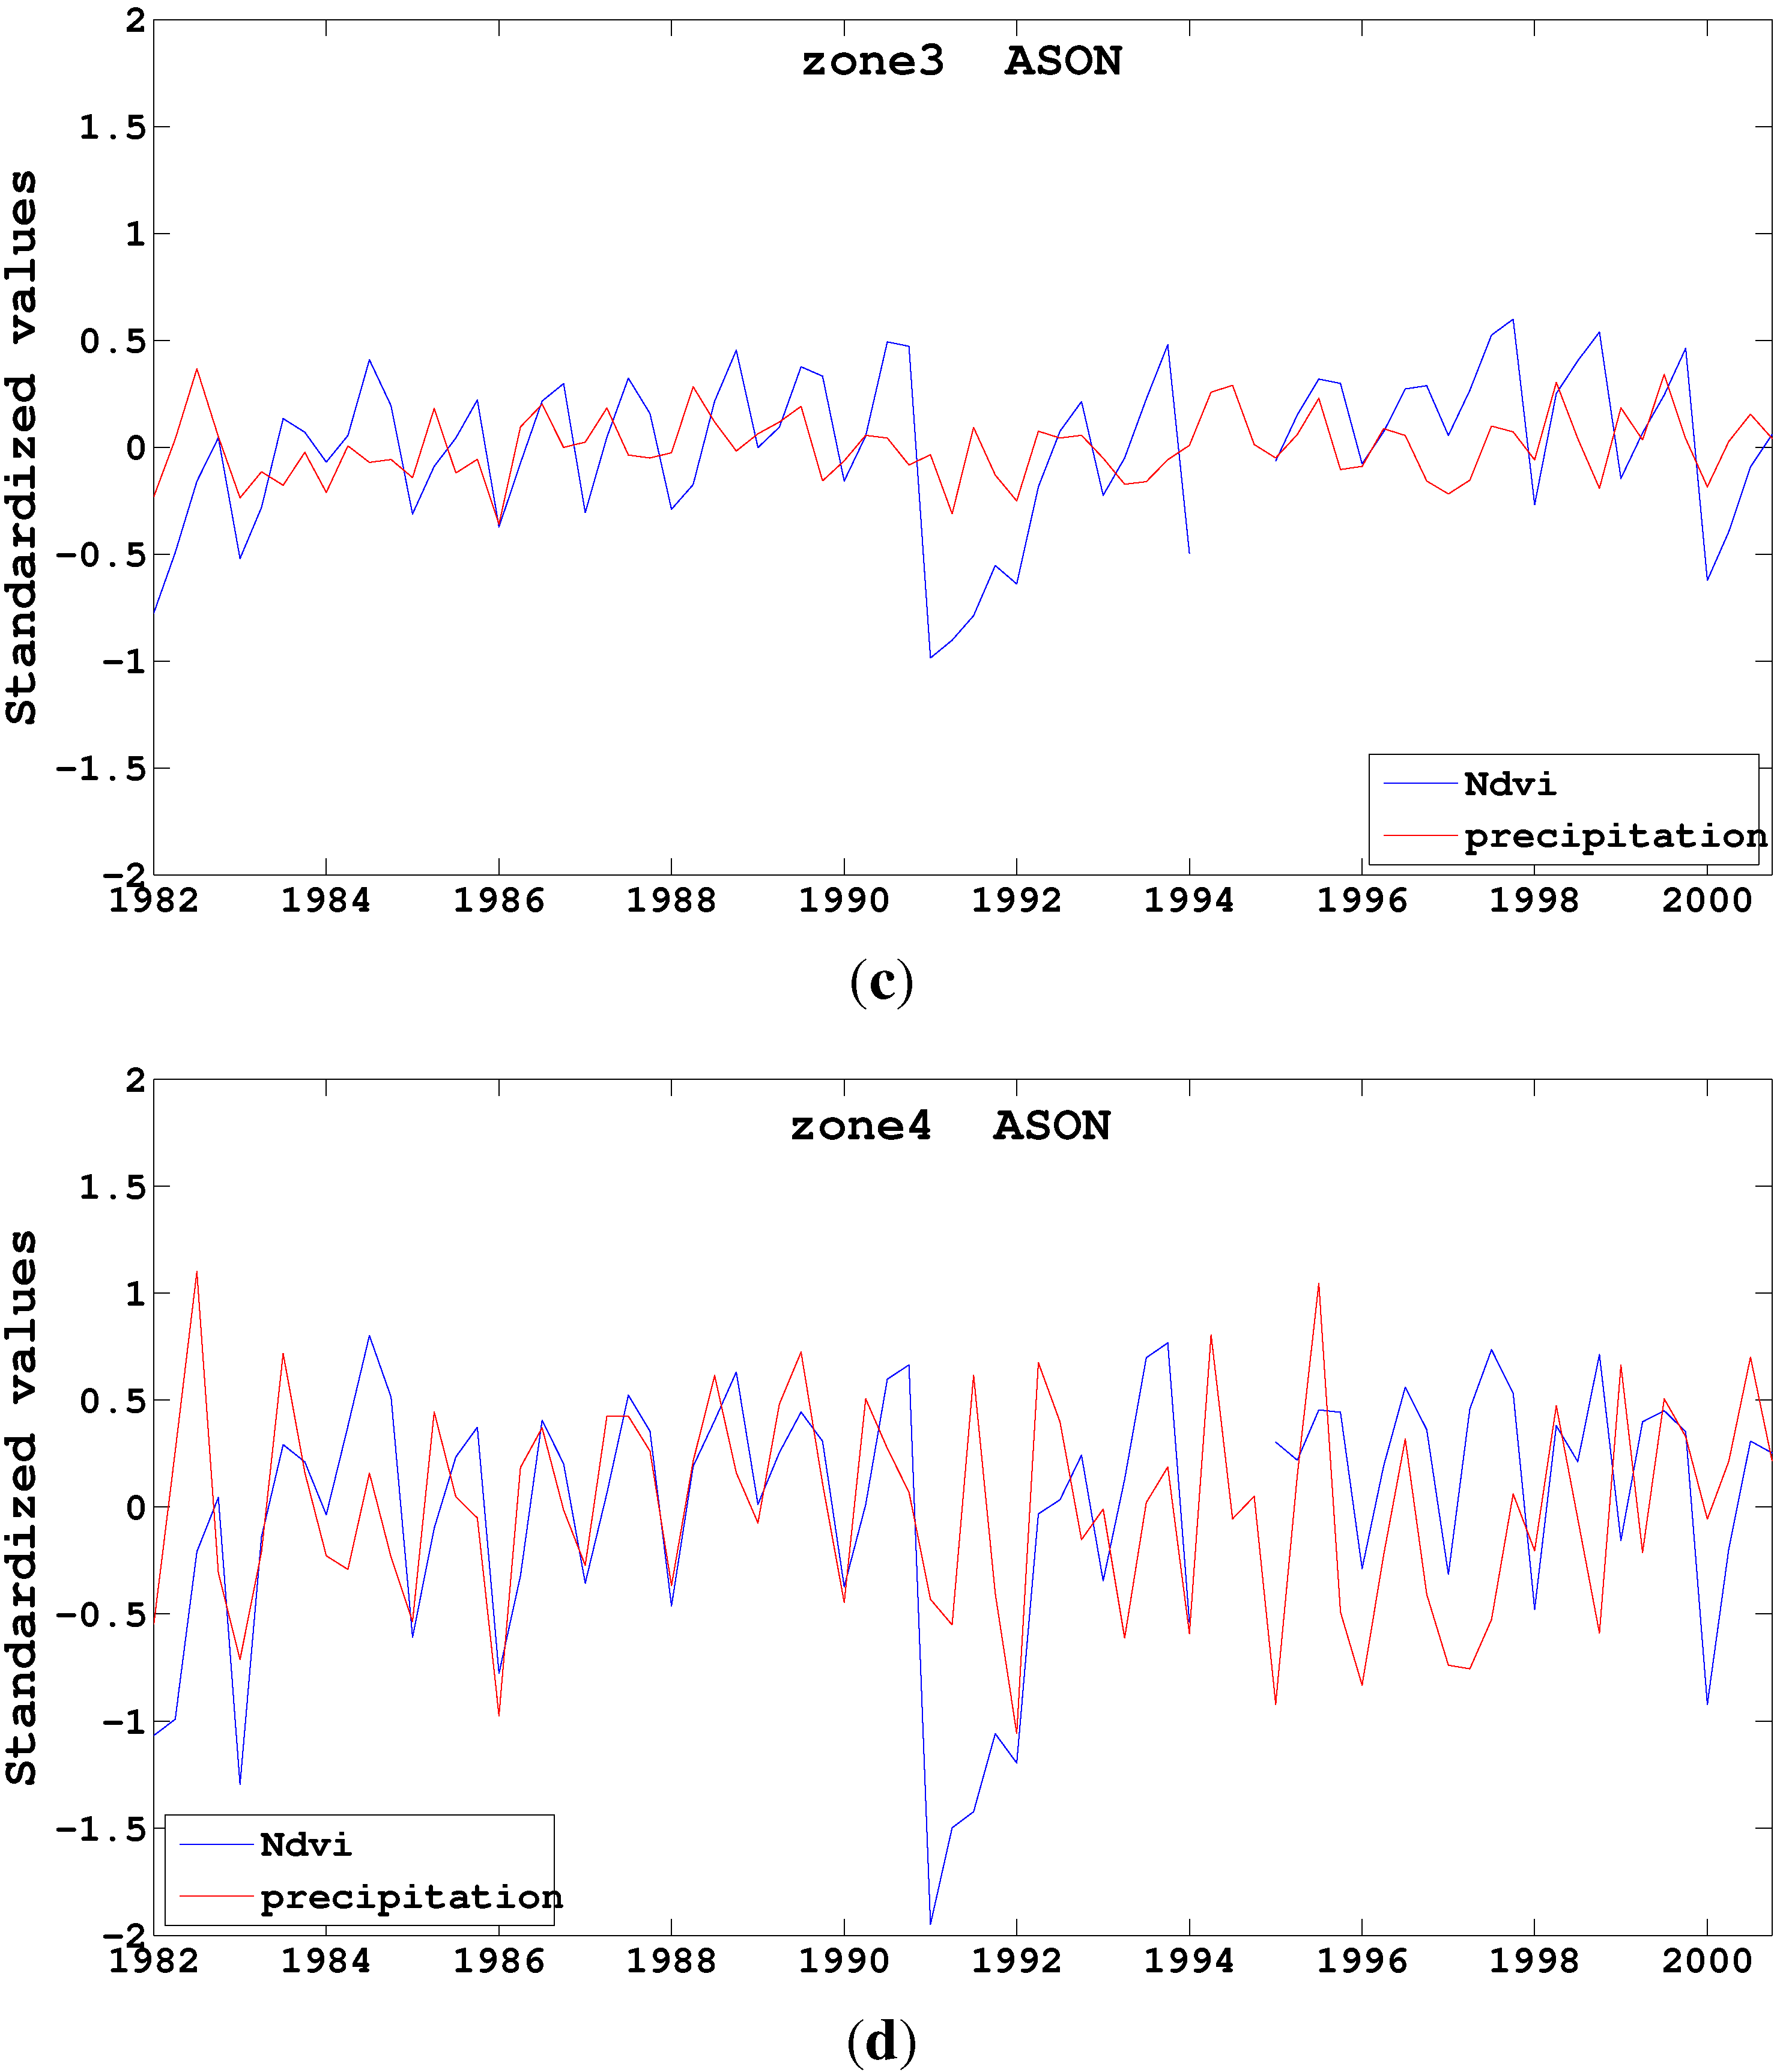
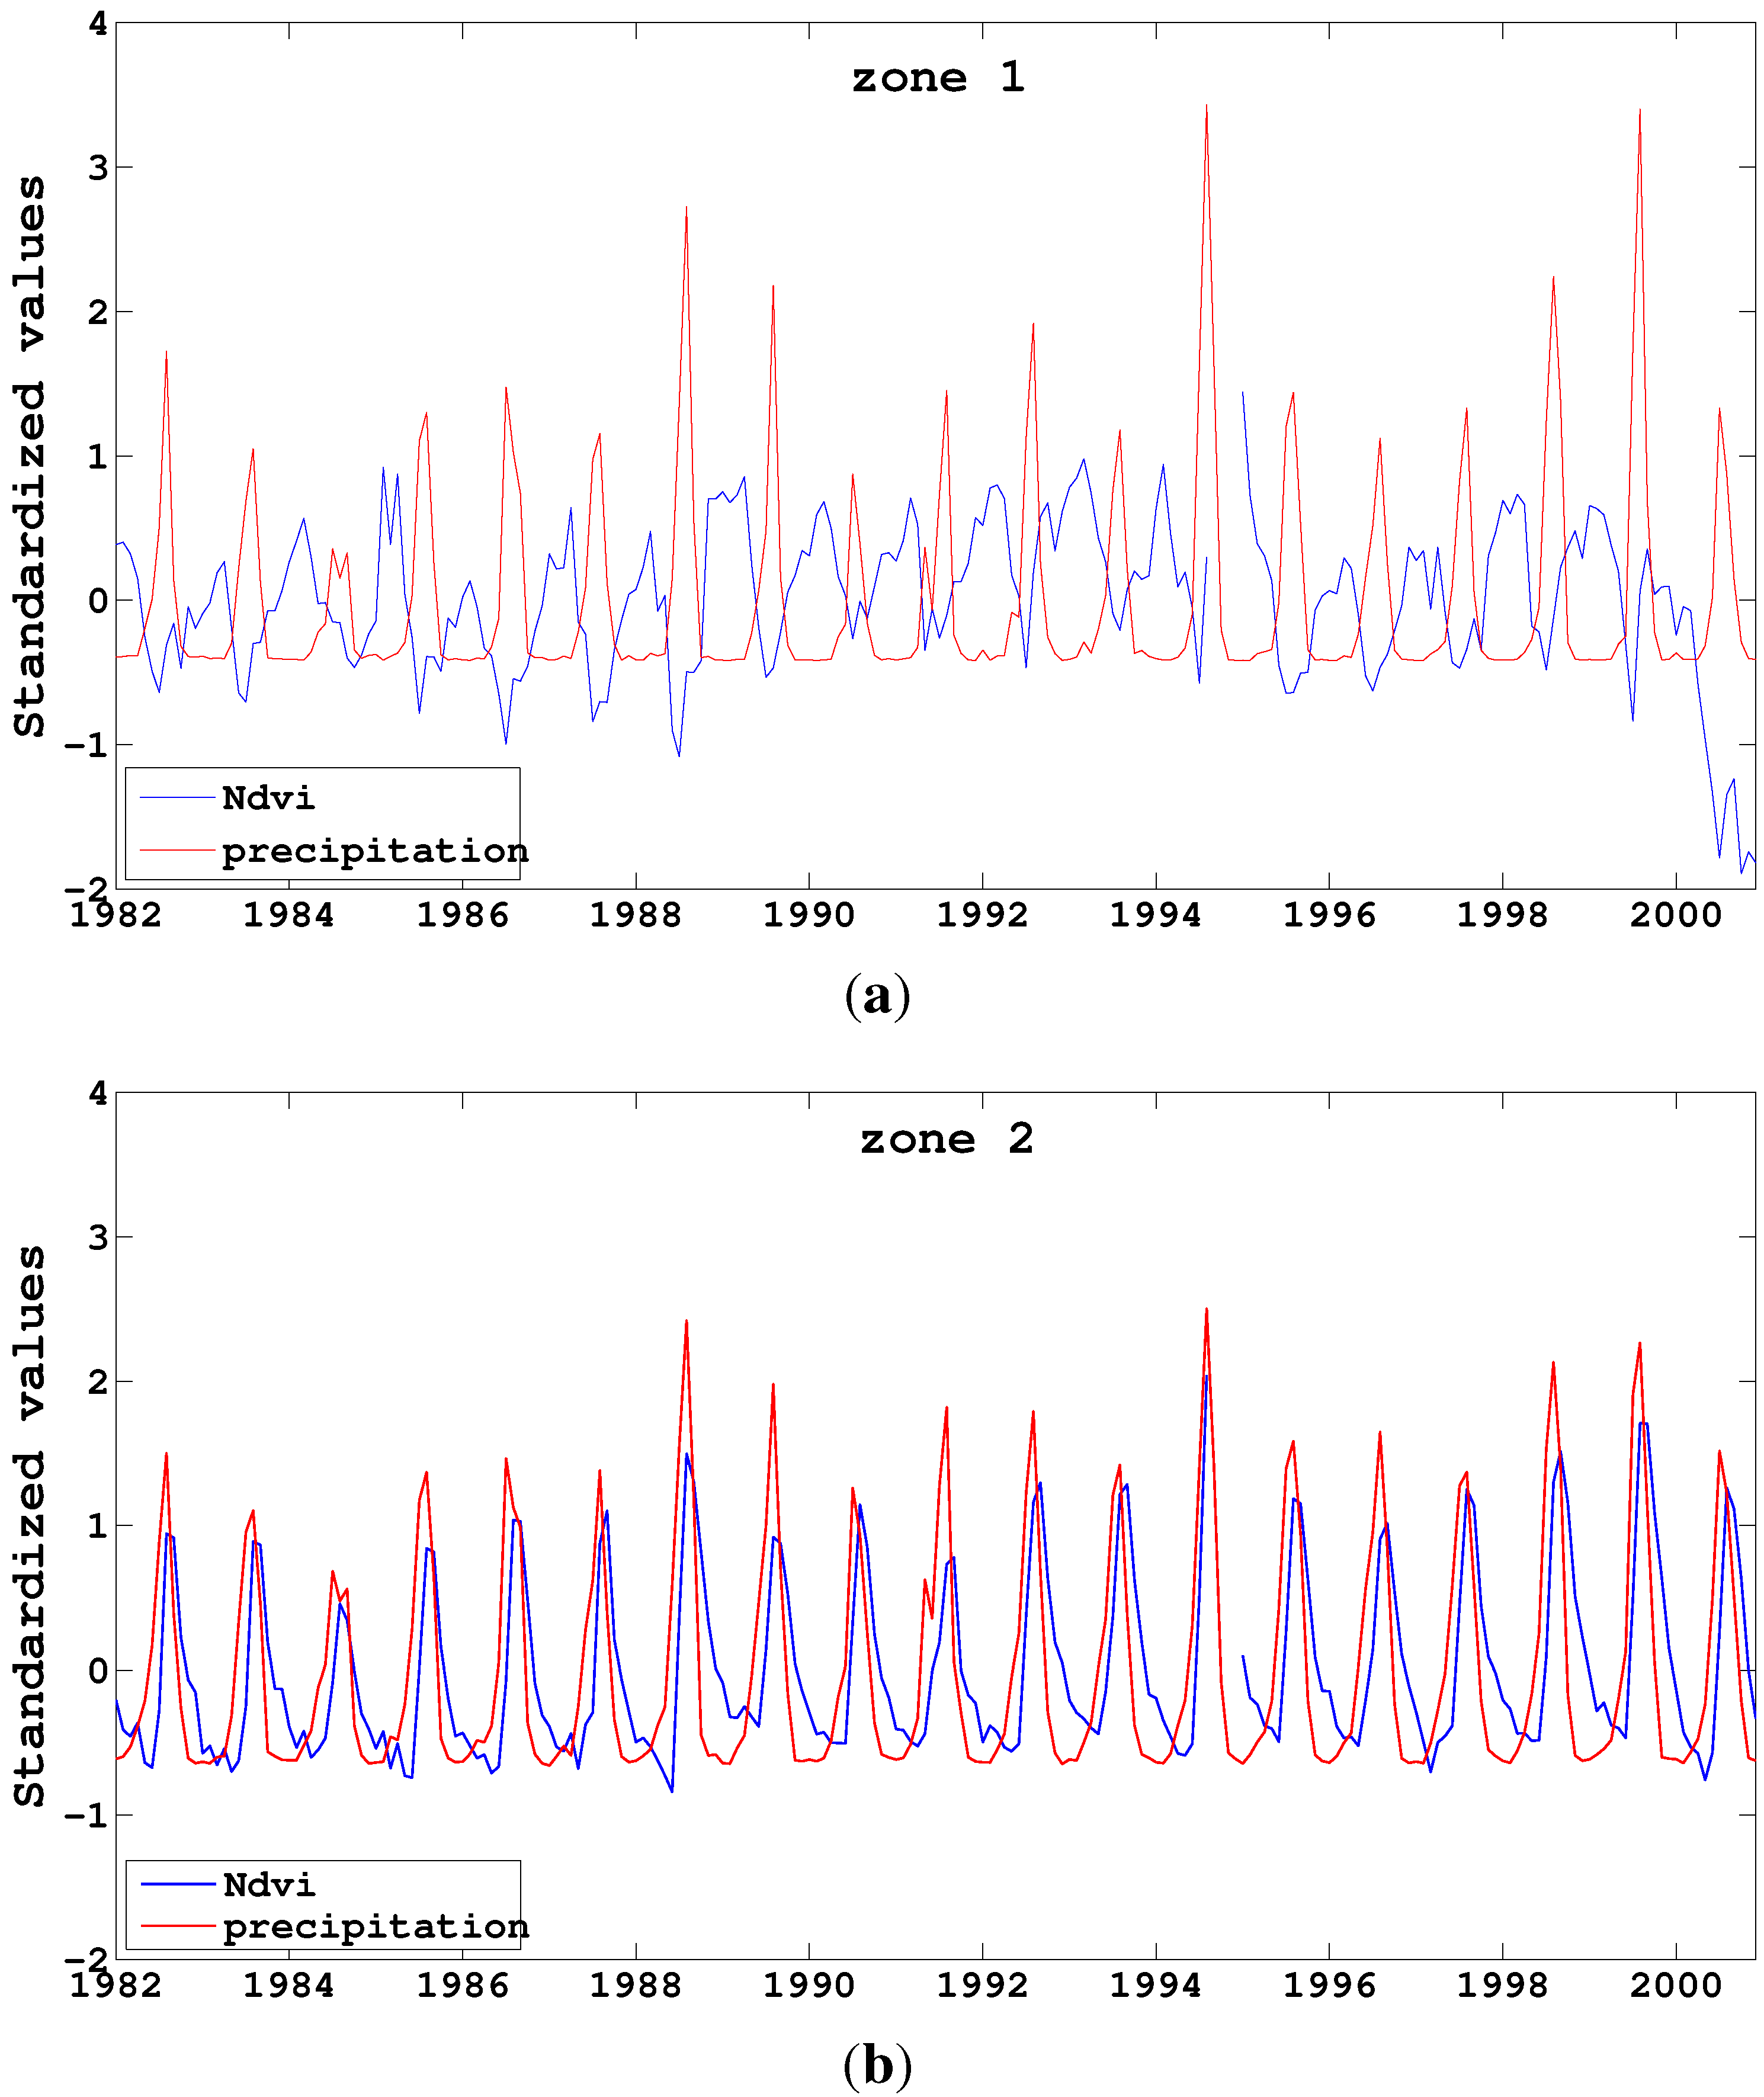
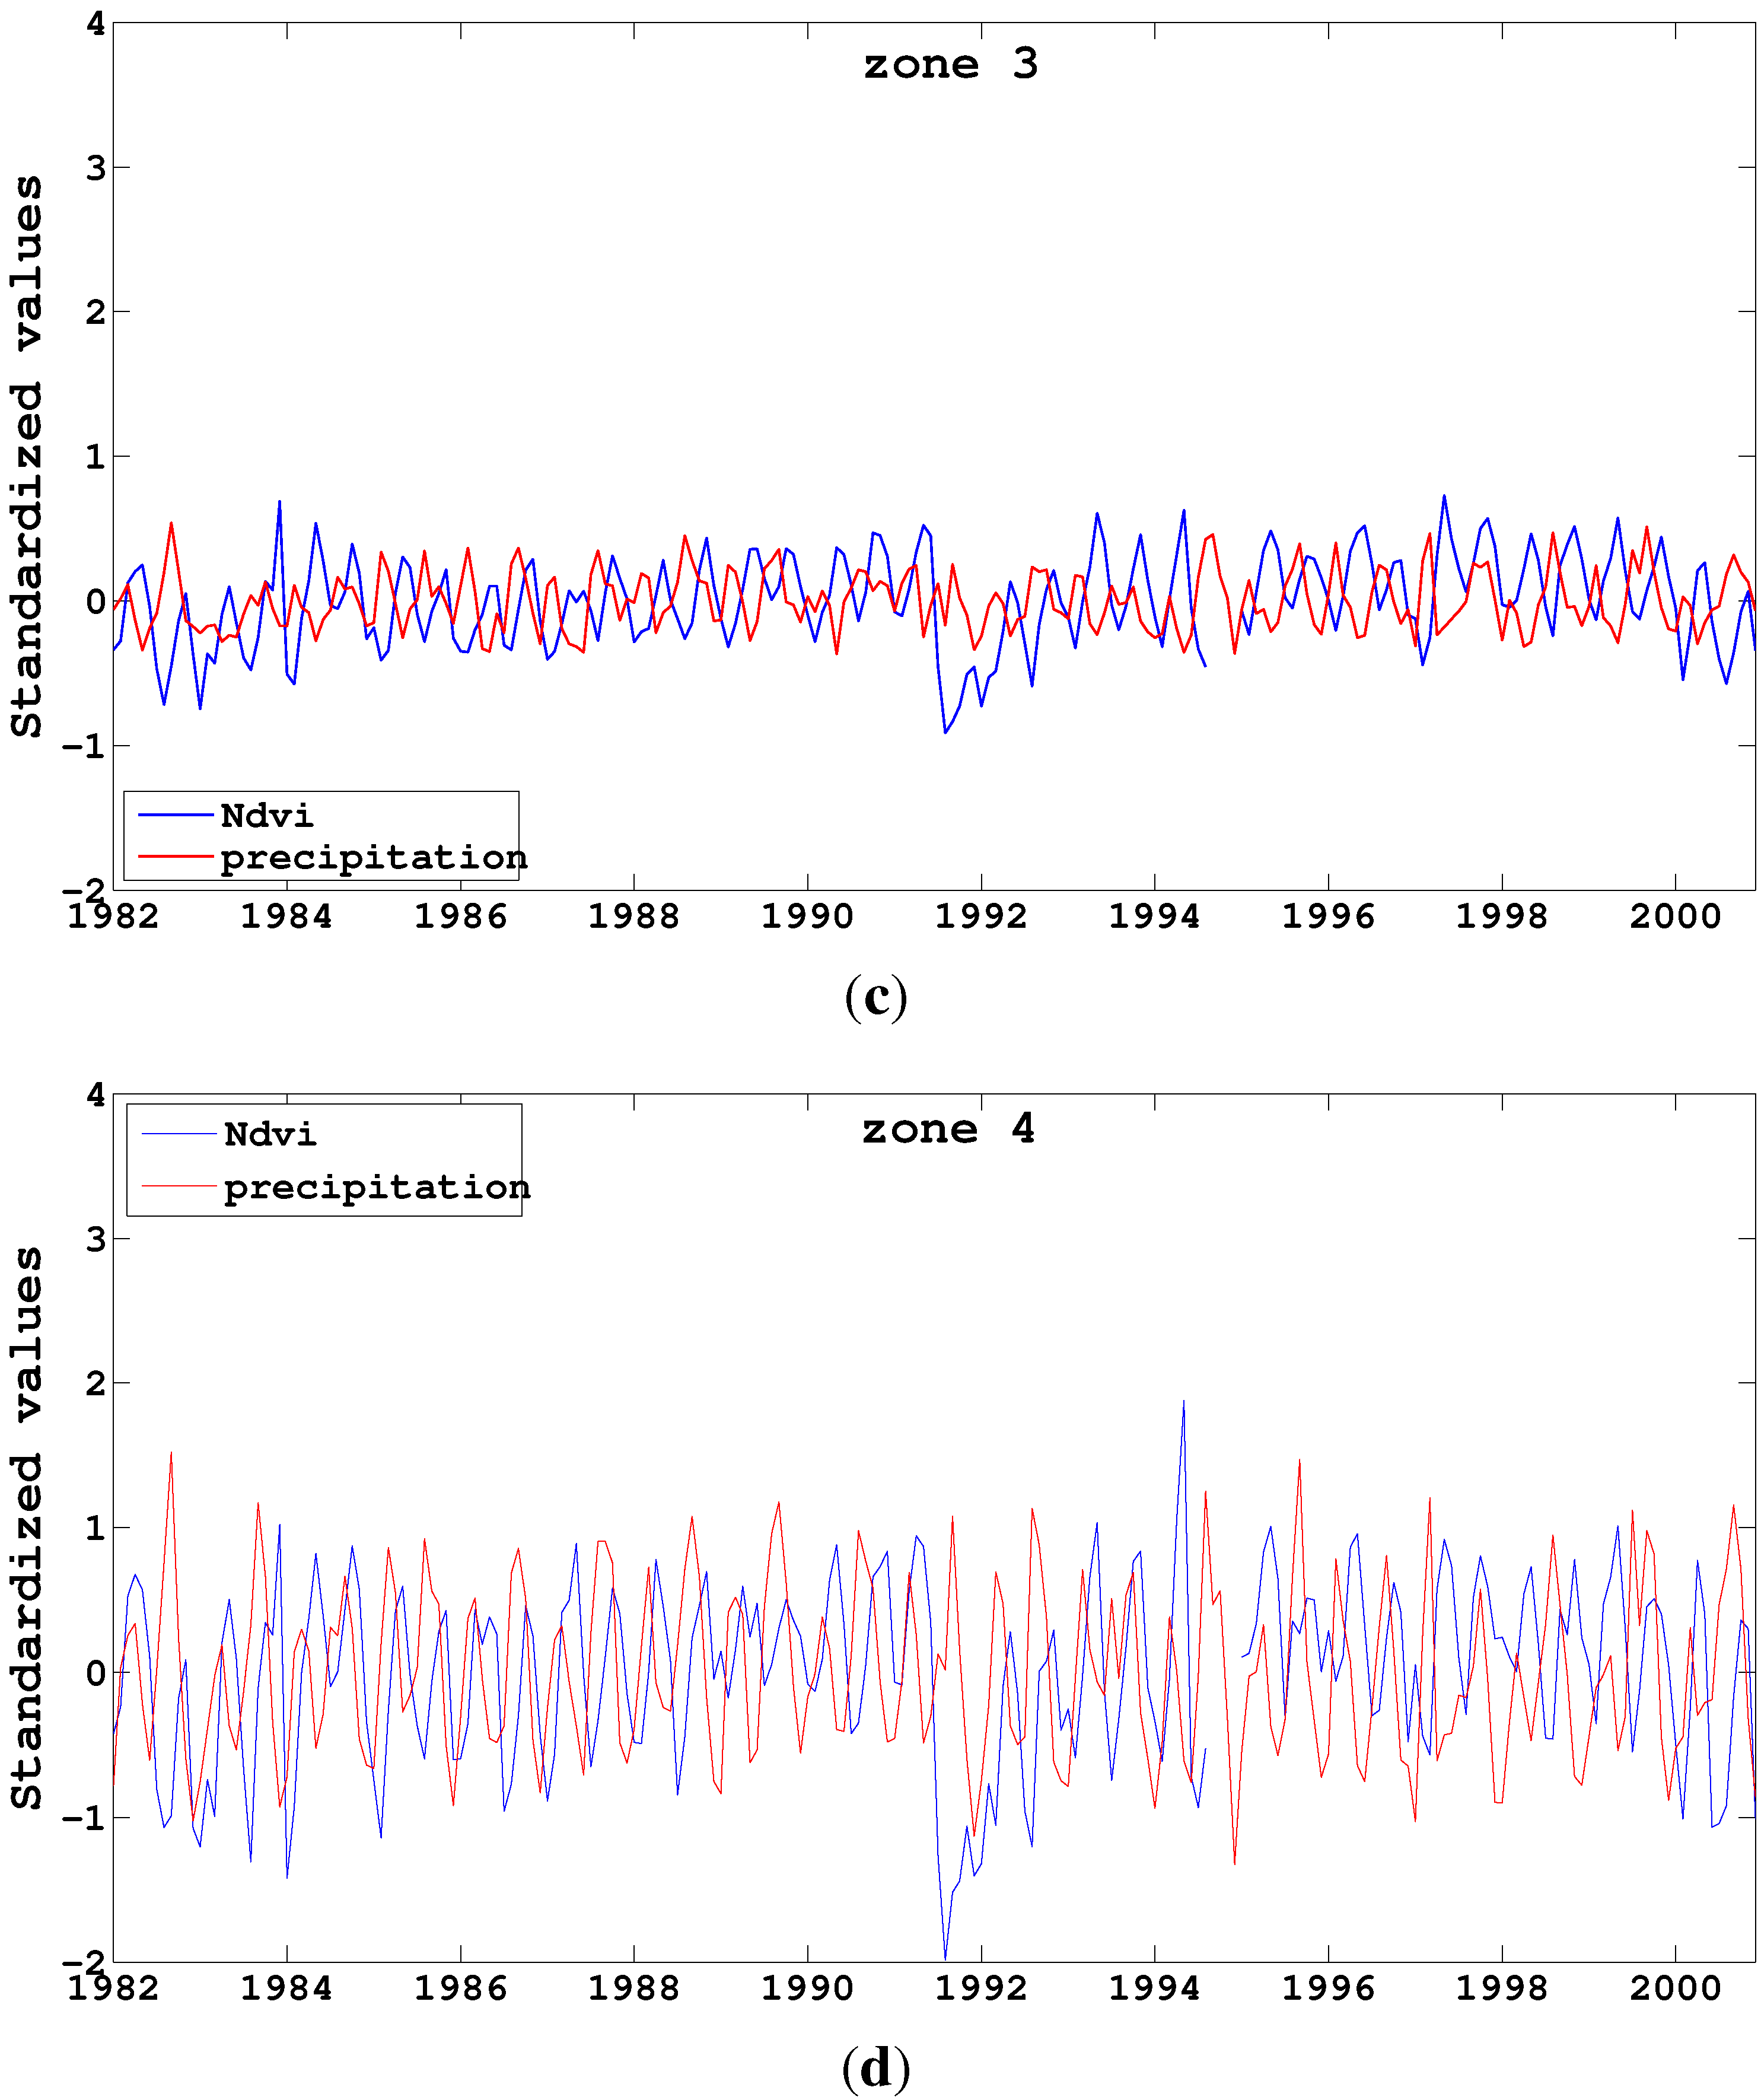
4.2. Interannual Variability

Once the BCERs have been selected, the relationship between NDVI and rainfall was investigated, by studying the interannual variability of NDVI and rainfall for each BCER zone during the 1982–2000 period. The result is illustrated in Figure 2 and shows the temporal plots for the four BCER.
Figure 2. Interannual variability of monthly averages of Normalized Difference Vegetation Index (NDVI) (blue solid line) and precipitation (red solid line) for the 1982–2000 period over each vegetation type. (a) Zone 1, (b) zone 2 , (c) zone 3 and (d) zone 4.
Atmosphere 04 00411 g002aAtmosphere 04 00411 g002b
The graph on the top of Figure 2 presents this for BCER zone 1, which represents a semi-arid climate with step; here, we observe a unimodal annual pattern for both NDVI and rainfall distribution. The two parameters cycle oppositely: NDVI increases, while rainfall decreases, and at maximum NDVI, minimum rainfall occurs at the same time. The time gap between the consecutive maxima of NDVI and rainfall is round four to six months.
It is important to note that the gap observed on the NDVI plot from September through December, 1994, is related to the missing data over these months. No data were recorded during this time. The magnitude of NDVI fluctuates slightly even when rainfall shows much greater variability. This amplitude is about three for NDVI and four for the rainfall.
BCER zone 2, characterized by a dry sub-humid climate, savannah and brush-grass savanna, also shows a unimodal annual cycle for rainfall and NDVI. Both variables demonstrate a very similar trend with a one month time gap in the response of the NDVI to rainfall. In addition, the amplitude of NDVI and rainfall are very close, being about 2.75 and three, respectively. NDVI reaches its maximum at about two, and its minimum value falls below −0.75, while maximum rainfall is attained at 2.5 and the minimum, around −0.7.
The NDVI and rainfall distribution of the deciduous forest-woodland (BCER zone 3) defined by moist sub-humid climate resemble closely those of the tropical forest (BCER zone 4), more particularly in the NDVI pattern. Both BCER zones have bimodal annual cycles for both NDVI and rainfall. The NDVI and rainfall trends look very similar. These are generally characterized with high NDVI values. The magnitude of NDVI and rainfall are lower in the deciduous forest-woodland than in the humid tropical forest. That of NDVI is a little higher than that of the rainfall by 1.6 and below one, respectively, in the deciduous forest-woodland. However, in the humid tropical forest, this amplitude is almost identical to that of the NDVI and stands around three. The response time of the NDVI to rainfall varies from one to three months in the two BCERs.
The close resemblance in NDVI and rainfall pattern (in trend and amplitude) in bushland-grass/savannah BCER zones might reveal a close relationship between vegetation and rainfall. Throughout, NDVI shows a clear response to the cycle of rainfall, except in the semi-arid BCER zone, where there is a temporal opposition between NDVI and rainfall. The close similarity between deciduous forest-woodland and humid tropical forest in NDVI pattern could be related to some explanations. Firstly, the deciduous woodland-forest BCER zone is likely similar to the forest BCER zone, with almost the same type of trees. Secondly, the signature of the NDVI for both BCER zones is similar. The two BCER zones only differ in the amplitude of NDVI. The amplitude of NDVI is much lower in the deciduous woodland-forest.

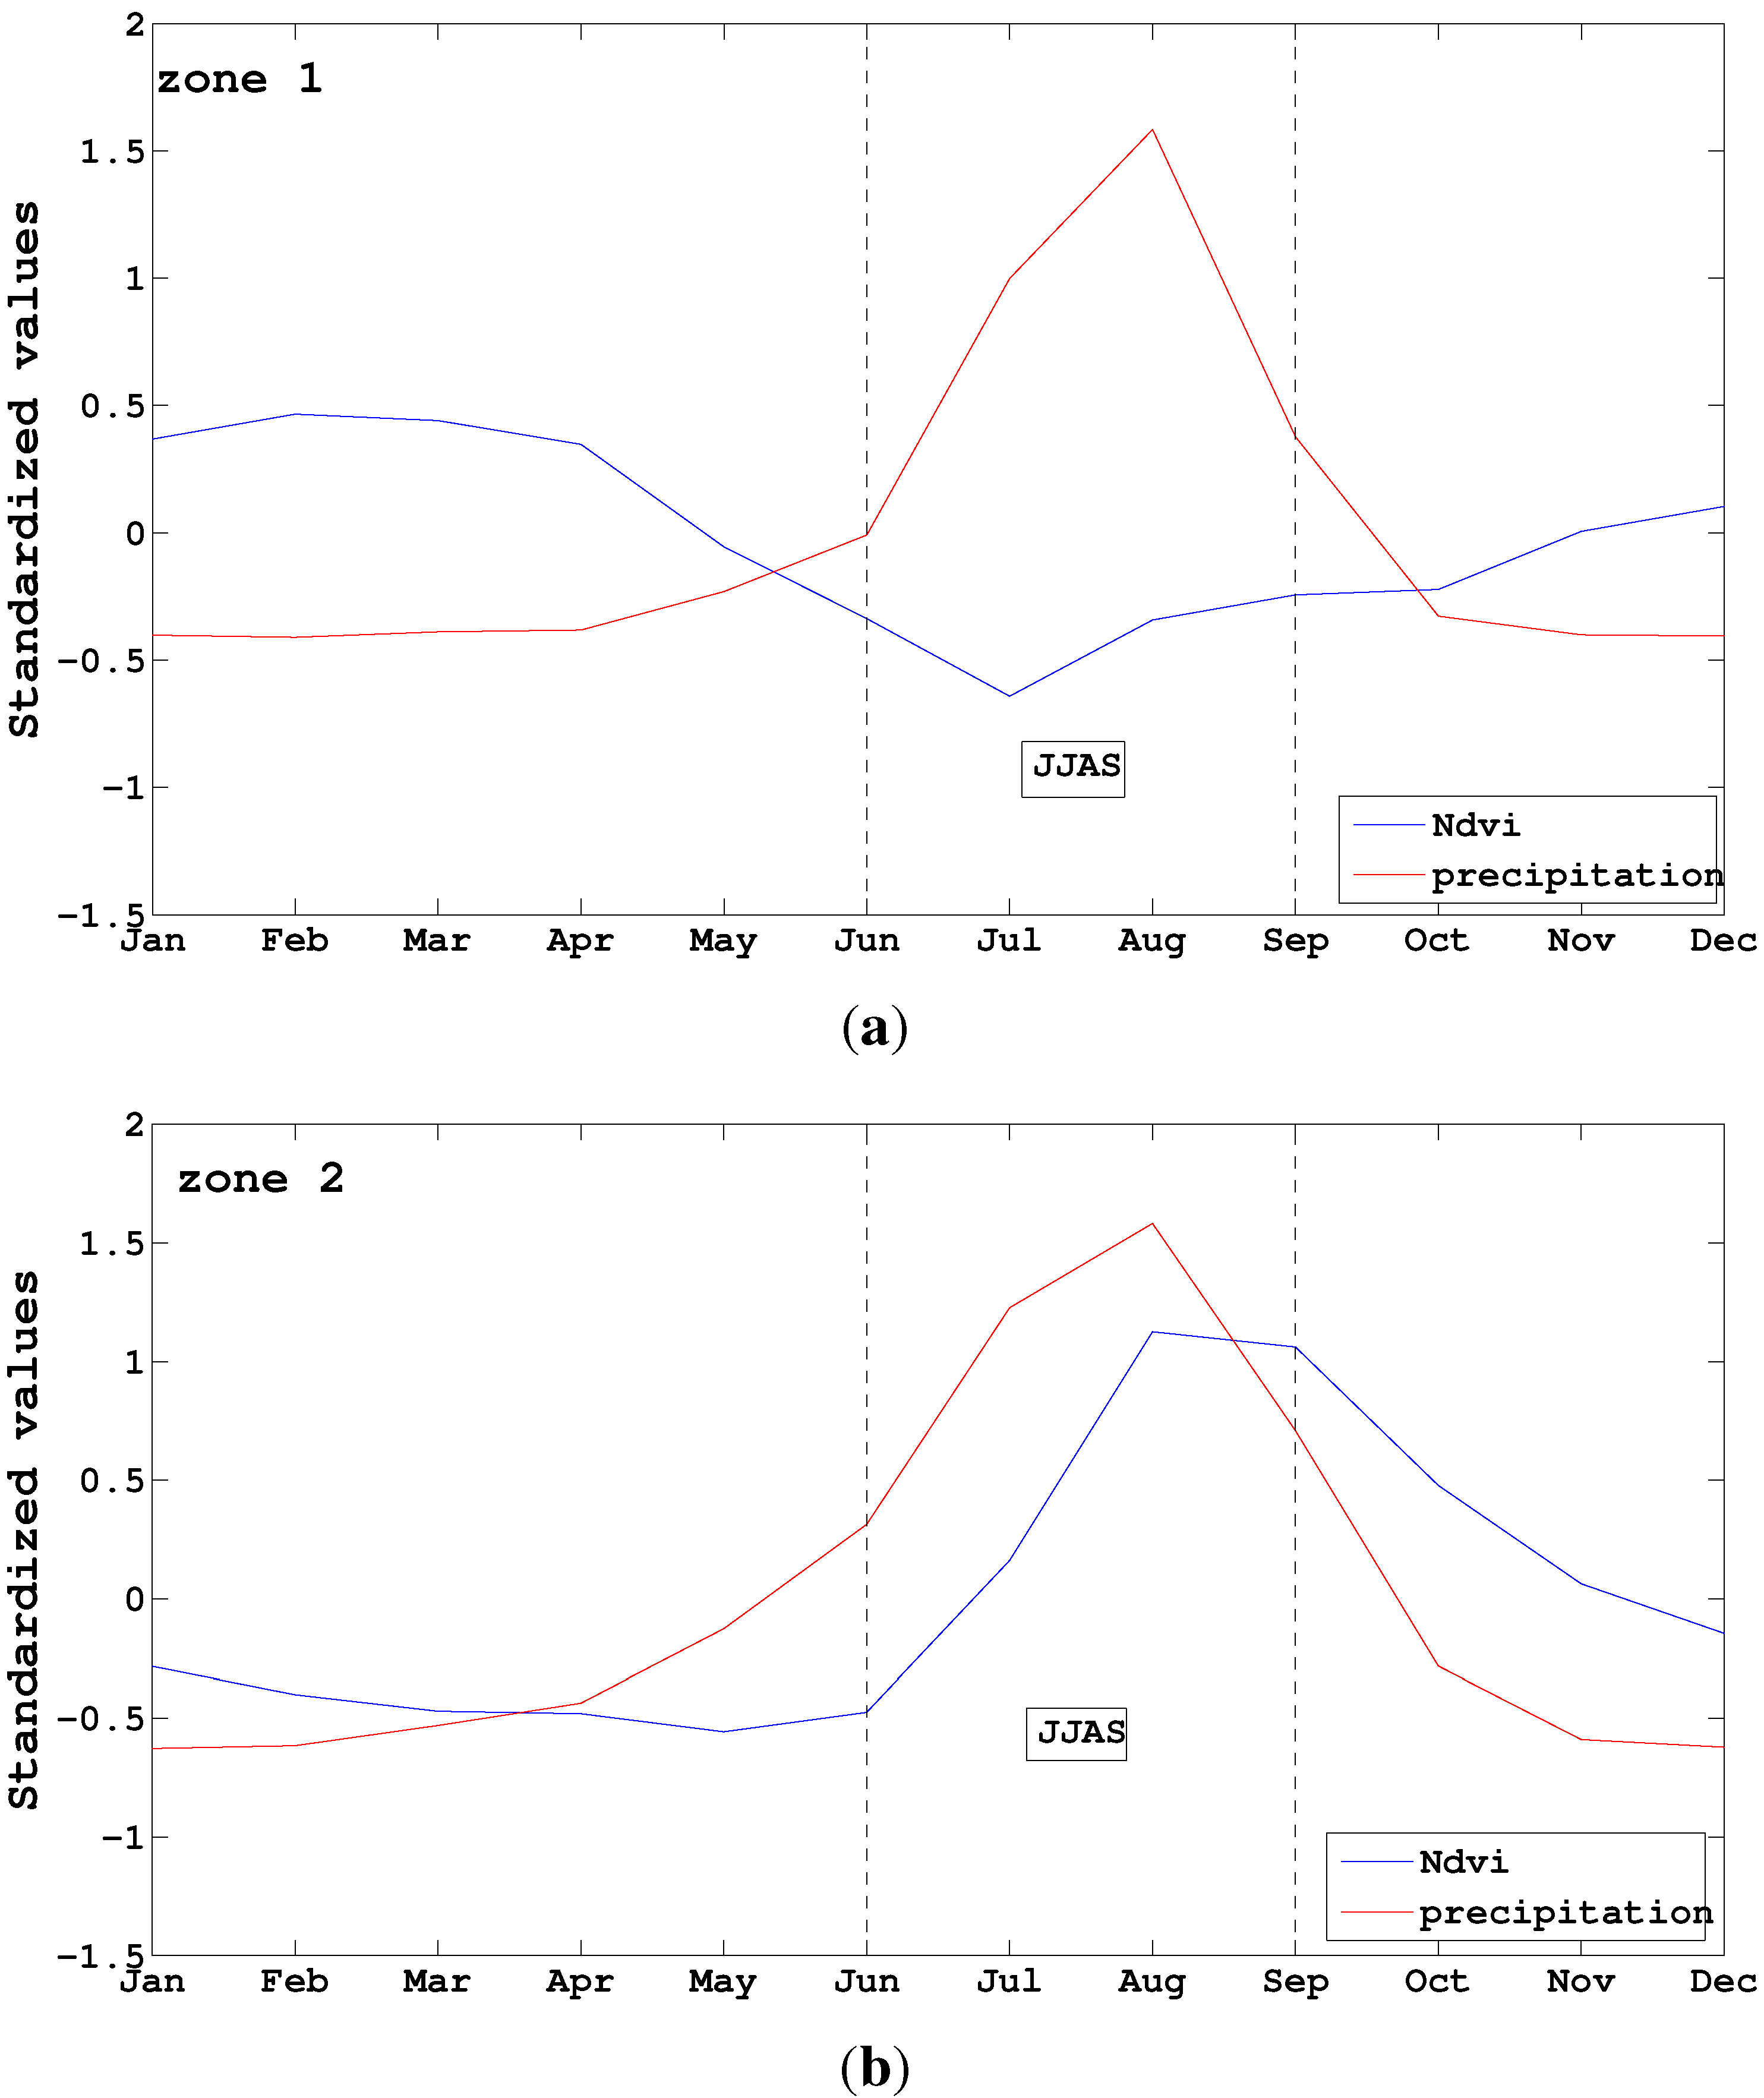
4.3. Intra-Annual and Seasonal Variability

Figure 3 displays the intra-annual variability of the yearly averages of NDVI and rainfall for the 19-year period (1982–2000) over four Central African BCERs. As has already been analyzed for interannual variability, the NDVI and rainfall intra-annual variability presents a unimodal seasonal cycle in bushland/thicket (BCER zone 1) and bushland-grass/savannah (BCER zone 2) and a bimodal seasonal cycle in deciduous woodland-forest (BCER zone 3) and humid tropical forest (BCER zone 4). In the first two BCER zones (zone 1 and 2), the distribution of NDVI and rainfall is almost constant from October through May. This characterizes the long dry season in both BCER zones, where the photosynthetic activity of plants is low. There is a noticeable fluctuation from June to September, defining the short rainy season in these BCER zones. NDVI responds well to the high variation of rainfall during the JJAS (June, July, August, September) season in the bushland-grass/savannah and shows an opposition to the rainfall in bushland/thicket. Thus, it is interesting to study the JJAS variability for BCER zones 1 and 2.
Figure 4 shows the JJAS seasonal variability of monthly averages of NDVI and rainfall for the 1982–2000 period over BCER zones 1 and 2. NDVI delivers a very good response to rainfall for the JJAS seasonal variability in BCER zone 2, where the trend and the magnitude are almost identical. In contrast, there is an abnormality in BCER zone 1, where an opposition in trend or in shape between NDVI and rainfall is observed, except in the years 1982, 1994, 1998 and 1999, where NDVI peaks correspond to those of rainfall.
Figure 3. Intra-annual variability of yearly averages of NDVI (blue solid line) and precipitation (red solid line) within the 1982–2000 period over each vegetation type. (a) Zone 1, (b) zone 2 , (c) zone 3 and (d) zone 4.
Atmosphere 04 00411 g003aAtmosphere 04 00411 g003b
Figure 4. JJAS (June, July, August, September) seasonal variability of the monthly averages of NDVI (blue solid line) and precipitation (red solid line) for within 1982–2000 period over bioclimatic ecoregion zones 1 (a) and 2 (b).
Atmosphere 04 00411 g004
Figure 5 presents the MAMJ (March, April, May, June) and ASON (August, September, October, November) seasonal variability of the monthly averages of NDVI and precipitation for the 1982–2000 period over BCER zones 3 and 4. On the two last graphs of Figure 5, two mean peaks occur around the seasons, MAMJ and ASON, in the deciduous forest-woodland and tropical forest. This illustrates the two rainy seasons (the short and the long), which are characterized by high variation of precipitation and then intense photosynthetic activity. It therefore is useful to analyze the NDVI and rainfall year-to-year change of MAMJ and ASON seasons over BCER zones 3 and 4.
Figure 5. MAMJ (March, April, May, June) (a,b) and ASON (August, September, October, November) (c,d) seasonal variability of monthly averages of NDVI (blue solid line) and precipitation (red solid line) for the 1982–2000 period over bioclimatic ecoregion zones 3 (a,c) and 4 (b,d).
Atmosphere 04 00411 g005aAtmosphere 04 00411 g005b
NDVI presents a clear response to rainfall, either in the MAMJ season or the ASON season, for BCER zones 3 and 4. However, this response is more pronounced in the ASON season. One reason would be that rainfall is higher and more regular throughout this season. On the other hand, the NDVI and rainfall magnitude are slightly greater in the MAMJ season. The maximum values are nearly constant, and the distribution is concentrated around the mean value for the ASON season.
Vegetation responds to rainfall is more evident in seasonal variability than in the interannual variability, and the response for the ASON season is much better than the MAMJ season in BCER zones 3 and 4.
The results show that these BCER zones differ noticeably in their response to rainfall variability. Overall, NDVI demonstrates a clear response to rainfall. In bushland/thicket (BCER zone 1), the NDVI distribution pattern presents an opposite trend to the rainfall. The structure of the season in zone 1 rain seems to be the major cause of differences between semi-arid regions in the seasonal cycles of the photosynthetic activity of the vegetation. In particular, this determines the effectiveness of the use of rainfall by vegetation. A season of short and intense rainfall as observed in zone 1 is less favorable to the strong development of vegetation (Martiny et al. [46]). The bushland-grass/savannah illustrates the most important result of our work. There is a very good and immediate response of NDVI to the rainfall variability. This response is demonstrated in the similarity in magnitude and shape of the two parameters, which are very close. Each NDVI peak clearly corresponds to rainfall cycle. There is therefore a strong relationship between NDVI and precipitation in bushland-grass/savannah.

4.4. Correlation between Monthly NDVI and Precipitation

The linear correlation between monthly NDVI and rainfall was computed for each BCER. It was evaluated for concurrent monthly NDVI and rainfall data and for different time lags, minus one, two and three months of monthly averages of NDVI with rainfall. Through the values of coefficients of correlation in Table 1, we show that the highest correlation is with a one month time lag of NDVI to rainfall, except in semi-desert/steppe and tropical forest. In semi-desert/steppe, the highest correlation is obtained with concurrent months, while in the tropical forest, it is with a three-month time lag.
Table 1. Correlation between monthly NDVI and rainfall in various intervals for four bioclimatic ecoregion (BCER) zones. The parameter, nc, is the number of correlation pairs. Columns, from 3 to 7, illustrate the correlation of NDVI with rainfall in the concurrent month (0), one month earlier (−1), the previous month (1); the two previous months (2); and the three previous months (3).
Bioclimatic EcoregionsncTime Lag
(−1)(0)(1)(2)(3)
semi-desert and steppe2240.27250.40300.25600.16720.0210
brush-grass savannah2240.90160.65140.90220.75320.4363
deciduous forest-woodland2240.43270.08600.41690.29650.1107
tropical forest2240.44020.40500.43870.00580.4686
The brush-grass savannah is by far the best correlation in all the time lags of NDVI to rainfall, consistent with interannual and seasonal variability analysis. This result shows, therefore, a very strong linear relationship between NDVI and rainfall in the brush-grass savannah, in particular with a one-month time lag, which is related to fact that vegetation does not respond immediately to precipitation, but rather, to the soil moisture, which is the sum of several monthly precipitation events [47]. The phenological transition points and phases (see [45]) showed that the range between +1 and −1 time lags corresponds to the duration of the maturity of the vegetation.

5. Conclusions

This study analyzes the relationship between NDVI and rainfall for each BCER zone in Central Africa. The interannual variability shows a similarity between vegetation and rainfall in the brush-grass savannah, deciduous forest-woodland and tropical forest. This resemblance is much more pronounced in brush-grass savannah, where vegetation delivers a very close response to rainfall. The analysis of seasonal variability also shows resemblance to interannual variability. However, the NDVI and rainfall patterns are much more close in the ASON than in the MAMJ season.
The highest correlation is obtained with a one-month time lag of NDVI to rainfall, except in semi-desert/steppe and tropical forest. In semi-desert/steppe, the highest correlation is obtained with concurrent months, while in the tropical forest, it is with a three-month time lag.
The brush-grass savannah is by far the best correlated in all the time lags of NDVI to rainfall, consistent with interannual and seasonal variability analysis.
This result shows, therefore, a very strong linear relationship between NDVI and rainfall in the brush-grass savannah, in particular with a one-month time lag.

Acknowledgments

We would like to acknowledge Goddard Space Flight Center for providing NDVI and GPCP data, and many thanks to the anonymous reviewers.

Conflicts of Interest

The authors declare no conflict of interest.

References

  1. Zhang, L.; Dawes, W.R.; Walker, G.R. Predicting the Effect of Vegetation Changes on Catchment Average Water Balance; Technical Report 99/12; CRC for Catchment Hydrology: Clayton, VIC, Australia, 1999. [Google Scholar]
  2. Sellers, P.J.; Tucker, C.J.; Collatz, G.J.; Los, S.; Justice, C.O.; Dazlich, D.A.; Randall, D.A. A global 1 × 1 degree NDVI data set for climate studies. Part 2—The adjustment of the NDVI and generation of global fields of terrestrial biophysical parameters. Int. J. Remote Sens. 1994, 15, 3519–3545. [Google Scholar]
  3. Raich, J.W.; Schlesinger, W.H. The global carbon dioxide flux in soil respiration and its relationship to vegetation and climate. Tellus 1992, 44B, 81–99. [Google Scholar] [CrossRef]
  4. Potter, C.S.; Randerson, J.T.; Field, C.B.; Matson, P.A.; Vitousek, P.M.; Mooney, H.A.; Klooster, S.A. Terrestrial ecosystem production: A process model based on global satellite and surface data. Glob. Biogeochem. Cy. 1993, 7, 811–841. [Google Scholar] [CrossRef]
  5. Tans, P.P.; Fung, I.Y.; Takahashi, T. Observational constraints on the global atmosphere CO2 budget. Science 1990, 247, 1431–1438. [Google Scholar] [CrossRef] [PubMed]
  6. Prince, S.D.; Justice, C.O.; Moore, B. Remote Sensing of NPP; IGBP DIS Working Paper #10; IGBP-DIS: Paris, France, 1994. [Google Scholar]
  7. Prince, S.D. A model of regional primary production for use with coarse resolution satellite data. Int. J. Remote Sens. 1991, 12, 1313–1330. [Google Scholar] [CrossRef]
  8. Moulin, S.; Kergoat, L.; Viovy, N.; Dedieu, G. Global-scale assessment of vegetation phenology using NOAA/AVHRR satellite measurements. J. Clim. 1997, 10, 1154–1170. [Google Scholar] [CrossRef]
  9. Azzali, S.; Menenti, M. Mapping vegetation-soil-climate complexes in southern Africa using temporal Fourier analysis of NOAA-AVHRR NDVI data. Int. J. Remote Sens. 2000, 21, 973–996. [Google Scholar] [CrossRef]
  10. Diouf, A.; Lambin, E. Monitoring land-cover changes in semi-arid regions: Remote sensing data and field observations in the Ferlo, Senegal. J. Arid Environ. 2001, 48, 129–148. [Google Scholar] [CrossRef]
  11. Kawabata, A.; Ichii, K.; Yamaguchi, Y. Global monitoring of interannual changes in vegetation activities using NDVI and its relationships to temperature and precipitation. Int. J. Remote Sens. 2001, 22, 1377–1382. [Google Scholar] [CrossRef]
  12. Loveland, T.R.; Merchant, J.W.; Brown, J.F.; Ohlen, D.O.; Reed, B.C.; Olson, P.; Hutchinson, J. Seasonal land-cover regions of the United States. Ann. Assoc. Am. Geogr. 1995, 85, 339–355. [Google Scholar] [CrossRef]
  13. Wang, J.; Price, K.P.; Rich, P.M. Spatial patterns of NDVI in response to precipitation and temperature in the central Great Plains. Int. J. Remote Sens. 2000, 22, 1455–1467. [Google Scholar] [CrossRef]
  14. Liu, J.Y.; Zhuang, D.F.; Luo, D.; Xiao, X. Land-cover classification of China: Integrated analysis of AVHRR imagery and geophysical data. Int. J. Remote Sens. 2003, 24, 2485–2500. [Google Scholar] [CrossRef]
  15. Kaptue, T.A.T.; De Jong, R.S.M.; Roujean, J.L.; Favier, C.; Mering, C. Ecosystem mapping at the African continent scale using a hybrid clustering approach based on 1-km resolution multi-annual data from SPOT/VEGETATION. Remote Sens. Environ. 2011, 115, 452–464. [Google Scholar]
  16. Verhegghen, A.; Mayaux, P.; de Wasseige, C.; Defourny, P. Mapping Congo Basin forest types from 300 m and 1 km multi-sensor time series for carbon stocks and forest areas estimation. Biogeosci. Discuss 2012, 9, 7499–7553. [Google Scholar] [CrossRef]
  17. Bannari, A.; Morin, D.; Bonn, F. A review of vegetation indices. Remote Sens. Rev. 1995, 13, 95–120. [Google Scholar] [CrossRef]
  18. Lobo, A.; Marti, J.J.I.; Gimenez-Cassina, C.C. Regional scale hierarchical classification of temporal series of AVHRR vegetation index. Int. J. Remote Sens. 1997, 18, 3167–3193. [Google Scholar] [CrossRef]
  19. Carleton, A.M.; Travis, D.; Arnold, D.; Brinegar, R. Climatic-scale vegetation- cloud interactions during drought using satellite data. Int. J. Climatol. 1994, 14, 593–623. [Google Scholar] [CrossRef]
  20. Carleton, A.M.; O’Neal, M.O. Satellite-derived land surface climate “signal” for the Midwest USA. Int. J. Remote Sens. 1995, 16, 3195–3202. [Google Scholar] [CrossRef]
  21. Lambin, E.F. Change detection at multiple temporal scales: Seasonal and annual variations in landscape variables. Photogramm. Eng. Remote Sens. 1996, 62, 931–938. [Google Scholar]
  22. Lambin, E.F.; Ehrlich, D. The surface temperature-vegetation index space for land cover and land-cover change analysis. Int. J. Remote Sens. 1996, 17, 463–487. [Google Scholar] [CrossRef]
  23. Nicholson, S.E.; Davenport, M.L.; Malo, A.R. A comparison of the vegetation response to rainfall in the Sahel and East Africa, using normalized difference vegetation index from NOAA AVHRR. Clim. Chang. 1990, 17, 209–241. [Google Scholar] [CrossRef]
  24. Yang, W.; Yang, L.; Merchant, W. An assessment of AVHRR/NDVI-ecoclimatological relations in Nebraska, USA. Int. J. Remote Sens. 1997, 18, 2161–2180. [Google Scholar] [CrossRef]
  25. Olson, D.M.; Dinerstein, E.; Wikramanayake, E.D.; Burgess, N.D.; Powell, G.V.; Underwood, E.C.; D’amico, J.A.; Itoua, I.; Strand, H.E.; Morrison, J.C.; et al. Terrestrial ecoregions of the world: A new map of life on earth: A new global map of terrestrial ecoregions provides an innovative tool for conserving biodiversity. BioScience 2001, 51, 933–938. [Google Scholar] [CrossRef]
  26. Camberlin, P.N.M.; Philippon, N.; Richard, Y. Determinants of the interannual relationships between remote sensed photosynthetic activity and rainfall in tropical Africa. Remote Sens. Environ. 2006, 106, 199–216. [Google Scholar] [CrossRef]
  27. Kaptue, T.A.T.; Roujean, J.L.; Faroux, S. ECOCLIMAP-II: An ecosystem classification and land surface parameter database of Western Africa at 1 km resolution for the African Monsoon Multidisciplinary Analysis (AMMA) project. Remote Sens. Environ. 2010, 114, 961–976. [Google Scholar] [CrossRef]
  28. Bigot, S. Les Precipitations et La Convection Profonde en Afrique Centrale: Cycle Saisonnier. Variabilite Interannuelle et Impact sur la Vegetation. Ph.D. Thesis, Universite de Bourgogne, Dijon, France, 1997. [Google Scholar]
  29. Kaptue, A. Cartographie des Ecosytemes et Parametres Biophysiques Pour l’etude des Flux Hydriques sur le Continent Africain. Ph.D. Thesis, Universite de Toulouse III-Paul Sabatier, Toulouse, France, 2010. [Google Scholar]
  30. Chander, G.; Markham, B.L.; Helder, D.L. Summary of current radiometric calibration coefficients for Landsat MSS, TM, ETM+, and EO-1 ALI sensors. Remote Sens. Environ. 2009, 113, 893–903. [Google Scholar] [CrossRef]
  31. Tucker, C.; Newcomb, W.; Dregne, H. AVHRR data sets for determination of desert spatial extent. Int. J. Remote Sens. 1994, 15, 3547–3565. [Google Scholar] [CrossRef]
  32. Tucker, C.J.; Pinzon, J.E.; Brown, M.E.; Slayback, D.A.; Pak, E.W.; Mahoney, R.; Vermote, E.F.; El Saleous, N. An extended AVHRR 8-km NDVI dataset compatible with MODIS and SPOT vegetation NDVI data. Int. J. Remote Sens. 2005, 26, 4485–4498. [Google Scholar] [CrossRef]
  33. Adler, R.; Huffman, G.; Chang, A.; Ferraro, R.; Xie, P.; Janowiak, J.; Rudolf, B.; Schneider, U.; Curtis, S.; Bolvin, D.; et al. The version-2 Global Precipitation Climatology Project (GPCP) monthly precipitation analysis (1979–Present). J. Hydrometeorol. 2003, 4, 1147–1167. [Google Scholar] [CrossRef]
  34. Huffman, G.; Adler, R.F.; Bolvin, D.T.; Gu, G. Improving the global precipitation record: GPCP version 2.1. Geophys. Res. Lett. 2009, 36, L17808. [Google Scholar] [CrossRef]
  35. Mennis, J. Exploring relationships between ENSO and vegetation vigour in the South-East USA using AVHRR data. Int. J. Remote Sens. 2001, 22, 3077–3092. [Google Scholar] [CrossRef]
  36. Holben, B.N. Characteristics of maximum-value composite images from temporal AVHRR data. Int. J. Remote Sens. 1986, 7, 1417–1434. [Google Scholar] [CrossRef]
  37. Soufflet, V.; Tanre, D.; Begue, A.; Podaire, A.; Deschamps, P.Y. Atmospheric effects on NOAA AVHRR data over Sahelian regions. Int. J. Remote Sens. 1991, 12, 1189–1204. [Google Scholar] [CrossRef]
  38. Justice, C.; Eck, T.F.; Tanre, D.; Holben, D.N. The effect of water vapour on the NDVI derived for the Sahelian region from NOAA AVHRR data. Int. J. Remote Sens. 1991, 12, 1165–1188. [Google Scholar] [CrossRef]
  39. Pinter, P. Solar angle independence in the relationship between absorbed PAR and remotely sensed data for alfalfa. Remote Sens. Environ. 1993, 46, 19–25. [Google Scholar] [CrossRef]
  40. Hamilton, J.D. Time Series Analysis; Cambridge University Press: Cambridge, UK, 1994; Volume 2. [Google Scholar]
  41. Andres, L.; Salas, W.A.; Skole, D. Fourier analysis of multitemporal AVHRR data applied to a land cover classification. Int. J. Remote Sens. 1994, 15, 1115–1121. [Google Scholar] [CrossRef]
  42. Azzali, S.; Menenti, M. Mapping isogrowth zones on continental scale using temporal fourier analysis of AVHRR-NDVI data. Int. J. Appl. Earth Geoinf. 1999, 1, 9–20. [Google Scholar] [CrossRef]
  43. Immerzeel, W.W.; Quiroz, R.A.; de Jong, S.M. Understanding precipitation patterns and land use interaction in Tibet using harmonic analysis of SPOT VGT-S10 NDVI time series. Int. J. Remote Sens. 2005, 26, 2281–2296. [Google Scholar] [CrossRef]
  44. Moody, A.; Johnson, D.M. Land-surface phenologies from AVHRR using the discrete fourier transform. Remote Sens. Environ. 2001, 75, 305–323. [Google Scholar] [CrossRef]
  45. Zhang, X.; John, C.; Hodges.; Crystal, B.; Schaaf.; Mark, A.; Friedl.; Alan, H.; Strahler, A.H.; Gao, F. Global Vegetation Phenology from AVHRR and MODIS Data. In Proceedings of the Geoscience and Remote Sensing Symposium (IGARSS’01), Sydney, Australia, 9–13 July 2001; Volume 5, pp. 2262–2264.
  46. Martiny, N.; Camberlin, P.; Richard, Y.; Philippon, N. Compared regimes of NDVI and rainfall in semi-arid regions of Africa. Int. J. Remote Sens. 2006, 27, 5201–5223. [Google Scholar] [CrossRef]
  47. Malo, A.R.; Nicholson, S. A study of rainfall and vegetation dynamics in the African Sahel using normalized difference vegetation index. J. Arid Environ. 1990, 19, 1–24. [Google Scholar]

