Abstract
Consideration of the relationship between residential floor level and concentration of traffic-related airborne pollutants may predict individual residential exposure among inner city dwellers more accurately. Our objective was to characterize the vertical gradient of residential levels of polycyclic aromatic hydrocarbons (PAH; dichotomized into Σ8PAHsemivolatile (MW 178-206), and Σ8PAHnonvolatile (MW 228-278), black carbon (BC), PM2.5 (particulate matter) by floor level (FL), season and building type. We hypothesize that PAH, BC and PM2.5 concentrations may decrease with higher FL and the vertical gradients of these compounds would be affected by heating season and building type. PAH, BC and PM2.5 were measured over a two-week period outdoor and indoor of the residences of a cohort of 5–6 year old children (n = 339) living in New York City' Northern Manhattan and the Bronx. Airborne-pollutant levels were analyzed by three categorized FL groups (0–2nd, 3rd–5th, and 6th–32nd FL) and two building types (low-rise versus high-rise apartment building). Indoor Σ8PAHnonvolatile and BC levels declined with increasing FL. During the nonheating season, the median outdoor Σ8PAHnonvolatile, but not Σ8PAHsemivolatile, level at 6th–2nd FL was 1.5–2 times lower than levels measured at lower FL. Similarly, outdoor and indoor BC concentrations at 6th–32nd FL were significantly lower than those at lower FL only during the nonheating season (p < 0.05). In addition, living in a low-rise building was associated significantly with higher levels of Σ8PAHnonvolatile and BC. These results suggest that young inner city children may be exposed to varying levels of air pollutants depending on their FL, season, and building type.
1. Introduction
Proximity to major roadways has been associated with an increased risk of wheeze illness, asthma and atopy [1-5]. Previously, most measures of proximity to major roadways have focused on the spatial heterogeneity associated with the horizontal gradients of ambient pollutants such as black carbon (BC), particulate matter <2.5 μm (PM2.5), ultrafine particles (UFP), and carbon monoxide (CO) near highways. As examples, Zhu et al. found that BC and UFP concentrations decreased exponentially within 150 m downwind from a major highway in Los Angeles, California [6,7]. Reoponen et al. also observed a distinct concentration gradient of UFP, but not PM2.5, within 1,600 m of a highway in Cincinnati, Ohio [8]. In contrast, studies that characterize the vertical gradient of airborne-pollutants, particularly in residential urban settings, remain scarce.
Most traffic-related air pollution studies showing associations with health effects have mainly relied on estimated exposure levels based on residential proximity to major roadways or traffic [1,2,9,10]. Other studies have used fixed ambient monitoring data to estimate residential indoor, outdoor, or personal exposure levels using geographic information systems (GIS) based methods [11-13]. However, nearly all researches have considered proximity as a perpendicular distance from major roadways or fixed sites, but not a vertical distance (e.g., floor level). Consideration of residential floor level as another proximity to traffic-related air pollution in the models may improve the prediction of individual residential exposures among inner city dwellers.
New York City (NYC) has the highest population density among US cities, with over 27,000 people per square mile [14]. Residences include both low-rise (less than 6 floors) and high-rise apartment buildings. Sources of air pollution include traffic, commercial sources, and heating units such as boilers or furnaces in buildings [14]. City dwellers may be exposed to different levels of air pollution depending on the strength of local traffic emissions, meteorological parameters, street configuration, as well as floor level (FL) of their apartment [15].
The few studies conducted on vertical gradients of traffic-related airborne pollutants have been conducted in urban Asia. Wu et al. found a significant decrease in ambient PM concentrations as height near major roadways increased from 2 to 79 m [16]. Li et al. also reported a decrease in the concentrations of outdoor PM2.5 and polycyclic aromatic hydrocarbons (PAHs) as the height of residential building, next to a busy road, increased [17]. These findings were supported further by Tao et al. who showed that measured ambient PAH concentrations decreased with heights in winter due to vehicle emissions at ground level and the observed restrained atmospheric conditions [18]. However, most of these studies were limited by either involving only short-term ambient sampling (e.g., over a few days, in one season), or a specific building type (high-rise building near a major roadway). The effect of season on the vertical gradient of traffic-related pollutants still needs to be elucidated in residential outdoor and indoor environments.
We hypothesize that PAH, BC and PM2.5 concentrations may decrease with higher FL and the vertical gradients of these compounds would be affected by heating season and building type. Our first objective was to characterize the vertical gradient of residential indoor and outdoor levels of PAHs (gas + particulate phase; dichotomized into Σ8PAHsemivolatile [MW 178–206], and Σ8PAHnonvolatile [MW 228–278]), BC, and PM2.5 in a birth cohort study conducted by Columbia Center for Children' Environmental Health (CCCEH). Our second objective was to determine the effects of season and building type on vertical gradients of measured air pollutants. We anticipate that these results may be important for assessing more accurately residential exposure and health risks in urban environments like NYC.
2. Methods
Study design
Children were primarily of African-American and Dominican ethnicity and lived in Northern Manhattan and the Bronx, geographical areas where exposure to traffic-related air pollution has been implicated in asthma and other diseases [19-21]. Three hundred thirty nine children were enrolled from the parent CCCEH cohort study and who were 5-6 years old during the periods between October 2005 and July 2010, as described previously [22]. The study was approved by the Columbia University Institutional Review Board and informed consent obtained.
Residential monitoring
Briefly, for BC and PM2.5 measurements, two-week integrated indoor monitoring was conducted at each of the first 262 homes between October 2005 and July 2010 for two time points each six months apart as described in detail [22,23]. Indoor air monitors were placed in a room where the child spent most of his or her time (mostly child' bedroom). For an additional n = 77, only one two-week measure was obtained. At one third of randomly selected homes, simultaneous outdoor sampling was conducted. While BC and PM2.5 were collected at both time points, a panel of 16 PAH was measured at one time point only.
BC and PM2.5 were collected on Teflon filter samples with a flow rate of 1.5 L/min for two weeks, leading to an average sampling volume of 30.1 m3. BC was estimated primarily by using a multi-wavelength integrating sphere method to achieve maximum specificity over a large range of ambient pollutants levels [24]. Filters were pre- and post-weighed on a microbalance after being equilibrated under a temperature and humidity controlled environment for at least 24 hours for measurement of PM2.5 [22,23].
Particulate phases and gas phases PAH were collected on a quartz microfiber filter and polyurethane foam (PUF) cartridge back-up, respectively with the same sampling flow rate as BC and PM2.5 collection. The sixteen PAH monitored were: benz[a]anthracene (BaA), chrysene/iso-chrysene (Chry), benzo[b]fluoranthene (BbFA), benzo[k]fluoranthene (BkFA), benzo[a]pyrene (BaP), indeno[1,2,3-c,d]pyrene (IP), dibenz[a,h]anthracene (DahA), benzo[g,h,i]perylene (BghiP), pyrene (Pye), phenanthrene (Phe), 1-methylphenanthrene (1Meph), 2-methylphenanthrene (2Meph), 3-methylphenanthrene (3Meph), 9-methylphenanthrene (9Meph), 1,7-dimethylphenanthrene (1,7DMeph), and 3,6-dimethylphenanthrene (3,6DMeph). A single soxhlet extraction of both the filters and PUFs together was analyzed at Southwest Research Institute (San Antonio, TX) [20,25].
Questionnaires
Questionnaires that addressed residential environmental conditions including FL of home, total number of stories in building of residence and exposure to environmental tobacco smoke (ETS), which was defined by the report of any smoker in the home, were administered when the child was 5–6 years old. The FL of home and total number of stories in building were reassessed by field staff during set up of the residential air monitor.
Statistical analysis
Due to the non-normal distributions of BC, PM2.5 and individual PAH, nonparametric analyses were conducted. PAH levels were summed according to their relative volatility and gas/particle partitioning i.e., Σ8PAHsemivolatile (sum of 8 low molecular-weight-PAH ≤ 206) and Σ8PAHnonvolatile (sum of 8 high molecular-weight-PAH ≥ 228). Heating season was defined as any sampling initiated from October 1 through April 31 after calculating the number of heating degree days (HDD) per month as described previously [22].
Participants who moved to outside the catchment area were excluded from analysis (n = 21). Traffic-related airborne-pollutant levels were analyzed by FL, classified into three groups: 0–2nd, 3rd–5th, and 6th–32nd FL. Data between 6th and 32nd FL were grouped together due to the small number of samples collected at higher floor levels. In addition, building type was classified into two groups: low-rise (if total FL is less than 6 stories) versus high-rise apartment buildings (if total FL is equal to or higher than 6 stories). Differences in PAH, BC, and PM2.5 concentrations measured at different FL or building type were compared using the Kruskal-Wallis test. Analyses were conducted using SPSS software (SPSS; Chicago, IL, version 18).
3. Results
3.1. Floor Level (FL) Distribution by Study Participants
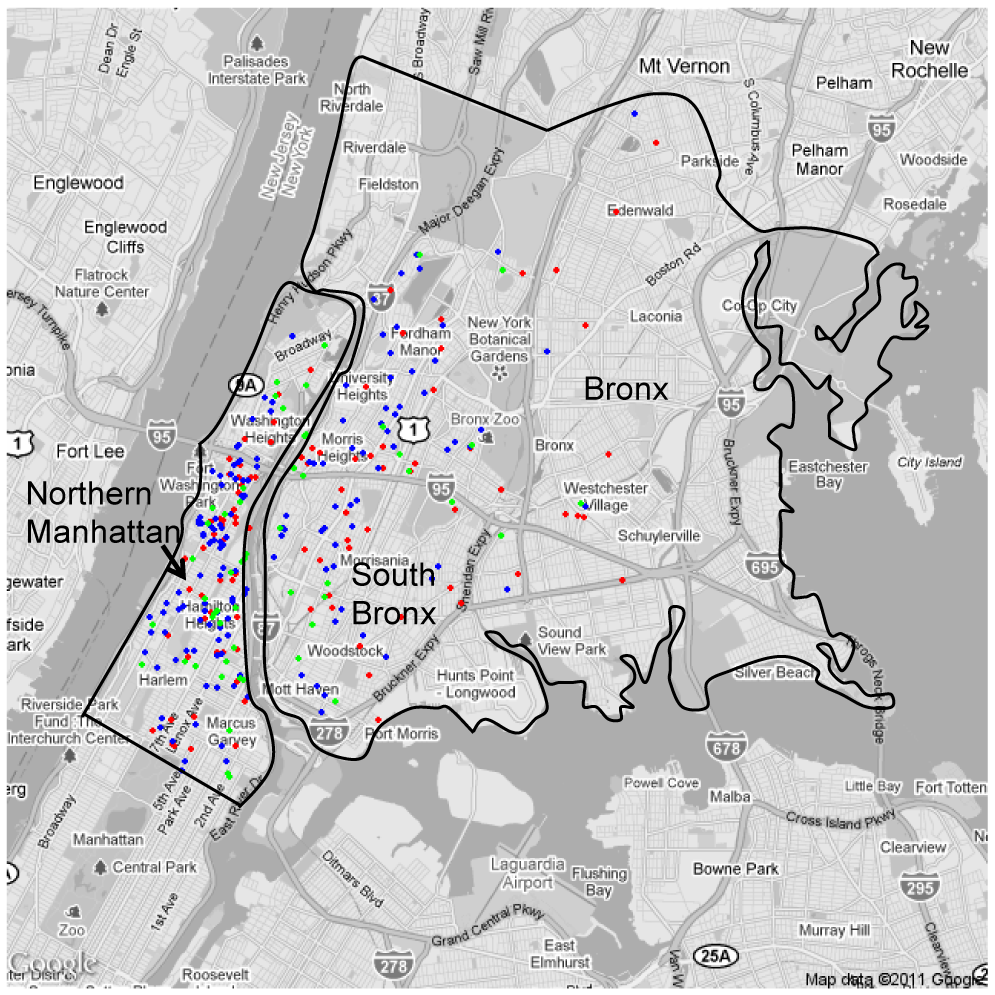
Forty-eight percent of participants lived between 3rd and 5th floors of buildings (indicated by blue) and nineteen percent of participants resided on the 6th–32nd FL (Figure 1). The majority of participants (73.8%) lived in low-rise buildings when compared to high-rise buildings.

Figure 1.
Floor level (FL) distribution by CCCEH participants.Northern Manhattan and the Bronx areas are illustrated by the solid black line. Circles represent residences of each participant and the color indicates different FL: Red (0–2nd FL), blue (3rd–5th FL), and green (6th–32nd FL). Map was generated by using R software.
3.2. Vertical Gradients of Airborne-Pollutants, Effects of Season
Outdoors, the highest median levels were observed at 3rd–5th FL for all measured air pollutants, although the trend was not statistically significant (Table 1). Indoor Σ8PAHsemivolatile was significantly lower at 0–2nd FL than at higher FL (Table 1, p = 0.038). In contrast, a nonsignificant but decreasing trend in indoor Σ8PAHnonvolatile concentrations was observed with increasing FL (Table 1, p > 0.05). When homes exposed to ETS were excluded from analysis, negative associations between indoor Σ8PAHnonvolatile concentrations and FL became significant (Table 2, p = 0.033). Similarly, indoor BC levels were associated negatively with FL, both with and without ETS exposure (Table 1, p < 0.05; Table 2, p < 0.05). The indoor PM2.5 concentration was not affected by FL.

Table 1.
Residential outdoor and indoor levels of air pollutants measured by FL.
Table 2.
Indoor levels of air pollutants by FL among homes without ETS exposure.
During the nonheating season, the median outdoor Σ8PAHnonvolatile level at 6th–32nd FL was 1.5–2 times lower than those measured at the lower FL although the trend was not statistically significant (Figure 2, p > 0.05). In comparison, the median level of outdoor Σ8PAHsemivolatile did not differ by FL regardless of season. Higher median levels of indoor Σ8PAHnonvolatile and Σ8PAHsemivolatile were observed at 3rd–5th FL compared to either lower or upper FL only during the nonheating season. Both outdoors and indoors during the nonheating season, BC concentrations at 6th–32nd FL were significantly lower than those at lower FL (Figure 2, p < 0.05, Kruskal-Wallis test). Heating season did not alter the measured vertical gradient pattern of PM2.5 concentrations outdoors or indoors (Figure 2).
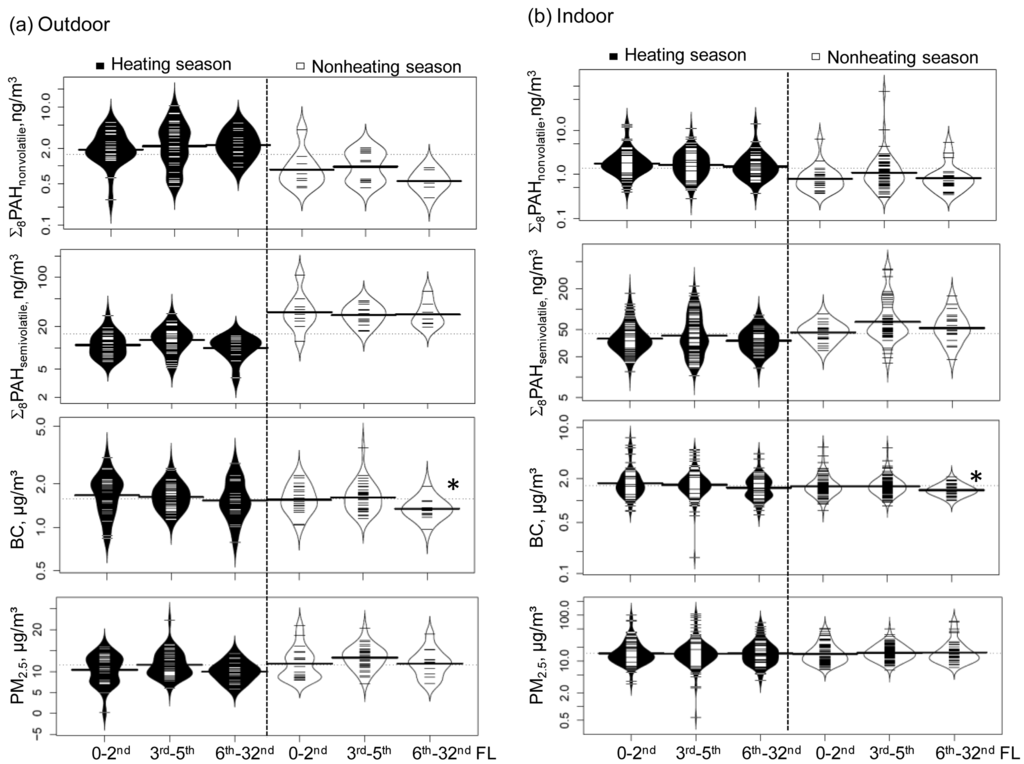
Figure 2.
Seasonal variations in vertical distributions of air pollutants measured in (a) outdoor, (b) indoor environment.Note: Kruskal-Wallis test was performed to compare the measured air pollutant levels by FL, stratified by heating season and nonheating season. Significance at * p < 0.05. The white and black lines show individual observations, while the black and white areas show the distributions of observations at each FL for heating season and nonheating season, respectively. The dotted line indicates the overall geometric mean and the thicker solid line shows the geometric mean concentration of each FL level for each season. Σ8PAHnonvolatile includes benz(a)anthracene (BaA), chrysene/iso-chrysene (Chry), benzo(b)fluoranthrene (BbFA), benzo(k)fluoranthrene (BkFA), benzo(a)pyrene (BaP), indeno(c,d)pyrene (IP), dibenz(a,h)anthracene (DahA), and benzo(ghi)perylene (BghiP). Σ8PAHsemivolatile includes pyrene (Pye), phenanthrene (Phe), 1-methylphenanthrene (1Meph), 2-methylphenanthrene (2Meph), 3-methylphenanthrene (3Meph), 9-methylphenanthrene (9Meph), 1,7-dimethylphenanthrene (1,7DMeph), and 3,6-dimethylphenanthrene (3,6DMeph).
3.3. Effects of Building Type
Both outdoors and indoors, Σ8PAHnonvolatile and BC concentrations measured at high-rise apartment buildings were significantly lower than those measured at low-rise building across all FL (Figure 3; p < 0.05 for Σ8PAHnonvolatile and p < 0.001 for BC; Kruskal-Wallis test). In general, the levels of indoor air pollutants measured at the same FL were lower in high-rise buildings compared to low-rise buildings especially when homes with ETS exposure were excluded. For example, the median concentrations of Σ8PAHnonvolatile measured in low-rise buildings were 10–30% higher than those in high-rise buildings at 0–2nd and 3rd–5th FL, respectively (Table 3). In comparison, there were no significant differences in Σ8PAHsemivolatile and PM2.5 concentrations by building type. However, the median indoor PM2.5 concentration measured at low-rise buildings was 40% higher compared to those measured at high-rise building when considering levels collected at the lowest floors (0–2nd FL) (Table 3).
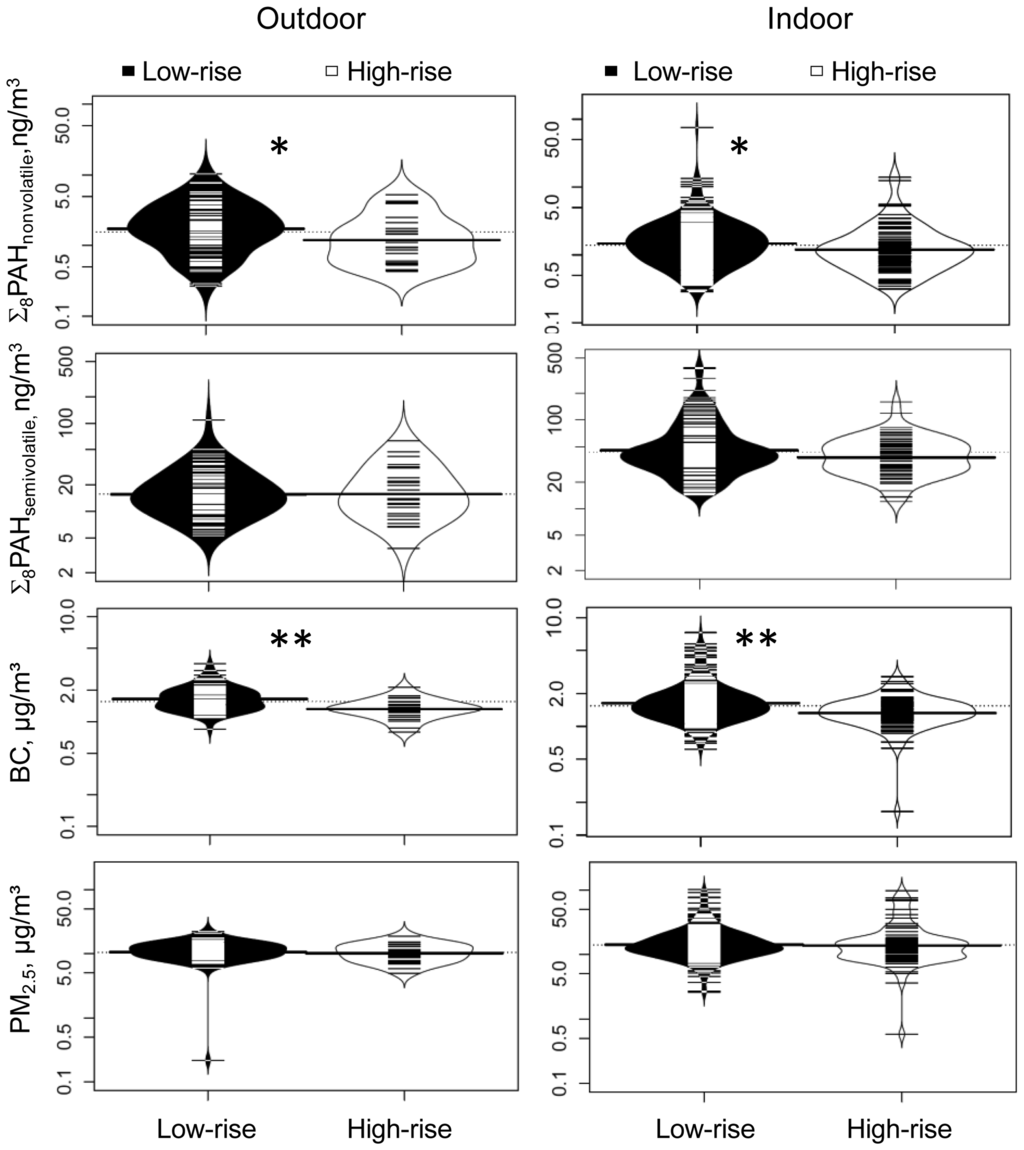
Figure 3.
Effect of building type on measured levels of outdoor and indoor air pollutants.Note: The white and black lines show individual observations, while the white and black areas show the distribution. The dotted line indicates the overall geometric mean and the thicker solid line shows the geometric mean concentration of low-rise and high-rise buildings for each outdoor and indoor environment. Significance at * p < 0.05 and ** p < 0.01, Kruskal-Wallis test. Σ8PAHnonvolatile includes benz(a)anthracene (BaA), chrysene/iso-chrysene (Chry), benzo(b)fluoranthrene (BbFA), benzo(k)fluoranthrene (BkFA), benzo(a)pyrene (BaP), indeno(c,d)pyrene (IP), dibenz(a,h)anthracene (DahA), and benzo(ghi)perylene (BghiP). Σ8PAHsemivolatile includes pyrene (Pye), phenanthrene (Phe), 1-methylphenanthrene (1Meph), 2-methylphenanthrene (2Meph), 3-methylphenanthrene (3Meph), 9-methylphenanthrene (9Meph), 1,7-dimethylphenanthrene (1,7DMeph), and 3,6-dimethylphenanthrene (3,6DMeph).
Table 3.
Indoor air pollutant levels by building type.
4. Discussion
PAHs are ubiquitous in indoor and outdoor air. While the major sources of nonvolatile PAHs and BC are traffic emissions and residential heating in NYC and other US cities, semivolatile PAHs have prominent indoor sources such as space heating (e.g., kerosene heaters), cooking, or burning incense or candles [22,26]. Our objective was to characterize vertical gradients of these traffic-related air pollutant exposures in outdoor and indoor environments and determine the effects of season and building type. We found that residential levels of indoor Σ8PAHnonvolatile and BC concentrations, but not PM2.5, were substantially lower at higher FLs compared to 0–2nd FL. Further, children living in low-rise buildings are exposed to higher levels of Σ8PAHnonvolatile and BC than those at high-rise buildings.
Vertical gradients of ambient air pollution may vary depending on differences in emission sources and vertical mixing conditions, meteorological conditions and street configuration [15]. Farrar et al. [27] proposed three major scenarios in which vertical gradient patterns of pollutants may differ: (1) minimal ground-level sources with dominant advection; (2) strong ground-level sources under a stable atmosphere; and (3) higher emissions from upper boundary (e.g., chimney). Several studies have reported a clear decreasing trend of PAHs and PM2.5 with heights in urban areas (scenario 2) due to dominant motor vehicle emissions at ground level and weak vertical mixing conditions [17,18,28]. Although these studies demonstrated well the typical vertical gradient pattern of aerosols in urban atmosphere, vertical distribution pattern of air pollutants under complex conditions such as in the presence of multiple emission sources has not been understood clearly.
The vertical gradient of outdoor Σ8PAHnonvolatile and BC may be attributed to either ground-level traffic sources under a stable atmosphere or emissions on building roofs due to residential heating. When the primary sources dominate at ground level, the higher concentration is expected to be observed at lower FL; whereas when the upper boundary emissions dominate, the higher concentration would occur with higher FL. We observed the highest concentration at 3rd–5th FL in outdoor environment for all measured air pollutants, although variation by pollutant and season was observed. Our data suggest that both upward transportation of ground-level emissions (e.g., tailpipe exhaust of motor vehicles, cooking emissions from commercial restaurants) and downward dispersion from chimneys (mostly located at 5th–6th FL) may reach their peak level at 3rd–5th FL.
A pattern of decreasing Σ8PAHnonvolatile and BC levels with increased FL became significant only in ETS-free indoor environments, indicating that the presence of ETS in the homes could mask the indoor vertical gradients of Σ8PAHnonvolatile and BC. This finding also suggests that indoor sources such as smoking may be important confounders when determining indoor vertical gradients of Σ8PAHnonvolatile and BC. This finding is consistent with other studies showing that nonvolatile PAHs, in particular chrysene, are the primary contributors to ETS exposure [29,30].
Our failure to observe vertical differences in outdoor PM2.5 suggests that ground-level sources of PM2.5 may be overwhelmed by regional sources influences. As reported in Qin et al. [31], ambient PM2.5 concentrations measured in NYC and northeastern U.S. cities were observed to be relatively uniform due to large contributions from long-range transported aerosols and regional sources like coal-fired power plants. Also, indoor PM2.5 levels have been associated with indoor activities such as cooking, smoking, burning incense/candle and residential heating [32-34]. Therefore, the contribution of regional sources and indoor activities may outweigh emissions from ground-level sources, possibly resulting in an even distribution of PM2.5 with FL in this study.
Our analyses by season showed that during the heating season, outdoor Σ8PAHnonvolatile and BC levels did not vary across FL. During the nonheating season, their levels were lowest at 6th–32nd FL. This observation suggests that ground level sources drive gradients during the nonheating season, whereas during the heating season, Σ8PAHnonvolatile and BC emitted from boiler chimneys on rooftops masks the vertical gradient pattern of ground-level generated pollutants. Wu et al. [35] found the highest particulate PAH concentrations at a height of 40 m, where chimneys are located, compared to 20 m or 60 m near a crossroad, implying that emissions from coal combustion boiler chimneys in surrounding neighborhoods contribute to PAHs in the atmosphere. During the nonheating season, outdoor Σ8PAHnonvolatile concentrations may decrease further with increasing FL because ambient ozone levels increase with height and facilitate the degradation of PAH, as described previously in the same cohort [22] and others [36-38].
Building type also was identified as an important parameter influencing air pollution exposures across FL. Higher levels of outdoor and indoor Σ8PAHnonvolatile and BC were detected in low-rise buildings compared to high-rise buildings. This difference can be explained partially by geography. Most low-rise buildings are located adjacent to roadways and nearby commercial businesses (e.g., mixed-buildings with restaurants, store fronts, etc.) [39]. Therefore, people living in low-rise buildings may be exposed to higher levels of air pollution emitted not only from traffic emissions, but also business-related emissions. In contrast, the majority of high-rise buildings included in this study are set farther back from the roadways, isolated from commercial spaces, possibly surrounded by some open green space, or even further separated from nearby neighborhoods in project housing complexes. These conditions may facilitate vertical mixing, dilution and dispersion of air pollution. Trees and other forms of vegetation may act as efficient sinks for particles, metals, and other gaseous compounds, inhibiting the spread of air pollution [40–42].
We acknowledge that, because this birth cohort study was not designed specifically to investigate vertical gradient patterns of air pollutants, we were unable to control for the effects of location, time, and meteorological conditions on air pollutant measures. Most residential samples are not concurrent and are from various locations throughout upper Manhattan and the Bronx. These factors could affect the measured outdoor vertical gradients. However, this study does provide a large dataset of direct residential outdoor and indoor measures, and these results advance our understanding of the effects of vertical gradient on residential exposure levels for urban children.
5. Conclusions
Inner city children living in apartment buildings may be exposed to different levels of air pollutants, depending on FL, season and building type. Consideration of vertical heterogeneity associated with exposure to air pollution may lead to a more accurate assessment of exposure in cohort research. These results may have substantial implications for diseases known to be influenced or triggered by exposure to air pollution, such as asthma.


Acknowledgments
This work was supported by NIH (R01ES013163, P50ES015905, P01ES09600, R01ES08977, P30 ES09089), EPA (R827027), the Educational Foundation of America, the John & Wendy Neu Family Foundation, the New York Community Trust, and the Trustees of the Blanchette Hooker Rockefeller Fund.
References
- Venn, A.J.; Lewis, S.A.; Cooper, M.; Hubbard, R.; Britton, J. Living near a main road and the risk of wheezing illness in children. Am. J. Respir. Crit. Care Med. 2001, 164, 2177–2180. [Google Scholar]
- Miyake, Y.; Tanaka, K.; Fujiwara, H.; Mitani, Y.; Ikemi, H.; Sasaki, S.; Ohya, Y.; Hirota, Y. Residential proximity to main roads during pregnancy and the risk of allergic disorders in Japanese infants: The Osaka Maternal and Child Health Study. Pediatr. Allergy Immunol. 2010, 21, 22–28. [Google Scholar]
- Wjst, M.; Reitmeir, P.; Dold, S.; Wulff, A.; Nicolai, T.; von Loeffelholz-Colberg, E.; Von Mutius, E. Road traffic and adverse effects on respiratory health in children. Br. Med. J. 1993, 307, 596–600. [Google Scholar]
- Brunekreef, B.; Janssen, N.A.H.; de Hartog, J.; Harssema, H.; Knape, M.; van Vliet, P. Air pollution from truck traffic and lung function in children living near motorways. Epidemiology 1997, 8, 298–303. [Google Scholar]
- Krämer, U.; Koch, T.; Ranft, U.; Ring, J.; Behrendt, H. Traffic-related air pollution is associated with atopy in children living in urban areas. Epidemiology 2000, 11, 64–70. [Google Scholar]
- Zhu, Y.; Hinds, W.; Kim, S.; Shen, S.; Sioutas, C. Study of ultrafine particles near a major highway with heavy-duty diesel traffic. Atmos. Environ. 2002, 36, 4323–4335. [Google Scholar]
- Zhu, Y.; Hinds, W.; Kim, S.; Sioutas, C. Concentration and size distribution of ultrafine particles near a major highway. J. Air Waste Manage. Assoc. 2002, 52, 1032–1042. [Google Scholar]
- Reponen, T.; Grinshpun, S.; Trakumas, S.; Martuzevicius, D.; Wang, Z.; LeMasters, G.; Lockey, J.; Biswas, P. Concentration gradient patterns of aerosol particles near interstate highways in the Greater Cincinnati airshed. J. Environ. Monit. 2003, 5, 557–562. [Google Scholar]
- Baumann, L.M.; Robinson, C.L.; Combe, J.M.; Gomez, A.; Romero, K.; Gilman, R.H.; Cabrera, L.; Hansel, N.N.; Wise, R.A.; Breysse, P.N. Effects of distance from a heavily transited avenue on asthma and atopy in a periurban shantytown in Lima, Peru. J. Allergy Clin. Immunol. 2011, 127, 875–882. [Google Scholar]
- Wilhelm, M.; Ritz, B. Residential proximity to traffic and adverse birth outcomes in Los Angeles county, California, 1994–1996. Environ. Health Perspect. 2003, 111, 207–216. [Google Scholar]
- Kim, J.J.; Smorodinsky, S.; Lipsett, M.; Singer, B.C.; Hodgson, A.T.; Ostro, B. Traffic-related air pollution near busy roads: The east bay children's respiratory health study. Am. J. Respir. Crit. Care Med. 2004, 170, 520–526. [Google Scholar]
- Brauer, M.; Hoek, G.; Van Vliet, P.; Meliefste, K.; Fischer, P.H.; Wijga, A.; Koopman, L.P.; Neijens, H.; Gerritsen, J.; Kerkhof, M. Air pollution from traffic and the development of respiratory infections and asthmatic and allergic symptoms in children. Am. J. Respir. Crit. Care Med. 2002, 166, 1092–1098. [Google Scholar]
- Gauderman, W.J.; Avol, E.; Lurmann, F.; Kuenzli, N.; Gilliland, F.; Peters, J.; McConnell, R. Childhood asthma and exposure to traffic and nitrogen dioxide. Epidemiology 2005, 16, 737–743. [Google Scholar]
- New York City Community Air Survey. Available online: http://www.nyc.gov/html/doh/html/eode/nyccas.shtml (accessed on 20 March 2011).
- Vardoulakis, S.; Fisher, B.E.A.; Pericleous, K.; Gonzalez-Flesca, N. Modelling air quality in street canyons: A review. Atmos. Environ. 2003, 37, 155–182. [Google Scholar]
- Wu, Y.; Hao, J.; Fu, L.; Wang, Z.; Tang, U. Vertical and horizontal profiles of airborne particulate matter near major roads in Macao, China. Atmos. Environ. 2002, 36, 4907–4918. [Google Scholar]
- Li, C.; Fu, J.; Sheng, G.; Bi, X.; Hao, Y.; Wang, X.; Mai, B. Vertical distribution of PAHs in the indoor and outdoor PM2.5 in Guangzhou, China. Build. Environ. 2005, 40, 329–341. [Google Scholar]
- Tao, S.; Wang, Y.; Wu, S.; Liu, S.; Dou, H.; Liu, Y.; Lang, C.; Hu, F.; Xing, B. Vertical distribution of polycyclic aromatic hydrocarbons in atmospheric boundary layer of Beijing in winter. Atmos. Environ. 2007, 41, 9594–9602. [Google Scholar]
- Perera, F.; Illman, S.; Kinney, P.; Whyatt, R.; Kelvin, E.; Shepard, P.; Evans, D.; Fullilove, M.; Ford, J.; Miller, R. The challenge of preventing environmentally related disease in young children: community-based research in New York City. Environ. Health Perspect. 2002, 110, 197–204. [Google Scholar]
- Miller, R.; Garfinkel, R.; Horton, M.; Camann, D.; Perera, F.; Whyatt, R.; Kinney, P. Polycyclic aromatic hydrocarbons, environmental tobacco smoke, and respiratory symptoms in an inner-city birth cohort. Chest 2004, 126, 1071–1078. [Google Scholar]
- Rosa, M.J.; Jung, K.H.; Perzanowski, M.S.; Kelvin, E.A.; Darling, K.W.; Camann, D.E.; Chillrud, S.N.; Whyatt, R.M.; Kinney, P.L.; Perera, F.P. Prenatal exposure to polycyclic aromatic hydrocarbons, environmental tobacco smoke and asthma. Respir. Med. 2010, 20, 1e8. [Google Scholar]
- Jung, K.H.; Patel, M.M.; Moors, K.; Kinney, P.L.; Chillrud, S.N.; Whyatt, R.; Hoepner, L.; Garfinkel, R.; Yan, B.; Ross, J. Effects of heating season on residential indoor and outdoor polycyclic aromatic hydrocarbons, black carbon, and particulate matter in an urban birth cohort. Atmos. Environ. 2010, 44, 4545–4552. [Google Scholar]
- Jung, K.H.; Yan, B.; Chillrud, S.N.; Perera, F.P.; Whyatt, R.; Camann, D.; Kinney, P.L.; Miller, R.L. Assessment of Benzo (a) pyrene-equivalent Carcinogenicity and Mutagenicity of Residential Indoor versus Outdoor Polycyclic Aromatic Hydrocarbons Exposing Young Children in New York City. Int. J. Environ. Res. Public Health 2010, 7, 1889–1900. [Google Scholar]
- Yan, B.; Kennedy, D.; Miller, R.L.; Cowin, J.; Jung, K.H.; Perzanowski, M.; Balletta, M.; Perera, F.; Kinney, P.; Chillrud, S.N. Application of an optical and nondestructive method for PM filters to estimate urban environment exposure of black carbon. Atmos. Environ. 2011. [Google Scholar] [CrossRef]
- Tonne, C.; Whyatt, R.; Camann, D.; Perera, F.; Kinney, P. Predictors of personal polycyclic aromatic hydrocarbon exposures among pregnant minority women in New York City. Environ. Health Perspect. 2004, 112, 754–760. [Google Scholar]
- Naumova, Y.Y.; Eisenreich, S.J.; Turpin, B.J.; Weisel, C.P.; Morandi, M.T.; Colome, S.D.; Totten, L.A.; Thomas, H.; Winer, A.M.; Alimokhtari, S. Polycyclic aromatic hydrocarbons in the indoor and outdoor air of three cities in the US. Environ. Sci. Technol. 2002, 36, 2552–2559. [Google Scholar]
- Farrar, N.; Harner, T.; Shoeib, M.; Sweetman, A.; Jones, K. Field deployment of thin film passive air samplers for persistent organic pollutants: A study in the urban atmospheric boundary layer. Environ. Sci. Technol. 2005, 39, 42–48. [Google Scholar]
- Menichini, E.; Iacovella, N.; Monfredini, F.; Turrio-Baldassarri, L. Relationships between indoor and outdoor air pollution by carcinogenic PAHs and PCBs. Atmos. Environ. 2007, 41, 9518–9529. [Google Scholar]
- Aquilina, N.J.; Delgado-Saborit, J.M.; Meddings, C.; Baker, S.; Harrison, R.M.; Jacob, P., III; Wilson, M.; Yu, L.; Duan, M.; Benowitz, N.L. Environmental and biological monitoring of exposures to PAHs and ETS in the general population. Environ. Int. 2010, 36, 763–771. [Google Scholar]
- Georgiadis, P. Personal exposures to PM2.5 and polycyclic aromatic hydrocarbons and their relationship to environmental tobacco smoke at two locations in Greece. J. Expos. Anal. Environ. Epidem. 2001, 11, 169–183. [Google Scholar]
- Qin, Y.; Kim, E.; Hopke, P. The concentrations and sources of PM2.5 in metropolitan New York City. Atmos. Environ. 2006, 40, 312–332. [Google Scholar]
- Götschi, T.; Oglesby, L.; Mathys, P.; Monn, C.; Manalis, N.; Koistinen, K.; Jantunen, M.; Hänninen, O.; Polanska, L.; Künzli, N. Comparison of black smoke and PM2.5 levels in indoor and outdoor environments of four European cities. Environ. Sci. Technol. 2002, 36, 1191–1197. [Google Scholar]
- Kousa, A.; Oglesby, L.; Koistinen, K.; Künzli, N.; Jantunen, M. Exposure chain of urban air PM2.5—associations between ambient fixed site, residential outdoor, indoor, workplace and personal exposures in four European cities in the EXPOLIS-study. Atmos. Environ. 2002, 36, 3031–3039. [Google Scholar]
- Wallace, L. Indoor particles: A review. J. Air Waste Manage. Assoc. 1996, 46, 98–126. [Google Scholar]
- Wu, S.; Tao, S.; Liu, W. Particle size distributions of polycyclic aromatic hydrocarbons in rural and urban atmosphere of Tianjin, China. Chemosphere 2006, 62, 357–367. [Google Scholar]
- Chen, C.L.; Tsuang, B.J.; Tu, C.Y.; Cheng, W.L.; Lin, M.D. Wintertime vertical profiles of air pollutants over a suburban area in central Taiwan. Atmos. Environ. 2002, 36, 2049–2059. [Google Scholar]
- Goriaux, M.; Jourdain, B.; Temime, B.; Besombes, J.; Marchand, N.; Albinet, A.; Leoz-Garziandia, E.; Wortham, H. Field comparison of particulate PAH measurements using a low-flow denuder device and conventional sampling systems. Environ. Sci. Technol. 2006, 40, 6398–6404. [Google Scholar]
- Schauer, C.; Niessner, R.; Poschl, U. Polycyclic aromatic hydrocarbons in urban air particulate matter: decadal and seasonal trends, chemical degradation, and sampling artifacts. Environ. Sci. Technol. 2003, 37, 2861–2868. [Google Scholar]
- New York City Zoning Reference. Available online: http://www.nyc.gov/html/dcp/html/zone/zh_resdistricts.shtml (accessed on 20 March 2011).
- McNabola, A. New Directions: Passive control of personal air pollution exposure from traffic emissions in urban street canyons. Atmos. Environ. 2010, 44, 2940–2941. [Google Scholar]
- Heath, B.; Maughan, J.; Morrison, A.; Eastwood, I.; Drew, I.; Lofkin, M. The influence of wooded shelterbelts on the deposition of copper, lead and zinc at Shakerley Mere, Cheshire, England. Sci. Total Environ. 1999, 235, 415–417. [Google Scholar]
- Ottelé, M.; van Bohemen, H.D.; Fraaij, A.L.A. Quantifying the deposition of particulate matter on climber vegetation on living walls. Ecol. Eng. 2010, 36, 154–162. [Google Scholar]
© 2011 by the authors; licensee MDPI, Basel, Switzerland. This article is an open access article distributed under the terms and conditions of the Creative Commons Attribution license (http://creativecommons.org/licenses/by/3.0/).