Article

Surface Ozone Trends and Health Impacts in the Yangtze River Delta Region During 2015–2019

1
School of Resources and Environmental Engineering, Jiangsu University of Technology, Changzhou 213001, China
2
Department of Environmental Science and Engineering, Fudan University, Shanghai 200438, China
*
Author to whom correspondence should be addressed.
Atmosphere 2025, 16(9), 995; https://doi.org/10.3390/atmos16090995
Submission received: 16 July 2025 / Revised: 16 August 2025 / Accepted: 21 August 2025 / Published: 22 August 2025
(This article belongs to the Section Air Quality)

Abstract

The steady escalation of surface-level ozone (O3) concentrations has become a major atmospheric pollution issue in China, with considerable implications for public health. This research systematically examines the spatial and temporal patterns of O3 levels within the Yangtze River Delta region, spanning 2015–2019. Additionally, it evaluates how both prolonged and brief periods of O3 exposure influence mortality risks—including all-cause deaths as well as fatalities linked to cardiovascular and respiratory conditions. The results indicate that: (1) From 2015 to 2019, surface O3 levels in the YRD showed a steady upward trend. The yearly average AVGDMA8 concentration climbed from 76.6 ± 17.5 μg/m3 to 89.7 ± 6.3 μg/m3, while the 4DMA8 values jumped from 171.4 ± 33.9 μg/m3 to 187.6 ± 17.6 μg/m3, with an average annual increase of 2.9 ± 3.5 μg/m3. (2) Between 2015 and 2019, long-term exposure to AVGDMA8 O3 concentrations was linked to an estimated 35,806 (95% CI: 18,130–69,540) all-cause deaths, 22,058 (95% CI: 7580–42,270) cardiovascular deaths, and 6656 (95% CI: 0–14,000) respiratory deaths across cities in the YRD. In addition, short-term exposure to 4DMA8 O3 led to 30,075 (95% CI: 16,550–43,600) all-cause premature deaths, 14,137 (95% CI: 5330–22,710) cardiovascular deaths, and 5448 (95% CI: 2840–8129) respiratory deaths. These results offer support for evaluating the impacts of O3 pollution policy and refining health intervention approaches in the YRD.

1. Introduction

As urbanization and industrial development continue to accelerate across China, air pollution has become one of the most pressing environmental issues [1]. To improve air quality, the Chinese administration has introduced a suite of comprehensive pollution-control strategies, such as the “Air Pollution Prevention and Control Action Plan" and the “Three-Year Action Plan for Winning the Blue Sky Defense Battle”. These initiatives have made remarkable progress in reducing the concentrations of PM2.5. However, O3 concentrations have continued to rise, emerging as a critical challenge in the current phase of air quality improvement.
Ground-level O3, a strong oxidizing agent, poses substantial risks to ecological integrity and human health [2,3,4] and has consequently become a growing global concern. O3 serves as an essential component of the troposphere, which is generated by a series of complex photochemical reactions between volatile organic compounds (VOCs) and nitrogen oxides (NOx = NO + NO2) in the presence of sunlight [5]. The primary sources of these O3 precursors include industrial emissions, motor vehicle exhaust, and the use of solvents.
O3 concentrations in China have remained persistently high in recent years. Since 2016, O3 pollution has become the dominant atmospheric contaminant in major urban centers, including Beijing and Shanghai [6]. By 2018, more than 120 cities nationwide reported O3 levels exceeding the national air quality standards, with an exceedance rate of 35.8% [7]. According to Hong et al. [8], the annual range of urban O3 concentrations in 2019 varied from 84 to 193 μg/m3, with a national average of 141 μg/m3. Furthermore, 22% of cities exceeded the annual standard limit, and days with concentrations above the standard accounted for approximately 6% of the year. In terms of air quality metrics, China’s major urban centers recorded an average daily maximum 8-h O3 concentration (DMA8) of 87.9 ± 13.5 μg/m3 in 2015. Hotspots like the Yangtze River Delta (YRD), Beijing-Tianjin-Hebei (BTH), and Pearl River Delta (PRD) frequently exceeded O3 levels of 120 μg/m3 [9]. Between 2013 and 2017, the 90th percentile for these daily O3 peaks across 74 cities jumped from 139 μg/m3 (ranging from 72 to 190 μg/m3) to 167 μg/m3 (ranging from 117 to 218 μg/m3) [10]. During the same period, the country’s average of the fourth-highest daily maximum 8-h average O3 concentration (4DMA8) at monitoring stations stood at 172 ± 28.8 μg/m3. In key regions such as BTH, YRD, and PRD, 4DMA8 concentrations frequently exceeded 200 μg/m3 [11]. In 2018, 34.6% of the 338 monitored cities recorded DMA8 concentrations above the 90th percentile, ranging from 160 to 217 μg/m3 [12].
Both prolonged and brief exposure to O3 can have detrimental effects on human health. Because O3 is poorly soluble in water, it can evade the protective barriers of the upper respiratory tract and reach the deeper regions of lung tissue, where it induces oxidative stress and cellular damage [13,14]. Extensive evidence has demonstrated a strong association between prolonged exposure to high O3 levels and higher mortality rates due to respiratory and heart conditions. Vulnerable groups such as seniors, young children, and those with existing health conditions tend to be hit the hardest [15]. In addition, short-term exposure to O3 may trigger acute respiratory events, including exacerbations of asthma and respiratory infections [13,16,17]. In 2015, tropospheric O3 was estimated to contribute to approximately 9–23 million annual emergency room visits for asthma worldwide, accounting for 8–20% of all asthma-related hospital visits globally [13,18,19]. While research emphasizes the health consequences of chronic exposure, the risks associated with short-term episodes of elevated O3—particularly during summer months—should not be overlooked [20,21,22]. Studies have shown that a large segment of the populace regularly breathes air containing O3 levels surpassing the 4DMA8 threshold [23], while premature deaths associated with brief-term 4DMA8 O3 exposure constitute a substantial component of overall mortality in China [24].
The YRD, a central economic hub and among the most densely inhabited areas in China, faces particularly severe challenges associated with O3 pollution. Studies indicate that peak O3 concentrations in this region typically occur between May and July, with the DMA8 O3 levels climbing steadily by about 2.3 ppb annually from 2013 to 2017 [25,26]. Based on monitoring data released by the Ministry of Ecology and Environment of China, the number of days with excessive O3 levels in the YRD has increased in recent years, with the annual average significantly higher than that of developed countries such as those in Europe and the United States [27]. Due to the stark north-south differences in near-surface O3 levels across China, the YRD, situated at the crossroads between northern and southern areas, serves as a crucial corridor for examining regional O3 pollution patterns. Therefore, a thorough investigation into the processes driving pollution changes and their health implications in this zone is vital for developing targeted and effective O3 mitigation strategies.
In this context, the investigation employed O3 levels from 2015 to 2019 to methodically examine the spatial and temporal changes in ozone pollution over the YRD region. Two exposure metrics—AVGDMA8 and 4DMA8—were employed. Based on these indicators and established exposure–response functions, we quantified the mortality risk with both prolonged and acute O3 exposure. This included deaths from all causes, as well as those attributed explicitly to cardiovascular and respiratory illnesses. This study aims to fill existing research gaps in health impact assessments related to O3 exposure in the YRD and to provide robust scientific evidence to support regional O3 pollution control strategies and mitigate associated public health risks.

2. Date and Research Methods

2.1. Ground-Level O3 Data

Since 2013, the National Air Quality Real-Time Release Platform (available at https://air.cnemc.cn:18007/, accessed on 15 July 2025) has provided hourly monitoring data for O3 and five other key pollutants. In this study, hourly O3 measurements were collected from urban areas across the YRD, including Jiangsu, Zhejiang, Anhui, and Shanghai. The dataset comprises observations from 267 monitoring stations (Figure 1) and spans the interval from 1 January 2015 to 31 December 2019. Due to the prevalence of abnormal and missing values in the publicly released data, quality assurance of the hourly O3 concentration dataset was essential [28]. First, we identified and removed records with continuous missing observations to ensure data completeness. Second, a statistical method was employed in which measurements exceeding ±3 standard deviations from the mean were flagged and excluded as outliers, improving dataset integrity. Finally, missing values were filled using linear interpolation based on the observed values immediately before and after the gap. In cases where a day contained an excessive number of missing data points to support practical analysis, the day was treated as invalid and substituted with that month’s average hourly O3 levels.
The Tropospheric Ozone Assessment Report (TOAR) defines 12 indicators for characterizing O3 levels and their impact on the climate, public health, and ecological conditions. These indicators can be accessed publicly via the TOAR ground-level O3 repository (https://join.fz-juelich.de/, accessed on 15 July 2025) [29]. Among them, DMA8 refers to the daily peak of the 8-h running average concentration, while AVGDMA8 signifies the yearly average of these daily maxima. Additionally, 4DMA8 denotes the fourth-highest DMA8 value recorded during the Northern Hemisphere warm season (April–September). In the present study, AVGDMA8 and 4DMA8 were calculated to represent long- and short-term O3 exposure levels, respectively, and were subsequently applied in the corresponding health risk assessments. City-level O3 metrics were obtained by calculating the mean of measurements collected from all operational monitoring stations within each urban area. This approach minimizes bias arising from uneven station distribution and improves the reliability of regional assessments.

2.2. Trend Analysis

Utilizing the Theil–Sen estimator on deseasonalized data, this research gauged the trend slope, thereby pinpointing non-parametric monotonic linear trend changes. To assess whether these trends were statistically significant, the Mann–Kendall test was applied, adopting a significance threshold of p < 0.05 [30].
All data processing and trend calculations were conducted in the RStudio 3.6.0 environment. The main R packages used included “openair” (for air quality time series analysis), “tidyverse”, “lubridate”, and “dplyr” (for data cleaning and format transformation) [31,32].

2.3. Premature Mortality Estimation Method

In this study, we employed a log-linear exposure–response model to investigate all-cause, cardiovascular, and respiratory fatalities resulting from both chronic and short-term O3 exposure in urban areas of the YRD region during the period from 2015 to 2019. The specific calculation formula is as follows:
Δ C = 0                                                                                               i f   [ O 3 ] T M E R L O 3 T M E R L                                     i f [ O 3 ] > T M E R L
β = ln R R / Δ C
Δ M o r t = 1 e x p β Δ C · y 0 · P o p
Here, T M E R L represents the Theoretical Minimum Risk Exposure Level of O3. This level functions as the benchmark threshold for evaluating risks associated with exposure. When assessing chronic exposure, O 3 represents the yearly average O3 concentration, while Δ C refers to the annual average O3 level exceeding T M E R L . For acute exposure, O 3 corresponds to the daily mean concentration, while Δ C denotes the accumulated daily O3 exposure exceeding T M E R L . The parameter β represents the exposure-response relationship, calculated from relative risk ( R R ), quantifying the relationship between incremental changes in O3 levels and the heightened health risks. The variable y 0 represents the baseline rate of death specific to each cause, sourced from the Global Health Data Exchange (GHDx) as part of the Global Burden of Disease (GBD) database (http://ghdx.healthdata.org/gbd-results-tool, accessed on 15 July 2025), which provides annual mortality data from 2015 to 2019. P o p refers to individuals 30 years and upwards in every urban area, while Δ M o r t represents the approximate count of deaths attributable to a specific cause within the city limits. Age-disaggregated population statistics were sourced from China’s National Bureau of Statistics (https://www.stats.gov.cn/sj/ndsj/, accessed on 15 July 2025).
For long-term exposure risk assessment, the O3 concentration metric adopted was the yearly average of daily 8-h maximums (AVGDMA8). The T M E R L for all-cause mortality was set at 53.4 μg/m3 [33], while the T M E R L for cardiovascular and respiratory mortality was set at 53.6 μg/m3 [34]. These benchmarks are based on the minimal levels of health risk identified in extensive epidemiological research over extended periods. As the exposure measure for brief periods, the 4th highest daily peak 8-h level served as the metric using a T M E R L of 70 μg/m3 per WHO HRAPIE guidelines [35].
For the estimation of long-term mortality, the all-cause mortality exposure-response coefficient ( β ) was adopted from Turner et al. [33], while the coefficients for cardiovascular and respiratory mortality were based on the methodology of Lim et al. [34]. In the case of short-term mortality, β values for all-cause and cardiovascular deaths were obtained from a large-scale Chinese epidemiological investigation led by Yin et al. [36]. As for respiratory mortality figures, they came from a thorough meta-study carried out by Dong et al. [37] (see Table 1). In this study, we computed the exposure–response coefficients ( β ) for chronic (AVGDMA8) and acute (4DMA8) O3 exposure. This was done by examining relative risks (RR) associated with every 20 μg/m3 and 10 μg/m3 increment in O3 levels, respectively. To ensure a fair comparison, akin to the approach taken by Lefohn and colleagues [30], we employed a conversion factor of 1 ppb equating to 2 μg/m3 under standard conditions—namely, 20 °C and 1013.25 hPa.

3. Results Analysis

3.1. Spatial and Temporal Distribution of AVGDMA8 O3 Concentrations

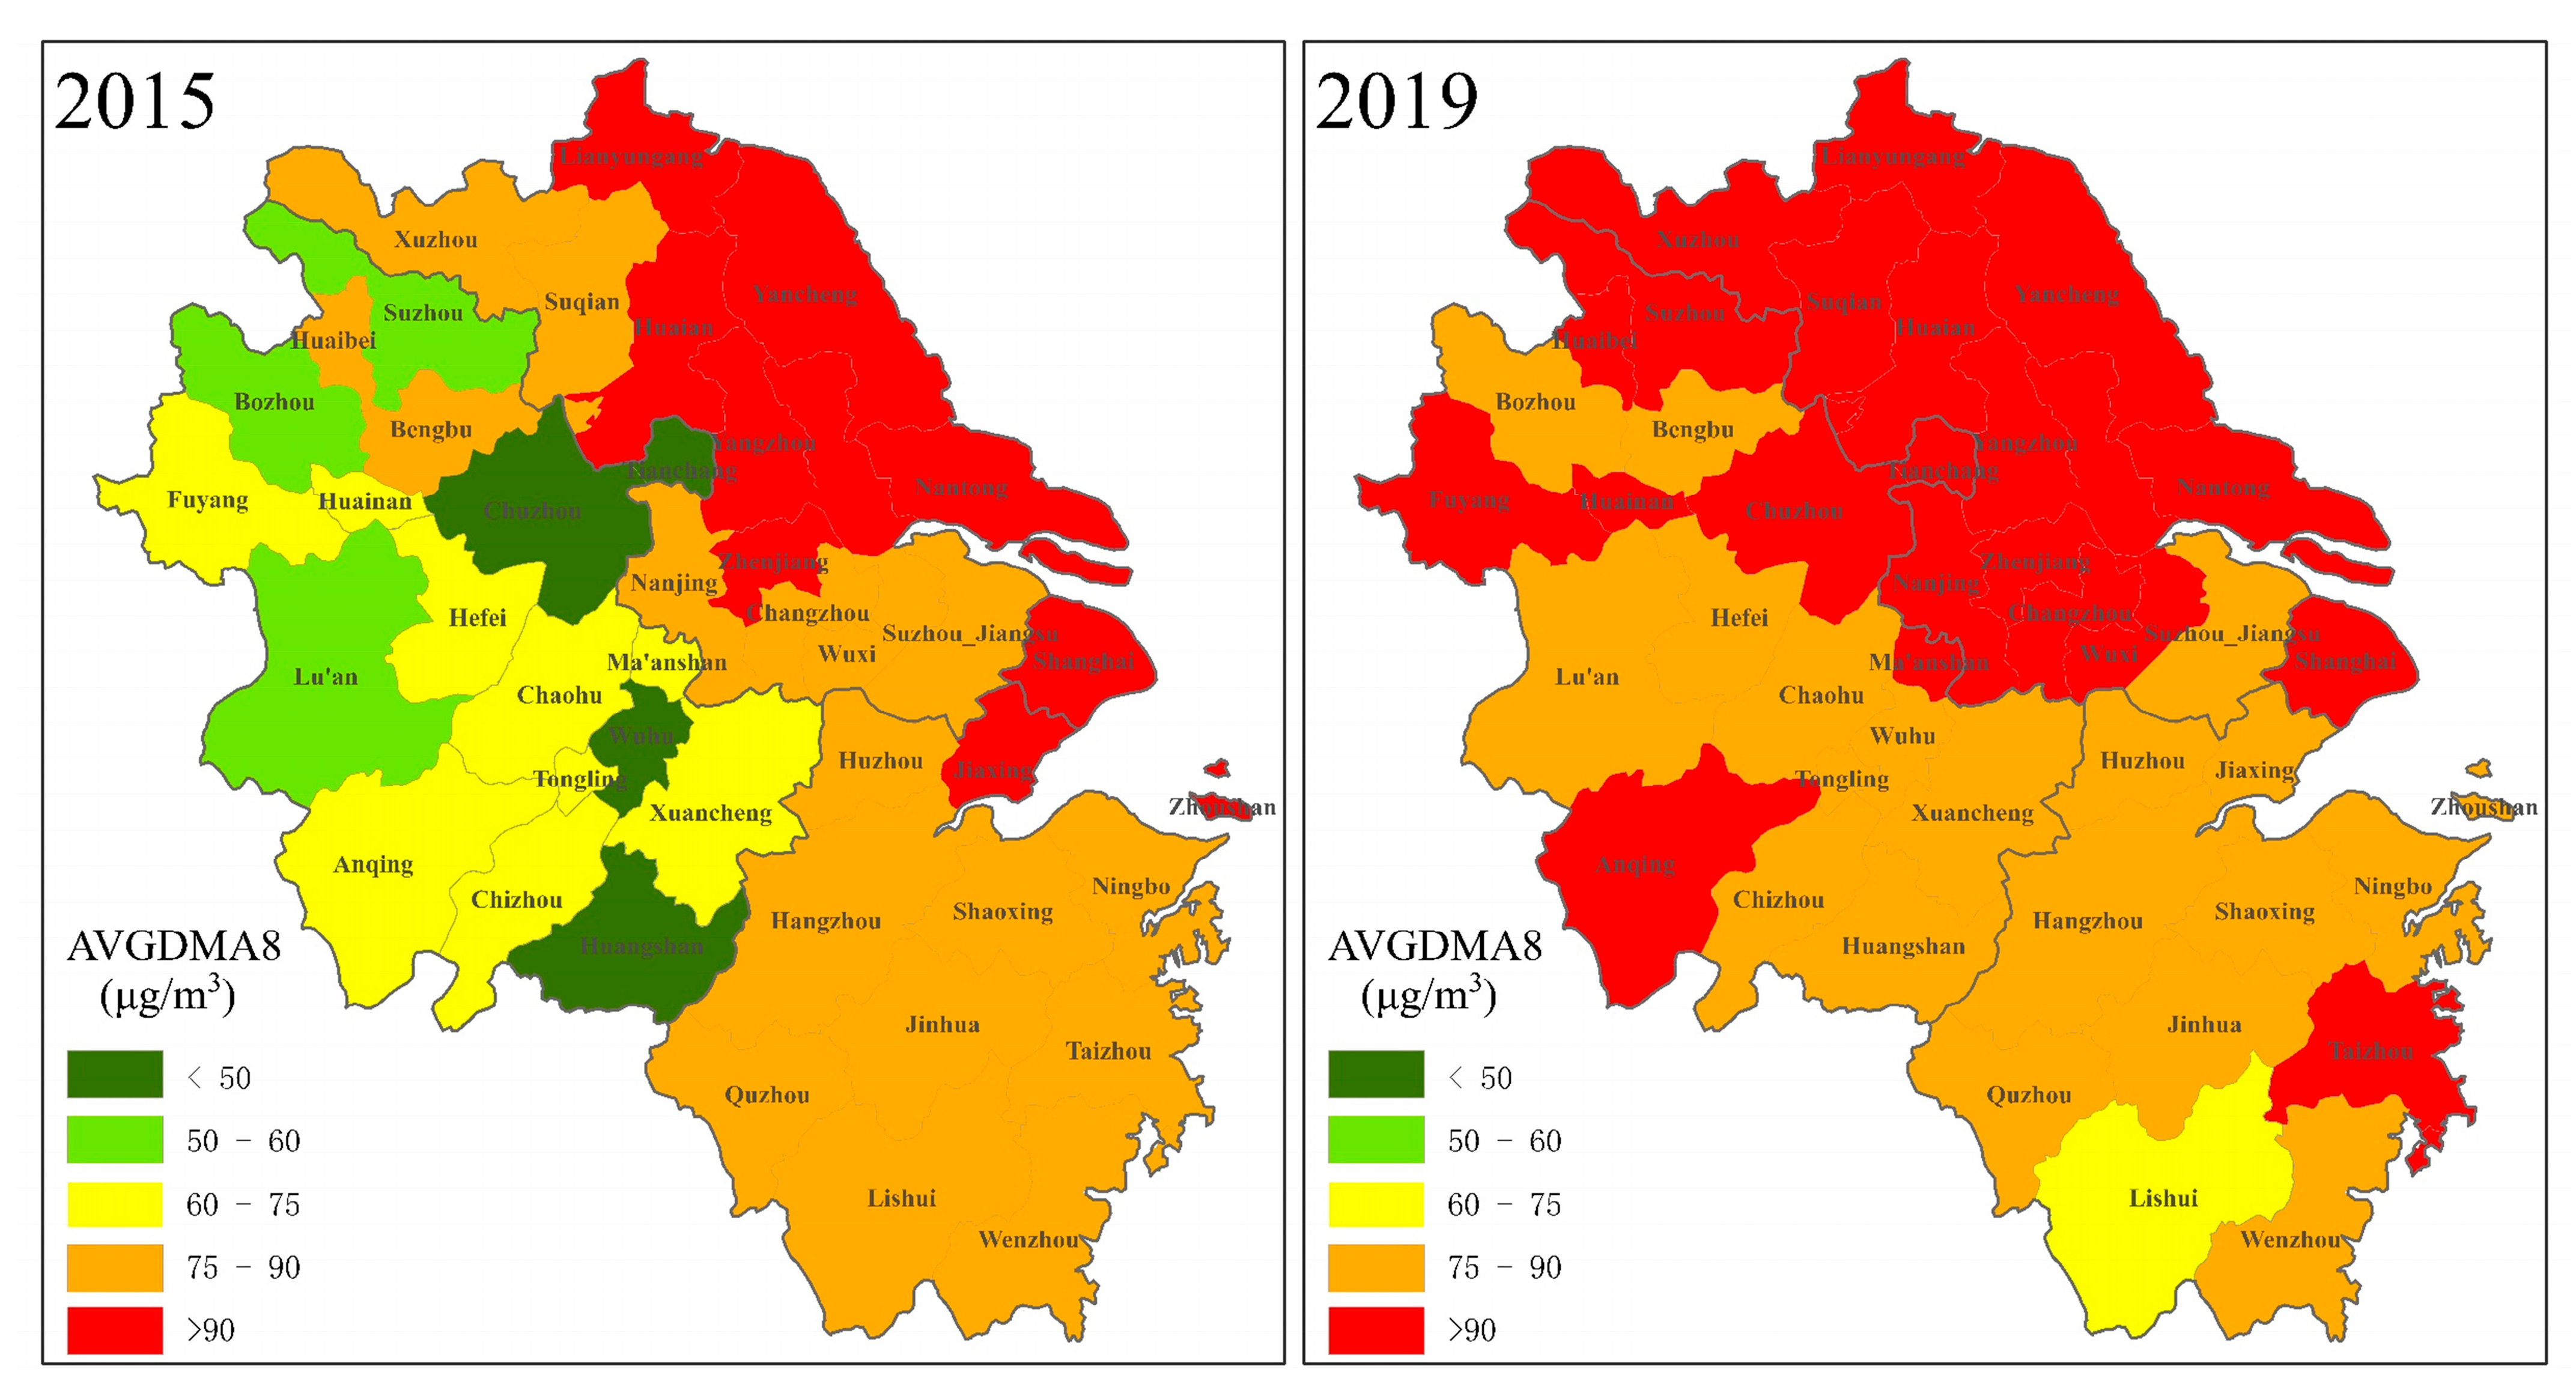
Figure 2 displays changes in the spatial–temporal patterns of AVGDMA8 O3 concentrations across the urban areas of the YRD for 2015 and 2019. Overall, the data reveal that in 2015, O3 concentrations ranged from 36.7 μg/m3 in Chuzhou (Anhui Province) to 103.3 μg/m3 in Yancheng (Jiangsu Province), with a regional mean of 76.6 ± 17.5 μg/m3 (mean ± standard deviation). By 2019, the range narrowed to 74.4 μg/m3 in Lishui (Zhejiang Province) to 99.6 μg/m3 in Yangzhou (Jiangsu Province), while the mean concentration increased to 89.7 ± 6.3 μg/m3. These results indicate a marked rise in the average O3 levels over the five years. Notably, cities with initially lower concentrations experienced more pronounced increases than those with higher baseline values, leading to a significant narrowing of the overall concentration range.
Regarding regional variation, the cities with the highest AVGDMA8 O3 levels in 2015 included Yancheng (103.3 μg/m3), Taizhou (103.3 μg/m3), Yangzhou (100.7 μg/m3), Yixing (97.9 μg/m3), Nantong (97.4 μg/m3) in Jiangsu Province, and Shanghai (96.4 μg/m3). By 2019, the cities with the highest concentrations were Yangzhou (99.6 μg/m3), Huaibei (98.7 μg/m3), Suqian (97.9 μg/m3), Suzhou (Anhui) (97.8 μg/m3), and Lianyungang (97.7 μg/m3), with most of these elevated values concentrated in Jiangsu Province (northern YRD). The relatively severe pollution in these areas may be attributed to dense industrial activity and high vehicular emissions in southern Jiangsu and northern Zhejiang. Throw in the fact that prevailing westerly winds often push polluted air into Shanghai [38]. Overall, O3 levels across the YRD urban cluster exhibited a steady rise, with the spatial distribution gradually shifting from a previous “east-high, west-low” gradient to a “north-high, south-low” pattern.
In terms of absolute increases, cities such as Chuzhou (Anhui), Tianchang (Jiangsu), Wuhu (Anhui), and Suzhou (Anhui) experienced the most significant rises in O3 concentrations, with increases of 57.7 μg/m3, 57.7 μg/m3, 45.3 μg/m3, and 40.7 μg/m3, respectively. Anhui Province, straddling the central and lower stretches of the Yangtze and Huai Rivers and located at the heart of the bustling YRD, has undergone rapid economic growth, along with accelerated industrialization and urbanization in recent years. Consequently, atmospheric photochemical pollution in the province has become increasingly severe. Given the current challenges posed by O3 pollution, it is particularly urgent to implement targeted mitigation strategies for Anhui Province.

3.2. Spatial and Temporal Distribution of 4DMA8 O3 Concentrations

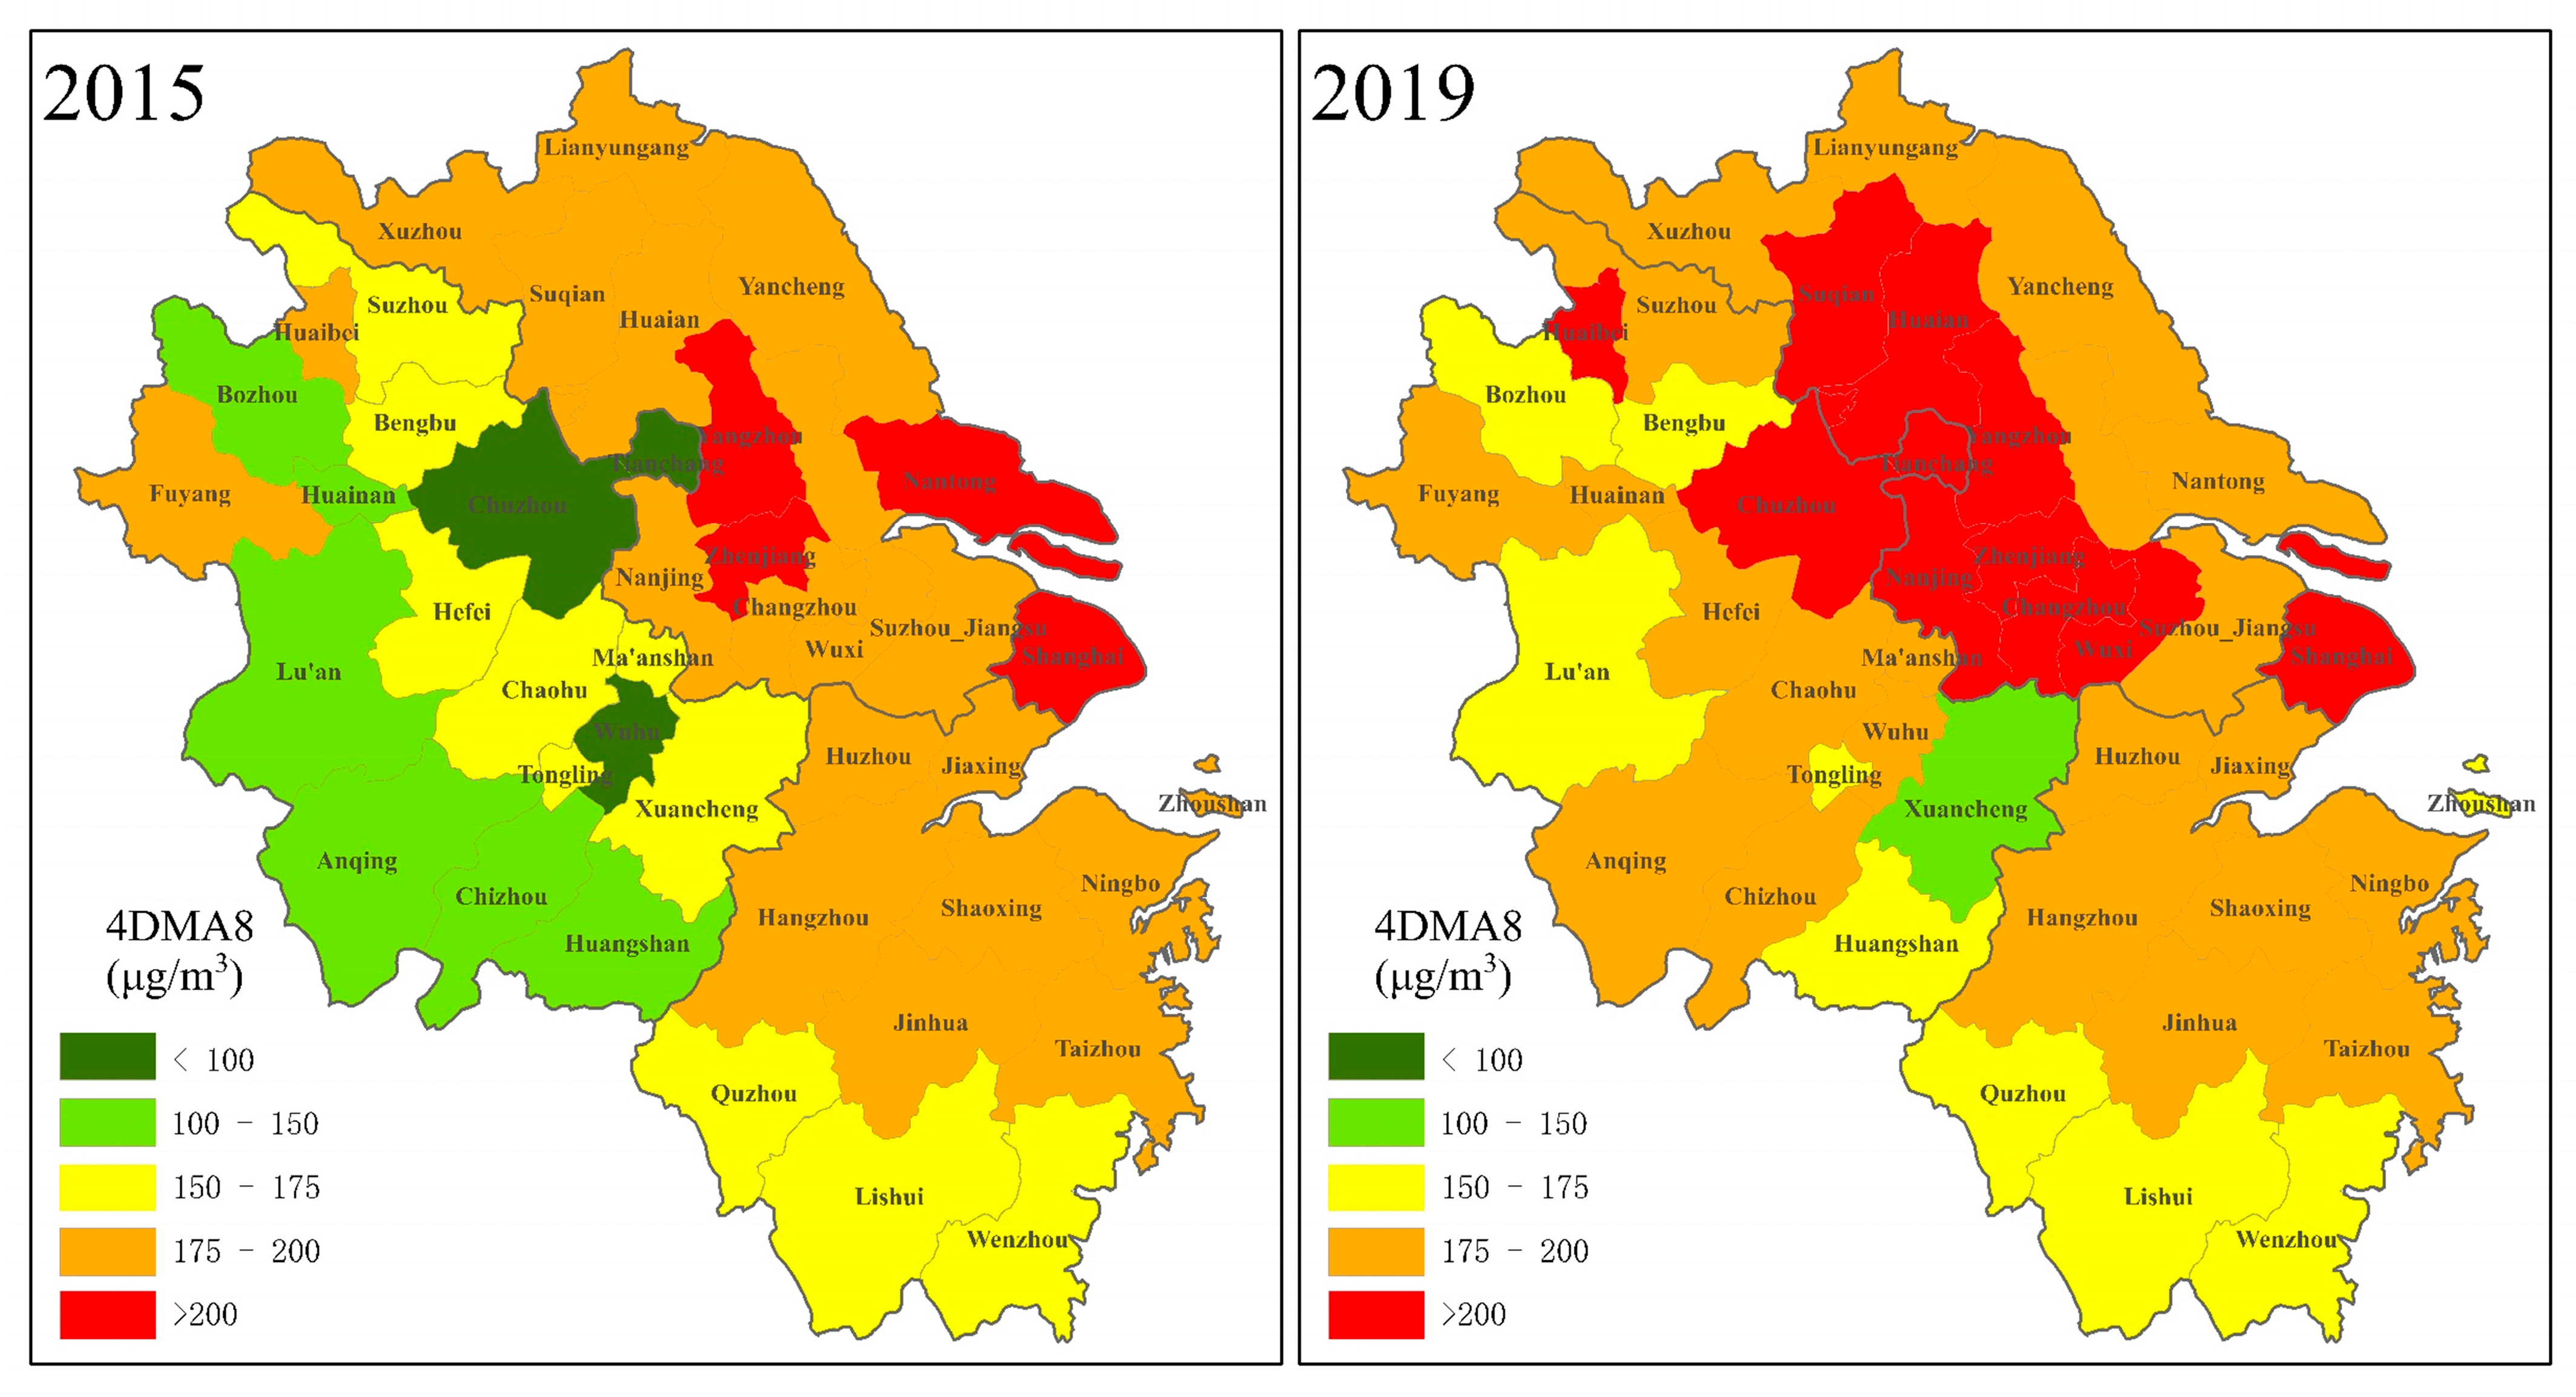
Figure 3 shows the 4DMA8 O3 distribution across time and space in YRD urban zones for 2015 and 2019. The 4DMA8 metric, defined as the fourth-highest 8-h average O3 concentration during the warm season, serves as a key indicator for assessing short-term exposure. As an essential measure of surface-level O3 pollution severity, 4DMA8 emphasizes the high-concentration segment of the distribution, which is typically closely linked to local emissions.
Overall, 4DMA8 O3 levels in the YRD exhibited a moderate increase between 2015 and 2019. In 2015, the regional mean was 171.4 ± 33.9 μg/m3, with concentrations ranging from 85.3 μg/m3 to 235.7 μg/m3. By 2019, the average had risen to 187.6 ± 17.6 μg/m3, accompanied by a narrowed concentration range of 142 to 217 μg/m3.
At the city level, approximately 73% of the cities in the YRD (32 out of 44) exhibited a positive trend in 4DMA8 O3 concentrations between 2015 and 2019. Notably, Tianchang (Jiangsu) and Chuzhou (Anhui) experienced increases exceeding 100 μg/m3, while Wuhu (Anhui) recorded a substantial rise of 95.7 μg/m3. In addition, Bozhou, Chizhou, and Huangshan—all located in Anhui Province—showed increases greater than 50 μg/m3.
In 2015, the cities with the highest 4DMA8 O3 levels were Zhenjiang (235.7 ± 14.6 μg/m3) and Nantong (223.4 ± 9.7 μg/m3), both in Jiangsu Province. By 2019, Changzhou exhibited the highest 4DMA8 concentration, increasing from 199 ± 7.5 μg/m3 to 217 ± 24 μg/m3. It is noteworthy that in 2015, only four cities recorded 4DMA8 values above 200 μg/m3, whereas by 2019 this number had risen to eleven towns, most of which were situated in the north of the YRD region. The results align with the observations of Huang et al. [39], indicating that across cities in the YRD, average O3 concentrations climbed from 149 μg/m3 in 2015 to 166 μg/m3 in 2017. During the same period, the mean rate of standard exceedance grew from 9.3% to 12.1%, while the share of days dominated by O3 as the principal pollutant escalated from 32.3% to 46.4%.
Studies have shown that O3 levels in the YRD exhibit a clear north-south trend. You see higher concentrations up north, while the southern parts of the region tend to have lower values. This is likely due to the breakneck economic growth happening in the northern YRD. Since 2016, regions such as Zhejiang have implemented stringent measures to control VOC emissions, including the imposition of VOC emission charges and the promotion of low-VOC-content solvents, which have mitigated the upward trend in O3 concentrations [39].

3.3. Trends in DMA8 O3 Concentrations

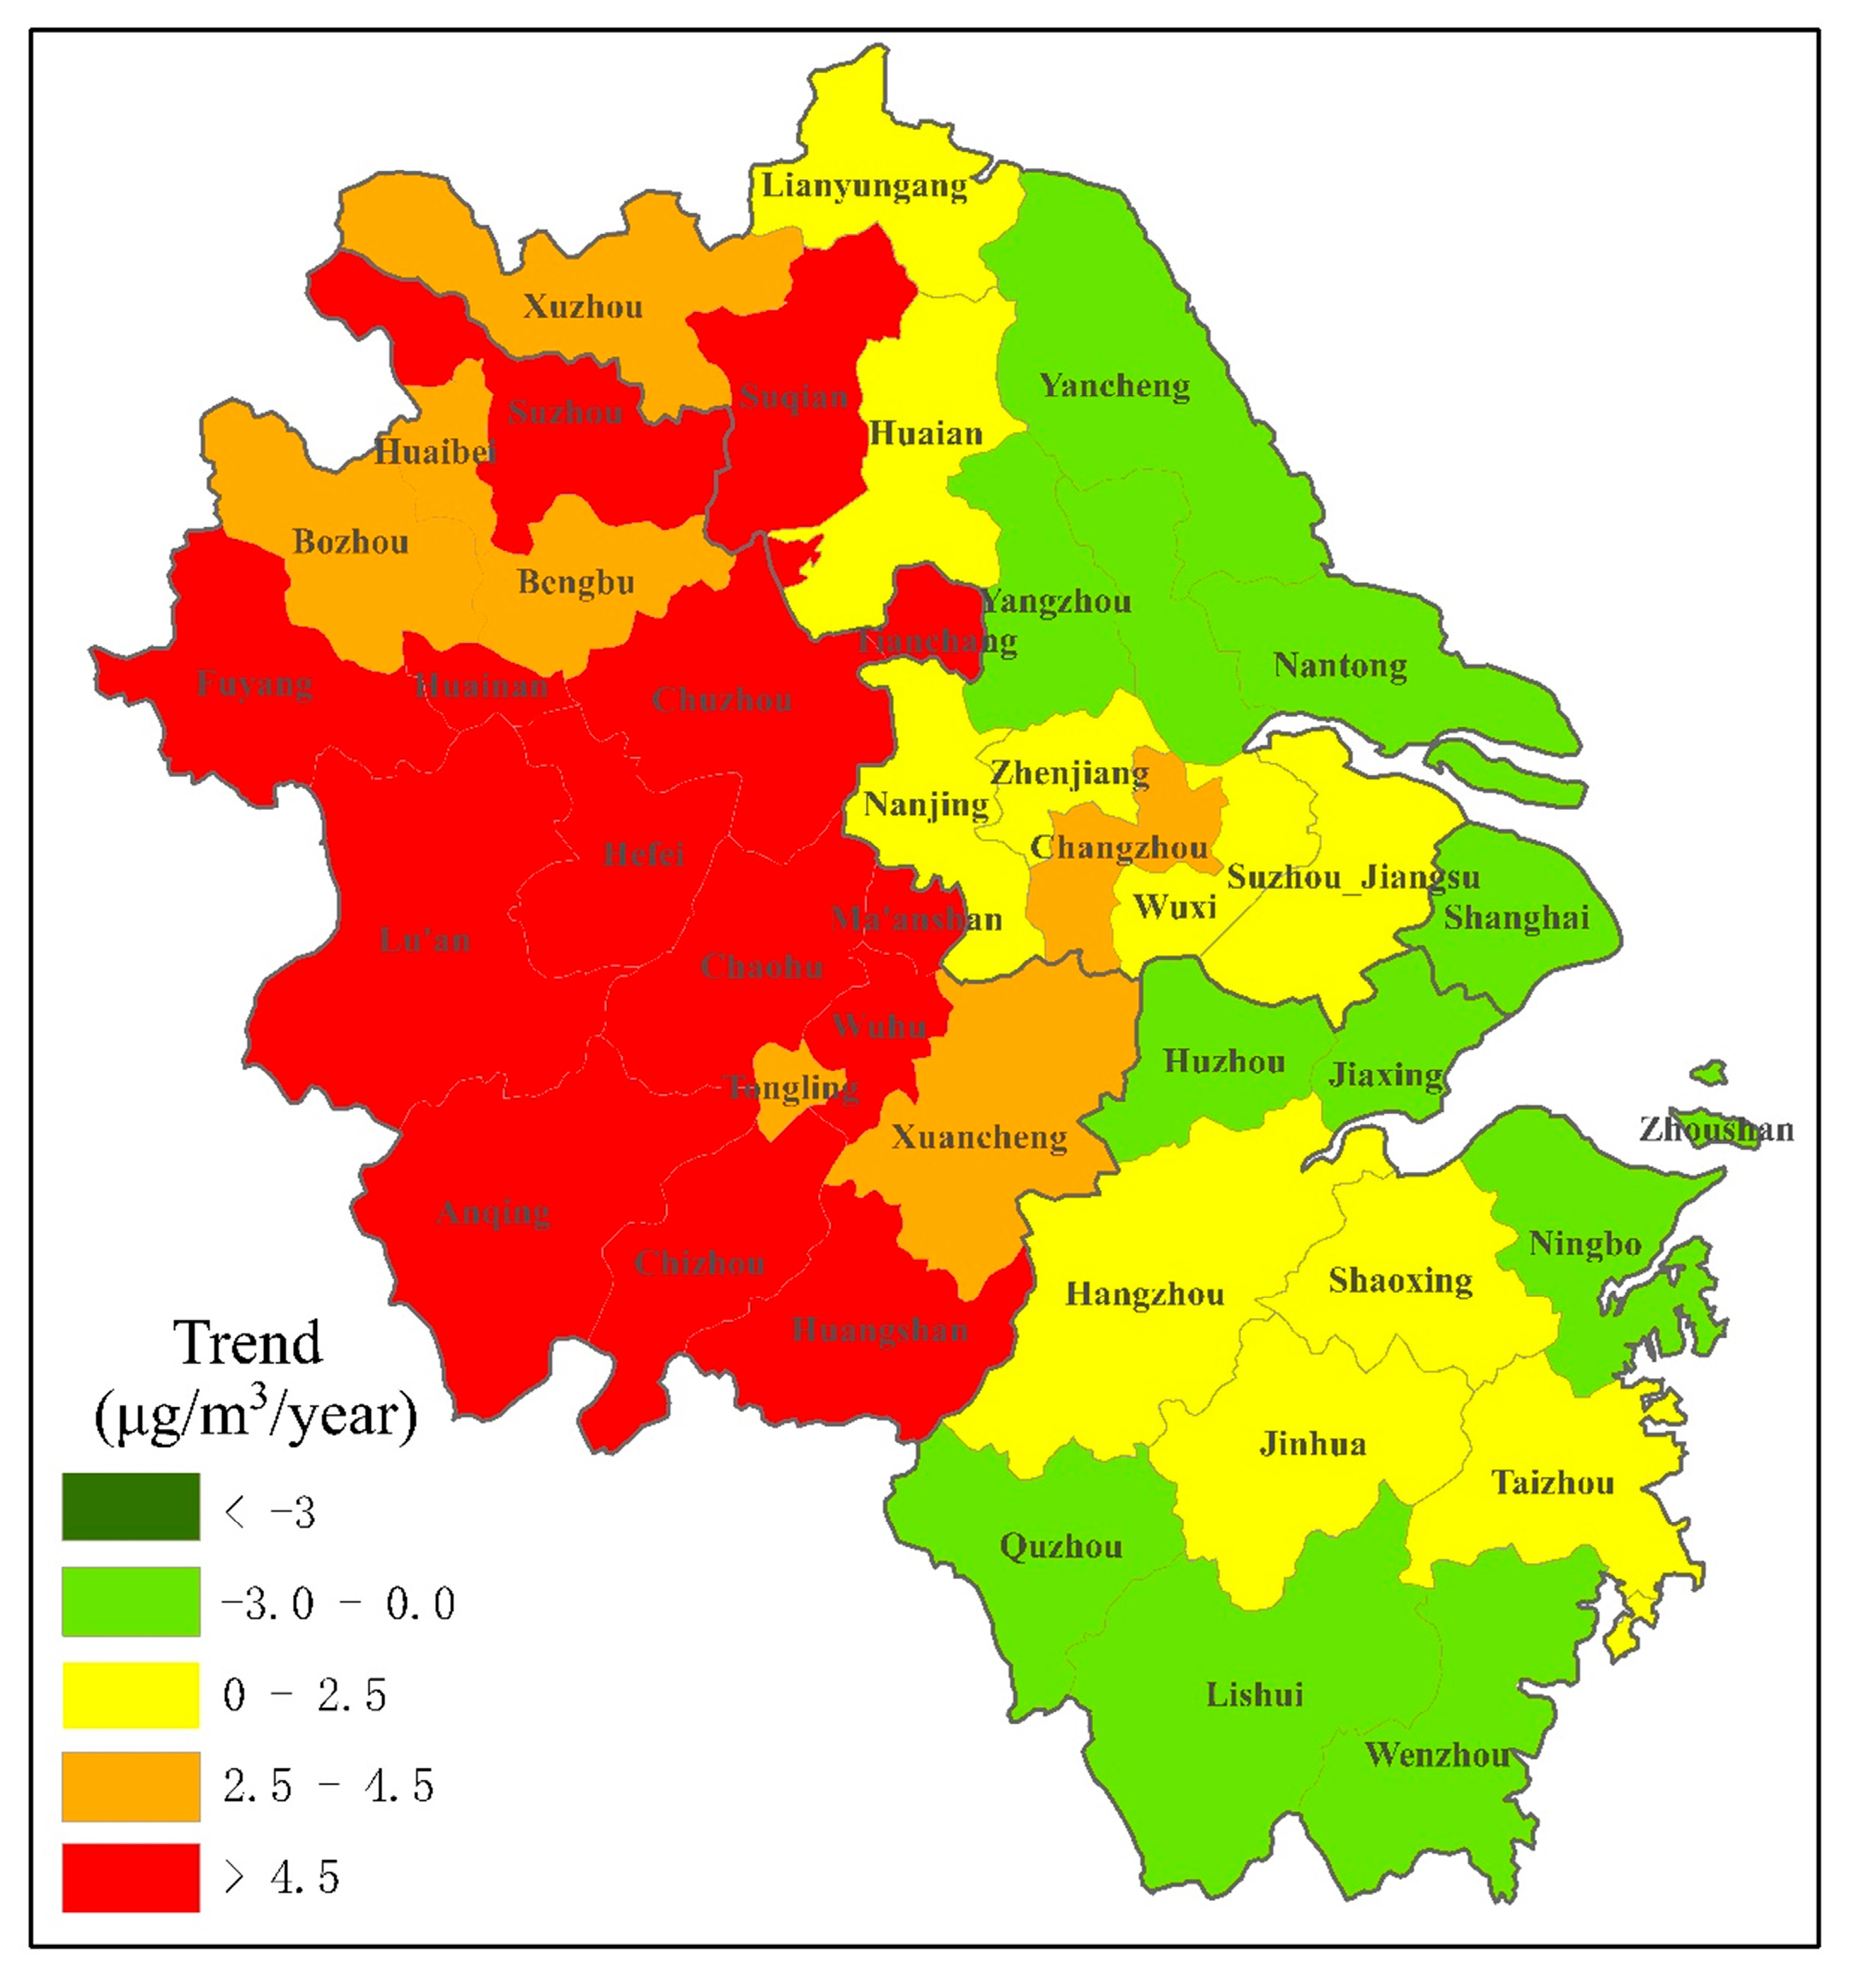
Figure 4 illustrates the absolute trends and regional variations in DMA8 O3 concentrations. The data show that DMA8 O3 levels in the YRD region generally rose from 2015 to 2019, with a mean annual rise of 2.9 ± 3.5 μg/m3.
At the provincial level, Anhui Province experienced the most pronounced increase, with an annual growth rate of 6.1 ± 2.2 μg/m3/year, substantially exceeding the regional average. In Jiangsu Province, O3 concentrations exhibited a moderate upward trajectory, averaging an annual growth of 1.8 ± 2.9 μg/m3/year, indicating persistent challenges in air pollution control. In contrast, Zhejiang Province and Shanghai Municipality exhibited slight declining trends, with average rates of −0.2 ± 1.2 μg/m3/year and −0.3 μg/m3/year, respectively.
At the city level, between 2015 and 2018, DMA8 O3 concentrations increased across all cities in Anhui Province. The most substantial rises were observed in Chuzhou (9.4 ± 1.9 μg/m3/year), Wuhu (9.3 ± 3.3 μg/m3/year), Chizhou (8.7 ± 2.3 μg/m3/year), and Anqing (8.5 ± 2.0 μg/m3/year). In contrast, several southern cities in the YRD exhibited slight declining trends, including Zhoushan (−1.9 ± 2.1 μg/m3/year) and Jiaxing (−1.4 ± 2.2 μg/m3/year) in Zhejiang Province, as well as Nantong (−1.1 ± 0.8 μg/m3/year) in Jiangsu Province.
In Anhui Province, the simultaneous growth in economic output and motor vehicle ownership has contributed to increased emissions of O3 precursors. According to the Anhui Statistical Yearbooks from 2016 to 2018, the province’s gross domestic product (GDP) rose from 2.41 trillion yuan in 2016 to 2.70 trillion yuan in 2017 and 3.00 trillion yuan in 2018, corresponding to year-on-year growth rates of 12% and 11.1%, respectively. This sustained economic expansion is a key factor driving the marked rise in O3 levels. At the same time, the number of registered motor vehicles in Anhui Province also increased, rising from 10.46 million in 2016 to 12.28 million by 2018, and further up to 13.19 million in 2019—resulting in year-on-year increases of 17.4% and 7.4%, respectively.
Overall, 73% of cities in the YRD exhibited increasing trends in O3 concentrations, with 27% experiencing annual increases exceeding 5 μg/m3. In contrast, only 23% of cities—primarily located in eastern Jiangsu and northern Zhejiang—showed declining trends. This disparity may be associated with the pace of economic development and the stringency of emission control policy implementation across different regions.

3.4. Long-Term Premature Mortality

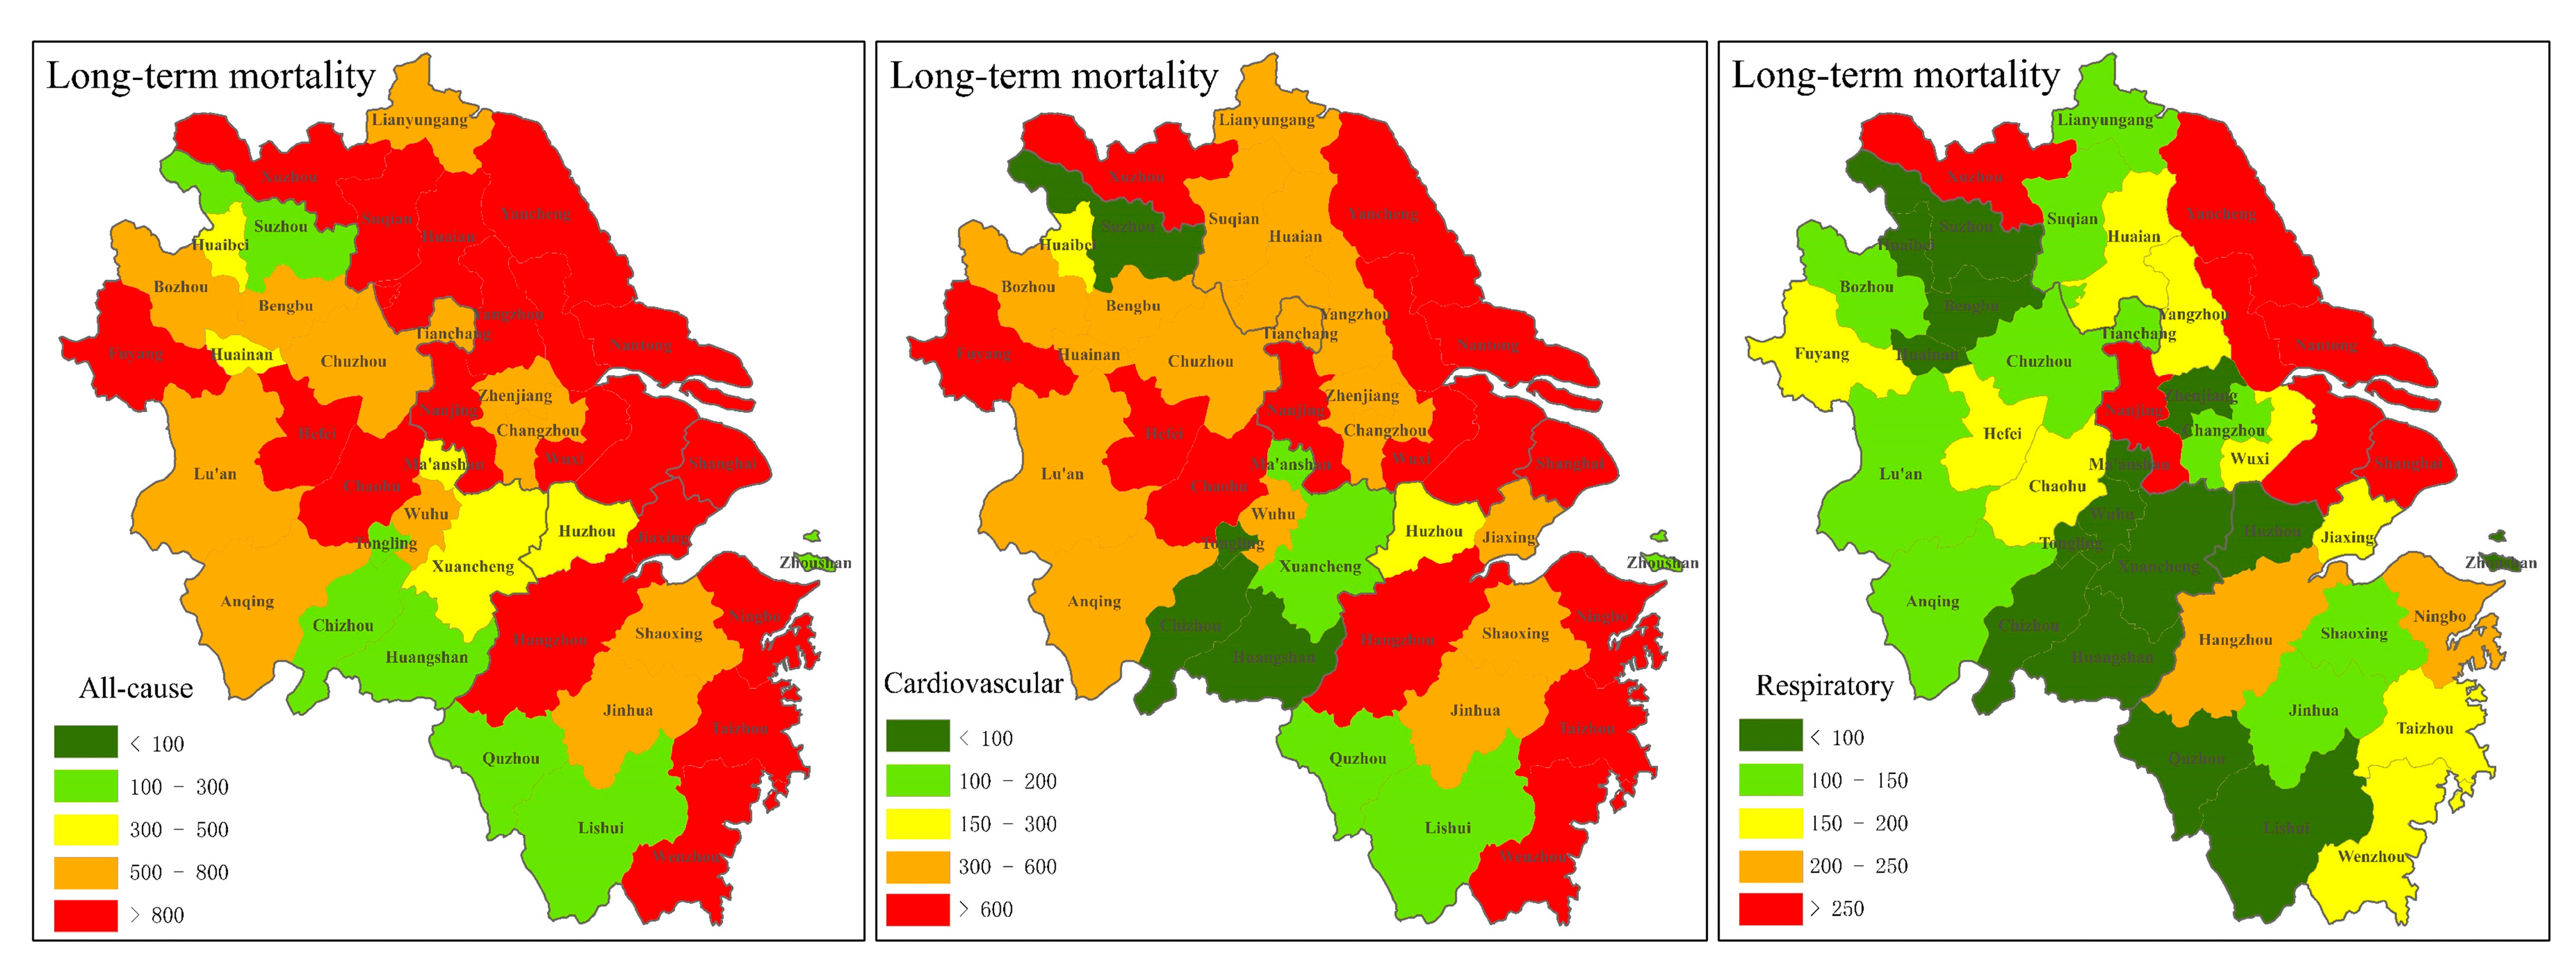
Previous epidemiological studies have consistently demonstrated a strong link between prolonged O3 exposure and various health complications, particularly respiratory illnesses, chronic obstructive pulmonary disease (COPD), and cardiovascular disorders [33,40]. Drawing on the relative risk assessments published by Turner et al. [33]. This study aimed to put a number on the premature deaths caused by prolonged ozone exposure between 2015 and 2019, looking at deaths from all causes as well as those specifically due to respiratory and cardiovascular issues. Figure 5 graphically depicts the geographical spread of the five-year average mortality rate attributable to O3 exposure for each disease category across cities in the YRD region.
Across all cities in the YRD, during five years of observation, it was projected that prolonged contact with O3 was responsible for an estimated 35,806 fatalities in the towns within the YRD region. This tally included 22,058 deaths tied to cardiovascular issues and 6656 instances associated with respiratory problems. Among the towns, Shanghai recorded the highest average annual O3-related all-cause mortality, with 4615 deaths (95% CI: 2340–8960), followed by Suzhou in Jiangsu Province with 1597 deaths (95% CI: 800–3100), Yancheng with 1428 deaths (95% CI: 720–2770), and Xuzhou with 1410 deaths (95% CI: 710–2730). The top-ranking cities for cardiovascular and respiratory mortality mirrored the pattern observed for all-cause deaths, reflecting their high population density and intensive industrial activity, which contribute to elevated O3 exposure and, consequently, greater health burdens.
In terms of spatial distribution, the five-year average of deaths associated with prolonged O3 exposure was 833 per city, including 513 from cardiovascular diseases and 155 from respiratory illnesses. These data indicate that the impact on cardiovascular mortality is the most pronounced, accounting for approximately 76.8% of total deaths. In contrast, the contribution from respiratory mortality, although smaller, remains a noteworthy public health concern.
Regionally, cities in Jiangsu and Zhejiang provinces—such as Hangzhou and Ningbo—generally exhibited higher mortality burdens, likely driven by rapid urbanization, increased vehicular emissions, and elevated intensities of O3 precursor emissions. Although smaller cities like Huangshan, Suzhou (Anhui), and Tongling reported lower absolute mortality counts, their smaller populations result in relatively high per capita mortality rates. Consequently, these cities also warrant attention in terms of health risks and should be prioritized in future air quality monitoring and mitigation strategies.

3.5. Short-Term Premature Mortality

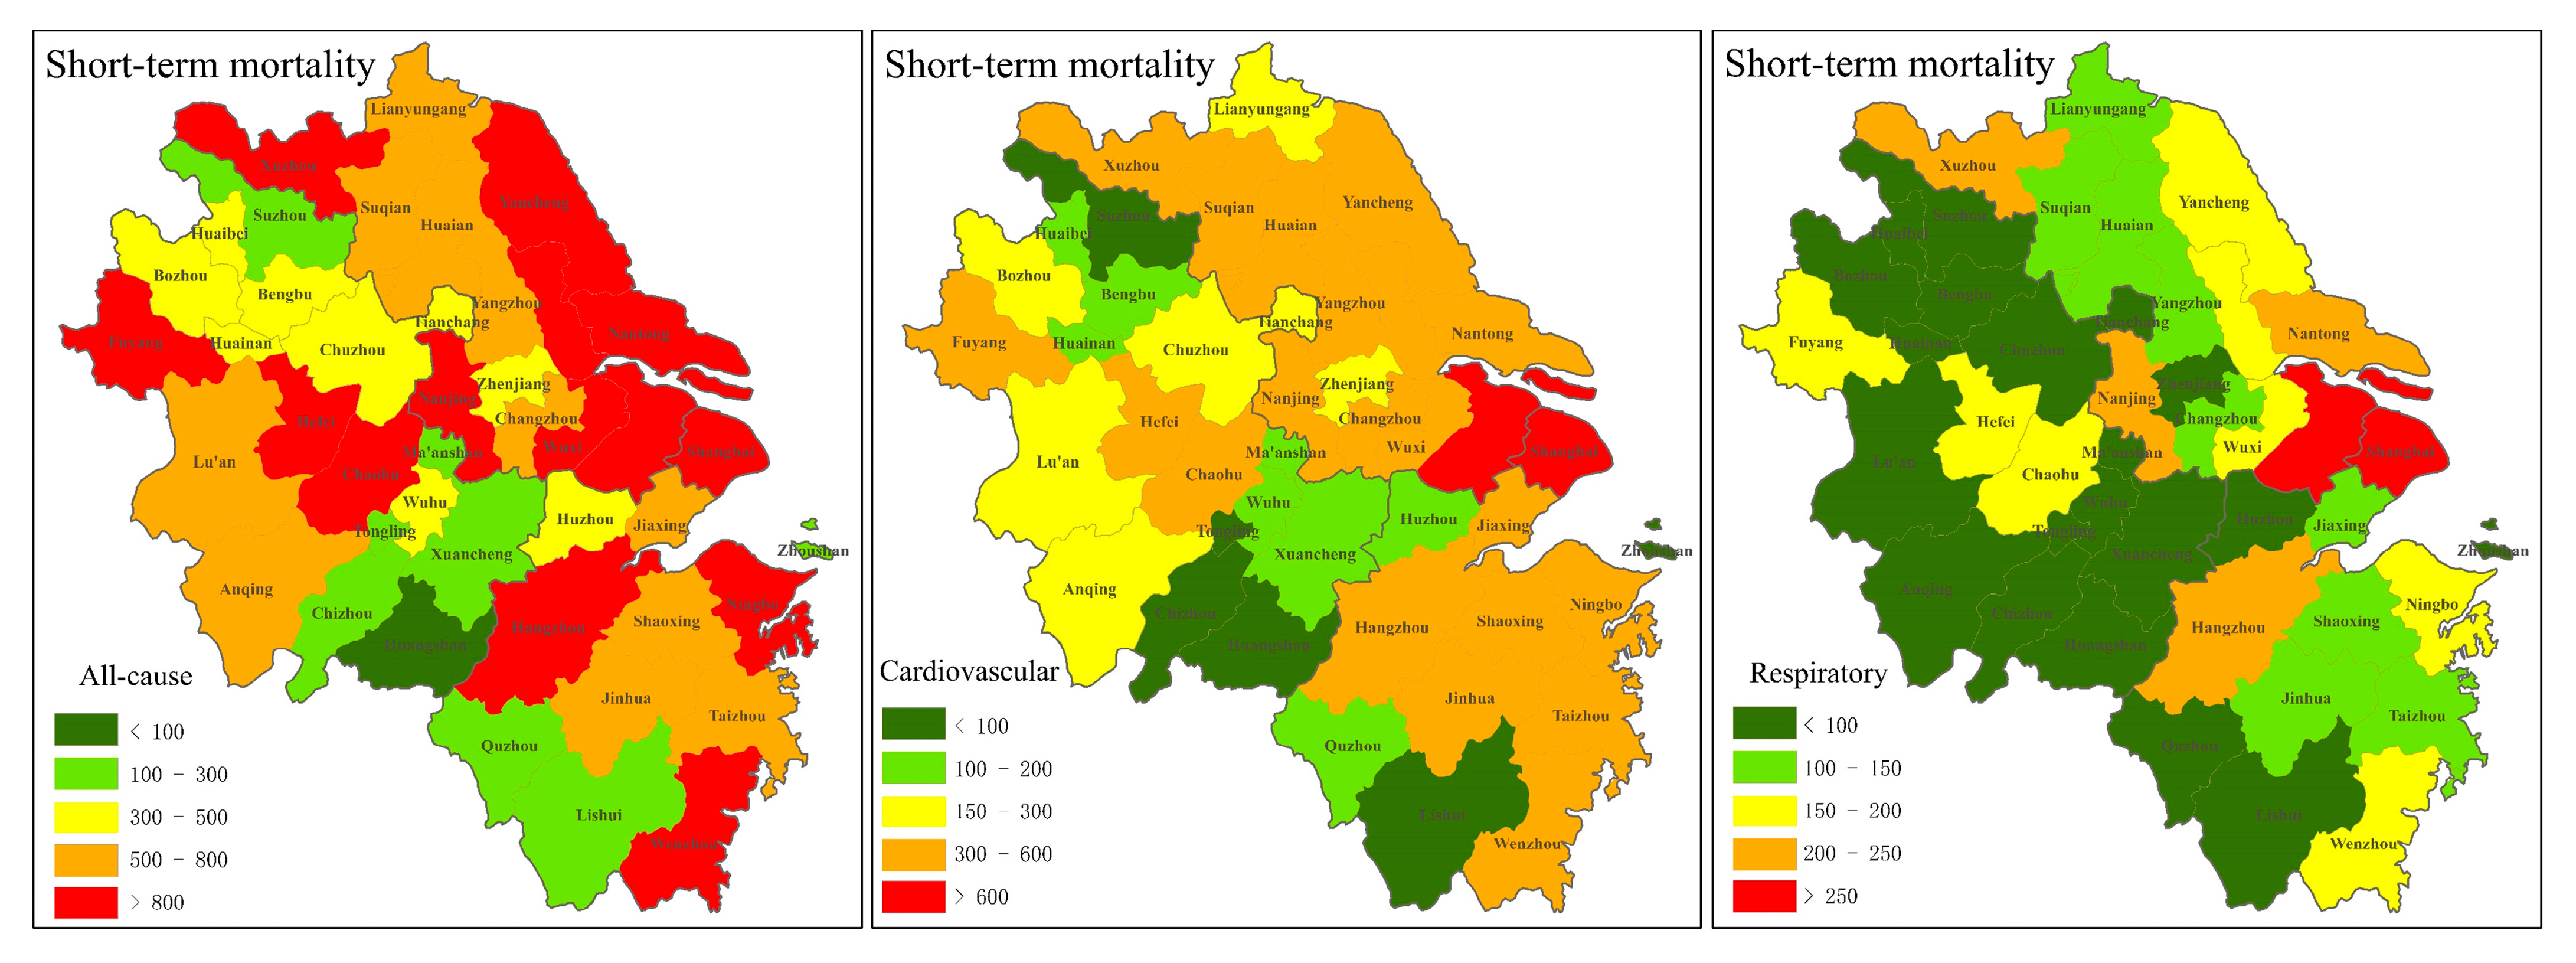
Figure 6 illustrates the geographic pattern of the average five-year mortality rates linked to brief O3 pollution in the YRD. Throughout the study, short-term O3 exposure was estimated to contribute to an annual average of 30,075 deaths from all causes, including 14,137 from cardiovascular diseases and 5448 from respiratory illnesses.
The highest burdens of cardiovascular mortality associated with short-term O3 exposure were observed in four cities: Shanghai (1777 deaths; 95% CI: 670–2850), Suzhou in Jiangsu Province (675 deaths; 95% CI: 250–1080), Hangzhou in Zhejiang Province (574 deaths; 95% CI: 220–920), and Nanjing in Jiangsu Province (558 deaths; 95% CI: 210–890). The cities with the highest respiratory mortality followed similar rankings: Shanghai (684 deaths; 95% CI: 360–1040), Suzhou (260 deaths; 95% CI: 140–390), Hangzhou (221 deaths; 95% CI: 120–330), and Nanjing (215 deaths; 95% CI: 110–320). Across most cities, cardiovascular mortality accounted for approximately 71–72% of total short-term O3-related deaths.
Although the overall mortality linked to acute O3 exposure is somewhat lower than that resulting from prolonged exposure, it is characterized by greater severity and poses more immediate pressure on healthcare systems. Shanghai remained the city with the highest short-term all-cause mortality burden, with 3780 deaths (95% CI: 2080–5480). Other cities with a high mortality burden included Suzhou (1437 deaths; 95% CI: 790–2080), Hangzhou (1222 deaths; 95% CI: 670–1770), and Nanjing (1187 deaths; 95% CI: 650–1720). Across all cities, the five-year average per city was 699 all-cause deaths, comprising 328 from cardiovascular diseases and 127 from respiratory illnesses.
At the provincial level, Jiangsu Province exhibited the most significant burden of early deaths linked to brief O3 exposure, with an annual average of 11,895 deaths, representing 40% of all short-term O3-related fatalities in the YRD (95% CI: 6540–17,240). Anhui Province ranked second, with 7474 annual deaths stemming from O3-related issues, representing 24.9% of the regional total (95% CI: 4110–10,830).

4. Discussion

Using O3 concentration data collected from multiple cities across China’s YRD between 2015 and 2019, this study examined the evolving patterns of AVGDMA8 and 4DMA8 O3 levels. It also evaluated the influence of short-term and long-term exposure to O3 on deaths resulting from all causes, cardiovascular disease, and respiratory conditions. The results indicate a substantial increase in O3 concentrations across the majority of YRD cities. However, current air pollution control efforts remain primarily focused on particulate matter (PM2.5), with dedicated strategies for O3 mitigation receiving insufficient attention. These findings highlight the growing urgency of implementing more effective O3 control measures to protect public health in the area better.
Key contributors to the continually elevated O3 levels in the area include multiple factors. First, O3 formation in this area is predominantly VOC-limited, suggesting that reducing VOC emissions is essential for effective O3 mitigation, whereas reductions in NOx emissions may unintentionally lead to higher O3 levels [5]. Recent bottom-up emission inventories, combined with satellite-based formaldehyde observations, indicate an upward trend in anthropogenic VOC emissions in eastern China, which has contributed to the sustained rise in surface O3 concentrations [25,41]. Furthermore, the reduction in PM2.5 levels has increased surface solar radiation, thereby accelerating photochemical processes and further enhancing O3 formation [25]. It is clear that we need to crack down on volatile organic compound emissions in the area to address O3 pollution effectively.
In terms of spatial distribution, numerous national and international studies have demonstrated that the health effects of O3 exposure exhibit considerable spatial heterogeneity [42,43,44]. Consistent with these findings, our analysis revealed pronounced intercity differences in O3 concentrations and their temporal trends across the YRD. For instance, central cities such as Nanjing, Xuzhou, and Shanghai exhibited significantly higher O3-attributable mortality rates compared with several prefecture-level and county-level cities. This uneven distribution likely reflects a combination of interrelated factors. First, regional disparities in the intensity of O3 precursor emissions. Although high levels of industrialization generally characterize the YRD, cities vary significantly in terms of industrial structure, energy consumption patterns, and vehicle ownership, resulting in uneven spatial distributions of NOx and VOC emissions that directly affect local O3 formation potential. Second, the area’s tropical monsoon climate, coupled with the urban heat island phenomenon, exacerbates the regional and seasonal fluctuations in O3 pollution levels. Additionally, as a secondary pollutant, O3 is mainly produced through photochemical interactions between NOx and VOCs. The connection between O3 levels and their precursors tends to be non-linear [45], and the sensitivity of O3 formation to specific precursors varies by region, determining the dominant O3 pollution regime in each area. These findings highlight the necessity for future mitigation strategies to adopt region-specific control measures while strengthening large-scale, coordinated regional management frameworks to effectively address O3 pollution in the YRD.
In the present health risk assessment, the assignment of relative risk values carries inherent uncertainty. Given the shortage of comprehensive long-term cohort studies on O3 exposure in China, a bulk of prior investigations have used RR estimates from Jerrett et al. [40], Turner et al. [33], and Lim et al. [34] to gauge long-term O3-related deaths occurring prematurely. The choice of RR source can dramatically influence the outcomes. For instance, Wang et al. [46] conducted a comparison between the projected figures for premature respiratory mortality, using the RR values from Turner et al. [33] and those derived from Jerrett et al. [40]. What they found was that the estimate based on Jerrett et al.’s 6mMDA1 metric and RR values resulted in an estimated 114,000 deaths, which is 39% lower than the 186,000 deaths calculated according to Turner et al.’s methodology. Similarly, Malley et al. [47] estimated that O3-related deaths in China were 154,000 (95% CI: 59,900–248,000) when applying Jerrett et al. [40]’s RR values, whereas the estimate increased to 316,000 (95% CI: 230,000–403,000) when using Turner et al. [33]’s RR values. Therefore, it is crucial in the future to establish location-specific and population-tailored O3 exposure–response functions or coefficients for China, which will boost the precision of our long-term health effect evaluations.
The assessment of health risks associated with O3 is also contingent upon the selection of threshold values. At present, there is no definitive theoretical explanation for the determination of O3 thresholds. The World Health Organization (WHO) suggests 35 ppb as the baseline level for O3. In the present study, the threshold was established based on the observed health risk levels in long-term epidemiological investigations by Turner et al. [33] and Lim et al. [34]. Using a similar methodological framework, Lu et al. [48] adopted 29.1 ppb as the TMREL and estimated that, from 2013 to 2019, exposure to ambient O3 (based on the MDA8 metric) was associated with an average of 49,430 premature respiratory deaths (95% CI: 34,350–64,610) annually in 69 Chinese cities. Malley et al. [47] reported that, in 2016, with a cutoff of 26.7 ppb, the projection for respiratory deaths tied to ozone exposure in China stood at 316,000 (95% CI: 230,000–403,000), whereas increasing the threshold to 31.1 ppb reduced the estimate to 274,000 (95% CI: 198,000–351,000). Notably, Zhan et al. [49], in a comprehensive health impact assessment for YRD, establishing 75.2 µg/m3 as the critical exposure level. This figure is lower than our study suggests, mainly because they used a higher threshold. By contrast, research by Yang et al. [50] calculated approximately 32,000 ozone-related premature deaths per year in the YRD between 2013 and 2018, a value that aligns pretty well with the outcomes of our research.
Significant discrepancies in premature mortality estimates can also result from differences in data sources [51,52,53]. According to GBD study, ambient O3 exposure was responsible for an estimated 152,000 to 254,000 annual premature mortality due to COPD during 2010–2015 to ambient O3 exposure [3,54]. According to the Seventh National Population Census, the YRD accounts for approximately 16.3% of China’s total population [55]. Based on this proportion, the GBD’s nationwide estimates correspond to roughly 24,776–41,402 premature deaths in the YRD, a range that is broadly consistent in magnitude with this study’s estimate of 35,806 all-cause premature deaths (95% CI: 18,130–69,540). To further validate the robustness of our results, we compared them with domestic studies employing chemical transport models. Based on epidemiological evidence, Lin et al. [56] and Liu et al. [57], employed a consistent threshold of 75.2 μg/m3. They leveraged the WRF-CMAQ atmospheric chemical transport model, configured with a spatial resolution of 36 km, to simulate surface O3 concentrations. They estimated COPD mortality attributable to O3 at 89,391 (95% CI: 32,226–141,649) in 2014 and 71,900 (95% CI: 55,341–80,280) in 2015, respectively. Employing the NAQPMS atmospheric model, Wang et al. [46] estimated that, between 2013 and 2017, O3 exposure in China was responsible for roughly 186,000 (95% CI: 129,000–237,000) respiratory illnesses and 125,000 (95% CI: 42,000–204,000) cardiovascular disease deaths. These studies highlight the substantial uncertainty associated with risk assessments based on O3 data simulated by chemical transport models. By comparison, measured O3 concentrations generally yield lower health risk estimates than those derived from chemical transport models or satellite observations. This underscores the critical importance of selecting an appropriate O3 data source when conducting health risk assessments.
In contrast to earlier research, what truly sets this study apart is its meticulous analysis of the mortality risks tied to both brief and prolonged O3 exposure in the YRD, thereby addressing the current underrepresentation of short-term effects in the literature. In addition, this study not only assessed all-cause mortality but also separately estimated the mortality burden from cardiovascular and respiratory diseases, providing a scientific basis for targeted and refined public health interventions. Despite our efforts to ensure methodological rigor and data integration, this research still has several limitations. First, the selection of the exposure–response coefficient (β) involves a degree of uncertainty. Although previous studies have demonstrated consistency in exposure–response relationships, variations in population health status across regions may introduce bias. Second, this study applied uniform RR values and TMREL without making adjustments according to the particular demographic and health traits of the local community. Finally, the mortality data were derived from city-level statistical yearbooks, and individual-level exposure assessments were not possible, which may have introduced some degree of error in the estimates. Future research should integrate regional epidemiological data to refine RR estimates and conduct comprehensive uncertainty and sensitivity analyses, thereby enhancing the robustness and policy relevance of health risk assessments.

5. Conclusions

The present study identified a marked increase in surface O3 concentrations throughout the YRD during the period 2015–2019 and evaluated the corresponding health effects associated with both long-term and short-term O3 exposure. The findings indicated that over the 2015–2019 period, AVGDMA8 O3 concentration escalated from 76.6 ± 17.5 μg/m3 to 89.7 ± 6.3 μg/m3, while 4DMA8 concentration rose from 171.4 ± 33.9 μg/m3 to 187.6 ± 17.6 μg/m3. Overall, the region experienced a continuous rise in O3 levels, with an average annual increase of 2.9 ± 3.5 μg/m3 over the five years. It is estimated that prolonged O3 exposure accounted for roughly 35,806 cases (95% CI: 18,130–69,540) all-cause premature deaths, including 22,058 (95% CI: 7580–42,270) cardiovascular deaths and 6656 (95% CI: 0–14,000) respiratory deaths. In addition, short-term O3 exposure was associated with an estimated 30,075 (95% CI: 16,550–43,600) all-cause deaths, 14,137 (95% CI: 5330–22,710) cardiovascular deaths, and 5448 (95% CI: 2840–8129) respiratory deaths. Furthermore, the findings indicate that provinces with larger populations are experiencing more rapid increases in O3 levels. These provinces should be prioritized as key targets for implementing stringent air pollution regulations aimed at mitigating the growing public health impacts.

Author Contributions

Methodology, J.H. and M.C.; Software, J.H.; Formal analysis, J.H. and H.Z.; Resources, H.Z.; Writing—original draft, J.H., M.C. and H.Z. All authors have read and agreed to the published version of the manuscript.

Funding

This work was supported by the National Natural Science Foundation of China (Grant Nos. 42405183), the Natural Science Foundation of Jiangsu Province (Grant Nos. BK20241080), and the Natural Science Foundation of the Jiangsu Higher Education Institutions of China (Grant No. 24KJB610006).

Institutional Review Board Statement

Not applicable.

Informed Consent Statement

Not applicable.

Data Availability Statement

The data presented in this study are available on request from the corresponding author. The data are not publicly available due to privacy.

Conflicts of Interest

The authors declare no conflicts of interest.

References

  1. Ma, Y.; Zhang, Y.; Wang, W.; Qin, P.; Li, H.; Jiao, H.; Wei, J. Estimation of health risk and economic loss attributable to PM2.5 and O3 pollution in Jilin Province, China. Sci. Rep. 2023, 13, 17717. [Google Scholar] [CrossRef]
  2. Ainsworth, E.A. Understanding and improving global crop response to ozone pollution. Plant J. 2017, 90, 886–897. [Google Scholar] [CrossRef]
  3. Cohen, A.J.; Brauer, M.; Burnett, R.; Anderson, H.R.; Frostad, J.; Estep, K.; Balakrishnan, K.; Brunekreef, B.; Dandona, L.; Dandona, R. Estimates and 25-year trends of the global burden of disease attributable to ambient air pollution: An analysis of data from the Global Burden of Diseases Study 2015. Lancet 2017, 389, 1907–1918. [Google Scholar] [CrossRef]
  4. Xu, X. Recent advances in studies of ozone pollution and impacts in China: A short review. Curr. Opin. Environ. Sci. Health 2021, 19, 100225. [Google Scholar] [CrossRef]
  5. Sicard, P.; Serra, R.; Rossello, P. Spatiotemporal trends in ground-level ozone concentrations and metrics in France over the time period 1999–2012. Environ. Res. 2016, 149, 122–144. [Google Scholar] [CrossRef]
  6. Yang, J.; Bu, D.; Liu, J.; Du, M. Research review on urban ozone pollution control in China. Environ. Sustain. Dev. 2020, 47, 86–90. [Google Scholar]
  7. Yan, H.; Zhang, W.; Hou, M.; Li, Y.-S.; Gao, P.; Xia, Q.; Meng, X.-Y.; Fan, L.-Y.; Ye, D.-Q. Sources and control area division of ozone pollution in cities at prefecture level and above in China. Environ. Sci. 2020, 41, 5215–5224. [Google Scholar]
  8. Hong, S.Y.; Ren, Z.B.; Wang, C.C.; Zhang, P.; Guo, Y.J.; Liu, J.P.; Liu, Y. Spatial and temporal patterns of ozone pollution and its influencing factors in China in 2019. Sci. Geogr. Sin. 2024, 44, 1706–1717. [Google Scholar]
  9. Kuerban, M.; Waili, Y.; Fan, F.; Liu, Y.; Qin, W.; Dore, A.J.; Peng, J.; Xu, W.; Zhang, F. Spatio-temporal patterns of air pollution in China from 2015 to 2018 and implications for health risks. Environ. Pollut. 2020, 258, 113659. [Google Scholar] [CrossRef] [PubMed]
  10. Ministry of Ecology and Environment of the People’s Republic of China. China Ecological and Environmental Status Bulletin 2017. Available online: https://www.mee.gov.cn/hjzl/sthjzk/zghjzkgb/201805/P020180531534645032372.pdf (accessed on 22 May 2018).
  11. Lu, X.; Hong, J.; Zhang, L.; Cooper, O.R.; Schultz, M.G.; Xu, X.; Wang, T.; Gao, M.; Zhao, Y.; Zhang, Y. Severe surface ozone pollution in China: A global perspective. Environ. Sci. Technol. Lett. 2018, 5, 487–494. [Google Scholar] [CrossRef]
  12. Ministry of Ecology and Environment of the People’s Republic of China. China Ecological and Environmental Status Bulletin 2018. Available online: https://www.mee.gov.cn/hjzl/sthjzk/zghjzkgb/201905/P020190619587632630618.pdf (accessed on 22 May 2019).
  13. Tiotiu, A.I.; Novakova, P.; Nedeva, D.; Chong-Neto, H.J.; Novakova, S.; Steiropoulos, P.; Kowal, K. Impact of air pollution on asthma outcomes. Int. J. Environ. Res. Public Health 2020, 17, 6212. [Google Scholar] [CrossRef] [PubMed]
  14. Manisalidis, I.; Stavropoulou, E.; Stavropoulos, A.; Bezirtzoglou, E. Environmental and health impacts of air pollution: A review. Front. Public Health 2020, 8, 14. [Google Scholar] [CrossRef]
  15. Liu, N.; Lin, W.; Ma, J.; Xu, W.; Xu, X. Seasonal variation in surface ozone and its regional characteristics at global atmosphere watch stations in China. J. Environ. Sci. 2019, 77, 291–302. [Google Scholar] [CrossRef]
  16. Zhao, H.; Chen, K.Y.; Liu, Z.; Zhang, Y.X.; Shao, T.; Zhang, H.L. Coordinated control of PM2.5 and O3 is urgently needed in China after implementation of the “Air pollution prevention and control action plan”. Chemosphere 2021, 270, 129441. [Google Scholar] [CrossRef]
  17. Dai, Y.; Qiu, H.; Sun, S.; Yang, Y.; Lin, H.; Tian, L. Age-dependent effect of ambient ozone on emergency asthma hospitalizations in Hong Kong. J. Allergy Clin. Immunol. 2018, 141, 1532–1534. [Google Scholar] [CrossRef]
  18. Stevens, E.L.; Rosser, F.; Forno, E.; Peden, D.; Celedón, J.C. Can the effects of outdoor air pollution on asthma be mitigated? J. Allergy Clin. Immunol. 2019, 143, 2016–2018. [Google Scholar] [CrossRef]
  19. Chatkin, J.; Correa, L.; Santos, U. External environmental pollution as a risk factor for asthma. Clin. Rev. Allergy Immunol. 2022, 62, 72–89. [Google Scholar] [CrossRef] [PubMed]
  20. Bell, M.L.; Zanobetti, A.; Dominici, F. Who is more affected by ozone pollution? A systematic review and meta-analysis. Am. J. Epidemiol. 2014, 180, 15–28. [Google Scholar] [CrossRef]
  21. Tian, Y.; Xiang, X.; Juan, J.; Song, J.; Cao, Y.; Huang, C.; Li, M.; Hu, Y. Short-term effect of ambient ozone on daily emergency room visits in Beijing, China. Sci. Rep. 2018, 8, 2775. [Google Scholar] [CrossRef] [PubMed]
  22. Raza, A.; Dahlquist, M.; Lind, T.; Ljungman, P.L. Susceptibility to short-term ozone exposure and cardiovascular and respiratory mortality by previous hospitalizations. Environ. Health 2018, 17, 37. [Google Scholar] [CrossRef]
  23. Zhan, Y.; Luo, Y.; Deng, X.; Grieneisen, M.L.; Zhang, M.; Di, B. Spatiotemporal prediction of daily ambient ozone levels across China using random forest for human exposure assessment. Environ. Pollut. 2018, 233, 464–473. [Google Scholar] [CrossRef] [PubMed]
  24. Liang, S.; Li, X.; Teng, Y.; Fu, H.; Chen, L.; Mao, J.; Zhang, H.; Gao, S.; Sun, Y.; Ma, Z. Estimation of health and economic benefits based on ozone exposure level with high spatial-temporal resolution by fusing satellite and station observations. Environ. Pollut. 2019, 255, 113267. [Google Scholar] [CrossRef]
  25. Li, K.; Jacob, D.J.; Liao, H.; Shen, L.; Zhang, Q.; Bates, K.H. Anthropogenic drivers of 2013–2017 trends in summer surface ozone in China. Proc. Natl. Acad. Sci. USA 2019, 116, 422–427. [Google Scholar] [CrossRef]
  26. Wang, T.; Xue, L.; Brimblecombe, P.; Lam, Y.F.; Li, L.; Zhang, L. Ozone pollution in China: A review of concentrations, meteorological influences, chemical precursors, and effects. Sci. Total Environ. 2017, 575, 1582–1596. [Google Scholar] [CrossRef]
  27. Gao, R.; Li, Q.; Che, F.; Zhang, Y.P.; Zu, Y.G.; Liu, F. Spatial and Temporal Distribution Characteristics of Ozone Concentration and Health Benefit Assessment in the Beijing-Tianjin-Hebei Region from 2015 to 2020. Environ. Sci. 2024, 45, 2525–2536. [Google Scholar]
  28. Sinha, B.; Singh Sangwan, K.; Maurya, Y.; Kumar, V.; Sarkar, C.; Chandra, B.; Sinha, V. Assessment of crop yield losses in Punjab and Haryana using 2 years of continuous in situ ozone measurements. Atmos. Chem. Phys. 2015, 15, 9555–9576. [Google Scholar] [CrossRef]
  29. Schultz, M.G.; Schröder, S.; Lyapina, O.; Cooper, O.R.; Galbally, I.; Petropavlovskikh, I.; Von Schneidemesser, E.; Tanimoto, H.; Elshorbany, Y.; Naja, M. Tropospheric Ozone Assessment Report: Database and metrics data of global surface ozone observations. Elem. Sci. Anthr. 2017, 5, 58. [Google Scholar] [CrossRef]
  30. Lefohn, A.S.; Malley, C.S.; Smith, L.; Wells, B.; Hazucha, M.; Simon, H.; Naik, V.; Mills, G.; Schultz, M.G.; Paoletti, E. Tropospheric ozone assessment report: Global ozone metrics for climate change, human health, and crop/ecosystem research. Elem. Sci. Anthr. 2018, 6, 27. [Google Scholar] [CrossRef]
  31. The R Core Team. R: A Language and Environment for Statistical Computing; The R Foundation for Statistical Computing: Vienna, Austria, 2010. [Google Scholar]
  32. Carslaw, D. The OpenAir manual–open-source tools for analysing air pollution data. Man. Version 2015, 27–28, 52–61. [Google Scholar]
  33. Turner, M.C.; Jerrett, M.; Pope, C.A., III; Krewski, D.; Gapstur, S.M.; Diver, W.R.; Beckerman, B.S.; Marshall, J.D.; Su, J.; Crouse, D.L. Long-term ozone exposure and mortality in a large prospective study. Am. J. Respir. Crit. Care Med. 2016, 193, 1134–1142. [Google Scholar] [CrossRef] [PubMed]
  34. Lim, C.C.; Hayes, R.B.; Ahn, J.; Shao, Y.; Silverman, D.T.; Jones, R.R.; Garcia, C.; Bell, M.L.; Thurston, G.D. Long-term exposure to ozone and cause-specific mortality risk in the United States. Am. J. Respir. Crit. Care Med. 2019, 200, 1022–1031. [Google Scholar] [CrossRef]
  35. Henschel, S.; Chan, G. Health Risks of Air Pollution in Europe-HRAPIE Project: New Emerging Risks to Health From Air Pollution-Results from the Survey of Experts; World Health Organization: Geneva, Switzerland, 2013. [Google Scholar]
  36. Yin, P.; Chen, R.; Wang, L.; Meng, X.; Liu, C.; Niu, Y.; Lin, Z.; Liu, Y.; Liu, J.; Qi, J. Ambient ozone pollution and daily mortality: A nationwide study in 272 Chinese cities. Environ. Health Perspect. 2017, 125, 117006. [Google Scholar] [CrossRef] [PubMed]
  37. Dong, J.; Liu, X.; Zhang, B.; Wang, J.; Shang, K. Meta-analysis of association between short-term ozone exposure and population mortality in China. Acta Sci. Circumst. 2016, 36, 1477–1485. [Google Scholar]
  38. He, J.; Gong, S.; Yu, Y.; Yu, L.; Wu, L.; Mao, H.; Song, C.; Zhao, S.; Liu, H.; Li, X. Air pollution characteristics and their relation to meteorological conditions during 2014–2015 in major Chinese cities. Environ. Pollut. 2017, 223, 484–496. [Google Scholar] [CrossRef] [PubMed]
  39. Huang, X.G.; Shao, T.J.; Zhao, J.B.; Cao, J.J.; Song, Y.Y. Spatio-temporal Differentiation of Ozone Concentration and Its Driving Factors in Yangtze River Delta Urban Agglomeration. Resour. Environ. Yangtze Basin 2019, 28, 1434–1445. [Google Scholar]
  40. Jerrett, M.; Burnett, R.T.; Pope, C.A., III; Ito, K.; Thurston, G.; Krewski, D.; Shi, Y.; Calle, E.; Thun, M. Long-term ozone exposure and mortality. N. Engl. J. Med. 2009, 360, 1085–1095. [Google Scholar] [CrossRef]
  41. Li, M.; Zhang, Q.; Zheng, B.; Tong, D.; Lei, Y.; Liu, F.; Hong, C.; Kang, S.; Yan, L.; Zhang, Y. Persistent growth of anthropogenic non-methane volatile organic compound (NMVOC) emissions in China during 1990–2017: Drivers, speciation and ozone formation potential. Atmos. Chem. Phys. 2019, 19, 8897–8913. [Google Scholar] [CrossRef]
  42. Han, H.; Liu, J.; Shu, L.; Wang, T.; Yuan, H. Local and synoptic meteorological influences on daily variability in summertime surface ozone in eastern China. Atmos. Chem. Phys. 2020, 20, 203–222. [Google Scholar] [CrossRef]
  43. Silver, B.; Reddington, C.; Arnold, S.; Spracklen, D. Substantial changes in air pollution across China during 2015–2017. Environ. Res. Lett. 2018, 13, 114012. [Google Scholar] [CrossRef]
  44. Chen, H.; Zhuang, B.; Liu, J.; Wang, T.; Li, S.; Xie, M.; Li, M.; Chen, P.; Zhao, M. Characteristics of ozone and particles in the near-surface atmosphere in the urban area of the Yangtze River Delta, China. Atmos. Chem. Phys. 2019, 19, 4153–4175. [Google Scholar] [CrossRef]
  45. Liu, C.W.; Lian, X.B.; Huang, J.P. Research Review on the Spatio-temporal Distribution of Ozone Pollution and Its Causes in China. Arid. Meteorol. 2020, 38, 355–361. [Google Scholar]
  46. Wang, Y.; Wild, O.; Chen, X.; Wu, Q.; Gao, M.; Chen, H.; Qi, Y.; Wang, Z. Health impacts of long-term ozone exposure in China over 2013–2017. Environ. Int. 2020, 144, 106030. [Google Scholar] [CrossRef]
  47. Malley, C.S.; Henze, D.K.; Kuylenstierna, J.C.; Vallack, H.W.; Davila, Y.; Anenberg, S.C.; Turner, M.C.; Ashmore, M.R. Updated global estimates of respiratory mortality in adults ≥ 30 years of age attributable to long-term ozone exposure. Environ. Health Perspect. 2017, 125, 087021. [Google Scholar] [CrossRef]
  48. Lu, X.; Zhang, L.; Wang, X.; Gao, M.; Li, K.; Zhang, Y.; Yue, X.; Zhang, Y. Rapid increases in warm-season surface ozone and resulting health impact in China since 2013. Environ. Sci. Technol. Lett. 2020, 7, 240–247. [Google Scholar] [CrossRef]
  49. Zhan, C.; Xie, M.; Liu, J.; Wang, T.; Xu, M.; Chen, B.; Li, S.; Zhuang, B.; Li, M. Surface ozone in the Yangtze River Delta, China: A synthesis of basic features, meteorological driving factors, and health impacts. J. Geophys. Res. Atmos. 2021, 126, e2020JD033600. [Google Scholar] [CrossRef]
  50. Yang, L.; Hong, S.; Mu, H.; Zhou, J.; He, C.; Wu, Q.; Gong, X. Ozone exposure and health risks of different age structures in major urban agglomerations in the People’s Republic of China from 2013 to 2018. Environ. Sci. Pollut. Res. 2023, 30, 42152–42164. [Google Scholar] [CrossRef]
  51. Ghude, S.D.; Chate, D.; Jena, C.; Beig, G.; Kumar, R.; Barth, M.; Pfister, G.; Fadnavis, S.; Pithani, P. Premature mortality in India due to PM2.5 and ozone exposure. Geophys. Res. Lett. 2016, 43, 4650–4658. [Google Scholar] [CrossRef]
  52. Feng, Z.; De Marco, A.; Anav, A.; Gualtieri, M.; Sicard, P.; Tian, H.; Fornasier, F.; Tao, F.; Guo, A.; Paoletti, E. Economic losses due to ozone impacts on human health, forest productivity and crop yield across China. Environ. Int. 2019, 131, 104966. [Google Scholar] [CrossRef]
  53. Seltzer, K.M.; Shindell, D.T.; Malley, C.S. Measurement-based assessment of health burdens from long-term ozone exposure in the United States, Europe, and China. Environ. Res. Lett. 2018, 13, 104018. [Google Scholar] [CrossRef]
  54. Lim, S.S.; Vos, T.; Flaxman, A.D.; Danaei, G.; Shibuya, K.; Adair-Rohani, H.; AlMazroa, M.A.; Amann, M.; Anderson, H.R.; Andrews, K.G. A comparative risk assessment of burden of disease and injury attributable to 67 risk factors and risk factor clusters in 21 regions, 1990–2010: A systematic analysis for the Global Burden of Disease Study 2010. Lancet 2012, 380, 2224–2260. [Google Scholar] [CrossRef]
  55. Chen, C. Changes in the spatial distribution of the employed population in the Yangtze River Delta region since the 21st century: An analysis and discussion based on census data. Land 2023, 12, 1249. [Google Scholar] [CrossRef]
  56. Lin, Y.; Jiang, F.; Zhao, J.; Zhu, G.; He, X.; Ma, X.; Li, S.; Sabel, C.E.; Wang, H. Impacts of O3 on premature mortality and crop yield loss across China. Atmos. Environ. 2018, 194, 41–47. [Google Scholar] [CrossRef]
  57. Liu, H.; Liu, S.; Xue, B.; Lv, Z.; Meng, Z.; Yang, X.; Xue, T.; Yu, Q.; He, K. Ground-level ozone pollution and its health impacts in China. Atmos. Environ. 2018, 173, 223–230. [Google Scholar] [CrossRef]
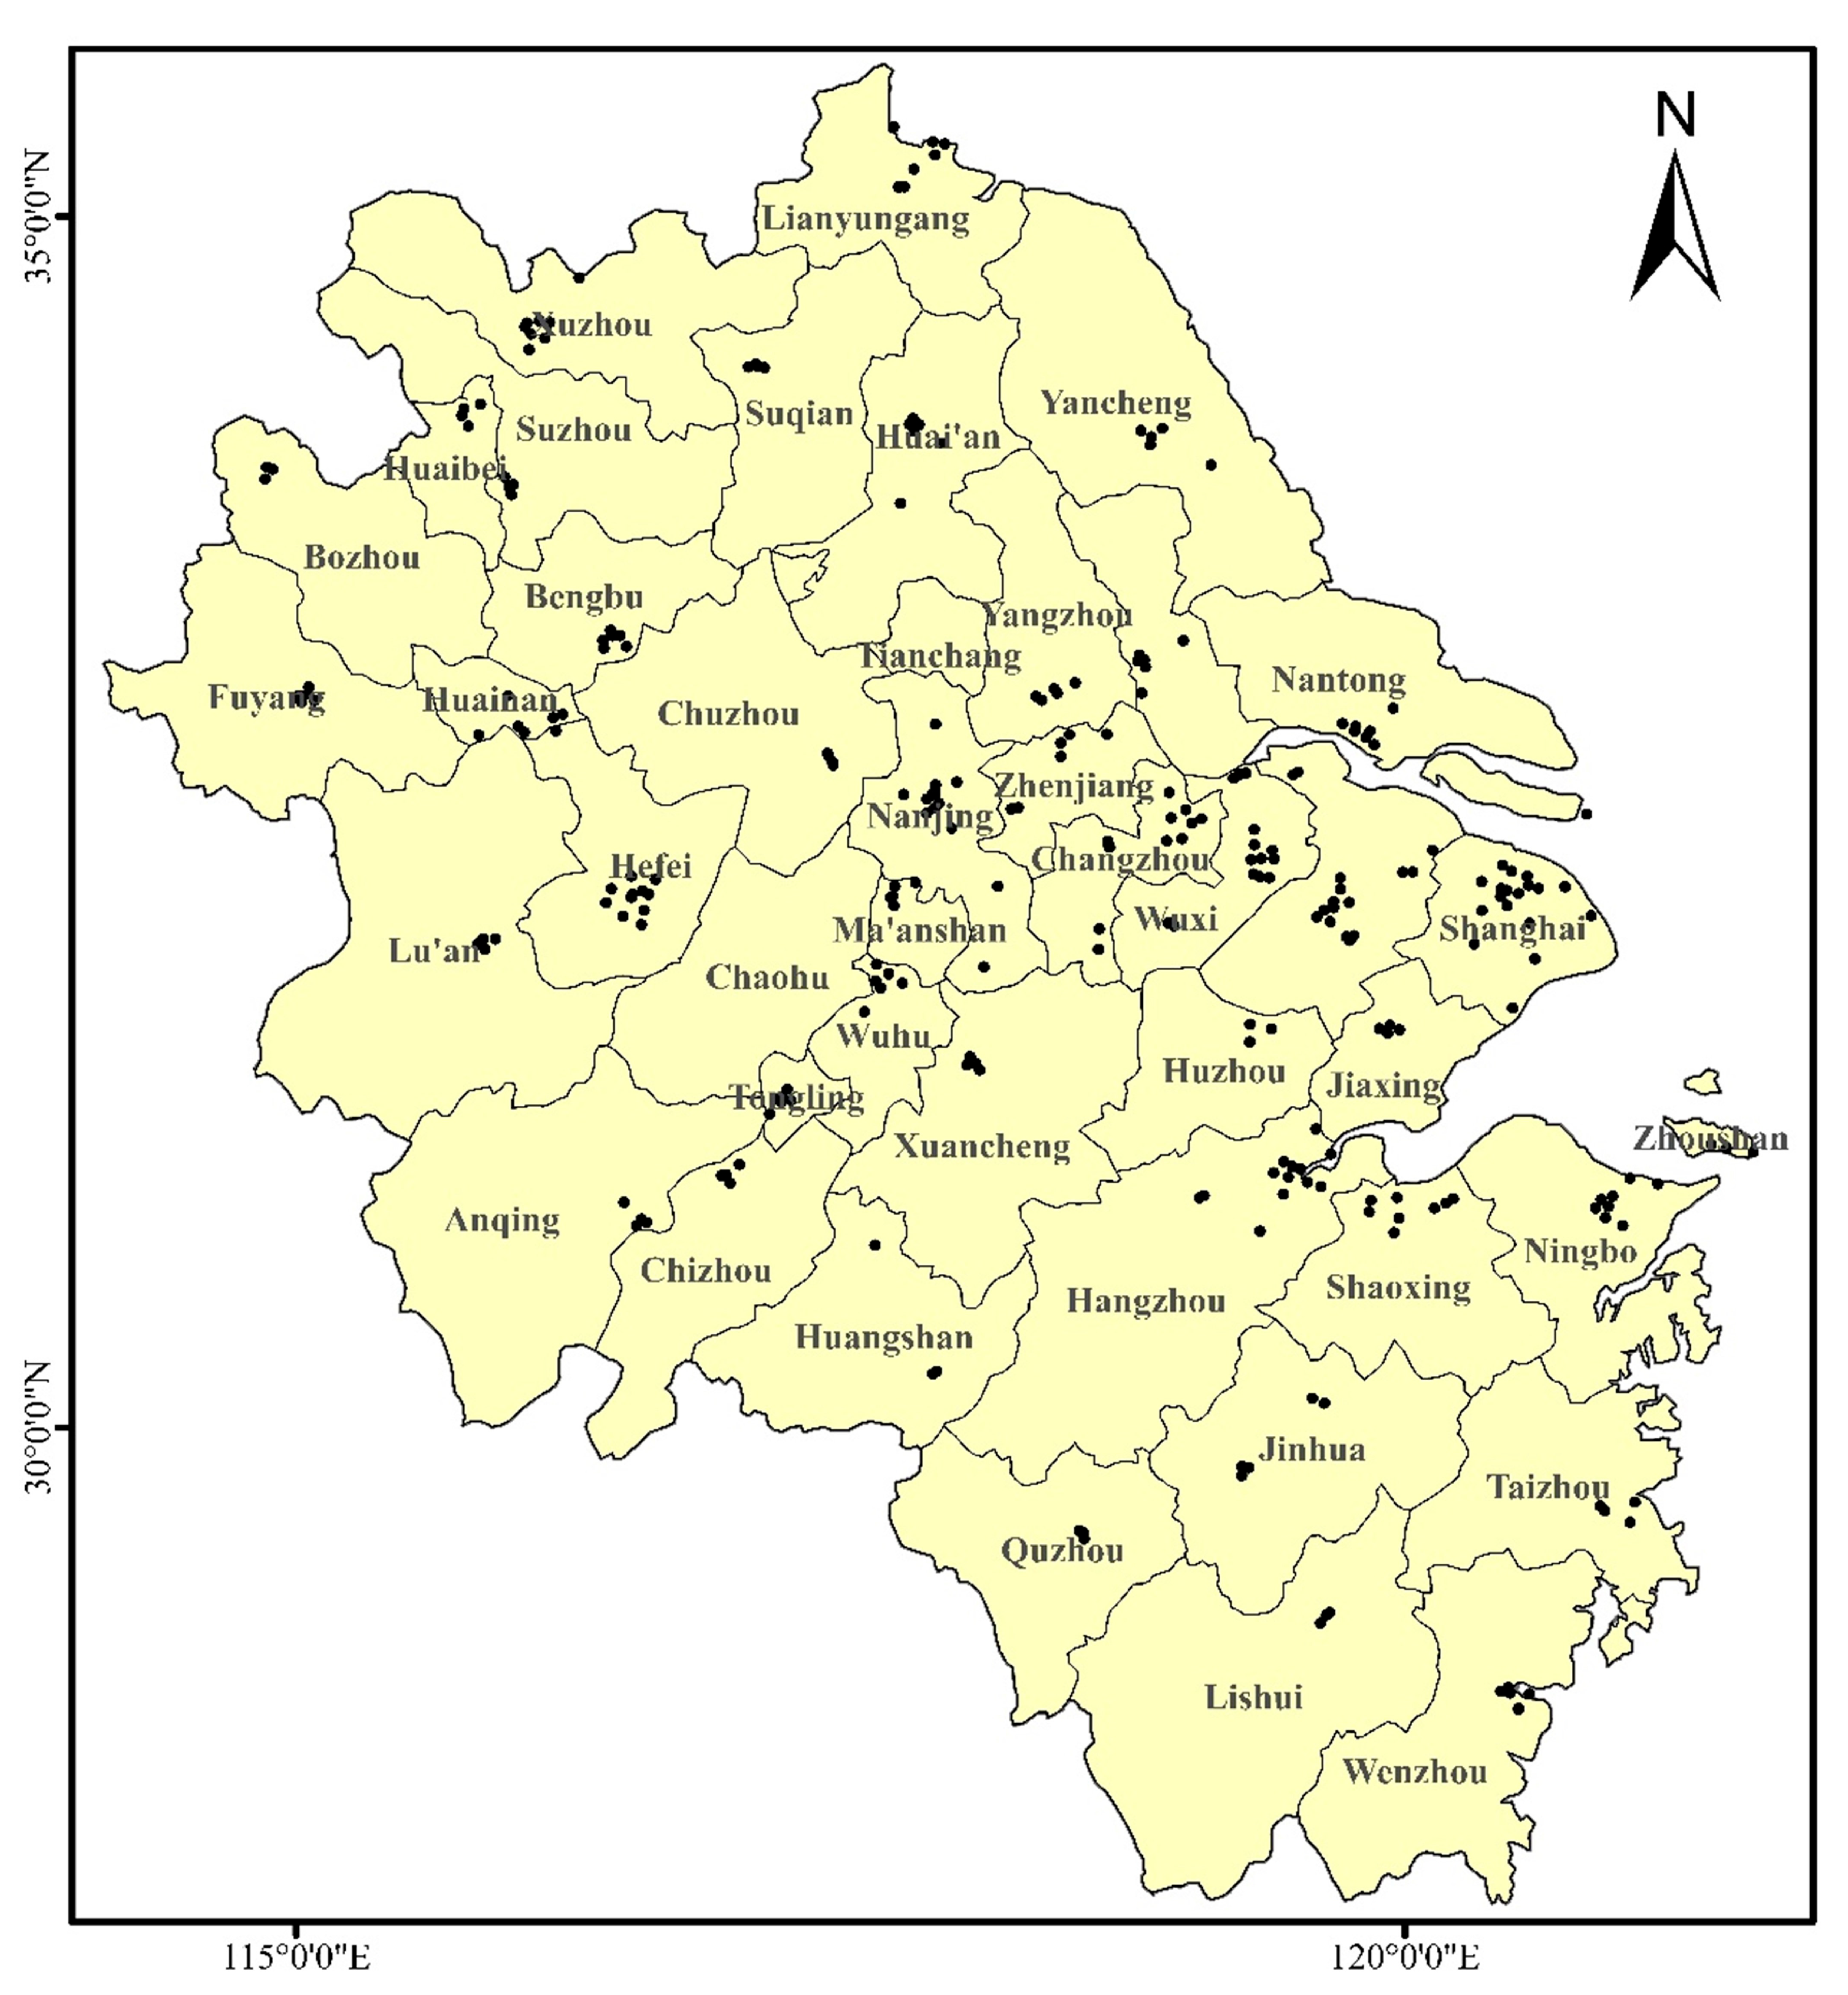
Figure 1. Geographic placement of air quality monitoring stations in cities across the Yangtze River Delta.
Atmosphere 16 00995 g001
Figure 2. Spatiotemporal distribution of AVGDMA8 O3 concentrations across the YRD in 2015 and 2019.
Atmosphere 16 00995 g002
Figure 3. Spatiotemporal distribution of 4DMA8 O3 concentrations across the YRD in 2015 and 2019.
Atmosphere 16 00995 g003
Figure 4. Trend in DMA8 O3 concentrations across the YRD.
Atmosphere 16 00995 g004
Figure 5. Spatial distribution of the five-year mean mortality attributable to long-term O3 exposure in the YRD.
Atmosphere 16 00995 g005
Figure 6. Spatial distribution of the five-year mean mortality attributable to short-term O3 exposure in the YRD.
Atmosphere 16 00995 g006
Table 1. The cause-specific RR for long-term and short-term exposure.
Exposure DurationCause-Specific MortalityRelative Risk
Long-term mortalityAll-cause mortality1.02 (1.01–1.04)
cardiovascular1.03 (1.01–1.06)
respiratory1.04 (1.00–1.09)
Short-term mortalityAll-cause mortality1.0024 (1.0013–1.0035)
cardiovascular1.0027 (1.0010–1.0044)
respiratory1.0046 (1.0023–1.0070)
Disclaimer/Publisher’s Note: The statements, opinions and data contained in all publications are solely those of the individual author(s) and contributor(s) and not of MDPI and/or the editor(s). MDPI and/or the editor(s) disclaim responsibility for any injury to people or property resulting from any ideas, methods, instructions or products referred to in the content.