Article

Application of Low-Cost Air Quality Monitoring System in Educational Facilities in Belgrade, Serbia

by
Uzahir Ramadani
1,*,
Slobodan Radojević
2,
Ivan M. Lazović
1,*,
Dušan S. Radivojević
1,
Jelena Obradović
3,
Marija Živković
1 and
Viša Tasić
4
1
Vinca Institute of Nuclear Sciences, University of Belgrade, Mike Petrovića Alasa 12-14, Vinča, 11351 Belgrade, Serbia
2
Faculty of Mechanical Engineering, University of Belgrade, Kraljice Marije 16, 11000 Belgrade, Serbia
3
Faculty of Technology and Metallurgy, University of Belgrade, Karnegijeva 4, 11000 Belgrade, Serbia
4
Mining and Metallurgy Institute Bor, Alberta Ajnštajna 1, 19210 Bor, Serbia
*
Authors to whom correspondence should be addressed.
Atmosphere 2025, 16(9), 1103; https://doi.org/10.3390/atmos16091103
Submission received: 8 August 2025 / Revised: 15 September 2025 / Accepted: 16 September 2025 / Published: 19 September 2025
(This article belongs to the Section Air Quality)

Abstract

Indoor and outdoor air quality in school environments varies significantly with respect to particulate matter (PM) concentrations, carbon dioxide (CO2) levels, and microclimatic conditions, all of which have a direct impact on the health, well-being, and performance of both students and staff. This study reports the findings of a monitoring campaign focused on PM10 and PM2.5 concentrations in two schools located in the urban area of Belgrade, Serbia. Measurements were carried out using low-cost sensor devices positioned in classrooms and in the surrounding outdoor environment. The PM concentration data were corrected through collocation with reference-grade automatic analyzers (Grimm EDM 180) from the National Air Quality Monitoring Network (NAQMN). During the winter season, the indoor-to-outdoor (I/O) concentration ratio for classrooms ranged between 0.7 and 0.8, indicating that indoor PM levels were generally lower than outdoor levels—likely a result of limited ventilation and reduced particle infiltration from outdoor sources. Conversely, in the summer season, the average I/O ratio typically exceeded 1.0 (ranging from 1.3 to 1.5), pointing to a more pronounced influence of indoor sources, such as occupant activities, resuspension of settled dust, and insufficient air exchange. Importantly, in over 60% of the measurements conducted during the summer period, indoor PM concentrations surpassed those outdoors, underscoring the critical need to address indoor emission sources and implement effective ventilation strategies, particularly during warmer months.

1. Introduction

Particulate matter (PM), one of the major ambient air pollutants, consists of a complex mixture of solid and liquid particles suspended in the air, varying in size, shape, origin, and composition [1]. The International Agency for Research on Cancer (IARC) classified PM as a Group 1 carcinogen, meaning it is carcinogenic to humans [2].
Recent global assessments highlight the severe health burden of PM exposure. For example, ambient PM2.5 has been associated with as many as 7 million all-cause deaths worldwide in 2012, and is a major risk factor for cardiovascular disease, respiratory infections, asthma, and premature mortality [3]. A spatial mortality analysis in high-density Hong Kong districts further established a direct link between traffic-related PM emissions and district-level mortality rates [4].
In school settings, adverse health effects can also be linked to PM exposure. A study conducted in primary schools identified associations between elevated levels of indoor PM2.5, PM10, formaldehyde, and worsened respiratory symptoms in children, including wheezing and increased asthma risk [5]. These findings emphasize the particular vulnerability of children in educational settings, where prolonged exposure during critical developmental periods may compound health risks.
A considerable body of epidemiological research has evaluated the association between exposure to air pollution in school environments and children’s health outcomes. In recent years, systematic reviews have addressed diverse aspects of school-based air pollution: pollutant types, sources, and health impacts [6,7]. High PM concentrations have been consistently observed in school environments, particularly near busy roads and industrial sites [8,9,10]. Studies often report higher indoor PM levels compared to outdoor ones [8,9,10,11,12].
In the Republic of Serbia, research on indoor air pollution in schools and its effects on children’s health remains limited. Unlike the mandatory national programs for monitoring outdoor air quality, indoor environments are not comprehensively regulated by legislation, except in occupational environments. This gap reflects a broader global trend, where regulatory frameworks still predominantly address ambient air quality, although the interest in the indoor exposures has grown substantially in recent years [13].
National air quality monitoring in Serbia is coordinated by the Serbian Environmental Protection Agency (SEPA), which operates a network of reference-grade stations across major cities [14]. The Institute of Public Health of Belgrade also maintains several urban stations, providing complementary datasets on outdoor pollution. While these systems ensure reliable long-term data, their spatial coverage is limited, particularly near schools and educational facilities. Recent strategies [15] acknowledge the need for broader monitoring, yet low-cost sensor networks remain excluded from official programs. Current deployments have mostly been research-driven or pilot initiatives, such as the UNICEF-supported project “Schools for Better Air Quality” [16]. These experiences, along with recent scientific studies, demonstrate the feasibility of school-based low-cost sensor networks and their potential to complement reference infrastructure by delivering high-resolution exposure data relevant for protecting children’s health [17]. Indoor air monitoring is primarily conducted through national and international research initiatives. Several studies have reported concentrations of respirable particulate matter in school environments [18,19,20,21,22,23].
Within the SEARCH project (2007–2009) [13], which aimed to assess the relationship between school environments and children’s respiratory health, as well as to develop recommendations for improving indoor air quality, measurements were conducted in ten primary schools in Belgrade, encompassing a total of 44 classrooms. Parameters measured included indoor and outdoor temperature, relative humidity, carbon monoxide (CO), carbon dioxide (CO2), nitrogen dioxide (NO2), benzene, toluene, xylene, formaldehyde, and PM10. The average PM10 concentration in classrooms was 81 µg/m3—comparable to those reported in Italy and Slovakia [19]. All classrooms relied on natural ventilation, had high student occupancy, and were not equipped with air purification systems, thus representing realistic conditions of exposure. CO2 levels served as reliable indicators of occupancy and of ventilation quality, with high concentrations correlating with poor ventilation and increased prevalence of respiratory symptoms. Consequently, the relationship between CO2 and respiratory health should be interpreted as indirect rather than causal.
Similar studies conducted in Niš in 2010 and 2013—in a faculty building and a primary school—showed that indoor PM10 concentrations were equal to or even higher than outdoor levels [21]. A comparative study carried out during both the heating and non-heating seasons in two naturally ventilated schools—one located in an urban area and the other in a rural setting—revealed that CO2 levels in classrooms regularly exceeded 1000 ppm during teaching hours. PM2.5 concentrations frequently surpassed 25 µg/m3 during the heating season, with a strong correlation between PM and CO2 levels, underscoring the significant impact of occupancy and ventilation on indoor air quality [22].
Another study [24], conducted in a Belgrade kindergarten between March and May 2010, analyzed the composition of indoor and outdoor PM2.5, focusing on polycyclic aromatic hydrocarbons (PAHs), metals, and ionic species. The daily indoor PM2.5 concentrations ranged from 16.54 to 63.24 µg/m3, while outdoor concentrations ranged from 14.63 to 97.60 µg/m3, frequently exceeding WHO-recommended limits.
More recently, in 2021–2022, continuous year-long monitoring using low-cost sensors was performed in the cities of Bor and Niš [25], along with targeted measurements conducted in a technical high school in Bor during the heating season [26]. These studies observed elevated concentrations of PM10 and PM2.5 during teaching activities, which exceeded regulatory values on numerous days.
The influence of changes in smelting technology in the copper smelter in Bor, and seasonal changes on the level and chemical composition of PM10 particles in a classroom at the Technical Faculty in Bor (Serbia) was analyzed by Radovic et al. [27]. This study demonstrates that, despite changes in smelting technology, arsenic concentrations in PM10 within a classroom remained elevated and close to outdoor levels, with indoor values nearly double the annual target. These findings emphasize the urgent need for enhanced emission control measures and improved building ventilation to prevent outdoor particle infiltration.
Collectively, findings from all studies indicate that students in Serbian schools are regularly exposed to elevated levels of particulate matter, particularly during the heating season and school hours. The key contributing factors include inadequate ventilation, particle resuspension due to movement, indoor sources such as furniture and heating appliances, and infiltration of polluted outdoor air. These results emphasize the need for systematic indoor air quality monitoring in schools and the implementation of preventive measures aimed at improving indoor microclimatic conditions.
In recent years, low-cost sensors have gained increasing importance in air-pollution monitoring due to their affordability and real-time data capabilities [28,29].
Recent advancements in affordable PM sensing technologies and monitoring networks have significantly improved the ability to observe PM concentrations in real time with high temporal granularity. Despite this progress, concerns remain regarding the reliability of such data, particularly in terms of agreement with standard reference-grade instruments. This issue is particularly important when low-cost monitors are used to support studies focused on health impacts, where data validity is critical. In general, the long-term performance and stability of most budget-friendly PM sensors are still not thoroughly characterized, with only a few commonly used models having been extensively evaluated [30].
Most of these sensors function according to the Mie scattering principle [31], employing semiconductor lasers as light sources. In these systems, the scattered light is directed—both directly and via mirrors—toward a photo detector within a measurement chamber [32]. Technical specifications for several widely used low-cost sensors are compiled and discussed in [32,33], with additional commentary on their operational principles also available in the latter.
While traditional air quality monitoring stations offer high precision, they are expensive and limited in number, often located far from schools. In contrast, low-cost sensors, although less accurate, make it possible to measure air quality precisely where it matters most. Their low price enables broad deployment, even in schools with limited budgets, supporting the development of sensor networks that reflect actual environmental conditions experienced by children. Furthermore, integrating sensors into school settings offers educational value: students can actively participate in data collection, analysis, and interpretation, gaining scientific and technical skills while fostering environmental awareness.
However, for data from low-cost sensors to be reliable and actionable, proper calibration is essential. Due to their inherent measurement variability, these devices must be regularly compared with reference-grade instruments and recalibrated accordingly [34]. Calibration ensures consistency, improves interpretability, and supports data-driven decision-making. Without proper calibration, measurements may be inaccurate or misleading, undermining trust in the system. Therefore, regular maintenance and quality control are crucial for their effective use. Implementing low-cost sensors in schools is not merely a technical intervention—it is a meaningful societal initiative toward building healthier, better-informed, and more responsible communities. Through such applications, schools transition from being solely learning institutions to becoming protectors of health and active drivers of change.
The justification for conducting this research in schools lies in the fact that educational institutions are often overlooked in urban air quality monitoring strategies, despite accommodating vulnerable populations in high-occupancy indoor spaces. Given the previous studies that have reported frequent exceedances of PM10 and PM2.5 reference values, in-school monitoring represents a scientifically grounded and socially relevant approach to identifying and addressing exposure to airborne micro-pollutants.
Systematic long-term studies of indoor and outdoor PM concentrations in schools are still scarce, with most previous investigations being short-term or limited in scope. In addition, very few studies have simultaneously monitored multiple micro-environments within a single school (e.g., classrooms, hallways, and outdoor reference sites), which is crucial for disentangling the roles of ventilation, occupancy, and outdoor infiltration. Furthermore, although the advantages and limitations of low-cost sensors (LCS) have been widely recognized, their performance in educational settings under real-world conditions has not yet been comprehensively validated against reference-grade instruments. Previous studies also reported that even when low-cost sensors were carefully calibrated against reference instruments prior to deployment, residual uncertainties remained due to their sensitivity to meteorological factors, particularly temperature and relative humidity.
To overcome these shortcomings, the present study conducted a multi-site (two classrooms, a hallway, and an outdoor station) and multi-season (winter and summer) monitoring campaign in a secondary school in Belgrade, Republic of Serbia. By combining measurements from low-cost PM sensors with reference instruments, the study provides novel insights into the seasonal variability of indoor/outdoor ratios, the impact of occupant activity and ventilation on PM levels, and the applicability of LCS for continuous school-based monitoring. Unlike previous investigations, this study explicitly addressed the influence of high relative humidity on measurement accuracy by integrating a humidity-filtering procedure during device calibration, thereby reducing uncertainty and improving data reliability. The system captures fine-scale spatial heterogeneity that national monitoring networks cannot resolve. This design highlights point-source differences within the same school building and enables the disentangling of indoor sources, outdoor infiltration, and human activity patterns. The specific aim of the study is to demonstrate the application of a real-time monitoring system for PM in a school environment. The system integrates low-cost sensors with a correction procedure based on co-location with reference instruments from the National Air Quality Monitoring Network, enabling real-time adjustment of measurement data. As an additional improvement over previous studies, this system eliminates humidity as a major source of error during sensor calibration, ensuring greater precision and enhancing the usability of the results for future research and air quality management.
In the context of schools, real-time monitoring is particularly valuable because children spend up to 6–8 h daily in classrooms and are more vulnerable to air-pollution exposure. Unlike periodic or short-term campaigns, real-time systems provide immediate feedback on pollution episodes, allowing school staff to take rapid actions such as opening windows, adjusting ventilation, or rescheduling activities. This feature makes the system not only a scientific tool but also a practical intervention supporting daily health protection of students.
2. Materials and Methods

The objective of this study was to assess the concentrations of suspended particulate matter (PM10 and PM2.5) in a school environment, with a particular focus on seasonal differences between indoor and outdoor levels. The research was conducted in two separate campaigns: (a) Winter period: from 19 February to 3 March 2024; (b) Summer period: from 13 May to 26 May 2024. In both measuring cycles, measurements lasted 14 days each, which made it possible to include typical daily and weekly variations due to different teaching and climatic conditions.

2.1. Sampling Location

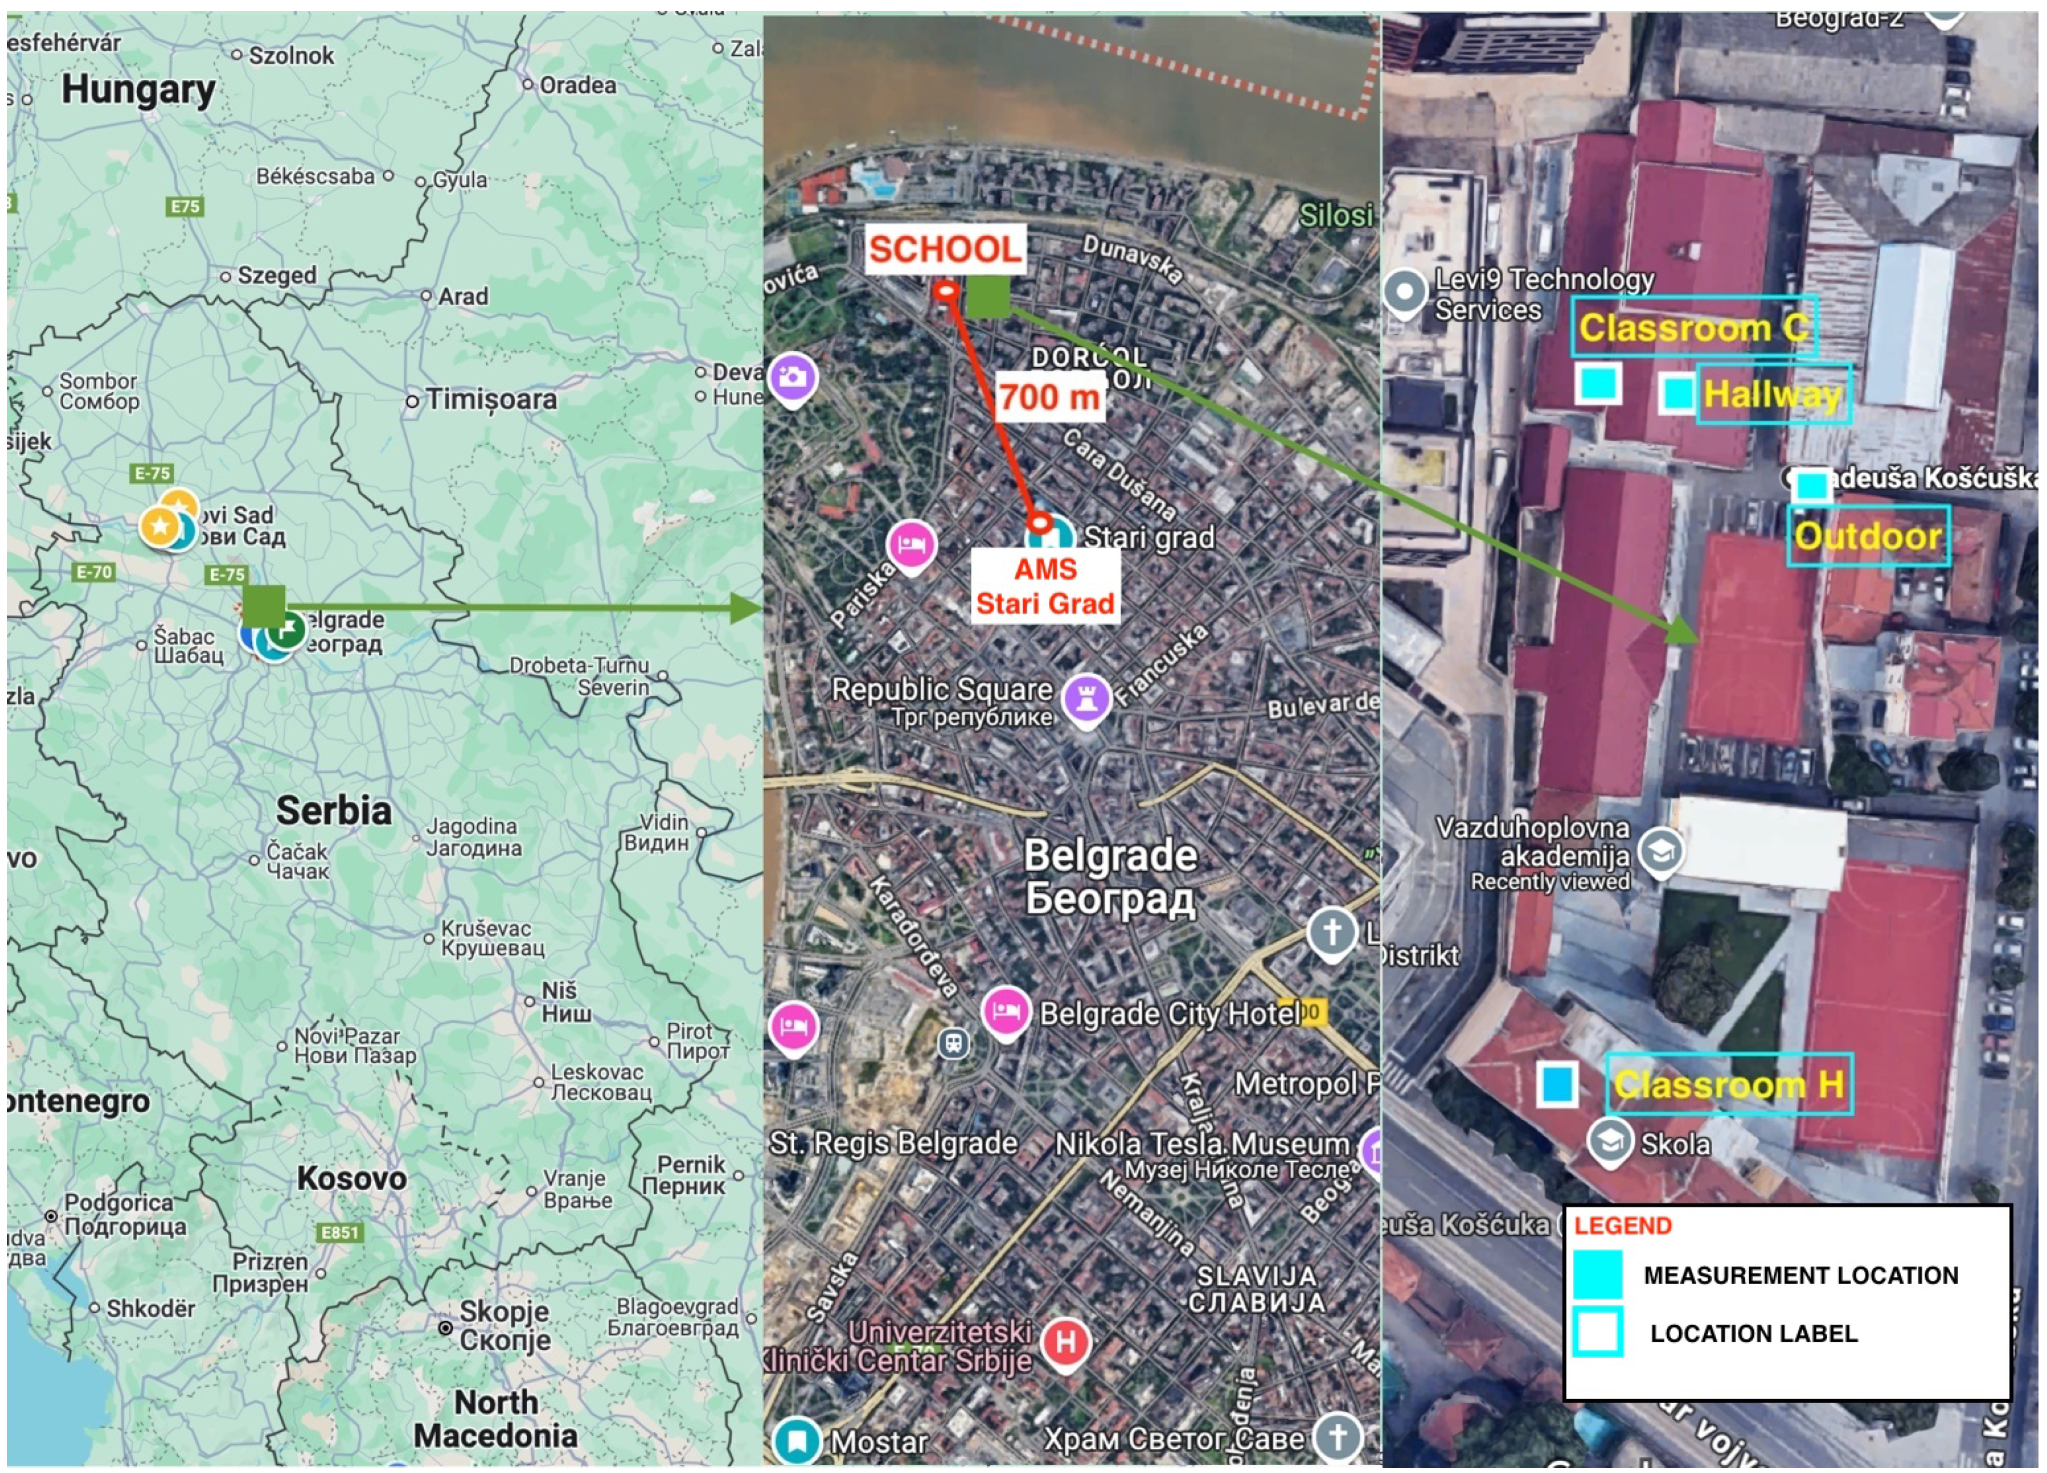
The sampling site, Aviation Academy College (SCHOOL), shown in Figure 1, is in Dorćol—one of the oldest and most densely populated neighborhoods in Belgrade, the capital of the Republic of Serbia. Dorćol lies in the urban core of the city, near the confluence of the Sava and the Danube rivers. Characterized by a mix of residential, commercial, and high-traffic zones, this area is frequently exposed to elevated levels of air pollution, particularly during the winter heating season. Owing to its urban density, limited green space, and frequent temperature inversions, Dorćol provides a relevant setting for examining interactions between indoor and outdoor air quality in educational environments.
In Building 1, which houses students at the Aviation Academy College, measurements were conducted in both a classroom (C) and a hallway, as shown in Figure 1. This is a single-story building, and all indoor measurements refer to ground-floor spaces. Classes are conducted using an interactive whiteboard and markers, which is relevant, as this teaching method generates minimal amounts of airborne particulate matter. The floors are covered with parquet, and the windows are fitted with modern PVC frames, providing good sealing and reducing the infiltration of outdoor air.
In Building 2, attended by secondary school students in two shifts, measurements were taken in a classroom (H) located on the second floor. Unlike Building 1, traditional chalkboards are used here, which can lead to the release of fine chalk dust and contribute to elevated indoor particulate concentrations. This building also features parquet flooring and modern PVC windows, indicating similarly good airtightness.
The classrooms where measurements were carried out have a floor area of approximately 100 m2, but differ in ceiling height, which significantly affects the total room volume and the dilution potential of airborne particles. The ground-floor classroom (C) in Building 1 has a lower ceiling (3.0–3.5 m), corresponding to a volume of 300–350 m3. In contrast, the classroom (H) in Building 2 has a high ceiling (4.0–4.5 m), yielding an estimated volume of 400–450 m3.
Both classrooms (C and H) lack mechanical ventilation and rely on manual window opening at predefined intervals for air exchange. In Building 1, ventilation is conducted only in the morning, between 06:30–08:00. In Building 2, ventilation takes place in the morning between 06:30–08:00 and again between class shifts from 14:05–14:15. Evening cleaning in both buildings is carried out after the school day ends, between 20:20–20:30.

2.2. Sampling Equipment

During the measurement campaigns, monitoring devices were placed at four strategic locations inside and near school buildings, as shown in Figure 1. Two devices were placed inside classrooms (C and H), in different buildings, at a height of approximately 1.2–1.5 m, which corresponds to the respiratory zone of students. The devices were away from direct sources of pollution, such as windows, doors, and heating elements. The outdoor unit was mounted on the wall of the school building, positioned in the central part of the school complex to ensure representative exposure conditions. The fourth device was placed in the hallway and enables the monitoring of pollutant concentrations in the mixed zone between the classroom and the outside space. These locations were selected to enable a detailed comparative analysis of differences in air quality between outdoor and indoor spaces, as well as between different indoor micro-environments.
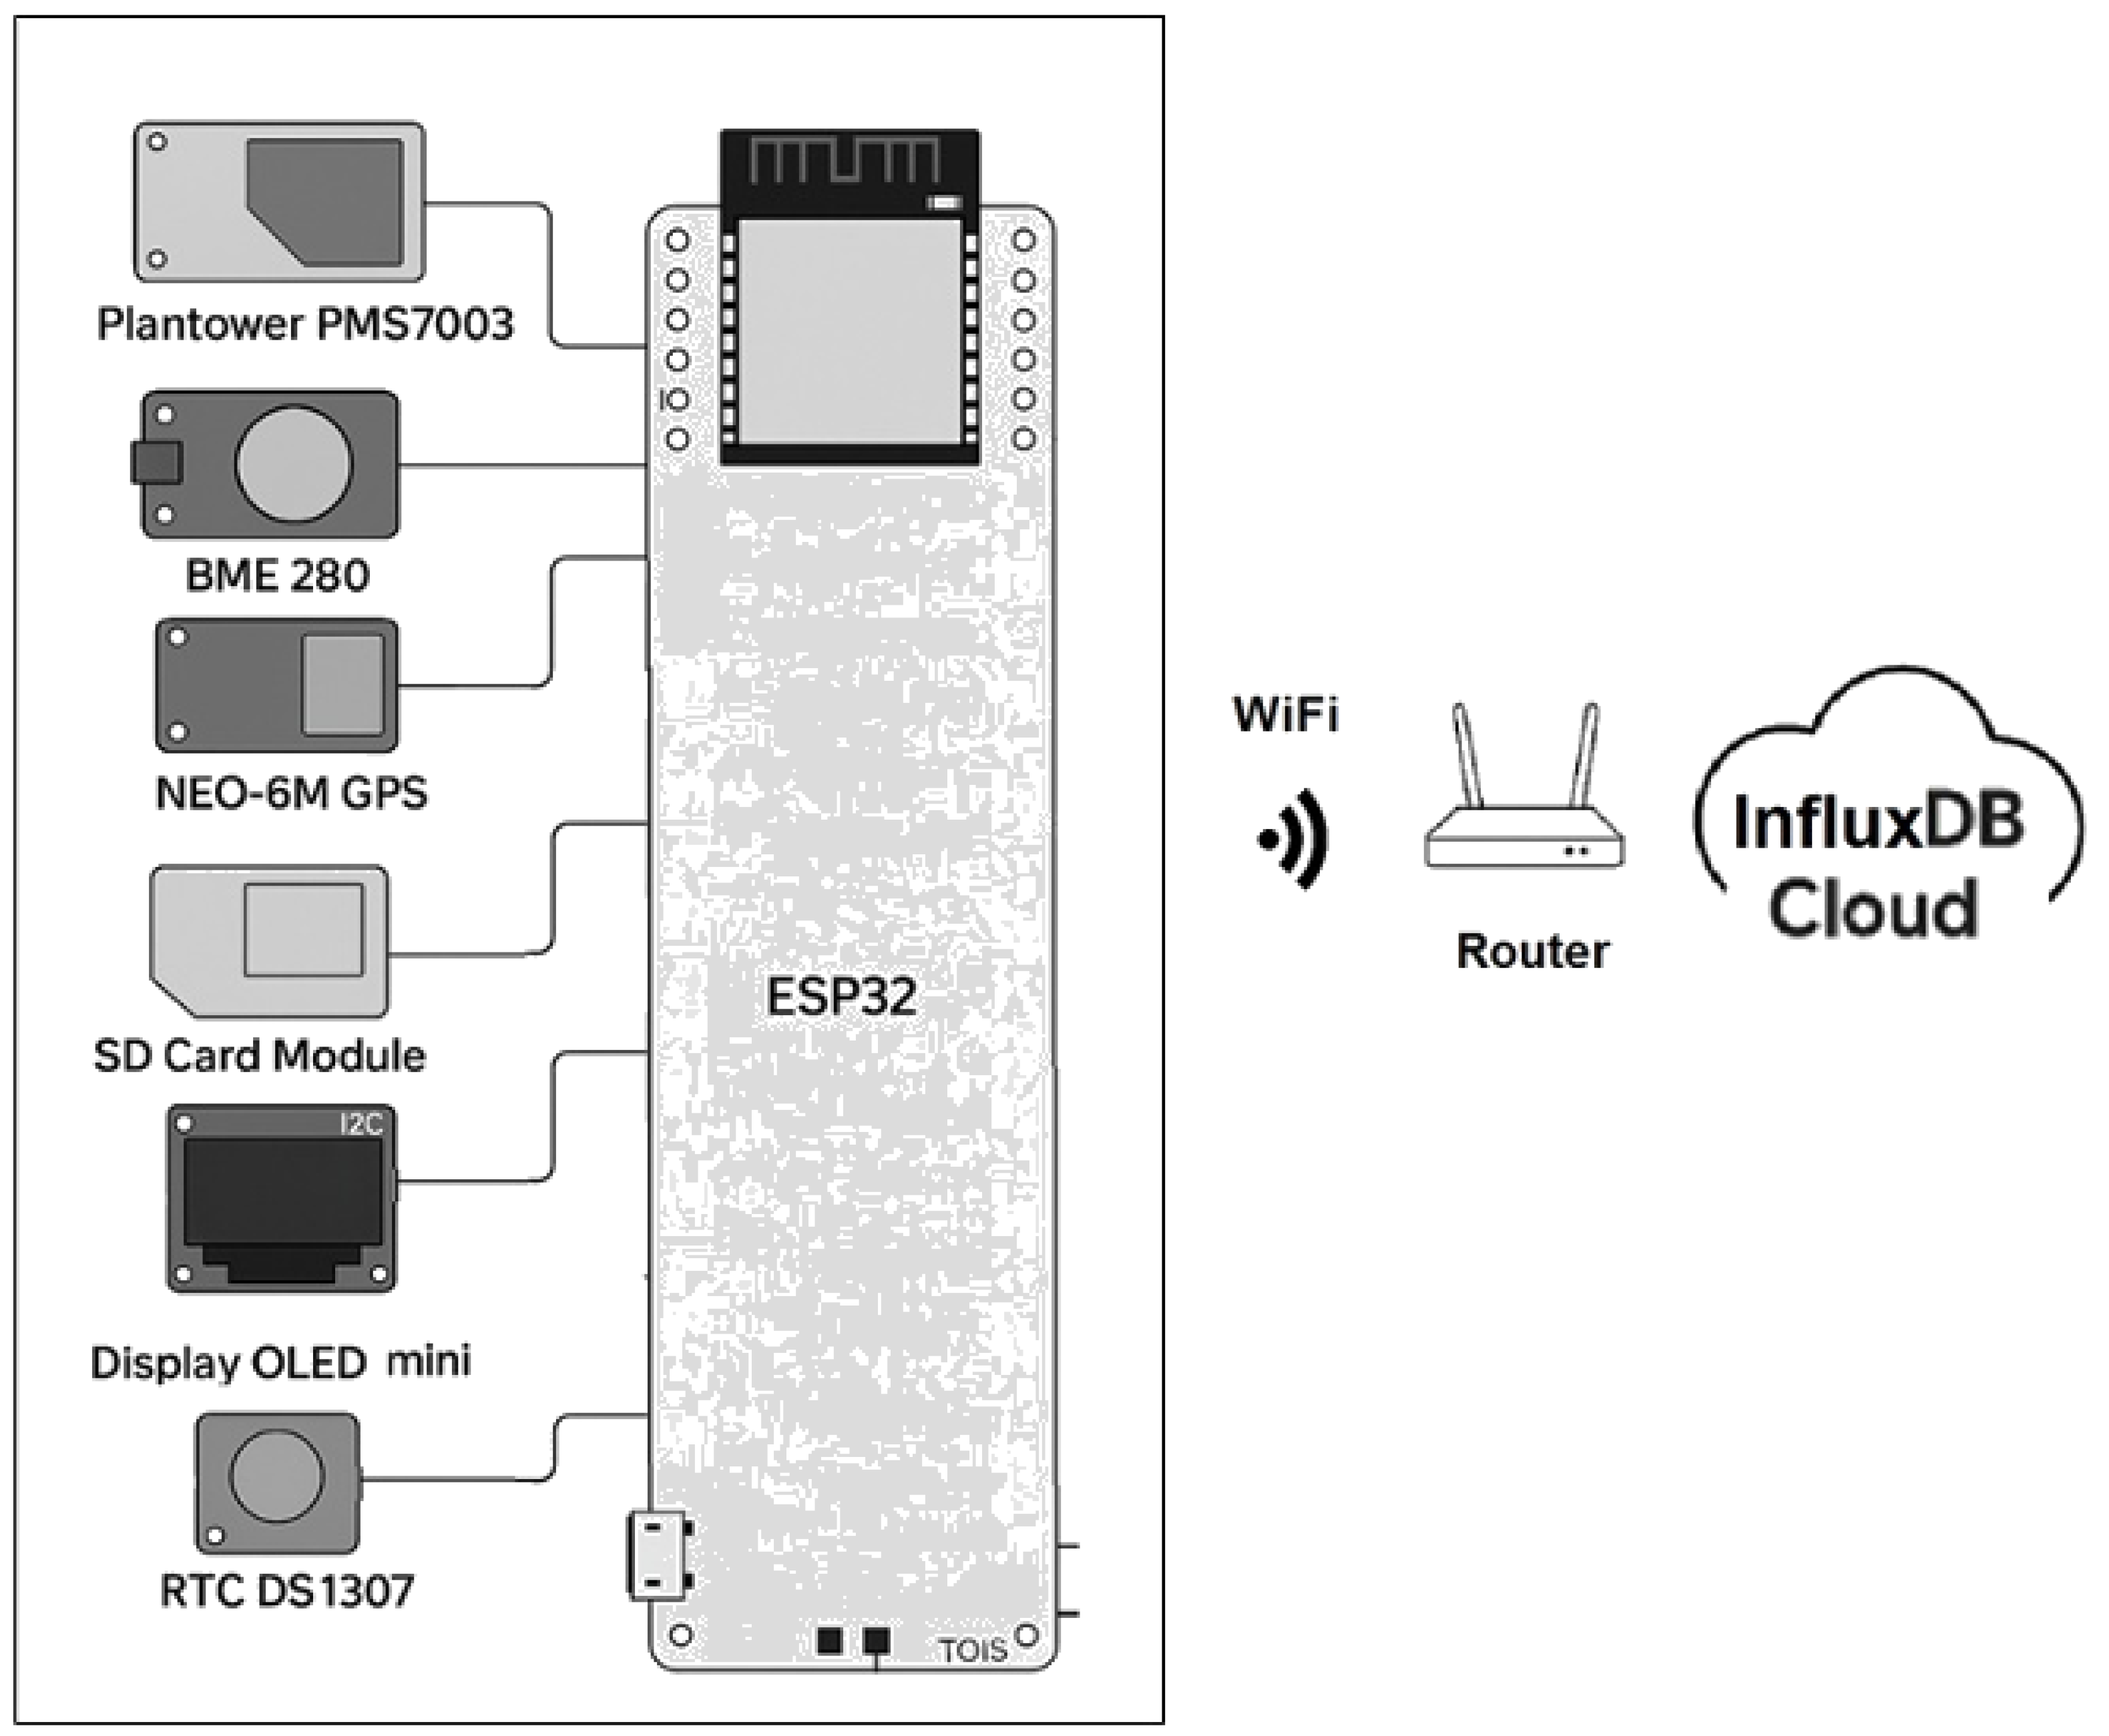
The AirClair is an affordable and portable device designed for continuous monitoring of air quality parameters, including particulate matter (PM), temperature, relative humidity, and atmospheric pressure (Figure 2). The hardware architecture of the device, consisting of an ESP32 (a low-power system-on-chip microcontroller with integrated Wi-Fi capabilities) [35], the Plantower PMS7003 air quality sensor [36], the Bosch BME280 sensor for temperature, humidity, and pressure [37], the RTC DS1307 real-time clock [38], the NEO-6M GPS module [39], and a mini OLED display [40], is presented in Figure 3.
The AirClair device was developed at the Vinča Institute of Nuclear Sciences, National Institute of the Republic of Serbia (University of Belgrade, Serbia). Its PM module (Plantower PMS7003, Plantower, Nanchang, China) operates on the principle of light scattering (Mie theory), which detects particulate matter by measuring the intensity of light scattered by individual particles passing through a laser beam [36]. Each device operated continuously, performing measurements every 10 s. These raw measurements were internally averaged into one-minute values. The device transmits data to an InfluxDB database [41] via a local router with Internet access. Hourly average values of the measured parameters were stored in the database. InfluxDB’s querying and visualization capabilities were subsequently employed for data presentation and interpretation, facilitating the generation of time-series plots and statistical summaries. This approach enabled a more efficient analysis of temporal patterns and supported comparisons across different monitoring locations and measurement campaigns.
This set-up enabled the evaluation of differences between multiple micro-environments (classrooms, hallway, and outdoor air) under real-world school conditions, while maintaining low operational costs and high spatial coverage.

Correction Factor Calculation

In recent years, low-cost PM sensors have been increasingly deployed for air quality monitoring due to their affordability and potential for high spatial resolution. However, their accuracy remains limited without proper calibration. A widely accepted approach involves collocation with reference-grade analyzers at official air quality monitoring stations from national networks.
Studies such as Li & Biswas [42] and other recent works [43,44] demonstrate that collocating low-cost sensors at national reference stations enables the derivation of correction factors or regression models that significantly improve data reliability. Furthermore, calibration models often need to be environment and season-specific due to varying influences of temperature, humidity, and local pollution sources. Incorporating meteorological parameters, especially wind speed and direction, from co-located weather stations has also been shown to enhance calibration accuracy, as noted in [30,32].
It is important to note that optical low-cost sensors are not only affected by relative humidity and temperature, but also by hygroscopic growth of particles and their shape-related scattering properties. Under elevated humidity conditions, hygroscopic aerosols increase in size and alter their optical response, leading to systematic overestimation of PM2.5. Previous studies have demonstrated that accounting for these factors through meteorology-adjusted algorithms or empirical correction models substantially improves data reliability and comparability with reference methods [45,46,47]. In our analysis, these considerations were integrated into the correction framework, ensuring that meteorological influences and particle growth effects were explicitly addressed in the evaluation of sensor performance.
Beyond laboratory or reference-station calibrations, in situ fine-tuning is essential, because ambient conditions—temperature, relative humidity, and other micro-environmental factors—often cause sizeable drifts in sensor output. Field (in situ) calibration, therefore, adjusts the model directly within the target micro-environment, correcting for local perturbations and improving data reliability [48].
Spatial and temporal dynamics of air-pollution episodes must also be considered, since PM, ozone, and other pollutants vary sharply across space and time. Deep learning models with spatio-temporal structure—such as convolutional LSTM networks—have shown high skill in forecasting pollutant time-series from satellite and meteorological inputs [49]. These models enable proactive, real-time correction of low-cost sensor data, complementing deterministic calibration frameworks and the empirical in situ adjustments outlined above [48].
Ultimately, integrating data from national monitoring infrastructure plays a key role in harmonizing sensor networks and enabling their use in health-relevant exposure assessments and regulatory support.
In this study, the correction of PM measurement results from low-cost sensors was performed by comparing them with measurements obtained from a reference instrument at the nearest Automatic Monitoring Station (AMS) within the National Air Quality Monitoring Network (NAQMN). The selected station was AMS Stari Grad (shown in Figure 1), located approximately 700 m from the sampling site. The collocation period lasted one week prior to each measurement campaign (from 12 to 18 February 2024, and from 5 May to 11 May 2024).
The PM values recorded by the AirClair devices were corrected using a factor F, calculated according to Equation (1):
F = 1 n i = 1 n G i S i
where F is the correction factor, n is the number of days, G i is the 24-h mean PM concentration on the i-th day obtained from the Grimm EDM180 (Grimm Aerosol Technik GmbH & Co. KG, Ainring, Germany) reference-equivalent PM analyzer, and S i is the corresponding 24-h mean PM concentration from the AirClair device on the same day. Each 1-h PM value measured by the AirClair devices was multiplied by this correction factor.
Measurement results obtained under conditions where relative humidity (RH) exceeded 75% were excluded from the dataset to determine the correction factor. This approach reduced the influence of meteorological factors and local emission sources on the correction factor value. The calculated correction factors (F) for PM10 and PM2.5 during the summer and winter measurement campaigns are presented in Table 1. The correction factor values shown in Table 1 represent the average values across all PM sensors used in the experiment. Sensor-to-sensor variation remained within ± 0.1 of the reported values. The uncertainty estimate of the correction factors was within the same range (±0.1), confirming both the consistency among sensors and the reliability of the obtained values.

2.3. Data Processing and Analysis

Descriptive statistics were calculated for each monitoring location and period, including mean concentrations, maximum values, standard deviations, and indoor/outdoor (I/O) concentration ratios were computed. To assess the calibration accuracy of low-cost sensors, error metrics such as root mean square error (RMSE), mean absolute error (MAE), mean absolute percentage error (MAPE), and the coefficient of determination ( R 2 ) were calculated.
By comparing data from winter and summer periods, the study assessed the influence of heating, outdoor weather conditions, and classroom activities on particulate matter levels. This approach enabled a comprehensive evaluation of seasonal exposure patterns and real-life conditions in school environments. Data were processed using Python (Python Software Foundation, Wilmington, DE, USA), employing standard statistical and data analysis libraries [50].

Quality Assurance and Quality Control (QA/QC)

The data pipeline included: timestamp validation and synchronization; physical range checks ( P M 2.5 : 0–1000 μ g/m3; P M 10 : 0–1000 μ g/m3; T: 10 50   ° C; R H : 5–95%); exclusion of RH > 75% from the calibration set; co-location checks with the reference; daily anomaly review; and versioning of correction coefficients for auditability.
To ensure the reliability of the low-cost sensor dataset, several QA/QC procedures were implemented. Prior to deployment, all AirClair devices were co-located for 48 h to verify sensor-to-sensor consistency, and units with deviations greater than 10% were excluded from analysis. During field campaigns, daily checks were performed to confirm a stable power supply and continuous data logging. During calibration, the raw data were screened to remove records with relative humidity (RH) above 75%, spurious outliers exceeding three standard deviations from the mean, and gaps longer than 5 min. The resulting dataset was further validated by comparison with the SEPA AMS Stari Grad station. These QA/QC steps minimized bias and ensured comparability between sensors and reference instruments.

2.4. Calibration Criteria and Influence of Relative Humidity (RH)

Relative humidity (RH) is a well-known interferent for optical low-cost sensors because it enhances particle growth and light scattering. Although RH is usually higher in summer than in winter in continental climates (e.g., Belgrade), correction proved more critical in winter. This is due to aerosol composition: winter particles are rich in hygroscopic fractions (sulphates, nitrates, and secondary organics from biomass and coal combustion), which absorb water even at moderate RH. Consequently, the same RH level produces stronger positive biases in LCS response during winter.
To mitigate humidity-induced errors, we excluded calibration records with RH > 75 % . This threshold is widely applied in LCS field studies [32,34] and reflects empirical evidence that the optical response increases sharply above ∼70–80% RH. The effect of RH screening is summarized in Table 2. Before applying the RH filter (NC), low-cost sensors exhibited substantial errors under high relative humidity (RH > 75%), with RMSE values exceeding 10 µg/m3 and MAPE above 25% for PM10 during the winter period. After excluding these records (C), RMSE and MAPE decreased considerably (by 20–40%), while correlations with reference instruments improved (e.g., R 2 for PM2.5 in winter increased from 0.87 to 0.94). The correction factor F approached unity, confirming consistency between sensor and reference measurements. During the summer campaign, the effect was less pronounced due to generally lower humidity levels and PM concentrations, yet improvements after applying the RH filter were still observed (e.g., PM2.5 RMSE decreased from 9.5 to 7.9 µg/m3).

3. Results

3.1. Winter (Heating) Period

3.1.1. PM10 Concentrations

Table 3 presents descriptive statistics of PM10 concentrations measured in the winter period: outdoor environment, hallway, and two classrooms (C and H), across different time periods (WD Day–Weekday (8 a.m.–8 p.m.), WD Night–Weekday night (midnight–8 a.m. and 8 p.m.–midnight), and Weekend (Saturday and Sunday)). The data include mean, median, minimum, and maximum values, standard deviations, and indoor/outdoor (I/O) ratios for both classrooms.
The highest average PM10 concentrations were recorded outdoor, particularly during weekday nighttime hours (mean: 55.7 µg/m3; max: 209.9 µg/m3). Indoor PM10 concentrations were considerably lower. The highest indoor averages were found in Classroom C and Classroom H during weekday daytime (23.0 and 22.4 µg/m3, respectively). Hallway concentrations ranged between outdoor and indoor levels, averaging 22.3 µg/m3 overall.
I/O ratios for PM10 remained below 1.0 in all periods, with the highest value of 0.8 for Classroom C observed during weekday daytime and for Classroom H observed during the weekend, indicating that indoor air quality was primarily influenced by outdoor sources with little to no evidence of significant indoor PM10 generation.
The results of comparable studies on PM10 concentrations conducted in the Republic of Serbia, as well as in a school in Poland during the winter season, are summarized in Table 3. With the exception of reference [26], the majority of studies reported higher measured PM10 concentrations, both in indoor classroom environments and in the surrounding ambient air.
The results presented in Table 4 are primarily drawn from studies published more than a decade ago, which clearly indicates a lack of continuous research on indoor air quality in schools in the Republic of Serbia. The available data demonstrate that PM10 pollution is present during weekday daytime in classrooms, with average concentrations being higher than the daily limit value of 50 µg/m3, underscoring the need for more systematic and widespread monitoring. Utilizing modern measurement technologies to assess PM10 concentrations in a larger number of schools on a continuous basis-ideally with real-time data visualization—would be essential for improving the evidence base and informing effective interventions.
The observed differences between outdoor and indoor PM10 levels during the heating season can be linked to fundamental processes of infiltration, deposition, and resuspension. Lower indoor values and I/O ratios < 1.0 indicate that building envelopes acted as partial barriers, reducing penetration of ambient PM10. Short-term increases during daytime hours coincide with higher occupancy, consistent with particle resuspension due to student movement. The highest outdoor maxima reflect combustion-related sources and stagnant meteorology typical for winter pollution episodes. Compared to similar studies in Serbia and Central Europe, our results show generally lower indoor averages but similar outdoor winter maxima. For example, schools in Niš and Zaječar reported indoor PM10 > 60 µg/m3, while our study recorded 19–23 µg/m3. These differences may be attributed to local heating practices, building characteristics, and ventilation frequency, underlining the role of both spatial and structural factors in exposure levels.

3.1.2. PM2.5 Concentrations

Table 5 presents descriptive statistics of PM2.5 concentrations measured in the winter period. The highest average PM2.5 concentration was observed outdoors, with a mean value of 28.3 µg/m3 and an extreme maximum of 159.0 µg/m3, indicating occasional episodes of severe pollution likely linked to combustion sources during the heating season. Indoor PM2.5 levels were substantially lower in comparison: 16.8 µg/m3 in the hallway, 14.6 µg/m3 in Classroom C, and 15.3 µg/m3 in Classroom H. Standard deviations were also notably smaller indoors, suggesting more stable conditions.
During daytime hours, when classrooms were actively used, PM2.5 concentrations indoors were slightly elevated compared to the nighttime period. The outdoor average was 23.8 µg/m3, while classroom concentrations reached 17.3 µg/m3 in Classroom C and 16.9 µg/m3 in Classroom H. The hallway recorded a slightly higher average of 18.9 µg/m3. These values reflect the impact of increased indoor activity, such as student presence and movement, which likely contributed to the resuspension of particles.
The I/O ratios during this period were 0.8 for both classrooms—the highest recorded during the heating season. Although these values remained below 1.0, they suggest a notable relative contribution from indoor sources or particle accumulation due to limited ventilation during occupied hours.
During nighttime hours, when the school was unoccupied, outdoor PM2.5 levels were significantly higher, averaging 40.2 µg/m3. This increase was likely driven by residential heating and stagnant meteorological conditions. In contrast, indoor concentrations remained lower, averaging 17.0 µg/m3 in Classroom C and 17.8 µg/m3 in Classroom H. The hallway showed a similar pattern, with an average of 18.2 µg/m3.
The I/O ratios during the night were 0.5 (Classroom C) and 0.6 (Classroom H), indicating that indoor particle concentrations were primarily influenced by outdoor infiltration. The relatively stable and low indoor values, despite elevated outdoor pollution, reflect the building’s moderate insulation capacity and the absence of indoor emission sources during these hours.
On weekends, both outdoor and indoor PM2.5 concentrations decreased to their lowest levels. Outdoor concentrations averaged 19.1 µg/m3, while Classroom C and Classroom H recorded 8.2 µg/m3 and 10.3 µg/m3, respectively. The hallway had a mean concentration of 12.6 µg/m3. I/O ratios were 0.6 for Classroom C and 0.8 for Classroom H, further confirming the minimal influence of indoor activity and the lower general pollution levels observed during weekends.
Results from comparable studies on PM2.5 concentrations conducted in the Republic of Serbia, as well as in schools in Poland and Spain during the winter season, are summarized in Table 6. Except for reference [26], most studies reported higher PM2.5 concentrations than those observed in our study, both in indoor classroom environments and in the surrounding ambient air.
The data presented in Table 6 indicate that PM2.5 pollution was present in classrooms during the winter period, with average concentrations in most schools significantly exceeding the prescribed daily limit value of 25 µg/m3. These findings highlight the need for more systematic and extensive monitoring, as well as the implementation of measures aimed at preventing both particle resuspension and the infiltration of outdoor pollutants into the indoor school environment.
The elevated outdoor PM2.5 levels, especially during nighttime, are consistent with fine particles originating from combustion (domestic heating, traffic) and accumulation under stable boundary layer conditions. Indoor values remained lower and more stable, reflecting attenuation of infiltration for finer fractions and absence of direct indoor sources. Slightly higher daytime indoor averages align with increased occupancy and activity, supporting the role of resuspension in classrooms. In comparison with schools in Spain and Poland, our classrooms exhibited notably lower PM2.5 means. For instance, Barcelona classrooms averaged 38 µg/m3, whereas our results were 17 µg/m3. Such differences can be explained by local outdoor background levels, differing heating fuels, and ventilation habits, confirming the importance of regional context in indoor/outdoor exposure ratios.

3.1.3. Exceedances of the Daily Limit Value of PM Concentrations

During the measurement campaign conducted in the winter season, exceedances of the daily limit value for PM10 concentrations (50 µg/m3) in ambient air were recorded on 2 out of 10 working days, while no exceedances were observed in the classrooms or the hallway. In contrast, during the same period, exceedances of the daily limit value for PM2.5 concentrations (25 µg/m3) in ambient air were recorded on six days, with one day of exceedance also observed in each of the two classrooms and in the hallway. When considering only the 12-h interval during which students were present at school, the situation differed somewhat. An exceedance of the PM10 daily limit value was recorded on one day in ambient air, as well as in both classrooms on that same day. Regarding PM2.5 concentrations within the same period, exceedances of the daily limit value were recorded on three working days in ambient air, and on one day in both classrooms and the hallway.

3.2. Summer (No Heating) Period

3.3. PM10 Concentrations

Table 7 presents descriptive statistics of PM10 concentrations measured during the summer period. The highest average PM10 concentrations were recorded in the hallway, particularly during weekday daytime hours (mean: 53.4 µg/m3; max: 126.5 µg/m3), followed by Classroom C (24.4 µg/m3) and Classroom H (20.8 µg/m3). Outdoor concentrations were consistently lower across all periods, with the lowest daytime mean observed on weekdays (16.9 µg/m3).
I/O ratios indicate that Classroom C experienced the highest relative indoor exposure during weekday daytime hours (I/O = 1.5), suggesting the presence of indoor sources or resuspension of particles. Classroom H exhibited more stable ratios, with values generally close to or below 1.0 across most periods.
On weekends, outdoor concentrations increased (mean: 22.8 µg/m3), while indoor levels remained moderate. Notably, Classroom H showed a slightly elevated I/O ratio (1.0) despite the absence of classroom activity, possibly indicating limited ventilation or particle accumulation.
The results of comparable studies on PM10 concentrations conducted in the Republic of Serbia, as well as in schools in Poland and Portugal during the summer season, are summarized in Table 8. Most studies reported higher PM10 concentrations, both in indoor classroom environments and in the surrounding ambient air, compared to the findings of the present study. As shown in the table, an I/O ratio below 1 was observed only in reference [22], specifically in the rural elementary school “Petar Radovanović,” located in the village of Zlot in Eastern Serbia. In all other schools, the average I/O ratio exceeded 1, potentially indicating increased particle resuspension due to student activity, inadequate classroom ventilation, or the presence of additional indoor sources of particulate matter. The elevated hallway concentrations during summer are best explained by resuspension of coarse particles due to higher ventilation rates and greater occupant movement. The fact that outdoor levels remained comparatively low underscores the role of indoor dynamics rather than infiltration as the dominant contributor in this period. Ratios > 1.0 confirm the importance of internal particle generation processes in non-heating months. Relative to comparable studies in Portugal and Poland, the hallway concentrations in our study were lower but followed the same trend of summer indoor dominance. For instance, classrooms in Aveiro recorded indoor means above 50 µg/m3, while ours remained around 20 µg/m3. These contrasts emphasize building design, cleaning practices, and student density as key modulators of indoor particle loads.

3.3.1. PM2.5 Concentrations

Table 9 presents descriptive statistics of PM2.5 concentrations in the summer period.
The highest average PM2.5 concentrations were recorded in the hallway, particularly during weekday daytime hours (mean: 28.2 µg/m3; max: 62.7 µg/m3), followed by Classroom C (13.0 µg/m3) and Classroom H (11.3 µg/m3). Outdoor concentrations were consistently lower across all periods, with the lowest daytime mean observed on weekdays (8.5 µg/m3).
PM2.5 I/O ratios indicate that Classroom C experienced the highest relative indoor exposure during weekday daytime hours (I/O = 1.5), suggesting the presence of indoor sources or particle resuspension. Classroom H exhibited a similar pattern, with the highest I/O ratio also recorded during weekday daytime hours (I/O = 1.4).
On weekday nights and during weekends, outdoor PM2.5 concentrations increased (mean: 12.1 and 11.7 µg/m3, respectively), while indoor levels remained moderate.
Results from comparable studies on PM2.5 concentrations conducted in the Republic of Serbia, as well as in schools in Spain and Poland during the summer season, are summarized in Table 10.
Most studies reported higher PM2.5 concentrations, both in indoor classroom environments and in the surrounding ambient air, compared to the results of the present study. As shown in the table, an I/O ratio below 1 was observed only in reference [51] (specifically in the urban elementary school “Ljuba Nešić,” located near a busy street in the city of Zaječar, Eastern Serbia) and reference [52] (a secondary school located in the center of Wrocław, Poland). In all other schools, the average I/O ratio was equal to or greater than 1, potentially indicating increased particle resuspension due to student activity, inadequate classroom ventilation, and the presence of additional indoor sources of particulate matter.
The dominance of hallway concentrations during weekdays indicates strong contributions from internal activity sources. PM2.5 particles, while smaller and more easily dispersed, tend to persist indoors when ventilation is insufficient, leading to accumulation. The outdoor background remained lower, reinforcing the interpretation that classroom and hallway activity, rather than infiltration, determined short-term exposure. Compared to Spain and Serbia (Zaječar, Belgrade), our indoor PM2.5 levels were lower but consistent with the trend of summer indoor exceedances. In Barcelona, indoor means of 34 µg/m3 were common, while our study measured 13 µg/m3 in classrooms. Such differences may be explained by urban density, traffic proximity, and ventilation regimes, highlighting the relevance of local conditions in shaping exposure outcomes.

3.3.2. Exceedances of the Daily Limit Value of PM Concentrations

During the measurement campaign conducted in the summer season, no exceedances of the daily limit value for PM10 concentrations were recorded in ambient air, whereas four exceedances were observed in the hallway. Similarly, no exceedances of the daily limit value for PM2.5 were recorded in ambient air, while five exceedances were registered in the hallway.
When considering only the 12-h period during which students were present at school, the situation changed to some extent. No exceedances of the daily PM10 limit value were recorded in ambient air, while nine exceedances were observed in the hallway and one in Classroom C. A similar pattern was observed for PM2.5: no exceedances were recorded in ambient air, while nine occurred in the hallway and one in Classroom C.

3.4. Comparison of PM Concentrations: Heating vs. Non-Heating Season

Importantly, in 18% of the measurements conducted during the winter period, average indoor PM (PM10 and PM2.5) concentrations surpassed those outdoors, compared to 69% of the measurements conducted during the summer period, underscoring the critical need to address indoor emission sources and implement effective ventilation strategies, particularly during warmer months.

3.4.1. PM10 Concentrations

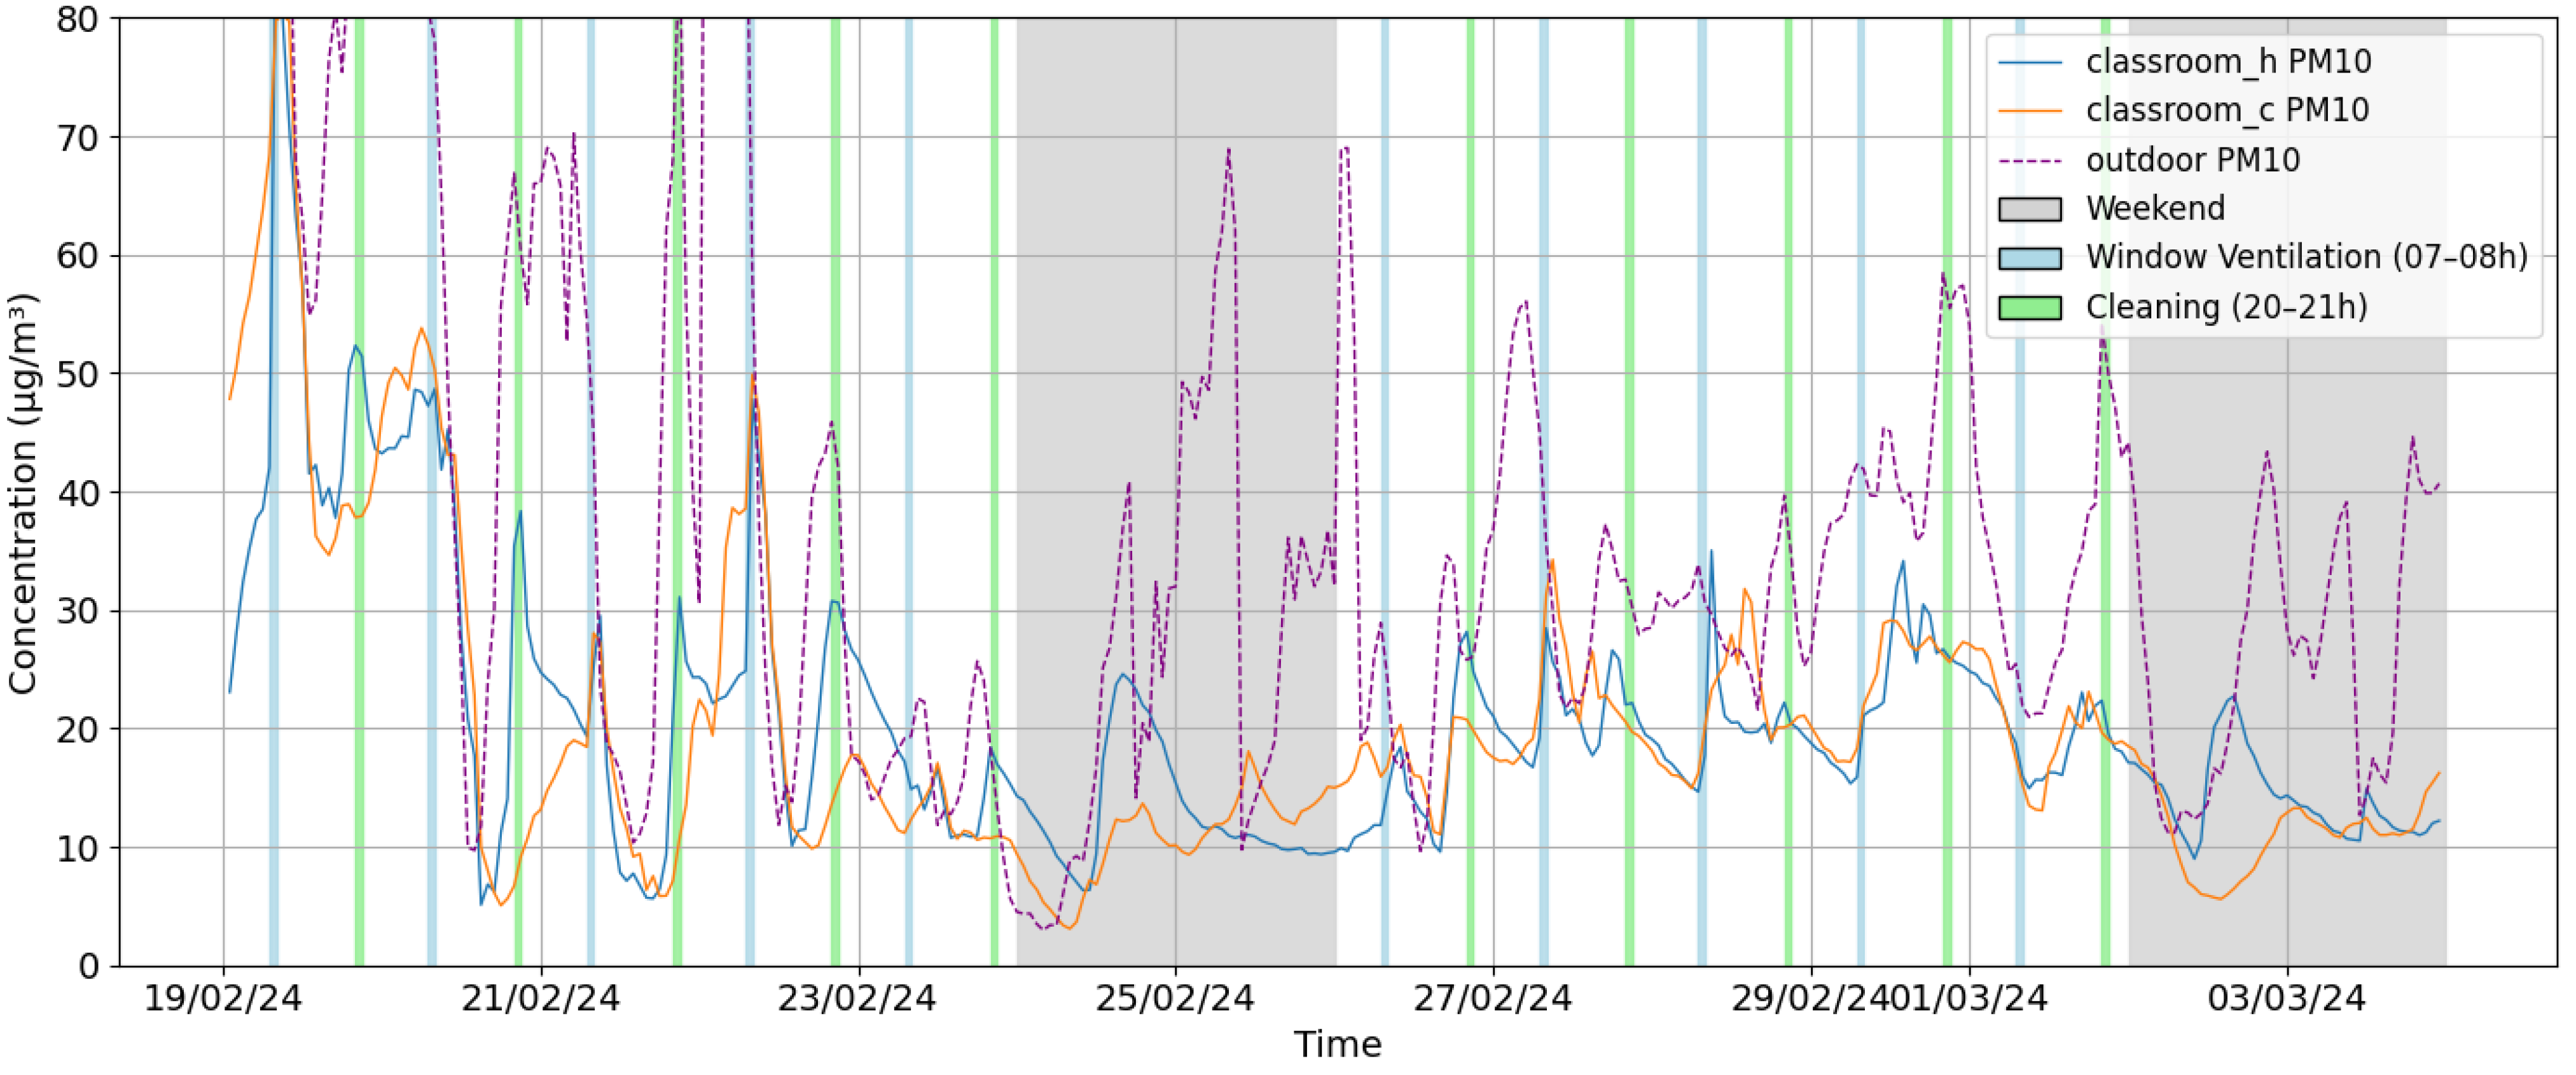
During the heating season, outdoor PM10 concentrations were significantly higher, with an average of 38.9 µg/m3 compared to 19.2 µg/m3 in the summer season, as shown in Figure 4. Maximum values during heating season reached 209.9 µg/m3, more than three times higher than the summer maximum of 62.2 µg/m3. Despite higher outdoor levels in winter, indoor PM10 values remained relatively contained: in Classroom C, the average was 19.4 µg/m3 during the heating season versus 20.9 µg/m3 in summer; in Classroom H, the values were 20.1 µg/m3 (heating) and 19.8 µg/m3 (summer).
Interestingly, PM10 concentrations in the hallway were higher during the summer period (43.5 µg/m3) than in the heating season (22.3 µg/m3), possibly due to more intensive resuspension caused by increased occupant movement and ventilation during warmer months. The I/O ratios for PM10 were also higher in summer, exceeding 1.0 in some cases (up to 1.5), while during winter they consistently remained below 1.0—typically ranging between 0.5 and 0.8—indicating a stronger influence of outdoor sources and the absence of significant indoor particle generation during the heating period.

3.4.2. PM2.5 Concentrations

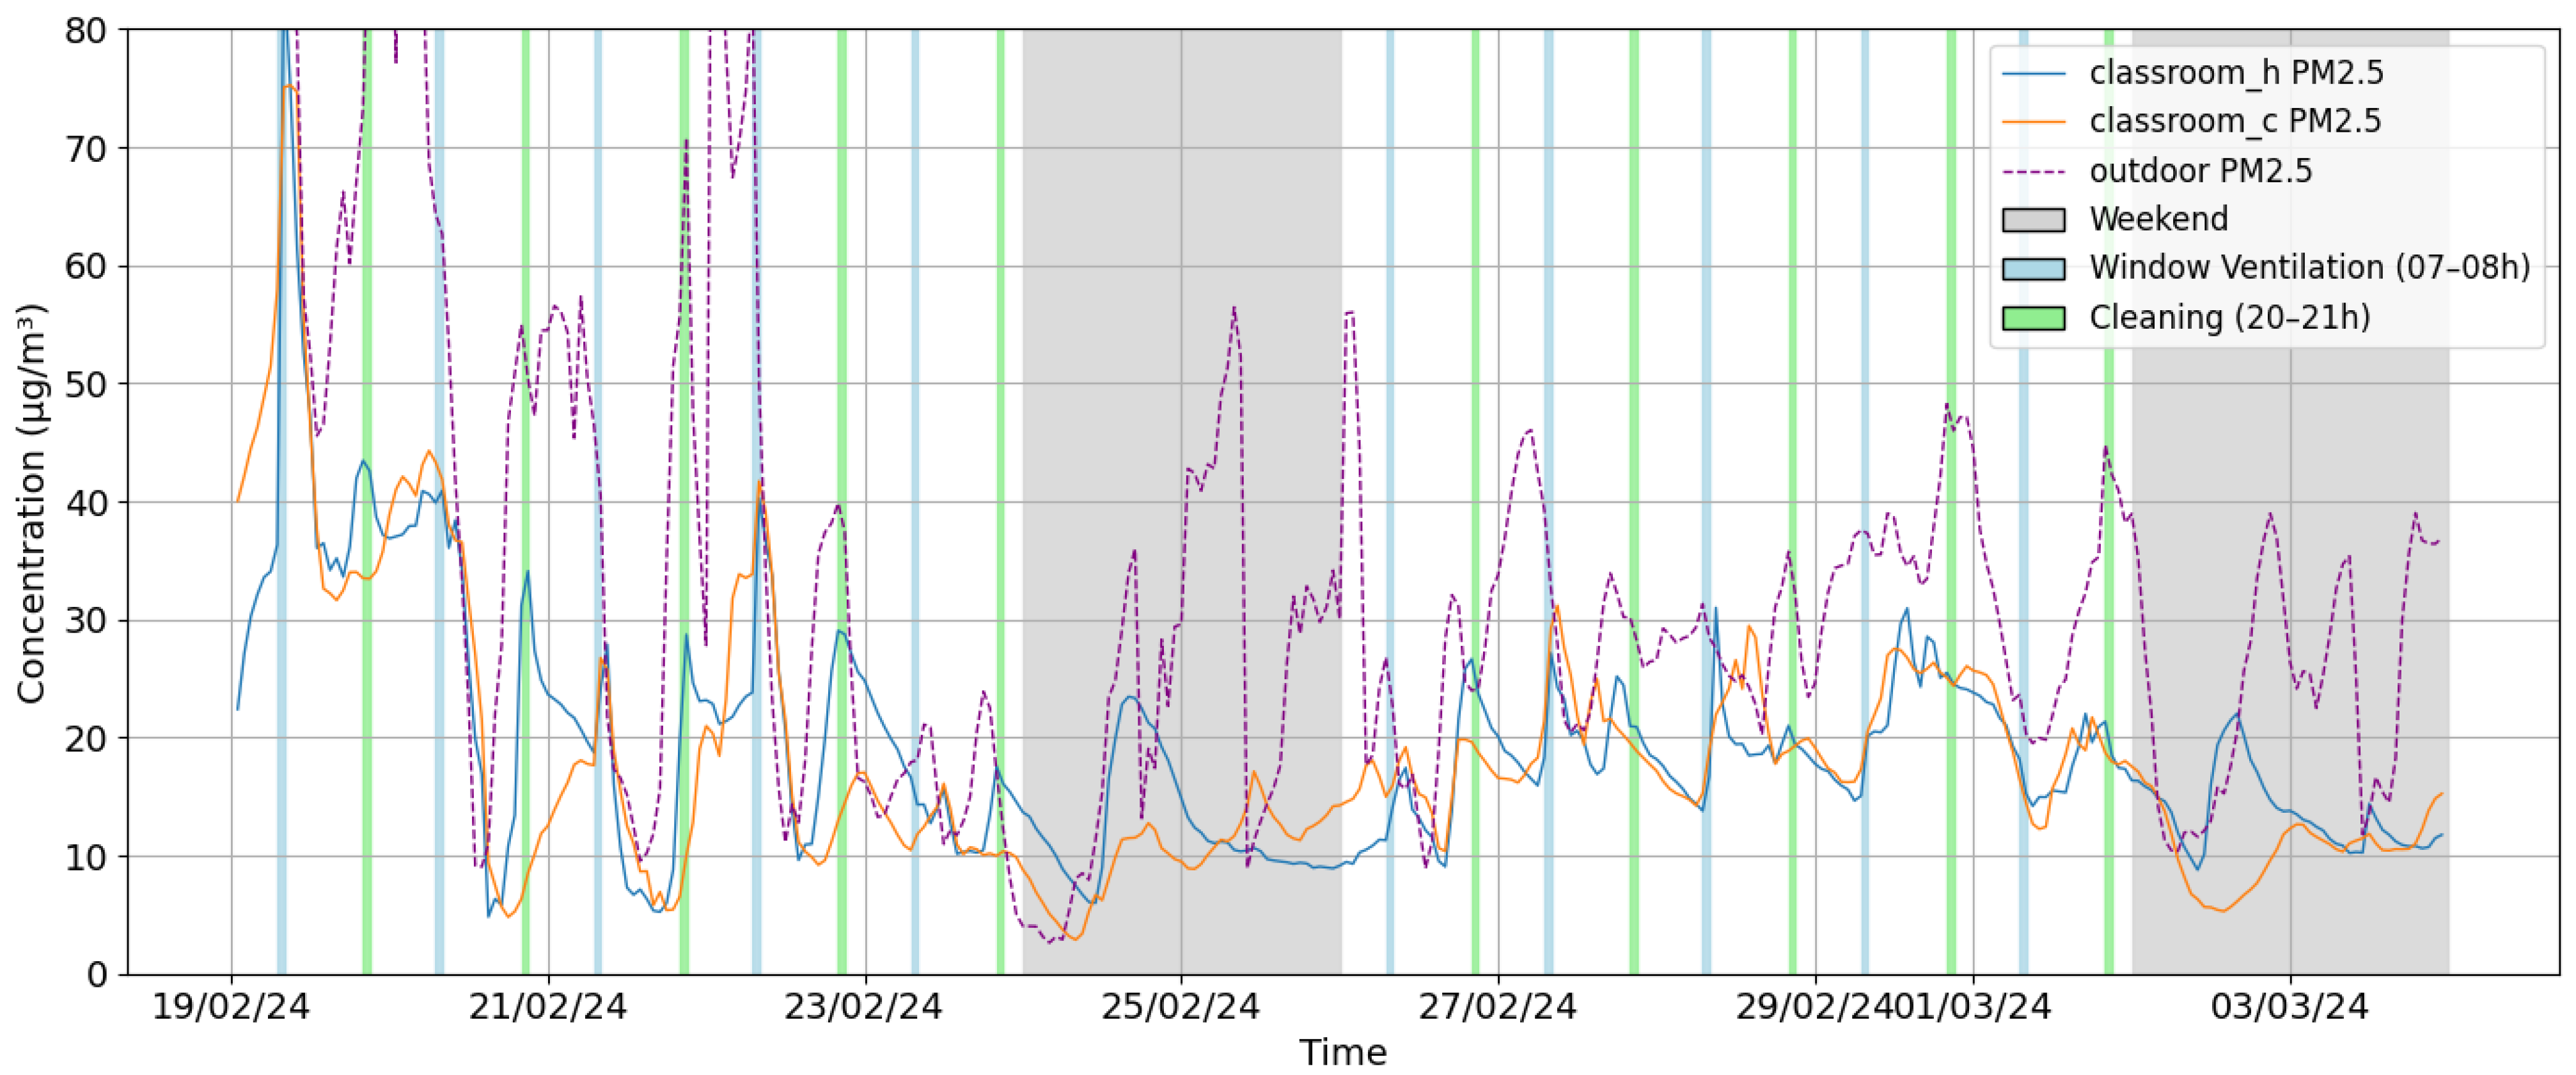
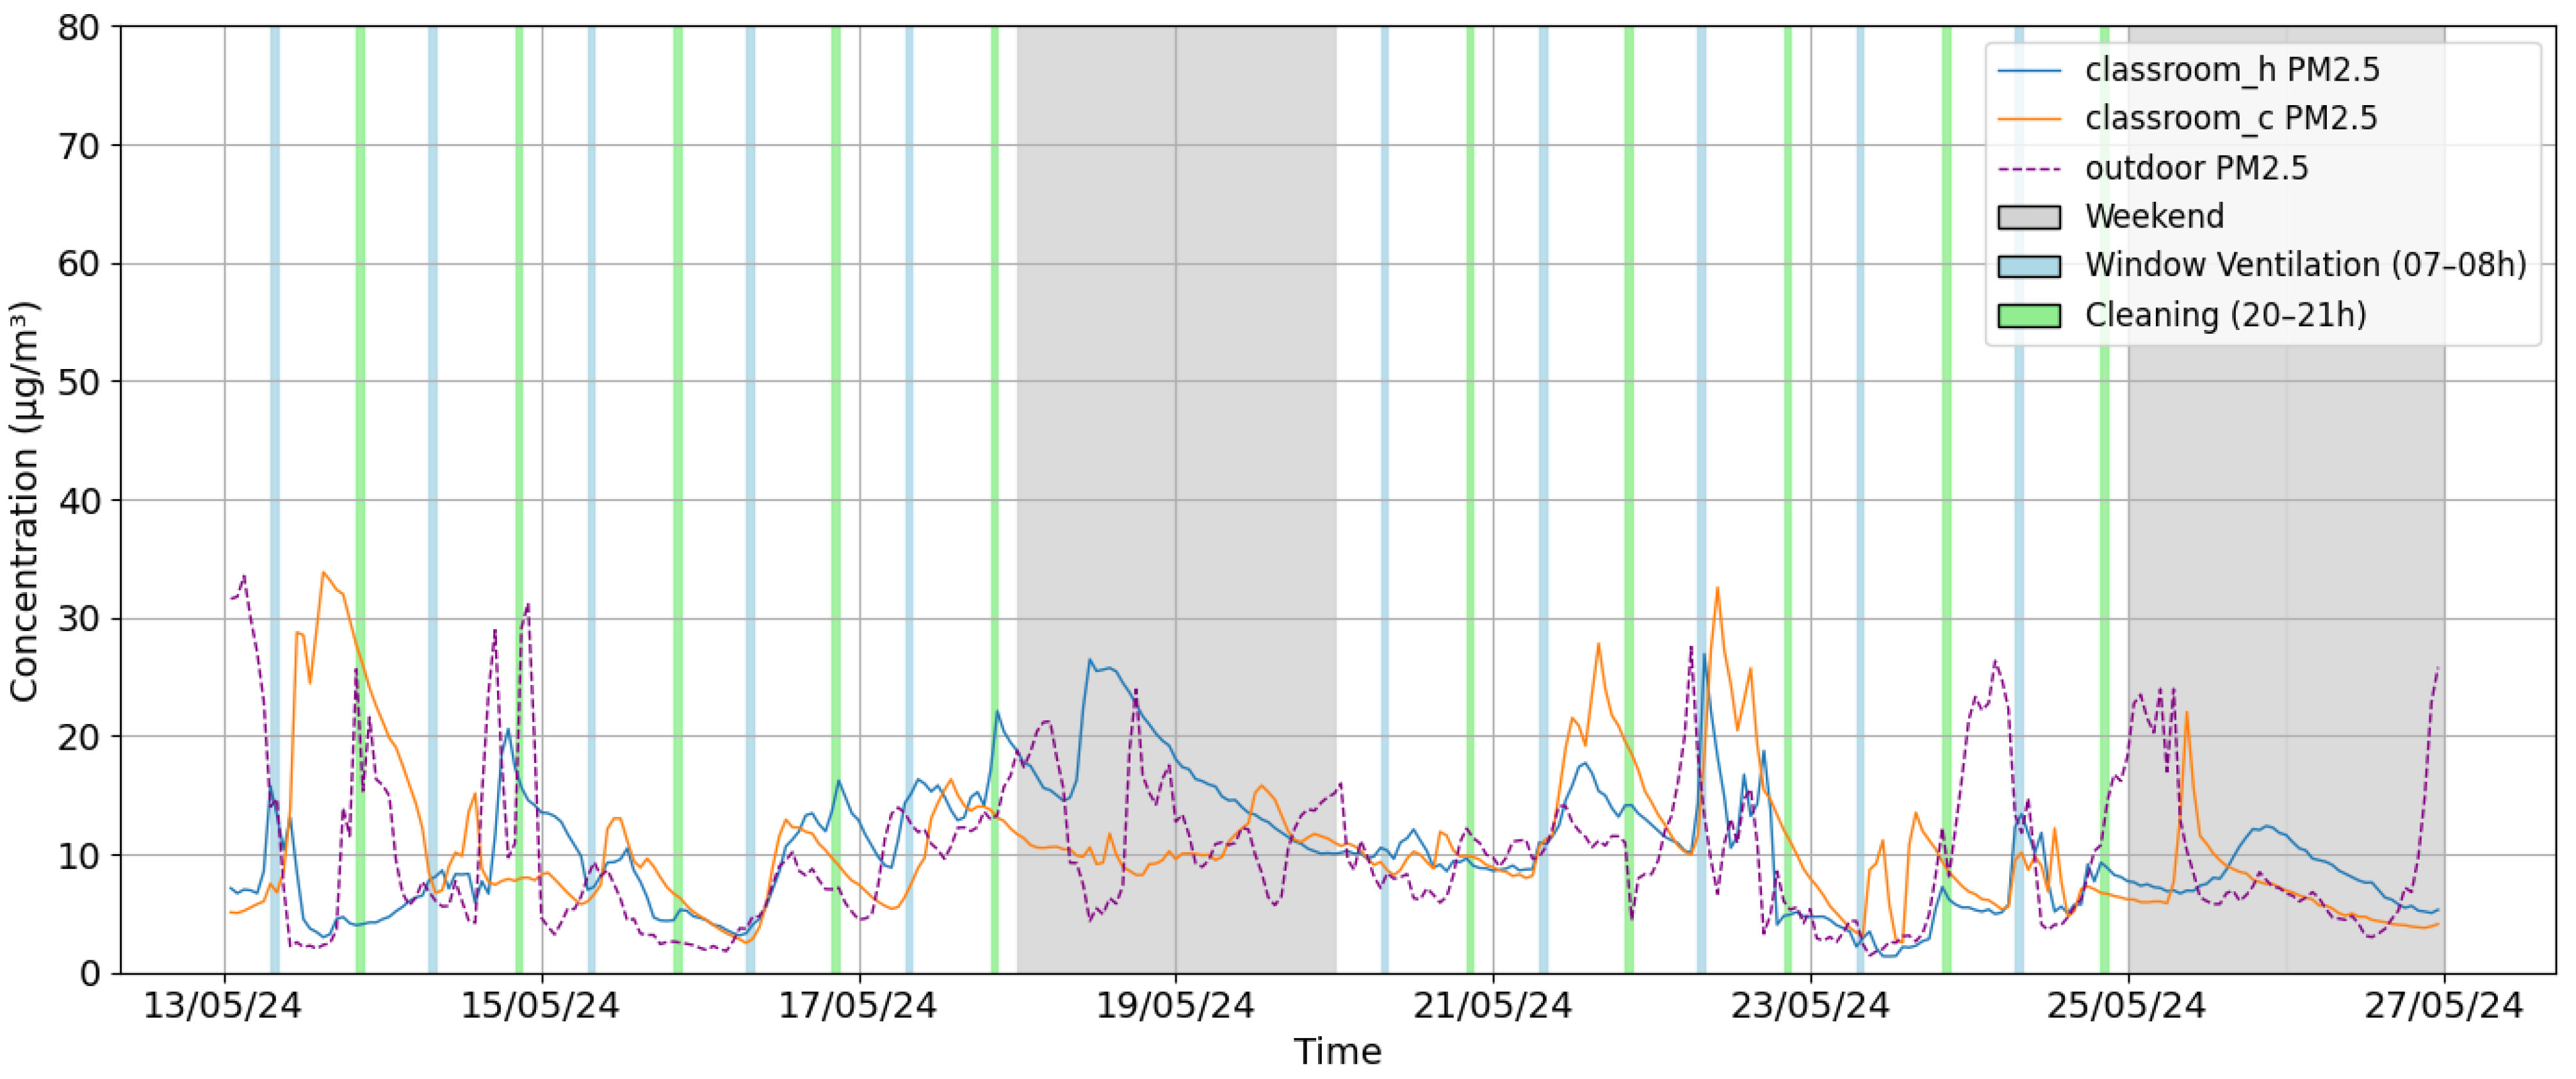
PM2.5 concentrations followed a similar pattern to those of PM10. Outdoor levels were higher during the heating season, averaging 28.3 µg/m3, compared to significantly lower concentrations observed in the summer, as shown in Figure 5. Indoor concentrations were slightly elevated during winter but remained within acceptable limits: in Classroom C, 14.6 µg/m3 in winter versus 11.2 µg/m3 in summer; in Classroom H, 15.3 µg/m3 in winter versus 10.8 µg/m3 in summer. I/O ratios during the heating season consistently remained below 1.0, with maximum values rarely exceeding 0.8. In contrast, during the summer, I/O ratios approached or exceeded 1.0, particularly during periods of increased occupant activity.

3.4.3. Statistical Significance Testing of Seasonal and Spatial Differences

Normality of the datasets was first assessed using the Shapiro–Wilk test, which indicated that all distributions deviated from normality (p < 0.05). Therefore, the Wilcoxon signed-rank test was applied as a non-parametric alternative to the paired t-test. The results confirmed statistically significant seasonal differences between winter and summer campaigns for outdoor PM concentrations and for most indoor micro-environments (p < 0.05). To ensure robustness, a one-way ANOVA was also performed, further confirming significant seasonal variability across datasets. Together, these tests provide strong statistical support for the observed seasonal differences in both outdoor and indoor PM levels.
To further evaluate spatial variability, statistical tests were performed across the monitored micro-environments (outdoor, hallway, Classroom C, and Classroom H). Both non-parametric Wilcoxon signed-rank tests and one-way ANOVA confirmed significant differences (p < 0.05) between outdoor and indoor concentrations for both PM10 and PM2.5, in both winter and summer periods.
During the heating season, outdoor levels were consistently higher, while indoor classrooms and the hallway showed lower and more stable concentrations, reflected in I/O ratios below 1.0. The statistical significance of these differences indicates that the school building envelope provided partial protection against outdoor pollution, with limited influence from internal particle sources.
In contrast, during the non-heating season, indoor PM10 and PM2.5 concentrations were occasionally higher than outdoors, particularly in the hallway and Classroom C. The significant differences confirmed by both ANOVA and Wilcoxon tests suggest that occupant activity (e.g., resuspension during student movement) and ventilation patterns played a major role in shaping indoor particle levels during summer. These findings demonstrate that spatial heterogeneity is a critical factor in school environments: while outdoor air strongly influences indoor concentrations in winter, indoor sources and activity-driven resuspension gain importance in summer, underscoring the need for tailored ventilation and exposure management strategies.

3.5. Limitations and Uncertainties

Nevertheless, several limitations and uncertainties should be acknowledged. Measurements were conducted in a single school and cannot be directly generalized to all educational facilities in Serbia. The use of low-cost sensors, although calibrated, introduces additional uncertainty compared to reference instruments, particularly under variable humidity conditions. Moreover, short-term peaks in PM levels may not be fully captured in daily statistics, and I/O ratios remain sensitive to variations in ventilation practices and classroom occupancy. Addressing these limitations in future research would require longer-term monitoring campaigns, deployment of sensors across multiple schools, systematic recording of classroom activities and ventilation, and advanced calibration strategies that integrate more meteorological corrections and uncertainty quantification. Such improvements would reduce uncertainty and enable more comprehensive conclusions about indoor air quality in schools across Serbia and the wider region.

3.6. Application of Low-Cost Sensors (LCS) for Air Quality Monitoring in Educational Institutions: Next Steps

The integration of low-cost sensors (LCS) for monitoring air quality in educational settings represents a promising and scalable approach to addressing indoor air pollution, particularly regarding PM10 and PM2.5. These technologies enable continuous, real-time data collection and can raise awareness among school staff, students, and policymakers.
To ensure data accuracy and reliability, it is essential to standardize calibration procedures, validate LCS measurements against reference-grade instruments, and develop evidence-based guidelines for interpreting results within the framework of health risk assessments.
This study demonstrated the use of an LCS-based monitoring system for measuring PM10 and PM2.5 concentrations both indoors (classrooms and hallways) and outdoors (near the school). The results highlight the potential of LCS as a practical tool for localized monitoring, while also underlining the importance of calibration and contextual interpretation.
Future steps should include expanding the LCS network to a representative number of classrooms and schools across different regions of the Republic of Serbia; integrating LCS data into school-level decision-making (e.g., ventilation scheduling, classroom use, outdoor activities); and establishing long-term national or municipal strategies for indoor air quality monitoring in schools.
Such an approach provides not only valuable scientific data but also supports the implementation of health-protective measures and fosters environmental awareness and education within the school community.

4. Conclusions

This study revealed significant spatial and temporal variability in particulate matter (PM) concentrations within a secondary school environment. The highest indoor levels occurred during weekday daytime hours, reflecting increased occupancy, resuspension, and classroom activities, while nighttime and weekend periods showed sharp declines and I/O ratios near or below 1.0. Elevated I/O ratios in Classroom C pointed to additional indoor sources or less effective ventilation, whereas Classroom H maintained consistently lower values, likely due to more frequent airing practices.
Quantitative analysis confirmed these patterns. During the heating season, outdoor PM10 levels averaged 38.9 µg/m3 compared to 19.2 µg/m3 in summer, while indoor PM10 levels in classrooms remained near 20 µg/m3 across both seasons. Indoor-to-outdoor ratios for PM10 ranged from 0.6–0.8 in winter to 1.2–1.5 in summer, highlighting the strong influence of occupant activity and ventilation. For PM2.5, outdoor concentrations averaged 28.4 µg/m3 in winter and 15.7 µg/m3 in summer, while indoor values typically ranged between 16 and 18 µg/m3. As part of the calibration procedure, a humidity filter was applied by excluding records with relative humidity (RH) above 75%, a threshold commonly used in LCS evaluation studies. This adjustment significantly improved the accuracy of the calibrated PM2.5 data, reducing winter RMSE from 6.2 to 4.1 µg/m3 and increasing R 2 from 0.87 to 0.94.
These findings emphasize the need for targeted interventions during high-occupancy periods. Practical strategies include optimizing ventilation schedules (e.g., airing classrooms during breaks or night ventilation in summer), minimizing indoor particle sources through improved cleaning practices, and applying portable HEPA purifiers where persistently elevated concentrations are observed. Such seasonally adjusted approaches can substantially reduce exposure risks for students.
In conclusion, the contribution of this study extends beyond demonstrating the feasibility of real-time monitoring with low-cost sensors in schools. By combining continuous measurements across multiple micro-environments with reference-based correction, we provide a scalable framework applicable to other institutions. This dual contribution—advancing methodological validation of LCS and generating actionable evidence for school-based interventions—enhances both the scientific and practical impact of the work. Furthermore, cost–benefit analysis shows that for the price of a single reference analyzer, over 100 AirClair units could be deployed, enabling high-resolution monitoring at a fraction of the cost and offering strong justification for hybrid LCS–reference networks in countries with limited infrastructure.

Author Contributions

Conceptualization, U.R. and S.R.; methodology, U.R. and S.R.; software, U.R.; validation, I.M.L., M.Ž. and V.T.; formal analysis, V.T.; investigation, U.R. and J.O.; resources, I.M.L.; data curation, D.S.R.; writing—original draft preparation, U.R. and V.T.; writing—review and editing, U.R., V.T. and I.M.L.; visualization, U.R. and D.S.R.; supervision, M.Ž. All authors have read and agreed to the published version of the manuscript.

Funding

This research was funded by the Ministry of Science, Technological Development, and Innovation of the Republic of Serbia, Grant No. 451-03-136/2025-03/200017 and 451-03-136/2025-03/200052.

Institutional Review Board Statement

Not applicable.

Informed Consent Statement

Not applicable.

Data Availability Statement

The dataset is available on request from the authors.

Conflicts of Interest

The authors declare no conflicts of interest. The funders had no role in the design of the study; in the collection, analyses, or interpretation of data; in the writing of the manuscript; or in the decision to publish the results.

Abbreviations

The following abbreviations are used in this manuscript:
LCSLow-Cost Sensors
PMParticulate Matter
RHRelative Humidity
AMSAutomatic Monitoring Station
NAQMNNational Air Quality Monitoring Network
WHOWorld Health Organization
IARCInternational Agency for Research on Cancer

References

  1. Zhisheng, L.; Qingmei, W.; Ruilin, Z. Sources, health effects and control strategies of indoor fine particulate matter (PM2.5): A review. Sci. Total Environ. 2017, 586, 610–622. [Google Scholar]
  2. International Agency for Research on Cancer. Agents Classified by the IARC Monographs; International Agency for Research on Cancer: Lyon, France, 2015; Volumes 1—139; Available online: https://monographs.iarc.who.int/agents-classified-by-the-iarc/ (accessed on 27 July 2025).
  3. Mak, H.W.L.; Ng, D.C.Y. Spatial and Socio-Classification of Traffic Pollutant Emissions and Associated Mortality Rates in High-Density Hong Kong via Improved Data Analytic Approaches. Int. J. Environ. Res. Public Health 2021, 18, 6532. [Google Scholar] [CrossRef] [PubMed]
  4. Requia, W.J.; Adams, M.D.; Arain, A.; Papatheodorou, S.; Koutrakis, P.; Mahmoud, M. Global Association of Air Pollution and Cardiorespiratory Diseases: A Systematic Review, Meta-Analysis, and Investigation of Modifier Variables. Am. J. Public Health 2018, 108 (Suppl. S2), S123–S130. [Google Scholar] [CrossRef] [PubMed] [PubMed Central]
  5. Sangkham, S.; Phairuang, W.; Sherchan, S.P.; Pansakun, N.; Munkong, N.; Sarndhong, K.; Islam, M.A.; Sakunkoo, P. An update on adverse health effects from exposure to PM2.5. Environ. Adv. 2024, 18, 100603. [Google Scholar] [CrossRef]
  6. Sadrizadeh, S.; Yao, R.; Yuan, F.; Awbi, H.; Bahnfleth, W.; Bi, Y.; Cao, G.; Croitoru, C.; de Dear, R.; Haghighat, F.; et al. Indoor air quality and health in schools: A critical review for developing the roadmap for the future school environment. J. Build. Eng. 2022, 57, 104908. [Google Scholar] [CrossRef]
  7. Gartland, N.; Aljofi, H.E.; Dienes, K.; Munford, L.A.; Theakston, A.L.; van Tongeren, M. The effects of traffic air pollution in and around schools on executive function and academic performance in children: A rapid review. Int. J. Environ. Res. Public Health 2022, 19, 749. [Google Scholar] [CrossRef]
  8. Błaszczyk, E.; Rogula-Kozłowska, W.; Klejnowski, K.; Furala, I.; Mielżyńska-Śvach, D. Polycyclic aromatic hydrocarbons bound to outdoor and indoor airborne particles (PM2.5) and their mutagenicity and carcinogenicity in Silesian kindergartens, Poland. Air Qual. Atmos. Health 2017, 10, 389. [Google Scholar] [CrossRef]
  9. Pegas, P.N.; Alves, C.A.; Nunes, T.; Bate-Epey, E.F.; Evtyugina, M.; Pio, C.A. Could houseplants improve indoor air quality in schools? J. Toxicol. Environ. Health A 2012, 75, 1371–1380. [Google Scholar] [CrossRef]
  10. Stranger, M.; Potgieter-Vermaak, S.S.; Van Grieken, R. Characterization of indoor air quality in primary schools in Antwerp, Belgium. Indoor Air 2008, 18, 454–463. [Google Scholar] [CrossRef]
  11. Fromme, H.; Diemer, J.; Dietrich, S.; Cyrys, J.; Heinrich, J.; Lang, W.; Kiranoglu, M.; Twardella, D. Chemical and morphological properties of particulate matter (PM10, PM2.5) in school classrooms and outdoor air. Atmos. Environ. 2008, 42, 6597–6605. [Google Scholar] [CrossRef]
  12. Madureira, J.; Paciência, I.; Pereira, C.; Teixeira, J.P.; Fernandes, E.O. Indoor air quality in Portuguese schools: Levels and sources of pollutants. Indoor Air 2016, 26, 526–537. [Google Scholar] [CrossRef]
  13. Csobod, E.; Rudnai, P.; Vaskovi, E. School Environment and Respiratory Health of Children (SEARCH) Project Report. Programme “Indoor Air Quality in European Schools: Preventing and Reducing Respiratory Diseases”. 2009. Available online: https://www.3sqair.com/wp-content/uploads/2022/10/School-Environment-and-Respiratory-Health-of-Children-Search-.pdf (accessed on 7 August 2025).
  14. Serbian Environmental Protection Agency (SEPA). Annual Report on the State of Air Quality in the Republic of Serbia. 2023. Available online: https://www.sepa.gov.rs (accessed on 24 August 2025).
  15. Ministry of Environmental Protection, Republic of Serbia. National Environmental Protection Strategy for the Period 2022–2030. In Official Gazette of RS, No. 15/2022. Available online: https://www.ekologija.gov.rs/sites/default/files/2022-12/program_zashtite_vazdukha_i_ap.pdf (accessed on 24 August 2025).
  16. Standing Conference of Towns and Municipalities (SKGO); UNICEF Serbia. Schools for Better Air Quality Project. Available online: https://www.skgo.org/projekti/arhiva/detaljno/64/projekat-skole-za-bolji-kvalitet-vazduha (accessed on 24 August 2025).
  17. Stojanović, D.B.; Kleut, D.; Davidović, M.; Živković, M.; Ramadani, U.; Jovanović, M.; Lazović, I.; Jovašević-Stojanović, M. Data Evaluation of a Low-Cost Sensor Network for Atmospheric Particulate Matter Monitoring in 15 Municipalities in Serbia. Sensors 2024, 24, 4052. [Google Scholar] [CrossRef]
  18. Živković, M.; Jovašević-Stojanović, M.; Cvetković, A.; Lazović, I.; Tasić, V.; Stevanović, Ž.; Gržetić, I. PAH levels in gas and particle-bound phases in schools at different locations in Serbia. Chem. Ind. Chem. Eng. Q. 2015, 21, 159–167. [Google Scholar] [CrossRef]
  19. Matić, B.; Rakić, U.; Jovanović, V.; Dejanović, S.; Đonović, N. Key factors determining indoor air PM10 concentrations in naturally ventilated primary schools in Serbia. Zdr. Varst. 2017, 56, 227–235. [Google Scholar] [CrossRef]
  20. Jovanović, M.; Vučićević, B.; Turanjanin, V.; Živković, M.; Spasojević, V. Investigation of indoor and outdoor air quality of the classrooms at a school in Serbia. Energy 2014, 77, 42–48. [Google Scholar] [CrossRef]
  21. Kovačević, R.; Tasić, V.; Živković, M.; Živković, N.; Đorđević, A.; Manojlović, D.D.; Jovašević-Stojanović, M. Mass concentrations and indoor–outdoor relationships of PM in selected educational buildings in Niš, Serbia. Chem. Ind. Chem. Eng. Q. 2015, 21, 149–157. [Google Scholar] [CrossRef]
  22. Lazović, I.; Jovašević-Stojanović, M.; Živković, M.; Tasić, V.; Stevanović, Ž. PM and CO2 variability and relationship in different school environments. Chem. Ind. Chem. Eng. Q. 2015, 21, 179–187. [Google Scholar] [CrossRef]
  23. Matić, B.I.; Dejanović, S.M.; Jovanović, D.D. Monitoring of urban ambient air quality at locations of preschool and school facilities in Serbia. Tehnika 2021, 76, 673–679. [Google Scholar] [CrossRef]
  24. Živković, M.; Jovašević-Stojanović, M.; Cvetković, A.; Jovanović, R.; Manojlović, D. Characterisation of fine particulate matter level, content and sources of a kindergarten microenvironment in Belgrade city center. Therm. Sci. 2023, 27, 2215–2228. [Google Scholar] [CrossRef]
  25. Božilov, A.; Tasić, V.; Živković, N.; Lazović, I.; Blagojević, M.; Mišić, N.; Topalović, D. Performance assessment of NOVA SDS011 low-cost PM sensor in various microenvironments. Environ. Monit. Assess. 2022, 194, 595. [Google Scholar] [CrossRef]
  26. Tasić, V.; Kamenović, V.; Urošević, T.; Radović, B.; Apostolovski-Trujić, T.; Damjanović, Z. Suspended particles concentrations in secondary schools in Bor (Serbia) in the heating season. Min. Metall. Eng. Bor 2023, 2, 47–54. [Google Scholar] [CrossRef]
  27. Radović, B.; Tasić, V.; Kovačević, R.; Apostolovski-Trujić, T.; Manojlović, D.; Cocić, M.; Urošević, T. Chemical composition of PM10 in a classroom near the copper smelter in Bor, Serbia. Atmosphere 2024, 15, 920. [Google Scholar] [CrossRef]
  28. Liu, X.; Jayaratne, R.; Thai, P.; Kuhn, T.; Zing, I.; Christensen, B.; Lamont, R.; Dunbabin, M.; Zhu, S.; Gao, J.; et al. Low-cost sensors as an alternative for long-term air quality monitoring. Environ. Res. 2020, 185, 109438. [Google Scholar] [CrossRef] [PubMed]
  29. Morawska, L.; Ayoko, G.A.; Bae, G.N.; Buonanno, G.; Chao, C.Y.H.; Clifford, S.; Fu, S.C.; Hänninen, O.; He, C.; Isaxon, C.; et al. Airborne particles in indoor environments of homes, schools, offices and aged-care facilities: The main routes of exposure. Environ. Int. 2017, 108, 75–83. [Google Scholar] [CrossRef] [PubMed]
  30. Alfano, B.; Barretta, L.; Del Giudice, A.; De Vito, S.; Di Francia, G.; Esposito, E.; Formisano, F.; Massera, E.; Miglietta, M.L.; Polichetti, T. A review of low-cost particulate matter sensors from the developers’ perspectives. Sensors 2020, 20, 6819. [Google Scholar] [CrossRef]
  31. Mishchenko, M.I. Gustav Mie and the fundamental concept of electromagnetic scattering by particles: A perspective. J. Quant. Spectrosc. Radiat. Transfer. 2009, 110, 1210–1222. [Google Scholar] [CrossRef]
  32. Venkatraman, J.; Klausnitzer, A.; Chacón-Mateos, M.; Laquai, B.; Nieuwkoop, E.; van der Mark, P.; Vogt, U.; Schneider, C. Calibration method for particulate matter low-cost sensors used in ambient air quality monitoring and research. Sensors 2021, 21, 3960. [Google Scholar] [CrossRef]
  33. Giordano, M.R.; Malings, C.; Pandis, S.N.; Presto, A.A.; McNeill, V.F.; Westervelt, D.M.; Beekmann, M.; Subramanian, R. From low-cost sensors to high-quality data: Challenges and best practices for calibrating low-cost PM mass sensors. J. Aerosol Sci. 2021, 158, 105833. [Google Scholar] [CrossRef]
  34. Tasić, V.; Jovašević-Stojanović, M.; Vardoulakis, S.; Milošević, N.; Kovačević, R.; Petrović, J. Comparative assessment of a real-time particle monitor against the reference gravimetric method for PM10 and PM2.5 in indoor air. Atmos. Environ. 2012, 54, 358–364. [Google Scholar] [CrossRef]
  35. The INTERNET of THINGS with ESP32. Available online: http://esp32.net/ (accessed on 15 June 2025).
  36. KAMAMI. Available online: https://download.kamami.pl/p564008-PMS7003%20series%20data%20manua_English_V2.5.pdf (accessed on 15 June 2025).
  37. MOUSER Electronics. Available online: https://eu.mouser.com/new/bosch/bosch-bme280/ (accessed on 15 June 2025).
  38. ANALOG DEVICES. Available online: https://www.analog.com/media/en/technical-documentation/data-sheets/ds1307.pdf (accessed on 15 June 2025).
  39. Random Tutorials. Available online: https://randomnerdtutorials.com/guide-to-neo-6m-gps-module-with-arduino/ (accessed on 15 June 2025).
  40. Random Tutorials. Available online: https://randomnerdtutorials.com/guide-for-oled-display-with-arduino/ (accessed on 15 June 2025).
  41. IONOS. Available online: https://www.ionos.com/digitalguide/hosting/technical-matters/what-is-influxdb/ (accessed on 15 June 2025).
  42. Li, J.; Biswas, P. Calibration and applications of low-cost particle sensors: A review of recent advances. In Aerosols: Science and Engineering; Biswas, P., Yablonsky, G., Eds.; De Gruyter: Berlin, Germany, 2022; pp. 91–114. [Google Scholar] [CrossRef]
  43. Kang, J.; Choi, K. Calibration methods for low-cost particulate matter sensors considering seasonal variability. Sensors 2024, 24, 3023. [Google Scholar] [CrossRef]
  44. Villanueva, E.; Espezua, S.; Castelar, G.; Diaz, K.; Ingaroca, E. Smart multi-sensor calibration of low-cost particulate matter monitors. Sensors 2023, 23, 3776. [Google Scholar] [CrossRef]
  45. Chetna; Dhaka, S.K.; Walker, S.-E.; Rawat, V.; Singh, N. Long-term meteorology-adjusted and unadjusted trends of PM2.5 using the AirGAM model over Delhi, 2007–2022. Atmos. Environ. X 2024, 22, 224. [Google Scholar] [CrossRef]
  46. Lin, C.; Labzovskii, L.D.; Mak, H.W.L.; Fung, J.C.H.; Lau, A.K.H.; Kenea, S.T.; Bilal, M.; Hey, J.D.V.; Lu, X.; Ma, J. Observation of PM2.5 using a combination of satellite remote sensing and low-cost sensor network in Siberian urban areas with limited reference monitoring. Atmos. Environ. 2020, 227, 117410. [Google Scholar] [CrossRef]
  47. Zhang, X.; Zhang, Q.; Hong, C.; Zheng, Y.; Geng, G.; Tong, D.; Zhang, Y.; Zhang, X. Enhancement of PM2.5 concentrations by aerosol-meteorology interactions over China. J. Geophys. Res. Atmos. 2018, 123, 1179–1194. [Google Scholar] [CrossRef]
  48. Stepanić, N.; Terzić, M.; Radivojević, D.; Raković, D. An in situ temperature calibration of a guarded hot-plate apparatus. Therm. Sci. 2019, 23, 707–715. [Google Scholar] [CrossRef]
  49. Nikezić, D.P.; Ramadani, U.R.; Radivojević, D.S.; Lazović, I.M.; Mirkov, N.S. Deep learning model for global spatio-temporal image prediction. Mathematics 2022, 10, 3392. [Google Scholar] [CrossRef]
  50. Downey, A. Think Stats: Exploratory Data Analysis in Python, 2nd ed.; The Book, O’Reilly Media: Sebastopol, CA, USA, 2015. [Google Scholar]
  51. Živković, M. Content and Composition of Indoor and Outdoor Air Pollution in School Environments in Serbia. Ph.D. Thesis, University of Belgrade, Belgrade, Serbia, 2023. Available online: https://nardus.mpn.gov.rs/handle/123456789/22330 (accessed on 15 June 2025).
  52. Zwoździak, A.; Sówka, I.; Krupińska, B.; Zwoździak, J.; Nych, A. Infiltration or indoor sources as determinants of the elemental composition of particulate matter inside a school in Wrocław, Poland. Build. Environ. 2013, 66, 173–180. [Google Scholar] [CrossRef]
  53. Rivas, I.; Viana, M.; Moreno, T.; Pandolfi, M.; Amato, F.; Reche, C.; Bouso, C.; Àlvarez-Pedrerol, M.; Alastuey, A.; Sunyer, J.; et al. Child exposure to indoor and outdoor air pollutants in schools in Barcelona, Spain. Environ. Int. 2014, 69, 200–212. [Google Scholar] [CrossRef]
  54. Pegas, P.N.; Nunes, T.; Alves, C.A.; Silva, J.R.; Vieira, S.L.A.; Caseiro, A.; Pio, C.A. Indoor and outdoor characterisation of organic and inorganic compounds in city-centre and suburban elementary schools of Aveiro, Portugal. Atmos. Environ. 2012, 55, 80–89. [Google Scholar] [CrossRef]
Figure 1. Location of the sampling site (SCHOOL: 44°49′37.19″ N, 20°27′19.19″ E) and the reference monitoring station AMS Stari Grad (44°49′17.67″ N, 20°27′31.88″ E).
Atmosphere 16 01103 g001
Figure 2. AirClair device.
Atmosphere 16 01103 g002
Figure 3. The principle of operation of the AirClair device.
Atmosphere 16 01103 g003
Figure 4. PM10 concentrations measured during the summer monitoring campaigns.
Atmosphere 16 01103 g004aAtmosphere 16 01103 g004b
Figure 5. PM2.5 concentrations measured during the summer monitoring campaigns.
Atmosphere 16 01103 g005aAtmosphere 16 01103 g005b
Table 1. Correction factors (F) calculated for PM2.5 and PM10.
PollutantSummerWinter
PM101.520.97
PM2.51.050.79
Table 2. Effect of RH screening (NC = RH > 75%, C = RH ≤ 75%) on low-cost sensor accuracy during winter and summer campaigns.
PMCond.RMSE [µg/m3]MAPE [%]r R 2 F (Correction Factor)
Winter campaign
PM2.5NC6.219.80.930.870.72
C4.112.50.970.940.79
PM10NC11.828.40.800.650.82
C8.920.70.920.850.97
Summer campaign
PM2.5NC9.518.70.780.611.18
C7.914.20.830.691.05
PM10NC12.626.10.740.551.73
C10.219.80.910.831.52
Table 3. Basic statistics of PM10 concentrations measured during winter period.
PeriodPM10 OutPM10 HallPM10 CPM10 HC/OutH/Out
µg/m3µg/m3µg/m3µg/m3
All (mean)38.922.319.420.10.60.7
WD Day (mean)32.625.123.022.40.80.7
WD Night (mean)55.724.222.923.40.50.6
Weekend (mean)25.816.510.613.20.60.8
All (median)30.721.016.218.00.60.6
WD Day (median)27.124.320.619.70.70.7
WD Night (median)41.321.818.121.40.50.5
Weekend (median)26.616.211.211.80.40.6
All (stdev)29.57.312.611.30.40.5
WD Day (stdev)17.16.312.211.90.40.3
WD Night (stdev)38.57.112.69.30.30.4
Weekend (stdev)14.04.73.44.20.40.7
All (min)2.99.53.04.90.10.1
WD Day (min)9.39.94.94.90.10.2
WD Night (min)5.412.96.59.30.10.1
Weekend (min)2.99.53.06.10.20.2
All (max)209.946.877.785.82.93.9
WD Day (max)93.646.877.777.62.92.1
WD Night (max)209.940.166.350.71.92.7
Weekend (max)66.831.817.923.81.93.9
Table 4. Summary of winter-season PM10 studies in schools: indoor (classroom C, classroom H) and outdoor concentrations, I/O ratios, sample sizes, and references.
SchoolCityCountryYearSampling PeriodPM10 in (µg/m3)PM10 Out (µg/m3)I/ONRef.
I. G. KovačićBelgradeSerbia20088 a.m. to 8 p.m.44.780.30.64[19]
SkadarlijaBelgradeSerbia20088 a.m. to 8 p.m.58.283.60.74[19]
Lj. NešićZaječarSerbia20118 a.m. to 8 p.m.66.6101.70.75[51]
20. oktobarBelgradeSerbia20128 a.m. to 8 p.m.75.951.81.55[51]
V. KarađorđeNišSerbia20138 a.m. to 8 p.m.63.144.51.617[21]
A. AcademyBelgradeSerbia20248 a.m. to 8 p.m.23.0; 22.432.60.8; 0.714this study
School 1WroclawPoland2009–201024 h68.556.81.21 year[52]
V. KarađorđeNišSerbia201324 h54.649.71.317[21]
P. RadovanovićZlotSerbia201224 h49.438.31.35[22]
3. oktobarBorSerbia201224 h44.254.70.85[22]
MSBorSerbia201924 h31.525.51.35[26]
GMBorSerbia202324 h13.122.10.85[26]
A. AcademyBelgradeSerbia202424 h19.4; 20.138.90.6; 0.714this study
Table 5. Basic statistics of PM2.5 concentrations measured during the winter period.
PeriodPM2.5 OutPM2.5 HallPM2.5 CPM2.5 HC/OutH/Out
µg/m3µg/m3µg/m3µg/m3
All (mean)28.316.814.615.30.70.7
WD Day (mean)23.818.917.316.90.80.8
WD Night (mean)40.218.217.017.80.50.6
Weekend (mean)19.112.68.210.30.60.8
All (median)23.216.212.614.00.60.6
WD Day (median)20.718.516.015.30.70.7
WD Night (median)30.116.914.116.70.50.5
Weekend (median)20.012.48.79.30.40.6
All (stdev)21.45.18.98.00.40.5
WD Day (stdev)11.34.48.68.20.40.3
WD Night (stdev)28.64.78.26.10.30.4
Weekend (stdev)9.93.52.63.30.40.7
All (min)2.17.32.33.80.10.2
WD Day (min)7.17.83.83.80.10.2
WD Night (min)4.010.15.07.30.10.2
Weekend (min)2.17.32.34.70.20.2
All (max)159.036.859.767.43.04.2
WD Day (max)67.836.859.759.43.02.2
WD Night (max)159.029.146.034.52.02.9
Weekend (max)44.823.413.918.62.04.2
Table 6. PM2.5 concentrations measured in various schools during the winter period (N—number of measurement days).
SchoolCityCountryYearSampling PeriodPM2.5 in (µg/m3)PM2.5 Out (µg/m3)I/ONRef.
Lj. NešićZaječarSerbia20118 a.m. to 8 p.m.68.298.70.75[51]
20. oktobarBelgradeSerbia20128 a.m. to 8 p.m.24.213.21.85[51]
V. KarađorđeNišSerbia20138 a.m. to 8 p.m.40.340.81.117[21]
39 SchoolsBarcelonaSpain2012–20139 a.m. to 7 p.m.38.030.01.31 year[53]
A. AcademyBelgradeSerbia20248 a.m. to 8 p.m.17.3; 16.923.80.8; 0.814this study
School 1WroclawPoland2009–201024 h59.849.11.21 year[52]
V. KarađorđeNišSerbia201324 h38.540.31.017[21]
P. RadovanovićZlotSerbia201224 h28.633.00.95[22]
3. oktobarBorSerbia201224 h25.245.90.55[22]
MSBorSerbia201924 h17.621.10.85[26]
GMBorSerbia202324 h6.613.70.65[26]
A. AcademyBelgradeSerbia202424 h14.6; 15.328.30.7; 0.714this study
Table 7. Basic statistics of PM10 concentrations measured during the summer period.
PeriodPM10 OutPM10 HallPM10 CPM10 HC/OutH/Out
µg/m3µg/m3µg/m3µg/m3
All (mean)19.243.520.919.81.31.2
WD Day (mean)16.953.424.420.81.51.3
WD Night (mean)20.031.518.116.91.11.1
Weekend (mean)22.838.917.423.80.91.0
All (median)18.736.918.418.61.11.1
WD Day (median)16.048.720.519.81.31.2
WD Night (median)19.530.015.916.91.01.0
Weekend (median)21.634.518.121.80.70.9
All (stdev)10.120.811.99.80.80.6
WD Day (stdev)8.922.713.910.80.80.5
WD Night (stdev)11.28.69.37.90.50.6
Weekend (stdev)7.617.06.510.80.50.5
All (min)2.919.04.93.00.30.2
WD Day (min)2.921.65.43.00.30.4
WD Night (min)3.719.04.94.20.30.2
Weekend (min)8.721.67.49.60.30.4
All (max)62.2126.571.453.44.53.2
WD Day (max)56.9126.571.453.44.53.2
WD Night (max)62.269.854.442.32.82.9
Weekend (max)48.2107.743.450.42.43.2
Table 8. PM10 concentrations measured in various schools during the summer period (N—number of measurement days).
SchoolCityCountryYearSampling PeriodPM10 in (µg/m3)PM10 Out (µg/m3)I/ONRef.
Lj. NešićZaječarSerbia20118 a.m. to 8 p.m.54.436.91.55[51]
20. oktobarBelgradeSerbia20128 a.m. to 8 p.m.74.518.04.15[51]
A. AcademyBelgradeSerbia20248 a.m. to 8 p.m.24.4; 20.816.91.5; 1.314this study
P. RadovanovićZlotSerbia201224 h21.135.30.65[22]
School 1WroclawPoland2009–201024 h43.124.71.71 year[52]
School 1AveiroPortugal201024 h49.223.42.414[54]
School 2AveiroPortugal201024 h81.742.32.114[54]
A. AcademyBelgradeSerbia202424 h20.9; 19.819.21.3; 1.214this study
Table 9. Basic statistics of PM2.5 concentrations measured during summer period.
PeriodPM2.5 OutPM2.5 HallPM2.5 CPM2.5 HC/OutH/Out
µg/m3µg/m3µg/m3µg/m3
All (mean)10.723.111.210.81.21.2
WD Day (mean)8.528.213.011.31.51.4
WD Night (mean)12.117.09.79.31.11.1
Weekend (mean)11.720.910.211.40.91.0
All (median)9.120.19.910.21.11.2
WD Day (median)7.826.111.010.81.31.3
WD Night (median)10.316.38.59.21.00.9
Weekend (median)9.818.89.711.11.01.0
All (stdev)6.610.36.35.40.70.6
WD Day (stdev)4.711.17.25.90.70.6
WD Night (stdev)8.24.55.04.30.70.7
Weekend (stdev)6.38.43.56.00.50.6
All (min)1.510.32.61.40.20.2
WD Day (min)1.511.42.71.40.30.3
WD Night (min)1.910.32.62.30.20.2
Weekend (min)3.111.44.05.30.20.2
All (max)35.362.735.628.43.73.5
WD Day (max)30.562.735.628.43.73.3
WD Night (max)35.336.329.223.32.83.5
Weekend (max)27.252.823.227.92.63.3
Table 10. PM2.5 concentrations measured in various schools during the summer period (N–number of measurement days).
SchoolCityCountryYearSampling PeriodPM2.5 in (µg/m3)PM2.5 Out (µg/m3)I/ONRef.
Lj. NesićZaječarSerbia20118 a.m. to 8 p.m.34.942.00.85[51]
20. oktobarBelgradeSerbia20128 a.m. to 8 p.m.24.213.21.85[51]
V. KarođorđeNišSerbia20138 a.m. to 8 p.m.40.340.81.117[21]
39 SchoolsBarcelonaSpain2012–20139 a.m. to 7 p.m.34.029.01.21 year[53]
A. AcademyBelgradeSerbia20248 a.m. to 8 p.m.13.0; 11.38.51.5; 1.414this study
School 1WroclawPoland2009–201024 h13.516.00.81 year[52]
P. RadovanovićZlotSerbia201224 h17.815.61.15[22]
3. oktobarBorSerbia201224 h12.713.41.05[22]
V. KarađorđeNišSerbia201324 h38.540.31.017[21]
A. AcademyBelgradeSerbia202424 h11.2; 10.810.71.2; 1.214this study
Disclaimer/Publisher’s Note: The statements, opinions and data contained in all publications are solely those of the individual author(s) and contributor(s) and not of MDPI and/or the editor(s). MDPI and/or the editor(s) disclaim responsibility for any injury to people or property resulting from any ideas, methods, instructions or products referred to in the content.