Article

Severe Typhoon Danas (2025)—A Tropical Cyclone with Erratic Track over the Northern Part of the South China Sea and Adjacent Sea of Taiwan

1
Hong Kong Observatory, Hong Kong, China
2
Department of Architecture and Civil Engineering, City University of Hong Kong, Hong Kong, China
*
Author to whom correspondence should be addressed.
Atmosphere 2025, 16(9), 1099; https://doi.org/10.3390/atmos16091099
Submission received: 23 July 2025 / Revised: 3 September 2025 / Accepted: 11 September 2025 / Published: 18 September 2025
(This article belongs to the Special Issue Typhoon Climatology: Intensity and Structure)

Abstract

Severe Typhoon Danas over the northern part of the South China Sea and seas near Taiwan in early July 2025 had an erratic path that had not been observed before, according to historical data in the region. Its formation, movement, and intensification posed significant challenges to the timely tropical cyclone (TC) warning services. This paper documents the observational aspect and forecasting aspect of this cyclone. There are key findings: (a) when Danas interacted with the Central Mountain Range of Taiwan, a “secondary cyclone” appeared over the northeastern part of Taiwan, which was observed by both weather radars and meteorological satellite winds, and was simulated to a certain extent by a mesoscale numerical weather prediction (NWP) model; (b) data-driven AI global models performed better than physics-based global NWP models in capturing the formation and the rather erratic track of Danas a couple of days earlier, although AI models generally underestimate the intensity forecasts; and (c) an atmosphere–ocean–wave coupled model was found to perform the best in capturing both the track changes of Danas (because of being driven by an AI global model) and its intensity changes (because of better physical representation of the oceanic impact on the intensity of this TC), whereas AI global models, though with various recent enhancements, still tended to underestimate the strength of Danas. This paper serves as a reference of this rather unusual TC for the weather forecasting services in the region.

1. Introduction

Tropical cyclones, which are circular storms that originate over warm tropical oceans, are among the most destructive weather phenomena on Earth. Six categories of tropical cyclones are defined in Hong Kong according to the maximum sustained wind speeds near the centre, with severe typhoons being the second most intense category with a maximum sustained wind between 150 and 184 km/h (81 to 99 knots, or 41.7 to 51.3 m/s) [1]. In July 2025, Severe Typhoon Danas developed near Luzon, the Philippines, and made two landfalls, one over central Taiwan and another over Zhejiang, China. It brought about significant rainfall to Taiwan and the southern part of China. Danas had a rather erratic path—it turned at a right angle/acute angle twice over the northeastern part of the South China Sea and the East China Sea. It made landfall over Jiayi, central Taiwan, from the west, which is the first time this occurred since Taiwan’s records began in 1958 [2] and left 2 people dead and 334 injured [3]. Danas and its remnants were sustained for a relatively long distance over land and moved southwestward over southern China all the way to Guangdong, China, before dissipation. Its remnant brought about heavy rainfall to the Greater Bay Area, including Hong Kong and Shenzhen, with daily rainfall of 240 mm in some places. All these features about the track and landfall position are very rare in the history of tropical cyclones (TCs) in this part of the world.
Apart from the difficulties in track forecasting, the development location of Danas and its intensification before approaching Taiwan were also challenging for operational TC warning services. The genesis, movement, and intensification of Danas were once again not captured well by the conventional physics-based global numerical weather prediction (NWP) models in their medium-range or longer forecasts. With the emerging artificial intelligence (AI) models (e.g., [4,5,6,7,8,9]), it was possible to capture the genesis, movement, and, to some extent, the intensification of Danas several days ahead, just sufficient for a timely warning to be sent out to members of the public.
Another interesting feature of Danas is its interaction with the Central Mountain Range (CMR) of Taiwan. When Danas was approaching central Taiwan from the west, a separate cyclone appeared over the central part of Taiwan to the east of the CMR, and then it moved along the CMR to the northeastern part of Taiwan before dissipation. The whole process showed up clearly in the weather radar mosaic of Taiwan. To the knowledge of the authors, this paper is the first to document such an occurrence of a separate cyclone in detail and to discuss the feasibility of simulating such a feature from NWP models. The capturing of this separate cyclone from meteorological satellite-based winds is also discussed.

2. Life of Severe Typhoon Danas

Figure 1 shows the provisional track of Severe Typhoon Danas. It formed over the northeastern part of the South China Sea on 4 July 2025. Drifting northwestwards slowly, Danas intensified into a tropical storm on that day. It made its first turn on 5 July 2025, moving northeastwards slowly across the northeastern part of the South China Sea. Danas started to pick up speed the next day and intensified into a Severe Typhoon just before making landfall over the western coast of Taiwan on the night of 6 July, reaching its peak intensity with an estimated maximum sustained wind of 85 knots (43.5 m/s) near the centre. Danas weakened when it moved across Taiwan. It entered the East China Sea and continued to move northeastwards during the day on 7 July 2025. Danas made its second sharp turn over the East China Sea on 8 July 2025, moving southwestwards towards Zhejiang, China. It made landfall again over Wenzhou, Zhejiang, on that night and continued to move inland via a southwesterly track. Danas finally degenerated into an area of low pressure over Fujian, China, on the night of 9 July 2025. The remnant of Danas continued to track southwestwards over inland Guangdong on 10–11 July 2025.

3. Past “Similar” TC Tracks for Comparison

Based on the historical best track database of the Hong Kong Observatory for TCs over the western North Pacific and the South China Sea since 1961, it is very rare for TCs to make a ≤90-degree angle change in their track over the northeastern part of the South China Sea or for TCs to make landfall over the central part of Taiwan from the west. There are no records of TCs having both features since 1961.
Figure 2a shows the TCs making a right-angle change in their tracks in the region. There are only five such past TCs. Among them, TC Amy in 1977 was already considered to be rather close to the existing track of Danas, but it did not make a sharp-angle turn again over the East China Sea to make landfall over the eastern part of China.
Figure 2b shows the TCs making landfall over central Taiwan from the west. There are only four such past TCs, and their landfall locations are quite similar to that of Danas, though not exactly over Jiayi, Taiwan.
If we look back at TC tracks before 1961 [10], it is shown that there appears to be one case that has a track quite similar to Severe Typhoon Danas in July 1920, as shown in Figure 2c. The track shows a “Z” pattern, making sharp turns twice near Taiwan, and eventually makes landfall over the eastern coast of China. However, for this cyclone, there was no landfall over Taiwan. The limited availability of surface observations, combined with the non-existence of meteorological satellite observations, casts uncertainty on the accuracy of this TC track.

4. Observational Aspect

With the availability of more surface and upper-air data over the northern part of the South China Sea and southern China, there are many interesting observations about the structure and the maximum intensity of Severe Typhoon Danas, including dropsonde and aircraft probe data, surface wind and pressure observations, vertical wind profile analysis, and radar observation. A number of noteworthy observations are selected and presented here.

4.1. Dropsonde and Aircraft Probe Data

Aircraft reconnaissance observations of Danas (and as a tropical depression beforehand) had been conducted by the Hong Kong Observatory (HKO) in collaboration with the Government Flying Service at around 03 to 05 UTC on both 4 and 5 July 2025. More background on the tropical cyclone reconnaissance flights over the South China Sea can be found in [11]. The near-surface observations from the available dropsondes are shown in the upper and middle panels of Figure 3. On 4 July 2025, Danas was still a relatively weak system and near-surface wind from a dropsonde at that time indicated that there was around 25 knots (12.7 m/s) northeasterly wind at its periphery, supporting the notion that it was a tropical depression by then. The following day, the available dropsonde observations confirmed the strong wind radius of Danas by providing near-surface wind measurements of 25 to 30 knots (12.7 to 15.2 m/s).
The radial/tangential flow from the dropsondes is analyzed for the two days, as given in the upper left panel and the upper right panel, respectively, for 4 and 5 July 2025. On both days, inflow within the atmospheric boundary layer (about 2 km above the sea surface) is not apparent for dropsondes located at latitudes to the north of the centre of Danas but is visible for dropsondes at latitudes to the south. The latter is associated with the strong southwest monsoon prevailing over the South China Sea. As such, the southwest monsoon transported moisture and momentum to the TC, supporting its further intensification.
Figure 4c shows the only available profiles of equivalent potential temperature from the dropsondes (on 5 July 2025 only). Weak instability is indicated by the CAPE values of 568.4 J/kg for dropsonde 1 and 489.0 J/kg for dropsonde 3. The atmospheric boundary layer is found to be unstable, supporting the further intensification of Danas over the northeastern part of the South China Sea.
Apart from dropsondes, the aircraft is also equipped with a meteorological measuring probe to provide in situ data. Figure 5 and Figure 6 show the measurement results for the flights of 4 July 2025 (only the earlier part of the flight is available) and 5 July 2025 (whole flight is available), respectively. Here, the turbulent kinetic energy (TKE) and eddy dissipation rate (EDR) are calculated as
T K E = 1 2 σ u 2 + σ v 2 + σ w 2
ε = α u 3 / 2 2 π n U a n S u n 3 / 2
where σu, σv, and σw are the standard deviations of along-wind, cross-wind, and vertical wind velocity components. αu is the Kolmogorov constant for the along-wind velocity component, taken as 0.5. Ua is the true air speed, and Su(n) is the along-wind velocity spectrum at the frequency n in the inertial subrange with a slope of −5/3, which covers 0.4–4 Hz for the flight data analyzed here.
On 4 July 2025, the turbulence was weak when the aircraft was closest to the tropical depression, with the eddy dissipation rate (EDR) reaching about 0.1 m2/3s−1 only. The EDR and the turbulent kinetic energy (TKE) are closely correlated, as also found in previous observations of other TCs (e.g., [12]). The following day, Danas had further developed, and the flow became more turbulent even when the aircraft was located at about a couple of hundred kilometres from the TC’s centre and at a height of about 10 kilometres above the sea surface. EDR is found to reach 0.4 m2/3s−1 with the maximum TKE at about 5 m2s−2.
It is noted from Figure 6 that the more turbulent flow occurred in the period of 3:40 UTC to 4:00 UTC, when both the vertical and the horizontal winds show significant fluctuations and the relative humidity (RH) is much higher. Before and after that period, the RH is much lower, staying at about 20% only. The flight path of the aircraft on that day, with the aircraft flying at around 10 kilometres above the sea surface, is shown in Figure 3c, together with the time marks. It seems from the meteorological satellite image that the aircraft was located within the major cloud band wrapping into the TC centre around that time. Before and after that, the aircraft seemed to be located at the outer rainbands, which may not have developed to the height of the aircraft, and as such, the RH is much lower.

4.2. Surface Observations During Landfall on Taiwan

From the weather radar mosaic picture of Taiwan, Danas maintained the structure of a mature TC when it was about to make landfall over the central part of Taiwan. As such, the island and buoy observations just offshore of central Taiwan provided valuable information about the maximum strength of Danas. The weather radar mosaic at about the time of landfall, together with the surface observations, is shown in Figure 7. Gale force (red wind barb), storm force (pink wind barb) and hurricane force (orange wind barb) winds were recorded by the island stations and buoys just offshore of the western coast of Taiwan. The minimum surface pressure and the maximum surface wind strength were recorded at Dongji Island, reaching 971.9 hPa and 39.1 m/s (10 min mean wind) (or 76 knots), respectively, as shown in Figure 7b and Figure 7c. The sea wave is not particularly high, reaching 8.1 metres at the buoy in that region (Figure 7d).

4.3. Vertical Wind Profile Analysis

The only available wind profiler data come from Dongsha and the southeastern coast of China, and station 58,944 (location in Figure 7a) is shown in Figure 8 as an example. For both Dongsha station and station 58,944, low-level jet is analyzed at a height of about 700 m above mean sea level, with a wind strength of nearly 18 to 20 m/s (35 to 39 knots) (Figure 8a,c), when Danas was located to the southeast of Dongsha and in the vicinity of Taiwan, respectively. They are not the only examples. Basically, the available wind profiler data along the southeastern coast of China show this low-level jet at about this height, but with different wind strength, though the winds mainly come from the inland area (northeasterly wind when Danas is located near Taiwan). The low-level jet is an important channel to transport moisture, vorticity, and momentum for the intensification of tropical cyclones [13]. The vertical wind profiles are fitted with both logarithmic and power laws, and the fittings are satisfactory (Figure 8b,d). Such information would be useful for wind engineering applications for building design under the influence of TCs.
It is also noted that, at Dongsha, there was another jet at a height of about 8 km. This was the strong northeasterly wind associated with the upper-air outflow of Danas when the latter was developing over there at the periphery of an upper-air cold low. The outflow enhances the upper-air divergence, which facilitates the intensification of the tropical cyclone.

4.4. Occurrence of Another Cyclone in the Northeastern Part of Taiwan

When Danas was approaching central Taiwan, there was a rainband to the east of the CMR due to orographic lifting. From the weather radar images, this north–south-oriented line of convection appears to “wrap up” over the central part of Taiwan, and the wrapping continues with the whole rainband moving towards the northern part of Taiwan, eventually taking the form of a cyclone (Figure 9a). To the knowledge of the authors, this is the first time that such a “secondary cyclone” over the northeastern part of Taiwan has been documented, with a mature TC approaching central Taiwan. It has been pointed out by [14] that when there is a tropical cyclone located to the southwest of Taiwan, it would be possible for a low-pressure area to appear in the northeastern part of Taiwan, based on historical records. However, the detailed evolution process of the low-pressure area has not been documented in that paper.
The multiple Doppler weather radar data are also combined to produce the wind field over Taiwan, with heights of 1 km up to 10 km above sea level. An example of the 2D wind field at a height of 3 km is shown in Figure 9b. The 2D wind field at this height clearly shows the circulation of both Danas itself and the “secondary cyclone” at about 24.5 degrees north, to the east of the CMR of Taiwan.
Other data sources were checked for the observation of this “secondary cyclone”, and the satellite-based MIRS winds were considered [15]. Two snapshots of MIRS wind (at a height of 3 km above sea level) are shown in Figure 10. The MIRS winds also depict this cyclone to the east of CMR, originally near the central part of Taiwan and then moving to the northeastern part of Taiwan.
The dynamics of the occurrence of this “secondary cyclone” should be studied in future papers. The prerequisite is the possibility of simulating this “secondary cyclone” by a high-resolution numerical weather prediction model. In this regard, the 3 km horizontal resolution of a Tropical Regional Atmospheric Modelling System (TRAMS) [16] is used, and the model result based on the 00 UTC run of 6 July 2025 is shown in Figure 11. For the 6 h forecast, there is a signature of the “secondary cyclone” to the east of the CMR near central Taiwan. It moved to the north in the next 5 h and was no longer visible starting at about 12 UTC on that day. However, the spatial extent of the simulated “secondary cyclone” is not as extensive as the actual observations, e.g., based on the MIRS wind.
There are many discussions about this “secondary cyclone” in the scientific community. There is a conjecture that this “cyclone” helps “drag” Danas to the east, so that the TC eventually makes landfall over central Taiwan from the west. This point may need to be further studied by conducting numerical weather prediction simulations with and without the CMR. However, from the available AI model results, such a “secondary cyclone” is not apparent (possibly due to lower spatial resolution of AI models, with horizontal resolution of 10 to 25 km only), but some of these models still forecast the landfalling of Danas near central Taiwan from the west due to the steering by the 500 hPa anticyclone to the south of the TC. As such, the “eastward dragging” effect of this “secondary cyclone” is questionable.

5. Forecasting Aspect

Danas presents significant challenges to the TC warning service due to difficulties in capturing its formation (genesis within a broad area of low pressure near Luzon, the Philippines), movement (two sharp turns), and intensification (when Danas was heading to central Taiwan). These challenges are particularly pronounced for physics-based global NWP models and further highlight that AI models may outperform NWP models in operational TC forecasting. HKO began real-time trial operation of various AI global models in mid-2023 for reference in operational forecasting. These AI models include AIFS [9], Aurora [5], Fengqing, Fengwu [6], Fuxi [7], Graphcast [8], and Pangu-Weather [4]. Such AI or data-driven models are trained on decades of global reanalysis data, enabling them to learn intricate atmospheric patterns directly from data and often yielding lower RMSE and higher ACC for key fields like geopotential height or surface pressure in the medium-range forecasts. More recently, there have been continued developments and advancements in AI model techniques, such as enabling higher-resolution (~0.09°) global forecasting, which showed potential for capturing finer-scale dynamics and more realistic representations of storms [17].

5.1. Area of Development of a TC

As an example, the 48 h and 72 h surface pressure and wind forecasts of the European Centre for Medium-Range Weather Forecasts (ECMWF) Integrated Forecasting System (IFS) based on a 12 UTC, 30 June 2025 run are shown in Figure 12a and Figure 12b, respectively. This timing is close to when Danas was about to develop over the seas in the vicinity of Luzon. However, IFS fails to indicate any signs of the formation of a tropical cyclone, which subsequently intensifies. Similar observations are found in other physics-based models. There are deficiencies in TC genesis forecasts in NWP models in the medium range (around or more than 3 to 5 days in advance), as observed in many TC cases over the western North Pacific and the South China Sea during the TC season of 2024.

5.2. Track Forecast

The sequence of TC forecast tracks by NWP models and AI models based on 12 UTC forecasts of 30 June up to 4 July 2025 is shown in Figure 13. As early as 30 June 2025 (Figure 13a), NWP models suggest a TC may form and move across the western north Pacific. At that time, AI models suggest that the TC, once formed, is expected to enter the South China Sea, but it was expected to reach the western coast of Guangdong by then. The following day (Figure 13b), a majority of the AI models started to get it right for the 90-degree track change over the northeastern part of the South China Sea for this TC, whereas NWP models were still forecasting the scenario of moving across the western North Pacific. The NWP models began to become more consistent with the actual track on 2 and 3 July 2025 (Figure 13c,d). Eventually, all models aligned in their forecasts of 4 July (Figure 13e).
The root-mean-square errors (RMSEs) of the TC track by the various models are shown in the upper panel of Figure 14. Consistent with previous observations, the track errors of NWP models are, in general, much higher than those of AI models in the medium range (72 h or longer). As illustrated in Figure 13, the various AI models can be considered as a multi-model ensemble. In this case, while the majority of the AI models could not depict the 90-degree track change over the northeastern part of the South China Sea in their earlier forecasts (Figure 13a), a certain model (e.g., Aurora in the 12 UTC forecast on 30 June 2025) did give very useful information on the possible scenario. This highlights the importance of considering multiple models.

5.3. Intensity Forecast

On the other hand, despite significant advancements in AI models in the last couple of years, these models still have difficulties in forecasting the intensity of TCs. The time series of forecasting and the actual wind strength of Danas are shown in Figure 15, as an example (with the initial time of 12 UTC, 3 July 2025), and the RMSEs of the central pressure forecast of various models are shown in the lower panel of Figure 16.
Danas underwent rapid intensification from 15 UTC on 4 July to 15 UTC on 6 July, during which an intensity gain of 25 to 30 knots (12.7 to 15.2 m/s) occurred in 24 h over the South China Sea. It can be seen from Figure 15 that the mesoscale NWP models were better than the global NWP models in capturing the intensification of Danas. In particular, the atmosphere–ocean–wave coupled model [18] appears to have captured the changes in the TC intensity well, both intensification and weakening, for several days ahead. As pointed out in [18], the coupled model, taking Pangu-Weather’s model output as initial conditions and lateral boundary conditions, appears to have the advantages of obtaining more accurate forecasts of both TC track and intensity. The TRAMS model and the Weather Research and Forecasting (WRF) model also performed well in their intensity forecasting of Danas. From the RMSEs (lower panel of Figure 14), the AI models, in general, still have an average error of 20 to 40 knots (10.1 to 20.4 m/s), whereas the physics-based NWP models have an average error of 10 to 30 knots (4.9 to 15.2 m/s). The NCEP model of NOAA performed well in intensity forecasting because it tends to predict the faster intensification of TCs in this region, but its track error was rather large (e.g., from Figure 13).
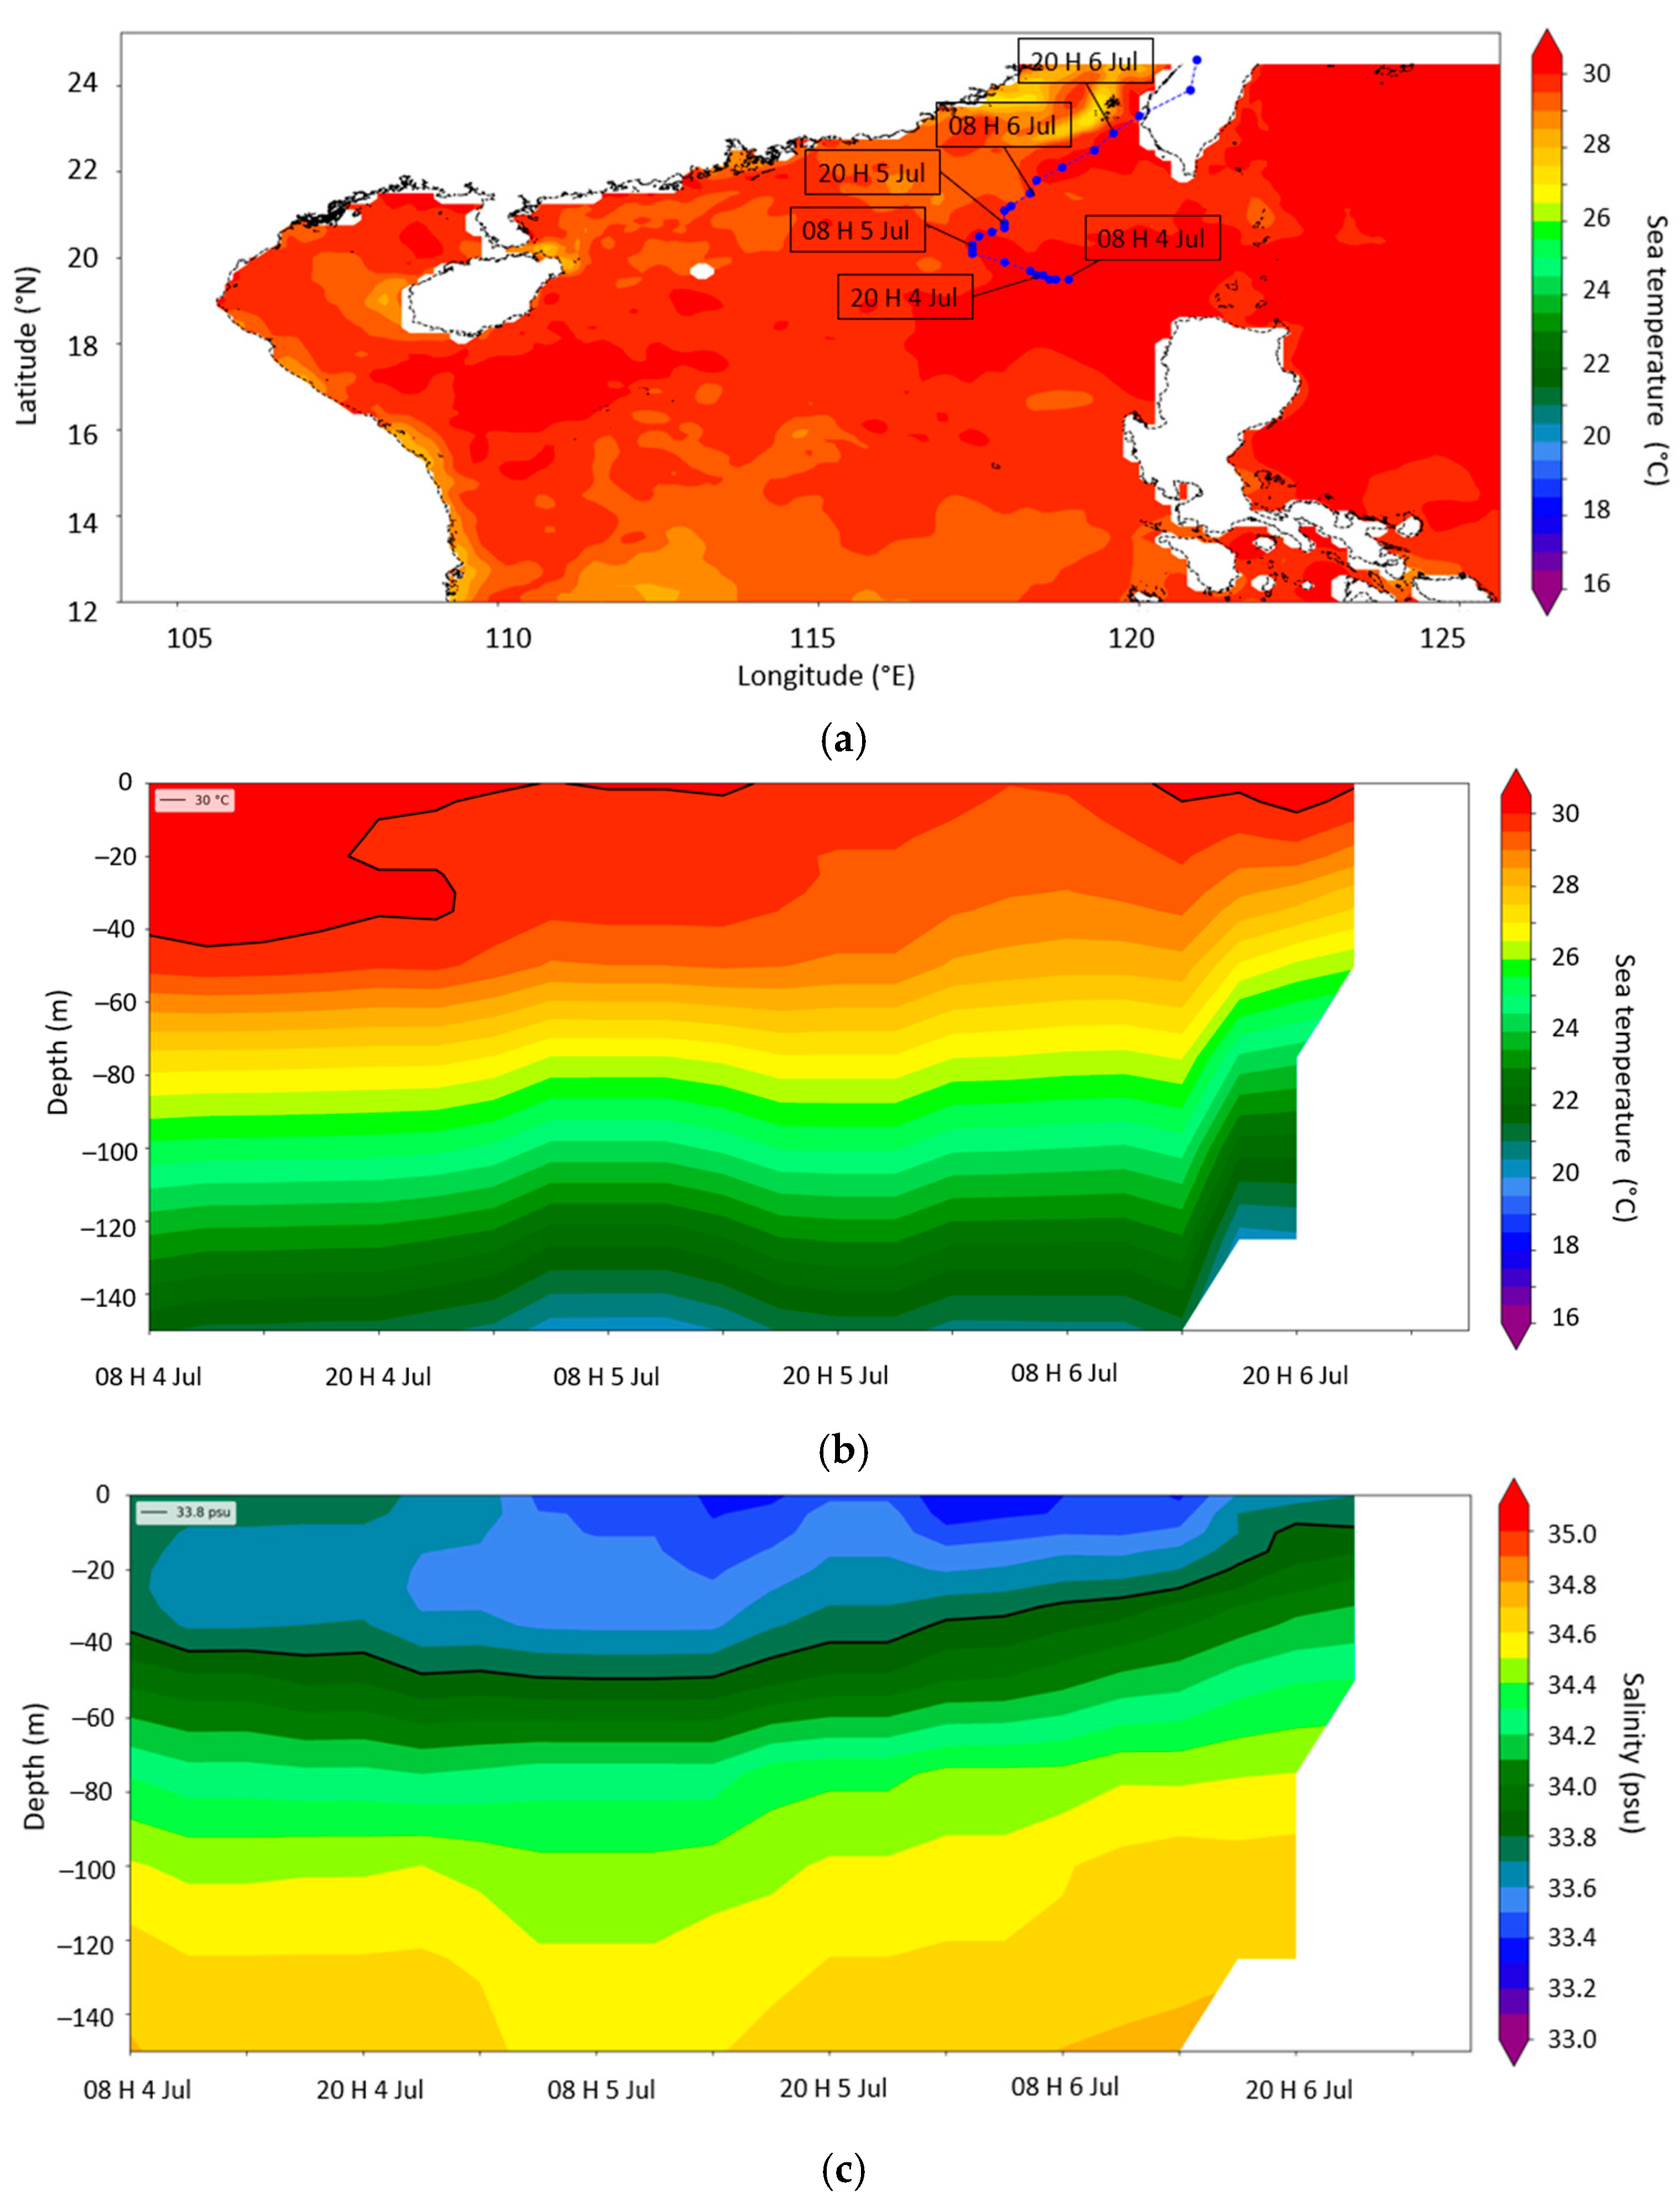
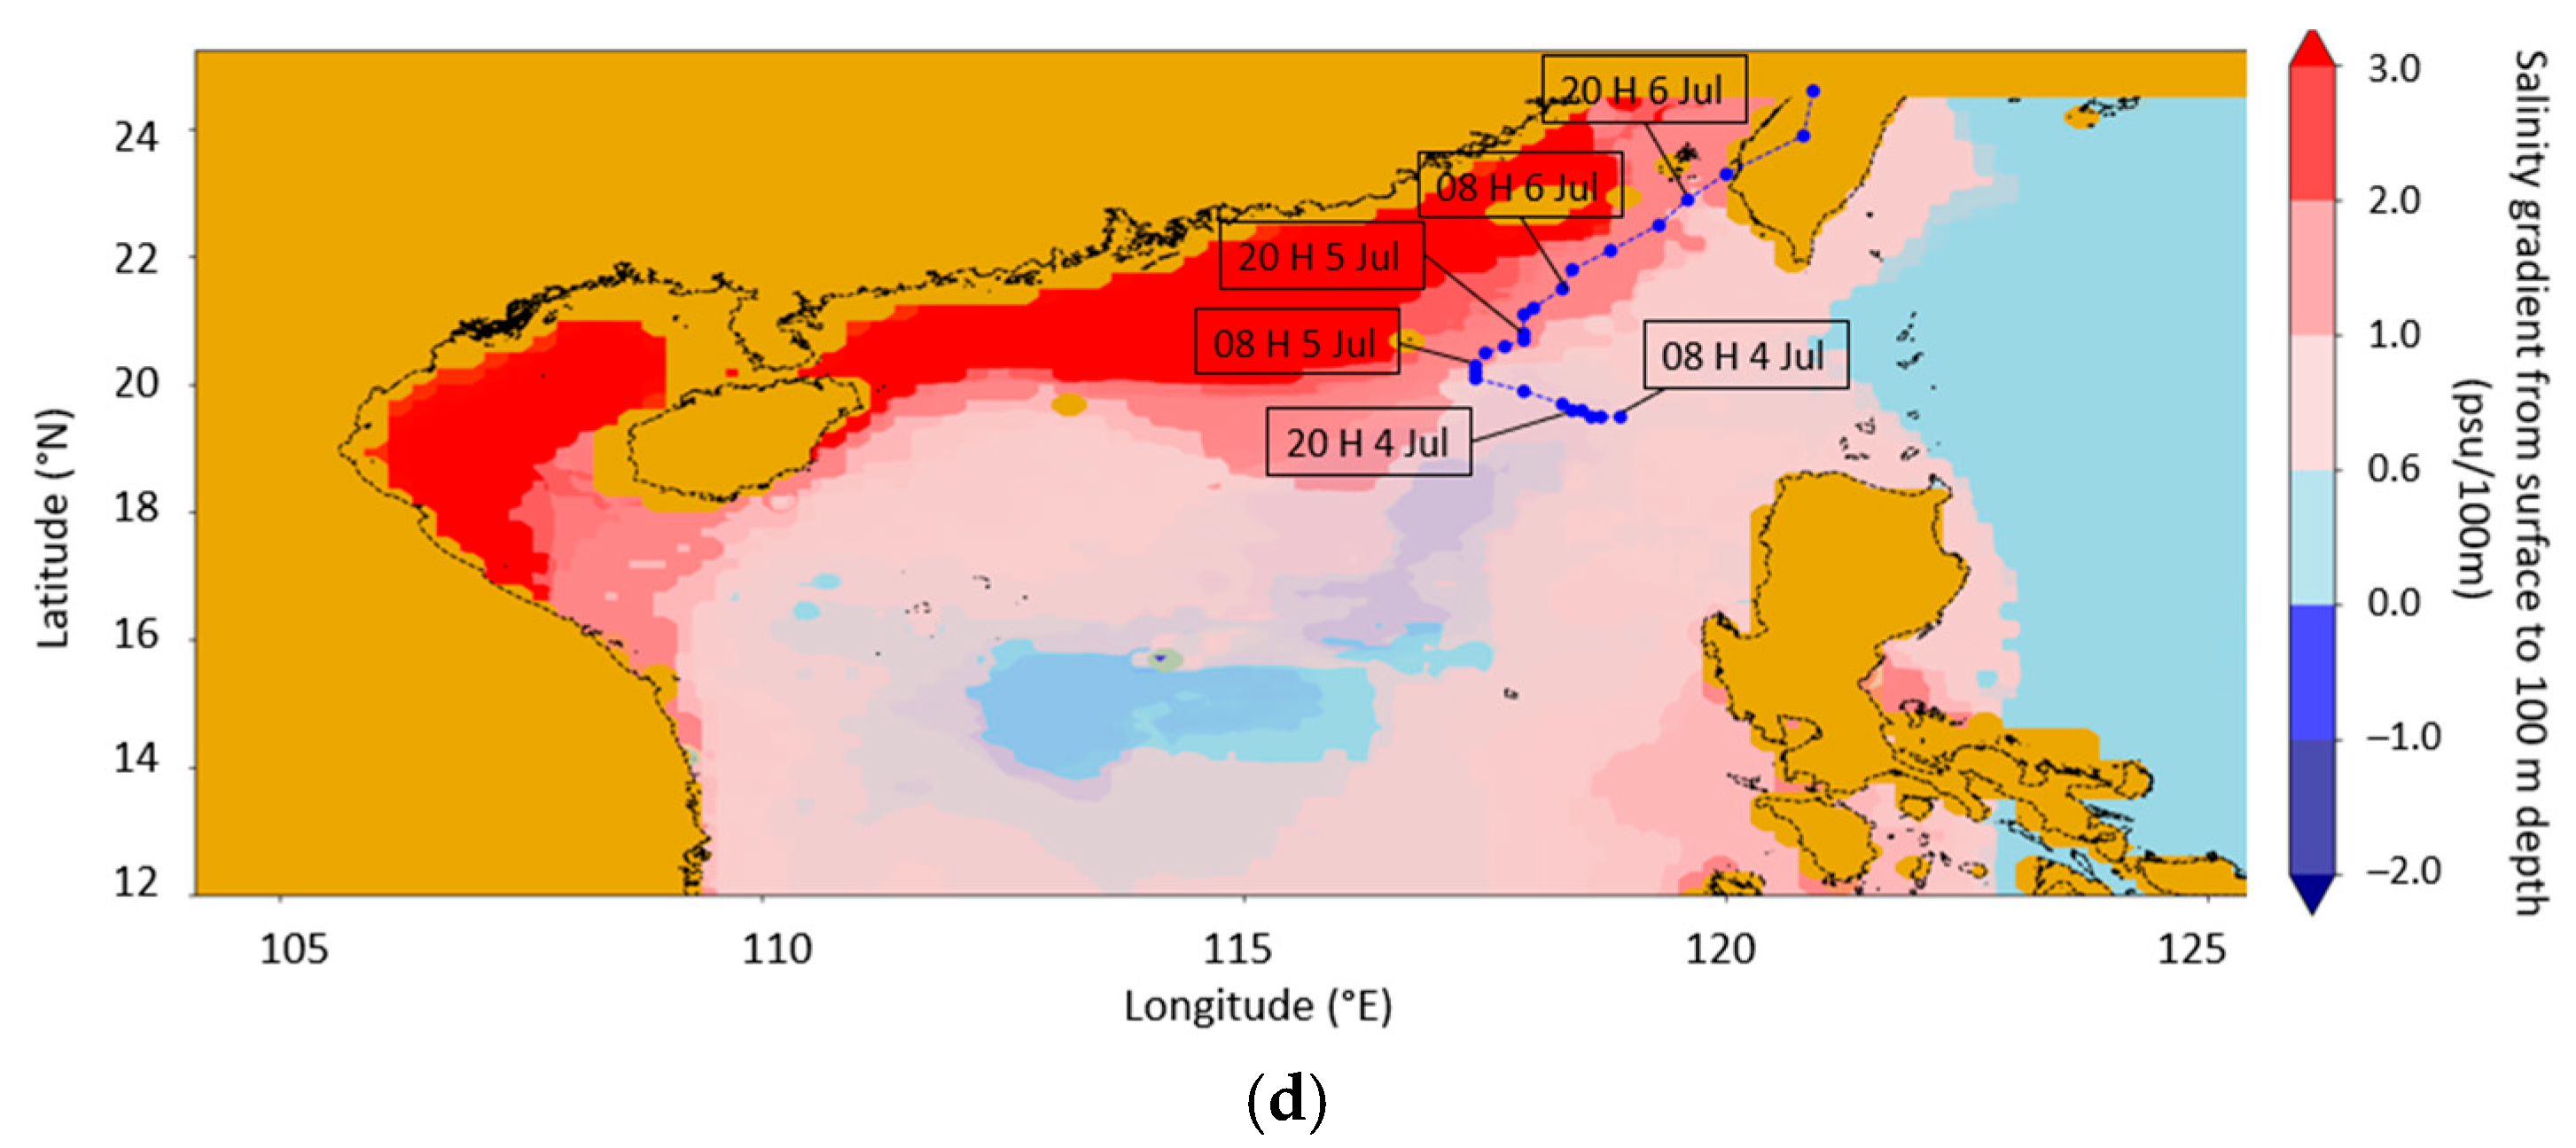
The sea temperatures and salinity along the TC track are again inspected to see if they give an earlier indication of rapid intensification of Danas while approaching Taiwan. Checking against the quantitative reference values as suggested in the study by [19]—based on the daily ocean analysis data from the China Ocean Real-Time Analysis (CORTA) 2.0 of the National Marine Data and Information Service (NMDIS) and the Key Laboratory of marine Environment Information Assurance Technology of the State Oceanic Administration of China—the relevant plots are shown in Figure 16. Relatively high sea temperatures of 30 °C or above were found for a depth as deep as 40 m along the track of Danas on 4 July 2025. Although sea temperatures fell below 30 °C in the upper layer, there was still a deep 60 m layer of temperatures more than 28 °C over the northeastern part of the South China Sea on 6 July 2025. The sea surface salinity was also at a rather low value of 33.8 psu or below for a depth of 40 m, and there was a relatively strong salinity stratification of at least 1 psu per 100 m of water depth. This stable layer was expected to inhibit vertical mixing of the cooler seawater into the layer of the first 40 m or so until 6 July 2025. As such, the rather high surface layer of sea temperatures was basically maintained, which favoured the rapid intensification of Danas. The conditions of sea temperatures and salinity were all met as suggested in the study by [19] for rapid intensification from thermodynamics considerations. These quantitative references are useful for the operational forecasting of rapid intensification of TCs over the South China Sea. They can be used to supplement the deficiency of model intensity forecast for the time being.
The vertical profile of sea temperature change along the TC track when Danas moved across Taiwan (00 UTC 7 July 2025), as compared with its formation over the Luzon Strait at 00 UTC 4 July 2025, is given in Figure 17a. It showed that sea temperatures dropped over a depth of about 60 m with a maximum of nearly 1 °C when Danas commenced its RI process over the northeastern part of the SCS on 5 July 2025 and the drop extended to a depth of about 150 m, while the salinity generally increased over a depth of 60 m with a maximum of nearly 0.1 psu over the region (Figure 17b). This was believed to be the result of heat flux transfer from the ocean to the atmosphere to support the rapid development of Danas and the sea overturning effect, possibly associated with strong deep convection in the upper layer of the ocean.

6. Conclusions

Danas exhibited an erratic track over the northeastern part of the South China Sea. Its development and intensification are also challenging for TC warning services. This paper summarizes a number of observational and forecasting aspects of Danas. On the observation side, the appearance of a “secondary cyclone” over northeastern Taiwan requires further study. On the forecasting side, it is again confirmed that AI models are superior in the earlier indication of the formation, movement, and intensification of TCs. NWP models tend to have much larger errors in and beyond the medium range (longer than around 3 days).
TC warning services are much more improved in this region, thanks to the availability of more observations (e.g., dropsondes, wind profilers, and satellite winds) and forecasting tools (e.g., coupled mesoscale model and global AI models). However, there is an increasing demand for a more accurate TC warning service several days in advance. Despite these advancements, observational data remained very limited, particularly for surface and upper-air observations over the vast South China Sea. The weather radar coverage is limited over the northern part of the South China Sea, just at the maximum range (around 500 km) of the coverage of the weather radars from Hong Kong and Taiwan. Determining the TC strength and location of the centre is still difficult in that region, particularly when the TC is developing and the centre is covered by high clouds. The separation of weather buoys/oil rig weather stations at the surface is in the order of a couple of hundred kilometres, which is not dense enough for TC location and strength determination. Upper-air observations are lacking (no wind profilers over oil rigs), and they are available in limited amounts from dropsondes (which take time to arrange and have spatial limitations due to air space management). All these limitations pose significant challenges for an earlier warning and monitoring of TCs in this part of the world.
Statistical analysis of the performance of AI models and ocean observational data (e.g., sea temperatures and salinity) for TC forecasting would also be required when the number of TC cases begins to build up. Right now, they are subject to suspicion, especially when there are significant differences in the forecasting scenarios between AI models and NWP models. Higher confidence in warning strategies can only be formulated when the two sets of models begin to converge, which may occur only a few days before landfall. At times, earlier warning strategies must rely more heavily on AI models alone. The convergence of two sets of models may only happen a few days before the TC makes landfall. Sometimes, an earlier warning strategy has to be formulated with more weight being put on AI models alone. So far, AI models are still performing well for TCs in this part of the world, but it is subject to further research efforts. It is still a very challenging issue for TC warnings for the South China Sea.

Author Contributions

Conceptualization, P.-W.C.; formal analysis, C.-W.C., P.C., C.-C.L. and Y.-H.H.; writing—original draft preparation, P.-W.C.; writing—review and editing, C.-W.C.; visualization, C.-K.H. and J.-Y.H.; All authors have read and agreed to the published version of the manuscript.

Funding

This research received no external funding.

Institutional Review Board Statement

Not applicable.

Informed Consent Statement

Not applicable.

Data Availability Statement

Due to confidentiality agreements, supporting data can only be made available to bona fide researchers subject to a non-disclosure agreement. Details of the data and how to request access are available from the corresponding author.

Acknowledgments

The authors would like to thank the Guangdong Meteorological Service for providing TRAMS model data used in this study. Thanks are also extended to the National Marine Data and Information Service of Ministry of Natural Resources of China for providing sea temperature and salinity analysis data over the South China Sea and the western North Pacific from the China Ocean Real-Time Analysis (CORTA) 2.0 in support of evaluation of intensity forecast in this study.

Conflicts of Interest

The authors declare no conflict of interest.

References

  1. Hong Kong Observatory. Classification of Tropical Cyclones. 2025. Available online: https://www.hko.gov.hk/en/informtc/class.htm (accessed on 30 August 2025).
  2. Jian, G.J.; Teng, J.H.; Wang, S.T.; Cheng, M.D.; Chen, J.H.; Chu, Y.J. An overview of the tropical cyclone database at the Central Weather Bureau of Taiwan. Terr. Atmos. Ocean. Sci. 2022, 33, 26. [Google Scholar] [CrossRef]
  3. Focus Taiwan. Two Dead, Over 300 Injured as Storm Danas Sweeps Taiwan. 2025. Available online: https://focustaiwan.tw/society/202507070008 (accessed on 16 July 2025).
  4. Bi, K.; Xie, L.; Zhang, H.; Chen, X.; Gu, X.; Tian, Q. Accurate medium-range global weather forecasting with 3D neural networks. Nature 2023, 619, 533–538. [Google Scholar] [CrossRef] [PubMed]
  5. Bodnar, C.; Bruinsma, W.P.; Lucic, A.; Stanley, M.; Allen, A.; Brandstetter, J.; Garvan, P.; Riechert, M.; Weyn, J.A.; Dong, H.; et al. A foundation model for the Earth system. Nature 2025, 641, 1180–1187. [Google Scholar] [CrossRef] [PubMed]
  6. Chen, K.; Han, T.; Gong, J.; Bai, L.; Ling, F.; Luo, J.-J.; Chen, X.; Ma, L.; Zhang, T.; Su, R.; et al. FengWu: Pushing the skillful global medium-range weather forecast beyond 10 days lead. arXiv 2023, arXiv:2304.02948. [Google Scholar] [CrossRef]
  7. Chen, L.; Zhong, X.; Zhang, F.; Cheng, Y.; Xu, Y.; Qi, Y.; Li, H. FuXi: A cascade machine learning forecasting system for 15-day global weather forecast. Npj Clim. Atmos. Sci. 2023, 6, 190. [Google Scholar] [CrossRef]
  8. Lam, R.; Sanchez-Gonzalez, A.; Willson, M.; Wirnsberger, P.; Fortunato, M.; Alet, F.; Ravuri, S.; Ewalds, T.; Eaton-Rosen, Z.; Hu, W.; et al. GraphCast: Learning skillful medium-range global weather forecasting. arXiv 2023, arXiv:2212.12794. [Google Scholar] [CrossRef]
  9. Lang, S.; Alexe, M.; Chantry, M.; Dramsch, J.; Pinault, F.; Raoult, B.; Clare, M.C.A.; Lessig, C.; Maier-Gerber, M.; Magnusson, L.; et al. AIFS—ECMWF’s data-driven forecasting system. arXiv 2024, arXiv:2406.01465. [Google Scholar] [CrossRef]
  10. Royal Observatory: Monthly Meteorological Bulletin in 1920; Royal Observatory: Hong Kong, 1920; p. 24.
  11. Hon, K.K.; Chan, P.W. A decade (2011–2020) of tropical cyclone reconnaissance flights over the South China Sea. Weather 2022, 77, 308–314. [Google Scholar] [CrossRef]
  12. He, J.; Li, Q.; Chan, P.-W.; Choy, C.-W.; Mak, B.; Lam, C.-C.; Luo, H.-Y. An observational study of Typhoon Talim over the northern part of the South China Sea in July 2023. Atmosphere 2023, 14, 1340. [Google Scholar] [CrossRef]
  13. Chen, L.-S. Research progress on the structure and intensity change for the landfalling tropical cyclones. J. Trop. Meteorol. 2012, 18, 113–118. [Google Scholar] [CrossRef]
  14. Gong, Y.; Ying, L.; Zhang, D. A Statistical Study of Unusual Tracks of Tropical Cyclones near Taiwan Island. J. Appl. Meteorol. Climatol. 2018, 57, 193–206. [Google Scholar] [CrossRef]
  15. NOAA. Microwave Integrated Retrieval System (MIRS) System Description Document, Version 1.11, 83 Pages. 2014. Available online: https://www.star.nesdis.noaa.gov/mirs/documents/documentation/doc_v11r3/MIRS_System_Description_Document.pdf (accessed on 22 July 2025).
  16. Xu, D.; Liang, J.; Lu, Z.; Zhang, Y.; Huang, F.; Feng, Y.; Zhang, B. Improved Tropical Cyclone Forecasts with Increased Vertical Resolution in the TRAMS Model. J. Trop. Meteorol. 2022, 28, 377–387. [Google Scholar]
  17. Han, T.; Guo, S.; Ling, F.; Chen, K.; Gong, J.; Luo, J.; Gu, J.; Dai, K.; Ouyang, W.; Bai, L. FengWu-GHR: Learning the Kilometer-scale Medium-range Global Weather Forecasting. arXiv 2024, arXiv:2402.00059. [Google Scholar]
  18. Lai, S.K.; Chan, P.W.; He, Y.; Chen, S.S.; Kerns, B.W.; Su, H.; Mo, H. Real-time operational trial of atmosphere–ocean–wave coupled model for selected tropical cyclones in 2024. Atmosphere 2024, 15, 1509. [Google Scholar] [CrossRef]
  19. Chan, P.-W.; Lam, C.-C.; Hui, T.-W.; Gao, Z.; Fu, H.; Sun, C.; Su, H. The effects of upper-ocean sea temperatures and salinity on the intensity change of tropical cyclones over the Western North Pacific and the South China Sea: An Observational Study. Atmosphere 2024, 15, 674. [Google Scholar] [CrossRef]
Figure 1. Provisional track of Severe Typhoon Danas on 4–9 July 2025. The numbers in the figure refer to the date at 00 UTC, for example, 5 represents the 5th of July.
Atmosphere 16 01099 g001
Figure 2. (a) Historical tracks of TCs making turns of ≤90 degrees over the northeastern part of the South China Sea and the numbers of the track represents year of the tropical cyclone, for example, 1962 Kate represents TC Kate in year 1962; (b) historical tracks of TCs making landfall over central part of Taiwan from the west from 1961 to 2024; (c) excerpt from the Monthly Meteorological Bulletin in 1920 showing a manually sketched “Z” track of a typhoon in July 1920, with two sharp turns near Taiwan before landfall on the eastern coast of China.
Atmosphere 16 01099 g002
Figure 3. Aircraft observations for Danas. (a) Dropsonde wind observations near the surface at 04:55 UTC on 4 July 2025. The blue circle shows the strong wind radius given in the HKO shipping warnings; (b) dropsonde wind observations near the surface at 05:21 UTC on on 5 July 2025; (c) wind measurements from the weather probe on board the aircraft during the dropsonde mission at 0400 UTC on 5 July 2025. The aircraft maintained an altitude of around 10 km during the flight path shown, and the positions at different times are marked on the figure. Winds exceeding 11.4 m/s and 17.4 m/s are represented by blue and red barbs respectively.
Atmosphere 16 01099 g003
Figure 4. Plots of dropsonde vertical profiles relative to the centre of Danas. (a) Tangential (red) and radial (blue) wind speeds on 4 July 2025; (b) tangential (red) and radial (blue) wind speeds on 5 July 2025; (c) profiles of potential temperature (red) and equivalent potential temperature (blue) for observation on 5 July 2025.
Atmosphere 16 01099 g004
Figure 5. Time series of the (a) wind speed, (b) wind direction, (c) vertical wind speed, (d) turbulent kinetic energy (TKE), (e) cube root of the eddy dissipation rate (ε (cube root of eddy dissipation rate)), (f) variation in ε with TKE, (g) air temperature, (h) relative humidity, (i) flight altitude, and (j) distance to storm centre based on the aircraft data in the tropical depression between 01:20 and 03:20 UTC 4 July 2025. The black line in (f) represents the linear fit between ln(ε) and ln(TKE).
Atmosphere 16 01099 g005aAtmosphere 16 01099 g005b
Figure 6. Time series of the (a) wind speed, (b) wind direction, (c) vertical wind speed, (d) turbulent kinetic energy (TKE), (e) cube root of the eddy dissipation rate (ε1/3), (f) variation in ε with TKE, (g) air temperature, (h) relative humidity, (i) flight altitude, and (j) distance to storm centre based on the aircraft data in Tropical Storm Danas between 03:00 and 04:40 UTC on 5 July 2025. The black line in (f) represents the linear fit between ln(ε) and ln(TKE).
Atmosphere 16 01099 g006aAtmosphere 16 01099 g006b
Figure 7. (a) Surface wind observations (overlaid on the weather radar image in the background) around Danas at 14 UTC (22 HKT) on 6 July 2025 Winds exceeding 11.4 m/s and 17.4 m/s are represented by blue and red barbs respectively; (b) 24 h time series of mean sea level pressure (MSLP) recorded at Dongji Island on 6 July 2025; (c) 24 h time series of 10 min mean wind speed and direction recorded at Dongji Island on 6 July 2025; (d) 24 h time series of significant wave height and wave/swell direction recorded at a buoy at 23.18 N, 119.67 E. Location of wind profiler at station 58,944 (25.54 N, 119.81 E) is indicated by a black star.
Atmosphere 16 01099 g007aAtmosphere 16 01099 g007b
Figure 8. (a) Vertical wind profiles at the Dongsha station from 0000 UTC, 4 July 2025 to 2300, UTC 7 July 2025, stratified by the lowest-level (150 m) wind speed (Dot: mean; error bar: standard deviation); (b) vertical wind profiles fitted with logarithmic and power law; (c) vertical wind profiles at station 58,944 (location at 25.54 N, 119.81 E, shown in Figure 7a) between 16 UTC on 4 July 2025 and 23 UTC on 7 Jul 2025, stratified by the lowest-level wind speed (Dot: mean; error bar: standard deviation; N: number of samples); (d) vertical wind profiles fitted with logarithmic and power law.
Atmosphere 16 01099 g008
Figure 9. (a) Weather radar image at 11 UTC on 6 July 2025; (b) 2-D radar wind field at 3 km over Taiwan at 08:30 UTC on 6 July 2025.
Atmosphere 16 01099 g009
Figure 10. Microwave Integrated Retrieval System (MIRS) wind (at a height of 3 km above sea level) at (a) 09 UTC and (b) 15 UTC on 6 July 2025.
Atmosphere 16 01099 g010
Figure 11. Surface pressure and wind forecast at (a) 00 UTC, (b) 06 UTC, (c) 11 UTC, and (d) 14 UTC on 6 July 2025, based on 3 km horizontal resolution of Tropical Regional Atmospheric Modelling System (TRAMS), initialized at 00 UTC on 6 July 2025. The colour shading refers precipitation.
Atmosphere 16 01099 g011
Figure 12. (a) 48 h and (b) 72 h surface pressure and wind forecasts of the European Centre for Medium-Range Weather Forecast (ECMWF), initialized at 12 UTC, 30 June 2025.
Atmosphere 16 01099 g012
Figure 13. TC track forecast by NWP models (ECMWF, JMA, NCEP and UKMO) and AI models (Pangu-EC, Fengwu-EC, Fuxi-EC, Graphcast-EC, EC-AIFS, Fengqing-EC and Aurora-EC) based on 12 UTC forecast on (a) 30 June 2025; (b) 1 July 2025; (c) 2 July 2025; (d) 3 July 2025, and (e) 4 July 2025.
Atmosphere 16 01099 g013
Figure 14. Root-mean-square error of models’ forecast positions (upper) and maximum winds (lower) for Danas as a function of lead time. Forecasts are verified against the operational analyses at HKO and homogenized to have a consistent number of cases across each lead time among models. It should be noted that the sample size with this statistical analysis is limited to this single TC.
Atmosphere 16 01099 g014
Figure 15. Time series of intensity forecast (up to 144 h) of Danas by global NWP models and mesoscale NWP models, with the initial time of 12 UTC, 3 July 2025. Actual intensity of Danas is in black triangles. The labels for the other models could be found at the top of the figure.
Atmosphere 16 01099 g015
Figure 16. (a) The HKO’s TC warning track of Danas overlaid on the sea surface temperature distribution on the day of its formation on 4 July 2025. A snapshot of the vertical profile taken on the same day showing (b) sea temperatures and (c) salinity over a sea depth of about 150 m along the TC track at different times. (d) The TC track overlaid on the distribution of salinity gradient on the same day.
Atmosphere 16 01099 g016aAtmosphere 16 01099 g016b
Figure 17. (a) Vertical profile of change in (a) sea temperature and (b) salinity over the HKO’s TC warning track of Danas from 00 UTC 4 July to 00 UTC 7 July 2025 (i.e., difference in the analysis between these two time shots). The location of Danas corresponding to different times in the x-axis can be referred to in Figure 16a.
Atmosphere 16 01099 g017
Disclaimer/Publisher’s Note: The statements, opinions and data contained in all publications are solely those of the individual author(s) and contributor(s) and not of MDPI and/or the editor(s). MDPI and/or the editor(s) disclaim responsibility for any injury to people or property resulting from any ideas, methods, instructions or products referred to in the content.