Abstract
This paper presents findings based on eighty (80) lightning-caused wildfires that occurred on Mount Mainalo, in central Peloponnese, Greece, from May 1998 to November 2022. The frequency of lightning-caused wildfires was found to increase in July and August, consistent with the occurrence of dry summer thunderstorms. Most wildfires ignited in the southern part of the mountain, at elevations between 1200 and 1800 m, and were primarily detected in the afternoon hours. We present spatial data, statistics and frequency distribution histograms of subsets of the database. The likelihood of at least one fire per season is approximately 96%, while the average number of wildfires per fire season is 3.2. These findings on the number of lightning-caused wildfires per year, the holdover time (the time interval between the ignition and fire detection), the wildfire detection time, the elevation of lightning-caused wildfire occurrence, the total annual burned area and the burned area per fire can support improving wildfire management in the region since they provide a thorough description of the regime of lightning-caused wildfire on Mount Mainalo. This research addresses a critical knowledge gap in the study of lightning-caused wildfires in the Mediterranean, which remain underexplored despite their growing relevance under climate change.
1. Introduction
Lightning is the most significant natural cause of forest fires (hereafter referred to as wildfires) globally, whereas other causes, such as volcanic activity and sparks from falling rocks, are extremely rare [1,2,3]. While lightning is responsible for approximately 10% of all wildfires worldwide [4], its impact is much greater in certain ecosystems. In Canada, for example, lightning-caused wildfires make up about half of all wildfire occurrences and are responsible for 90% of the total area burned [5]. Similarly, in many boreal and Arctic regions, lightning is the most common cause of fire [6,7]. In coniferous mountain forests, wildfires are typically ignited by lightning strikes during dry summer thunderstorms [8]. These storm systems are characterized by high cloud bases, weak updrafts, and limited convective development [9]. They most often occur in the afternoon, particularly in regions with low atmospheric relative humidity, where virga formation results in substantial evaporative loss of precipitation before it reaches the ground [10,11,12]. Lightning strikes that occur with very little or no accompanying rainfall, specifically, less than 2.5 mm of precipitation, are referred to as dry lightning [13]. Dry thunderstorm days are also characterized by atmospheric instability and a large temperature difference between the 850 hPa level and 2 m above ground level [14], particularly in regions such as the Mediterranean basin [9], the USA [12], the northwestern Pacific [15], and Australia [16,17].
In general, most lightning discharges occur within a single cloud (intra-cloud lightning) or between clouds (cloud-to-cloud lightning), without reaching the ground. While not all cloud-to-ground lightning (CGL) strikes that contact vegetation result in fire [18,19], the proportion that leads to ignition remains unknown. However, the likelihood of CGL occurrence influences the overall probability of fire ignition, thereby increasing fire danger and potentially exacerbating wildfire risk in fire-prone areas. When lightning strikes a standing tree (living or dead) or a fallen log, it typically initiates smoldering combustion in the surrounding dead organic material at the base [20]. This smoldering phase, characterized by slow and incomplete combustion, can persist for an extended period before transitioning into flaming combustion. The time between a lightning strike and the onset of flaming ignition varies depending on local fuel moisture content and structure, and meteorological factors. According to [21,22,23,24], the smoldering phase typically lasts between one and three days before transitioning to flaming combustion, while [25] have documented cases where smoldering persisted for several weeks.
After the appearance of an open flame, following a short or extended smoldering phase, the duration of which is often uncertain, the fire begins to spread into surface vegetation. At some point, the fire is detected, most often prompted by visible smoke, though it may initially be perceived by the smell of smoke before visual confirmation. Wildfires are typically detected and reported by residents, passersby, fire lookout observers, or even civil aviation aircraft, and are subsequently followed by a formal fire alert. Generally, the moment of ignition precedes the moment of detection; the time interval between these two events is referred to as the holdover time [25,26,27]. Lightning ignition efficiency has been examined in relation to the Fine Fuel Moisture Code (FFMC), Duff Moisture Code (DMC), and Drought Code (DC) from the Canadian Forest Fire Weather Index (FWI) System, as well as variables related to precipitation amount, fuel moisture, and lightning flash frequency [5,28,29].
In central and northern California, dry lightning peaks during July and August at higher elevations, whereas a larger proportion of dry lightning occurs at lower elevations during the transition from summer to fall, in September and October [13]. In Greece, during the summer months, convective instability thunderstorms significantly influence local meteorological conditions over mountainous regions [30,31,32]. These storms are often accompanied by thousands of lightning discharges, strong to gale-force winds, hail, and rainfall intensities exceeding 40 mm·h−1 [31]. Analysis of the spatial distribution of lightning activity has shown that Peloponnese is one of the areas with very high relative flash density [30]. This term is defined as the ratio of the average lightning flash density (i.e., the number of discharges per km2 during the study period) within a specific area to the overall flash density across the entire study region during the same period [31].
In Greece, the burned area of lightning-caused wildfires varies widely, ranging from a single burned standing tree or fallen dead log to several tens or even hundreds of hectares (ha). These fires typically start as low-intensity surface fires and often go unnoticed until conditions allow an increase in the rate of fire spread or fire intensity. At that stage, significant fire growth may occur, and transition to crown fire is occasionally possible. Despite their potential for expansion, lightning-caused wildfires can often have ecological benefits, contributing to forest health and supporting natural regeneration processes [33].
Internationally, various methods have been developed to identify which lightning strike ignited a specific fire among numerous candidate strikes. However, there is a lack of empirical data and corresponding paired observations that directly link individual lightning strikes to the wildfires they have caused [26]. This limitation hinders efforts to: (a) understand and characterize the prevailing regime in a given area with respect to natural ignition sources, including the estimation of holdover time [23,24], and (b) model the occurrence and probability of lightning-caused wildfires [29,34].
To the best of our knowledge, there are no widely used metrics in Greece, nor are there studies that examine alternative indicators or indices related to lightning-caused wildfires. This study utilizes, for the first time, accurate data on lightning-caused wildfires on Mount Mainalo and in the surrounding areas, sourced directly from firefighters, forest officers and seasonal municipal fire lookout personnel between May 1998 and November 2022. The objective of this study is to examine the spatial and temporal distribution of lightning-caused wildfires on Mount Mainalo, with the aim of supporting wildfire prevention and enhancing wildfire management decision-making. The resulting database demonstrates its potential value by contributing to the modeling of lightning-caused wildfire occurrence.
2. Materials and Methods
Eighty (80) lightning-caused wildfires that occurred in an area of 672 km2 (i.e., 67,200 ha) on Mount Mainalo, in the central Peloponnese, Greece (Figure 1), between May 1998 and November 2022, were selected for analysis. The data were precisely recorded by experts, including firefighters, forest officers, and seasonal municipal fire lookouts, all of whom have practical experience in wildfire monitoring. These records are considered accurate and highly reliable, as they were ground-checked through on-site observations as part of a comprehensive ground verification process. The ignitions attributed to lightning were rigorously verified in the field, with observers ensuring that no human activity was present during the associated thunderstorm events. This provided high confidence that the recorded ignitions were indeed caused by lightning. These 80 verified records of lightning-caused wildfires formed the basis for constructing the database used in our analysis. Part of the 672 km2 study area falls within the Natura 2000 network, specifically the Site of Community Importance Oros Mainalo (code GR2520001).
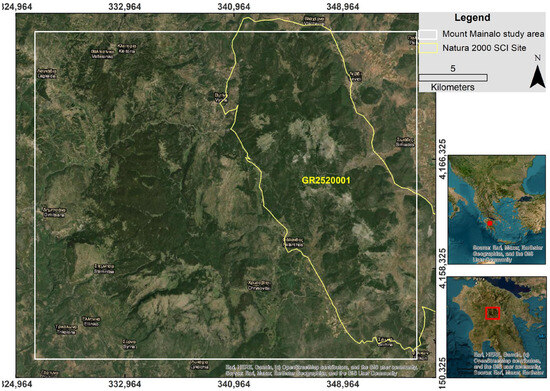
Figure 1.
The study area of 672 km2 on Mount Mainalo, in the central Peloponnese, Greece, projected using the Greek Grid system (EGSA87). The red point and red square shown in the two corresponding locator maps indicate the location and extent of the study area.
For each of the 80 records in the developed database, the date of the lightning strike, geographic coordinates of the ignition site (in GGRS87), and elevation (Elv, m), were recorded. Additional data included wildfire detection time (Fdt) available for 76 cases, holdover time (Hldt, h) calculated for 48 cases, and burned area (BuA, ha). The Hldt was estimated by calculating the difference between the Fdt and either the temporal midpoint of the associated thunderstorm event or, when available, the exact time of the lightning strike.
Initially, the 80 wildfires were classified into six (6) empirical classes based on the BuA per fire. For each class, the number of wildfires (frequency) and the total BuA were calculated. In addition, the number of lightning-caused wildfires and the total BuA per year, were also calculated. Frequency distribution histograms were also created for the period from May 1998 to November 2022. The precise ignition points of the 80 lightning strikes were identified, and a thematic map was created using ArcGIS version 9.3 geographic information system software developed by ESRI. The study area of 672 km2 was divided into 672 cells, each measuring 1 km2 (i.e., 100 ha), a fishnet grid with 1 km2 cells was created, and the number of lightning-caused wildfires was counted in each cell. Based on these counts, the density of lightning-caused wildfires per square kilometer was calculated.
The next step was to estimate the kernel density of lightning-caused wildfires per square kilometer, visualizing the density across the landscape and highlighting the spatial intensity of ignitions. Ordinary Kriging [35] was then applied, using the Gaussian (normal) semivariogram model as a geostatistical interpolation method to estimate the density of lightning ignitions per square kilometer in unsampled areas. The average number of lightning-caused wildfires per season was calculated and used to estimate the probability of wildfire occurrence using the Poisson distribution, under the assumption that such events are random and independent. The resulting calculations covered the probability of observing between 0 and 10 wildfires per season based on the estimated seasonal average.
3. Results
Over the 25-year study period, the 80 lightning-caused wildfires occurred across the 672 km2 study area, resulting in an average of 3.2 wildfires per fire season. For the six empirical classes that were created based on the BuA per fire, the number of wildfires (frequency) and the total BuA are presented in Table 1. The number of lightning-caused wildfires and the total BuA per year, are also presented in Table 2. The number of lightning-caused wildfires and the maximum Elv of ignitions points (Elvmax) were calculated per month (Figure 2a) for the period from May 1998 to November 2022, along with the number of wildfires and their total BuA per month (Figure 2b).

Table 1.
Six (6) empirical classes based on burned area (BuA) per lightning-caused wildfire, along with the number of wildfires and total burned area per class on Mount Mainalo, central Peloponnese, Greece, between May 1998 and November 2022.

Table 2.
Number of lightning-caused wildfires and total BuA per year on Mount Mainalo, Greece, between May 1998 and November 2022.
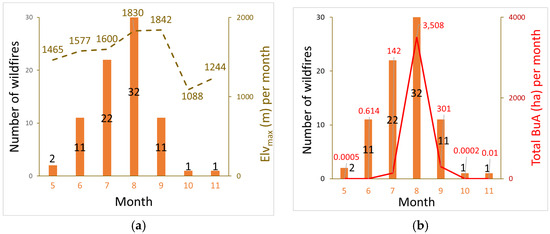
Figure 2.
Frequency distribution histograms for the period from May 1998 to November 2022: (a) number of lightning-caused wildfires and maximum elevation of ignition points (Elvmax, m) per month; (b) number of wildfires and total BuA (ha) per month.
Of the total BuA of 3951.1 ha recorded for the 80 wildfires in the database, 3894 ha (approximately 98.6%) is attributed to just four lightning-caused events (Classes 5 and 6, Table 1). The largest BuA, 3180 ha, occurred in 2000 (Class 6, Table 1), while the remaining three wildfires (Class 5, Table 1) burned areas of 120, 294, and 300 ha, respectively. The remaining BuA of 57.1 ha corresponds to the other 76 wildfires in the database, each with a BuA not exceeding 15.9 ha. These 76 wildfires are classified within the first four classes of Table 1. The number of wildfires of this subset and the mean Elv of ignition points per month are presented in Figure 3a while the number of wildfires and the total BuA per month are shown in Figure 3b. The frequency distribution of these 76 wildfires and the total BuA per year are presented in Figure 4.

Figure 3.
(a) Number of lightning-caused wildfires in the subset of 76 wildfires, each with a BuA not exceeding 15.9 ha and the mean Elv of ignitions per month, (b) number of wildfires and total BuA per month for the same subset.
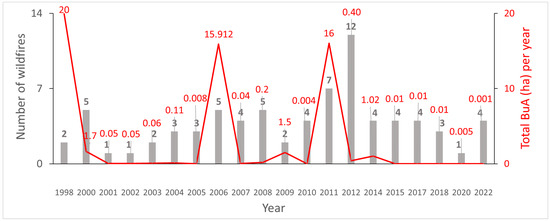
Figure 4.
Number of lightning-caused wildfires per year and their total BuA for the subset of 76 wildfires, each with a BuA not exceeding 15.9 ha.
Another subset of 76 lightning-caused wildfires, for which Fdt data was available, was analyzed. Descriptive statistics, including the mean, standard error (S.E.), median, mode, standard deviation (S.D.), minimum (min), and maximum (max) for Fdt, Elv and BuA within this subset are presented in Table 3.

Table 3.
Descriptive statistics of Fdt, Elv and BuA, for the subset of 76 wildfires with available Fdt data.
The frequency distribution of these 76 wildfires was also calculated based on empirical Fdt classes and is presented in Figure 5.
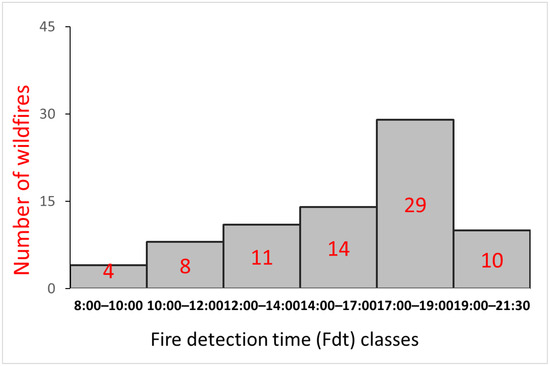
Figure 5.
Frequency distribution of the 76 wildfires with available Fdt data across empirical Fdt classes.
Hldt could not be calculated for 32 lightning-caused wildfires because either the precise fire detection time (Fdt) was not recorded or the duration of the associated thunderstorm was unavailable, making it impossible to determine the storm’s temporal midpoint. For the subset of 48 lightning-caused wildfires for which Hldt was calculated, seven (7) empirical Hldt classes were defined. A frequency distribution histogram was produced for these cases based on the Hldt classes, along with the total burned area (BuA) per class (Figure 6).
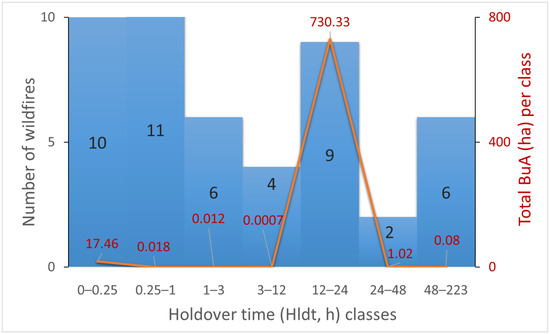
Figure 6.
Frequency distribution (black numbers) across empirical Hldt classes for the 48 lightning-caused wildfires with calculated Hldt values, along with the total BuA per class shown as red numbers and an orange line.
Descriptive statistics, including the mean, standard error (S.E.), median, mode, standard deviation (S.D.), minimum (min), and maximum (max) for Fdt, Elv, Hldt, and BuA within this subset are presented in Table 4.

Table 4.
Descriptive statistics of Fdt, Elv, Hldt and BuA, for the subset of 48 lightning-caused wildfires with calculated Hldt.
The ignition points of the 80 lightning-caused wildfires and their density per square kilometer are presented in Figure 7 and Figure 8, respectively. The lightning strike map (Figure 7) displays the precise strike locations and illustrates the spatial and monthly temporal distribution of 80 wildfire ignition points caused by lightning on Mount Mainalo, Peloponnese, Greece. Out of the 672 cells into which the 672 km2 study area was divided, 608 contained no recorded lightning-caused wildfires. One cell had four recorded, 13 cells recorded two each, and 50 cells had a single lightning-caused wildfire (Figure 8).
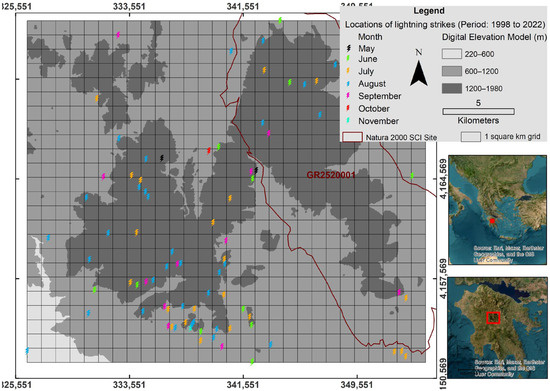
Figure 7.
Spatial and monthly temporal distribution of wildfire ignition points caused by lightning on Mount Mainalo, Greece, from 1998 to 2022.
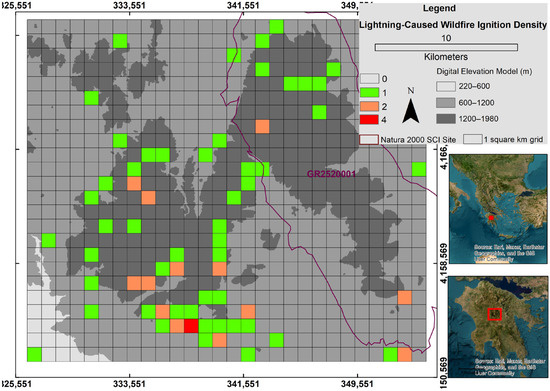
Figure 8.
Density of lightning-caused wildfires per square kilometer.
The kernel density of lightning-caused wildfires per square kilometer, employed to visualize the spatial intensity of ignitions, is shown in Figure 9. The density of lightning ignitions per square kilometer in unsampled areas, estimated using Ordinary Kriging, is shown in Figure 10.
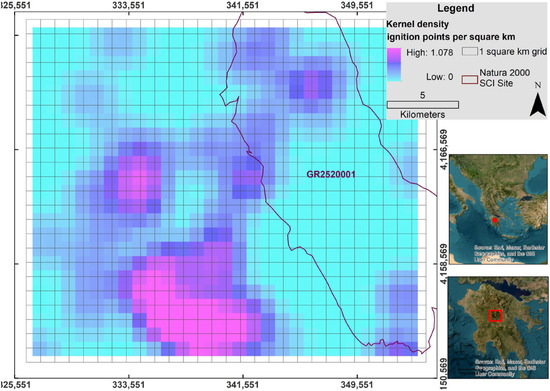
Figure 9.
Kernel Density of lightning-caused wildfires per square kilometer.
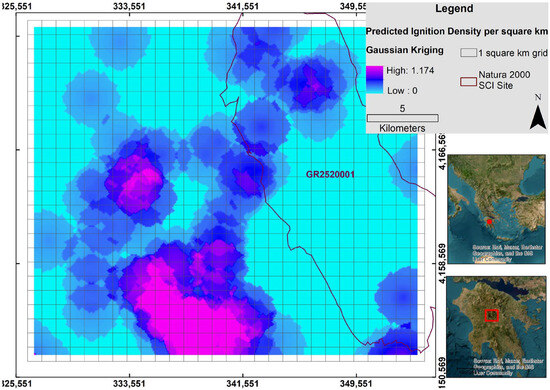
Figure 10.
Lightning ignition density estimated using Ordinary Kriging with a Gaussian semivariogram model.
The probability of wildfire occurrence was estimated using the Poisson distribution, based on an average of 3.2 lightning-caused ignitions per fire season, The calculated probabilities for observing between 0 and 10 wildfires were plotted and are presented in Figure 11. It was found that there is approximately 95.9% chance of at least one lightning-caused wildfire occurring in any given fire season. In other words, the likelihood of at least one fire per season is about 96%, while the probability of no fire during a season is only 4%. The line in the plot represents a sixth-order polynomial fit to the data, with an R2 value of 0.9999, indicating an excellent fit.
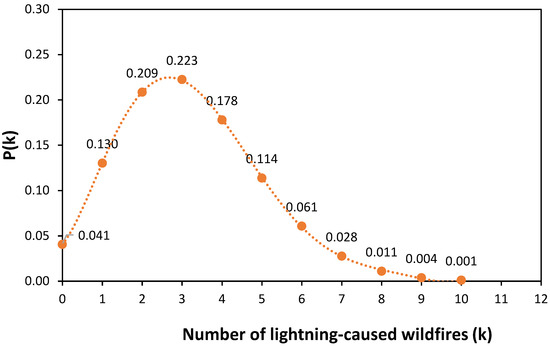
Figure 11.
The probability of lightning-caused wildfire occurrence.
4. Discussion
The importance of critically engaging with research on lightning-caused wildfires has been widely acknowledged and emphasized [36] particularly in relation to persistent knowledge gaps and data limitations, such as inaccurate estimates of holdover times [37]. Many studies on lightning-caused wildfires highlight that accurately identifying the initial ignitions is a crucial first step in the analysis [23,26,27,38,39]. Additionally, the spatial uncertainties associated with the holdover phenomenon further amplify the difficulty in determining holdover time, often leading to the misclassification of tens or even hundreds of lightning events as potential ignitions for a single wildfire [26,40]. During data preparation, holdover times could be calculated for only 48 of the 80 documented lightning-caused wildfires, where either the precise time of the lightning strike or the temporal midpoint of the associated thunderstorm, along with the fire detection time, were known.
The database developed in this study is based on precise field recordings by firefighters, forest officers, and seasonal municipal fire lookouts, who documented both lightning activity and actual wildfire ignitions. The data are considered spatially accurate and highly reliable, as they were ground-checked through on-site observations as part of a comprehensive ground verification process. Furthermore, lightning detection networks such as ZEUS [41] and the operational Precision Lightning Network (PLN), established by the Hellenic National Meteorological Service (HNMS) since 2007 [32], can only indicate the occurrence and approximate location of lightning strikes. The location accuracy of ZEUS [41] is of the order of 4–5 km over the Mediterranean and surrounding countries [42], whereas the PLN provides an accuracy of 250 m over Greece [32].
Pineda et al. [27] have found that lightning-caused wildfires igniting in the early afternoon tend to exhibit shorter holdover times compared to other ignition times. Additionally, ignitions occurring at the beginning or end of the natural fire season are generally associated with longer holdover times, and holdover time tends to increase with elevation. However, these patterns were not observed in the spatial and temporal data for Mount Mainalo. This discrepancy may be attributed to the relatively small sample size (n = 80) and the limited number of cases within the two subsets: Table 3 (n = 76) and Table 4 (n = 48).
No lightning-caused wildfires were recorded on Mount Mainalo in the years 1999, 2013, 2016, and 2019. The highest number of lightning-ignited wildfires occurred in 2012, with 12 recorded ignitions. The previous year (2011) also saw a notable number, with 7 events. In 2008, 2006, and 2000, five wildfires were recorded in each of those years.
Most of the lightning-caused wildfires on Mount Mainalo were detected during the afternoon hours (Figure 5) related to dry summer thunderstorms which is a typical weather pattern of continental climate of the study area. Several lightning-caused wildfires were identified within three hours of the lightning strike that caused the ignition (Figure 6, n = 27), whereas those detected the following day tended to burn larger areas. Most of the lightning-caused wildfires occurred in July (n = 21) and August (n = 30) (Figure 3) which is consistent with findings from other regions, such as Central and Northern California [13], as well as the Alpine region [43]. Furthermore, a concentration of ignitions was observed in the southern part of Mount Mainalo (Figure 9, Figure 10 and Figure 12). Figure 12 presents the Digital Elevation Model (a) and Kriging density classes shown either in full (b, c) or with gradual omission (d, e, f). This visualization approach helps the user focus on areas of expected density. It was also found that lightning-caused wildfires most commonly occur at mean and maximum elevations of approximately 1200 m and 1800 m, respectively (Table 3 and Table 4).
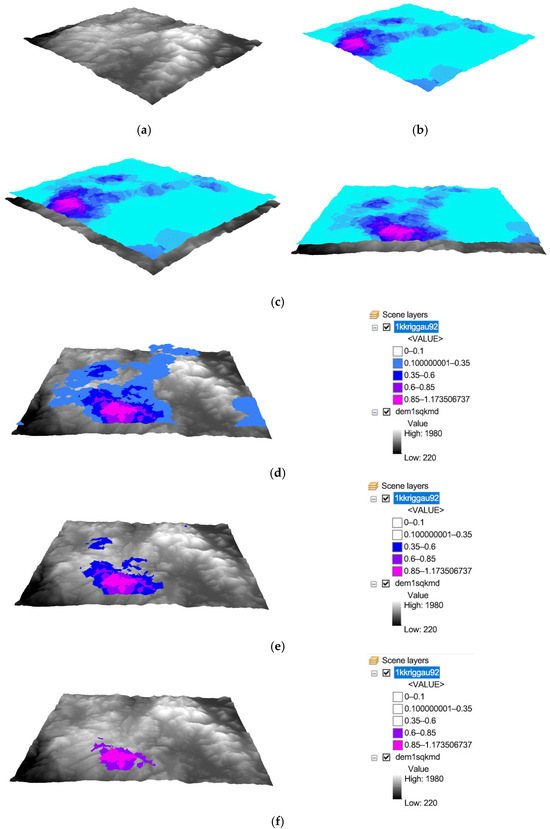
Figure 12.
(a) Digital Elevation Model, (b,c) All Kriging density classes, (d–f) individual Kriging density classes shown separately.
These findings can inform ground patrol planning and support the strategic staffing of lookout towers, aiding in the rapid detection of ignitions and contributing to improved anticipation and mitigation of lightning-caused wildfires. For example, patrol routes may be adjusted to prioritize areas with higher ignition likelihood. This approach can be combined with the protection of previously burned areas dominated by grass, where lightning-ignited wildfires can spread rapidly and severely impact natural regeneration and habitats of high ecological value. Such measures are particularly important in high-elevation coniferous forest ecosystems and should be considered a key objective in wildfire management planning.
In general, during the fire season, lightning activity is positively related to elevation, slope, and woodland areas [42] in continental mountainous regions. Although fuel conditions, weather, climate, and topography significantly influence lightning-caused wildfires, the sensitivity of these wildfires to such factors must be well understood for different geographical locations [36]. Lightning-caused ignitions in complex terrain tend to be random, rapidly changing, and relatively independent. Therefore, although most lightning-caused wildfires have been recorded in the southern part of Mount Mainalo (Figure 10), destructive events may also occur in the northern or other areas of the mountain, as lightning ignitions are random and relatively spatially independent. To visualize the spatial density of ignitions across the landscape, we applied Ordinary Kriging with a Gaussian semivariogram model.
Understanding the natural fire regime on Mount Mainalo can be enhanced by analyzing the spatial and temporal variability of lightning-caused wildfires, along with associated factors such as forest fuel conditions, ignition elevation, fire detection and holdover times, and the extent of burned areas. As data collection continues and the database expands, further research is expected to provide deeper insights into the issues discussed in this paper across more mountainous regions of Greece.
5. Conclusions
In this study we analyzed lightning-caused wildfires on Mount Mainalo in the central Peloponnese, Greece, covering the period from May 1998 to November 2022. Based on ground-verified data collected by experienced firefighters, forest officers, and seasonal municipal fire lookouts, the findings provide reliable insights into the temporal and spatial patterns of lightning-caused wildfires, addressing a critical knowledge gap.
Holdover time is a well-known limitation, as it is difficult to accurately determine the interval between wildfire ignition and the time of fire detection. Spatial uncertainties in holdover time calculations were eliminated in cases where the precise time of the lightning strike was known, as the exact strike location could also be determined.
This is the first study in Greece to link lightning with wildfires, revealing a 96% probability of at least one fire per season and an average of three such fires per season. Moreover, the frequency of lightning-caused wildfires peaks in July and August. Most wildfires occurred in the southern part of the mountain, at elevations between 1200 and 1800 m, and were primarily detected in the afternoon hours.
This knowledge can support the implementation of critical measures and the development of adaptive policies in response to climate change, contributing to the protection of high-elevation coniferous forests and habitats of high ecological importance.
Author Contributions
Conceptualization, M.A.; methodology, M.A.; formal analysis, M.A.; investigation, M.A., I.K. and A.K.; resources, M.A. and I.K.; data curation, M.A.; writing—original draft preparation, M.A.; writing—review and editing, M.A. and P.N.; visualization, M.A.; supervision, M.A. and P.N. All authors have read and agreed to the published version of the manuscript.
Funding
This research received no external funding.
Institutional Review Board Statement
Not applicable.
Informed Consent Statement
Not applicable.
Data Availability Statement
The original contributions presented in the study are included in the article. Further inquiries can be directed to the corresponding authors.
Acknowledgments
We would like to thank Fotios Papachatzis for providing useful insights into some of the cases included in the database.
Conflicts of Interest
The authors declare no conflicts of interest.
References
- Pyne, S.J. Fire: A Brief History; University of Washington Press: Seattle, WA, USA, 2001. [Google Scholar]
- Pyne, S.J.; Andrews, P.L.; Laven, R.D. Introduction to Wildland Fire; Wiley: New York, NY, USA, 1996. [Google Scholar]
- Scott, A.C.; Bowman, D.M.; Bond, W.J.; Pyne, S.J.; Alexander, M.E. Fire on Earth: An Introduction; John Wiley & Sons: Hoboken, NJ, USA, 2014. [Google Scholar]
- Scott, A.C. The Pre-Quaternary history of fire. Palaeogeogr. Palaeoclim. Palaeoecol. 2000, 164, 281–329. [Google Scholar] [CrossRef]
- Coogan, S.C.P.; Cannon, A.J.; Flannigan, M.D. Lightning ignition efficiency in Canadian forests. Fire Ecol. 2025, 21, 34. [Google Scholar] [CrossRef] [PubMed]
- Veraverbeke, S.; Rogers, B.M.; Goulden, M.L.; Jandt, R.R.; Miller, C.E.; Wiggins, E.B.; Randerson, J.T. Lightning as a major driver of recent large fire years in North American boreal forests. Nat. Clim. Change 2017, 7, 529–534. [Google Scholar] [CrossRef]
- Chen, Y.; Romps, D.M.; Seeley, J.T.; Veraverbeke, S.; Riley, W.J.; Mekonnen, Z.A.; Randerson, J.T. Future increases in Arctic lightning and fire risk for permafrost carbon. Nat. Clim. Change 2021, 11, 404–410. [Google Scholar] [CrossRef]
- Reineking, B.; Weibel, P.; Conedera, M.; Bugmann, H. Environmental determinants of lightning-v. human-induced forest fire ignitions differ in a temperate mountain region of Switzerland. Int. J. Wildland Fire 2010, 19, 541–557. [Google Scholar] [CrossRef]
- Pérez-Invernón, F.J.; Huntrieser, H.; Soler, S.; Gordillo-Vázquez, F.J.; Pineda, N.; Navarro-González, J.; Reglero, V.; Montanyà, J.; van der Velde, O.; Koutsias, N. Lightning-ignited wildfires and long continuing current lightning in the Mediterranean Basin: Preferential meteorological conditions. Atmos. Chem. Phys. 2021, 21, 17529–17557. [Google Scholar] [CrossRef]
- Hall, B.L. Precipitation associated with lightning-ignited wildfires in Arizona and New Mexico. Int. J. Wildland Fire 2007, 16, 242–254. [Google Scholar] [CrossRef]
- Colson, D. High level thunderstorms of July 31–August 1, 1959. Mon. Weather Rev. 1960, 88, 279–285. [Google Scholar] [CrossRef]
- Rorig, M.L.; McKay, S.J.; Ferguson, S.A.; Werth, P. Model-generated predictions of dry thunderstorm potential. J. Appl. Meteorol. Climatol. 2007, 46, 605–614. [Google Scholar] [CrossRef]
- Kalashnikov, D.; Abatzoglou, J.T.; Nauslar, N.J.; Swain, D.L.; Touma, D.; Singh, D. Meteorological and geographical factors associated with dry lightning in central and northern California. Environ. Res. Clim. 2022, 1, 025001. [Google Scholar] [CrossRef]
- Kharyutkina, E.; Moraru, E.; Pustovalov, K.; Loginov, S. Lightning-Ignited Wildfires and Associated Meteorological Conditions in Western Siberia for 2016–2021. Atmosphere 2024, 15, 106. [Google Scholar] [CrossRef]
- Rorig, M.L.; Ferguson, S.A. Characteristics of lightning and wildland fire ignition in the Pacific Northwest. J. Appl. Meteorol. 1999, 38, 1565–1575. [Google Scholar]
- Dowdy, A.J.; Mills, G.A. Characteristics of lightning-attributed wildland fires in south-east Australia. Int. J. Wildland Fire 2012, 21, 521–524. [Google Scholar] [CrossRef]
- Dowdy, A.J. Climatology of thunderstorms, convective rainfall and dry lightning environments in Australia. Clim. Dyn. 2020, 54, 3041–3052. [Google Scholar] [CrossRef]
- Hare, B.M.; Scholten, O.; Dwyer, J.; Trinh, T.N.G.; Buitink, S.; ter Veen, S.; Bonardi, A.; Corstanje, A.; Falcke, H.; Hörandel, J.R.; et al. Needle-like structures discovered on positively charged lightning branches. Nature 2019, 568, 360–363. [Google Scholar] [CrossRef] [PubMed]
- Tran, M.D.; Rakov, V.A. Initiation and propagation of cloud-to-ground lightning observed with a high-speed video camera. Sci. Rep. 2016, 6, 39521. [Google Scholar] [CrossRef] [PubMed]
- Ogilvie, C. Lightning fires in Saskatchewan forests. Fire Manag. Notes 1989, 50, 31–36. [Google Scholar]
- Nash, C.; Johnson, E. Synoptic climatology of lightning-caused forest fires in subalpine and boreal forests. Can. J. For. Res. 1996, 26, 1859–1874. [Google Scholar] [CrossRef]
- Anderson, K. A model to predict lightning-caused fire occurrences. Int. J. Wildland Fire 2002, 11, 163–172. [Google Scholar] [CrossRef]
- Pineda, N.; Rigo, T. The rainfall factor in lightning-ignited wildfires in Catalonia. Agric. For. Meteorol. 2017, 239, 249–263. [Google Scholar] [CrossRef]
- Schultz, C.J.; Nauslar, N.J.; Wachter, J.B.; Hain, C.R.; Bell, J.R. Spatial, temporal and electrical characteristics of lightning in reported lightning-initiated wildfire events. Fire 2019, 2, 18. [Google Scholar] [CrossRef]
- Wotton, B.M.; Martell, D.L. A lightning fire occurrence model for Ontario. Can. J. For. Res. 2005, 35, 1389–1401. [Google Scholar] [CrossRef]
- Moris, J.V.; Conedera, M.; Nisi, L.; Bernardi, M.; Cesti, G.; Pezzatti, G.B. Lightning-caused fires in the Alps: Identifying the igniting strokes. Agric. For. Meteorol. 2020, 290, 107990. [Google Scholar] [CrossRef]
- Pineda, N.; Peña, J.C.; Soler, X.; Aran, M.; Pérez-Zanón, N. Synoptic weather patterns conducive to lightning-ignited wildfires in Catalonia. Adv. Sci. Res. 2022, 19, 39–49. [Google Scholar] [CrossRef]
- Abatzoglou, J.T.; Kolden, C.; Balch, J.K.; Bradley, B. Controls on interannual variability in lightning-caused fire activity in the western US. Environ. Res. Lett. 2016, 11, 045005. [Google Scholar] [CrossRef]
- Rodrigues, M.; Jiménez-Ruano, A.; Gelabert, P.J.; de Dios, V.R.; Torres, L.; Ribalaygua, J.; Vega-García, C. Modelling the daily probability of lightning-caused ignition in the Iberian Peninsula. Int. J. Wildland Fire 2023, 32, 351–362. [Google Scholar] [CrossRef]
- Mazarakis, N.; Kotroni, V.; Lagouvardos, K.; Argiriou, A.A. Storms and lightning activity in Greece during the warm periods of 2003–2006. J. Appl. Meteorol. Climatol. 2008, 47, 3089–3098. [Google Scholar] [CrossRef]
- Mazarakis, N. Observational and numerical study of the dynamical and physical processes that are been connected with the convection activity during the warm period over Greece. In Physics; University of Patras: Patras, Greece, 2010; p. 177. [Google Scholar]
- Nastos, P.; Matsangouras, I.; Chronis, T. Spatio-temporal analysis of lightning activity over Greece—Preliminary results derived from the recent state precision lightning network. Atmos. Res. 2014, 144, 207–217. [Google Scholar] [CrossRef]
- Komarek, E.V. Lightning and lightning fires as ecological forces. In Proceedings of the 8th Tall Timbers Fire Ecology Conference 1968, Tallahassee, FL, USA, 14–15 March 1968. [Google Scholar]
- Chen, F.; Du, Y.; Niu, S.; Zhao, J. Modeling forest lightning fire occurrence in the Daxinganling Mountains of Northeastern China with MAXENT. Forests 2015, 6, 1422–1438. [Google Scholar] [CrossRef]
- Oliver, M.A.; Webster, R. Kriging: A method of interpolation for geographical information systems. Int. J. Geogr. Inf. Syst. 1990, 4, 313–332. [Google Scholar] [CrossRef]
- Song, Y.; Xu, C.; Li, X.; Oppong, F. Lightning-induced wildfires: An overview. Fire 2024, 7, 79. [Google Scholar] [CrossRef]
- Moris, J.V.; Ascoli, D.; Hunt, H.G. Survival functions of holdover time of lightning-ignited wildfires. Electr. Power Syst. Res. 2024, 231, 110296. [Google Scholar] [CrossRef]
- Pineda, N.; Montanyà, J.; van der Velde, O.A. Characteristics of lightning related to wildfire ignitions in Catalonia. Atmos. Res. 2014, 135, 380–387. [Google Scholar] [CrossRef]
- Pérez-Invernón, F.J.; Huntrieser, H.; Moris, J.V. Meteorological conditions associated with lightning ignited fires and long-continuing-current lightning in Arizona, New Mexico and Florida. Fire 2022, 5, 96. [Google Scholar] [CrossRef]
- Braun, W.J.; Stafford, J.E. Multivariate density estimation for interval-censored data with application to a forest fire modelling problem. Environmetrics 2016, 27, 345–354. [Google Scholar] [CrossRef]
- Anagnostou, E.N.; Chronis, T.; Lalas, D.P. New receiver network advances long-range lightning monitoring. Eos Trans. Am. Geophys. Union 2002, 83, 589–595. [Google Scholar] [CrossRef]
- Kotroni, V.; Lagouvardos, K. Lightning occurrence in relation with elevation, terrain slope, and vegetation cover in the Mediterranean. J. Geophys. Res. Atmos. 2008, 113, D21. [Google Scholar] [CrossRef]
- Conedera, M.; Cesti, G.; Pezzatti, G.; Zumbrunnen, T.; Spinedi, F. Lightning-induced fires in the Alpine region: An increasing problem. For. Ecol. Manag. 2006, 234, S68. [Google Scholar] [CrossRef]
Disclaimer/Publisher’s Note: The statements, opinions and data contained in all publications are solely those of the individual author(s) and contributor(s) and not of MDPI and/or the editor(s). MDPI and/or the editor(s) disclaim responsibility for any injury to people or property resulting from any ideas, methods, instructions or products referred to in the content. |
© 2025 by the authors. Licensee MDPI, Basel, Switzerland. This article is an open access article distributed under the terms and conditions of the Creative Commons Attribution (CC BY) license (https://creativecommons.org/licenses/by/4.0/).