Article

Spatial–Temporal Variations of Air Pollutants and Its Relationship with Meteorological Factors During 2014 to 2022 in Jiangsu Province, China

1
Collaborative Innovation Center on Forecast and Evaluation of Meteorological Disasters (CIC-FEMD), China Meteorological Administration Aerosol-Cloud and Precipitation Key Laboratory, Nanjing University of Information Science and Technology, Nanjing 210044, China
2
Weather Modification Center of Jiangsu Province, Nanjing 210008, China
*
Authors to whom correspondence should be addressed.
Atmosphere 2025, 16(9), 1079; https://doi.org/10.3390/atmos16091079
Submission received: 27 July 2025 / Revised: 22 August 2025 / Accepted: 5 September 2025 / Published: 12 September 2025
(This article belongs to the Section Air Quality)

Abstract

This study analyzes the spatial and temporal distribution characteristics of pollutants and the influence of meteorological factors using data from 13 cities in Jiangsu Province from 2014 to 2022. The results showed that, from 2014 to 2022, the average concentrations of PM2.5, PM10, SO2, and CO in Jiangsu were high in the north and low in the south, while the NO2 concentration was low in the north and high in the south, all of which decreased over time. O3 concentration was higher on the eastern coast and increased with the year. PM2.5 pollution days in northern Jiangsu were higher in autumn and winter. O3 pollution days in southern Jiangsu were higher in spring, summer, and autumn. There was a significant positive correlation between O3 and temperature in spring and autumn, and it was weaker in summer. Relative humidity (RH) in winter was positively correlated with PM2.5 and RH showed a significant negative correlation with PM10 in spring, summer, and autumn. The scavenging effect of precipitation on PM10 concentration was the most pronounced, followed by PM2.5. Precipitation has the weakest scavenging effect on CO, only reducing its concentration by an average of 13%. Precipitation also exhibits a significant scavenging effect on O3. The decrease in O3 was the smallest on heavy rain days (14.7%) and the largest on severe, torrential rain days (25.9%).

1. Introduction

Air pollution has been one of the most significant environmental issues in China in recent years, having a profound impact on human health, the ecological environment, and climate change [1,2,3,4]. Air pollutants typically monitored include sulfur dioxide (SO2), nitrogen dioxide (NO2), ozone (O3), carbon monoxide (CO), and particulate matter (PM2.5 and PM10), which are particles with aerodynamic diameters equal to or less than 2.5 and 10 μm, respectively. Air pollution is causally related to increased risk of death from cardiovascular and pulmonary diseases [5,6]. O3 has a strong oxidizing property, which increases the risk of cardiovascular disease, and is also an important greenhouse gas [7,8,9,10]. Gas pollutants such as CO, SO2 and NO2 are also associated with an increased risk of death from cardiovascular and pulmonary diseases, posing a serious threat to human health [5,11].
With the development of the social economy, pollutant emissions have increased [12], the types of pollution have increased, and the properties of pollution have become more complex, leading to increasingly severe pollution problems in China [13]. Air pollution has also attracted the attention of the government and researchers. In recent years, the spatial–temporal variation characteristics of six pollutants (PM2.5, PM10, SO2, NO2, CO and O3) have also been widely studied in China and abroad [14,15,16,17,18]. Xie et al. [19] analyzed the temporal–spatial distribution of pollutants in provincial capital cities across China and found significant differences in the changes in air pollutant concentration levels between different cities. Feng et al. [20] found that the distribution of pollutants showed significant spatial differences due to their different emission sources. Air pollution in China exhibits a certain regularity in its spatial distribution. Air pollution events often occurred in the North China Plain [21,22], the Yangtze River Delta [23], the Pearl River Delta [24,25] and the Sichuan Basin [26,27]. Jiangsu Province is situated in the Yangtze River Delta region, which is a typical area for air pollution incidents in China. Through the analysis of the spatial–temporal characteristics of air pollution in Jiangsu Province, we can recognize the distribution of air pollution and provide basic data reference for pollution control.
In addition to studying the spatial–temporal distribution characteristics of air pollution, exploring its influencing factors is also essential for controlling it. The factors causing air pollution are complex, and air quality is not only affected by meteorological conditions, topography, and pollutant emissions [28,29] but also closely related to local production activities and socioeconomic factors [30]. Meteorological conditions are crucial factors influencing air pollution, and the dilution, diffusion, accumulation, and removal of pollutants are closely tied to these meteorological factors. Kamińska [31] found that temperature, wind speed and wind direction were necessary meteorological conditions for PM2.5 pollution. Li et al. [32] showed that precipitation and temperature had a significant impact on the distribution of pollutants in northeastern China. He et al. [33] found that meteorological factors have a strong influence on pollutants in China. Specifically, temperature, wind speed, and relative humidity (RH) alone explain over 70% of the variations in pollutant mass concentrations. Zhang [34] highlighted extreme wind speed and sunshine hours as key meteorological factors shaping atmospheric pollutant mass concentrations and their spatial–temporal distribution in Beijing. Therefore, it is necessary to analyze the meteorological factors affecting the spatial–temporal distribution of pollutants in Jiangsu Province.
Jiangsu Province is located in the center of the Yangtze River Delta urban agglomeration. The region’s concentrated urban development, predominantly flat terrain, high population density, and intense anthropogenic activities have led to frequent pollution incidents. In this study, the data of pollutants mass concentration (including SO2, NO2, CO, O3, PM2.5 and PM10) and the hourly conventional ground meteorological observation data of national meteorological stations in 13 prefecture-level cities in Jiangsu Province from 2014 to 2022 were used to analyze the temporal–spatial distribution characteristics of pollutants and meteorological factors, and to explore the temporal–spatial distribution and influence mechanism of pollution status to understand the pollution problems better and improve air quality in Jiangsu Province. This plays a vital role in responding to sustainable development [35], supporting the formulation and implementation of air pollution control measures, and is of great significance for the prevention and control of air pollution in Jiangsu Province.

2. Materials and Methods

2.1. Study Area

As shown in Figure 1, Jiangsu Province, includes 13 prefecture-level cities (Nanjing, Wuxi, Xuzhou, Changzhou, Suzhou, Nantong, Lianyungang, Huai’an, Yancheng, Yangzhou, Zhenjiang, Taizhou, Suqian), is located in the middle of the eastern coastal areas of mainland China, the lower reaches of the Yangtze River and Huaihe River, the Yellow Sea in the east, Shandong in the north, Anhui in the west, Shanghai and Zhejiang in the southeast. It is an important part of the Yangtze River Delta region. Jiangsu Province spans 30°45′–35°08′ north latitude and 116°21′–121°56′ east longitude with a maximum altitude of 624.4 m. The terrain of Jiangsu Province is flat, and the landform is composed of plains, waters and low hills. Jiangsu Province is situated in the East Asian monsoon climate zone, which is located in the transition zone between the subtropical and warm temperate climates. Bounded by the Huaihe River and the Northern Jiangsu Irrigation Canal, the northern area of Jiangsu Province has a warm temperate, humid, and semi-humid monsoon climate. In contrast, the southern region has a subtropical, humid monsoon climate.

2.2. Data Source

The hourly air quality data for each city in Jiangsu Province from 2014 to 2022 were obtained from the China Environmental Monitoring Station (http://www.cnemc.cn/ (accessed on 26 July 2025)), including SO2, NO2, CO, O3, PM2.5 and PM10 mass concentration data. The meteorological data were derived from the hourly conventional ground observation data of national meteorological stations in 13 prefecture-level cities of Jiangsu Province during 2014 to 2022, including meteorological elements such as temperature, RH, wind speed and wind direction.

2.3. Analytical Methods

In this study, the daily maximum 8 h moving average of O3 mass concentration (referred to as O3_8 h mass concentration) was used to analyze the variation characteristics of O3 on the monthly and annual scales. The hourly O3 mass concentration was used to analyze the variation of O3 on the daily scale. The division of seasons was based on the industry standard of the China Meteorological Administration: ≪Division of climate season≫ QX/T 152-2012 [36]), that is, spring from March to May, summer from June to August, autumn from September to November, and winter from December to February of the following year.
In this study, the ordinary Kriging spatial interpolation method was used to analyze the spatial characteristics, and ArcGIS 10.3 software was used to draw the spatial interpolation map of air pollutant concentration and other elements in Jiangsu Province (for details on how the ordinary Kriging spatial interpolation method works, please refer to this website: https://pro.arcgis.com (accessed on 26 July 2025)). Pearson correlation coefficient was used to analyze the Correlation between primary pollutants and various meteorological factors at different time scales.
Air Quality Index (AQI) is the maximum value of the Individual Air Quality Index (IAQI) of each pollutant, that is, AQI = max {IAQI1, IAQI2, IAQI3, …, IAQIn}. When AQI > 50, the corresponding pollutant with the largest IAQI is the “Priority pollutant”. The IAQI and the corresponding pollutant mass concentration limits, as well as the IAQI calculation methods, refer to the standards in the ≪Technical Provisions of Environmental Air Quality Index (Trial)≫ (HJ 633-2012 [37]). IAQI as shown in the following Equations:
I A Q I P = I A Q I H i I A Q I L o B P H i B P L o C P B P L o + I A Q I L o
where IAQIP is the Individual Air Quality Index for the pollutant P, CP is the mass concentration value for pollutant P, BPHi is the higher values of concentration limits of pollutants similar to CP in Table S1, BPLo is the lower values of concentration limits of pollutants identical to CP in Table S1, IAQIHi is the Individual Air Quality Index corresponding to BPHi in Table S1, and IAQILo is the Individual Air Quality Index corresponding to BPLo in Table S1.
According to the ≪Technical provisions of environmental air quality index (Trial)≫ (HJ 633-2012), AQI is divided into six grades: 0–50, 51–100, 101–150, 151–200, 201–300 and >300, corresponding to the six levels of air quality: excellent, good, light pollution, medium pollution, heavy pollution and severe pollution (Table S2). The days of AQI > 100 were defined as air pollution days in this paper.

3. Results and Analyses

3.1. Temporal–Spatial Distribution of Pollutants

3.1.1. Average Distribution of Pollutants and Meteorological Elements During 2014 to 2022

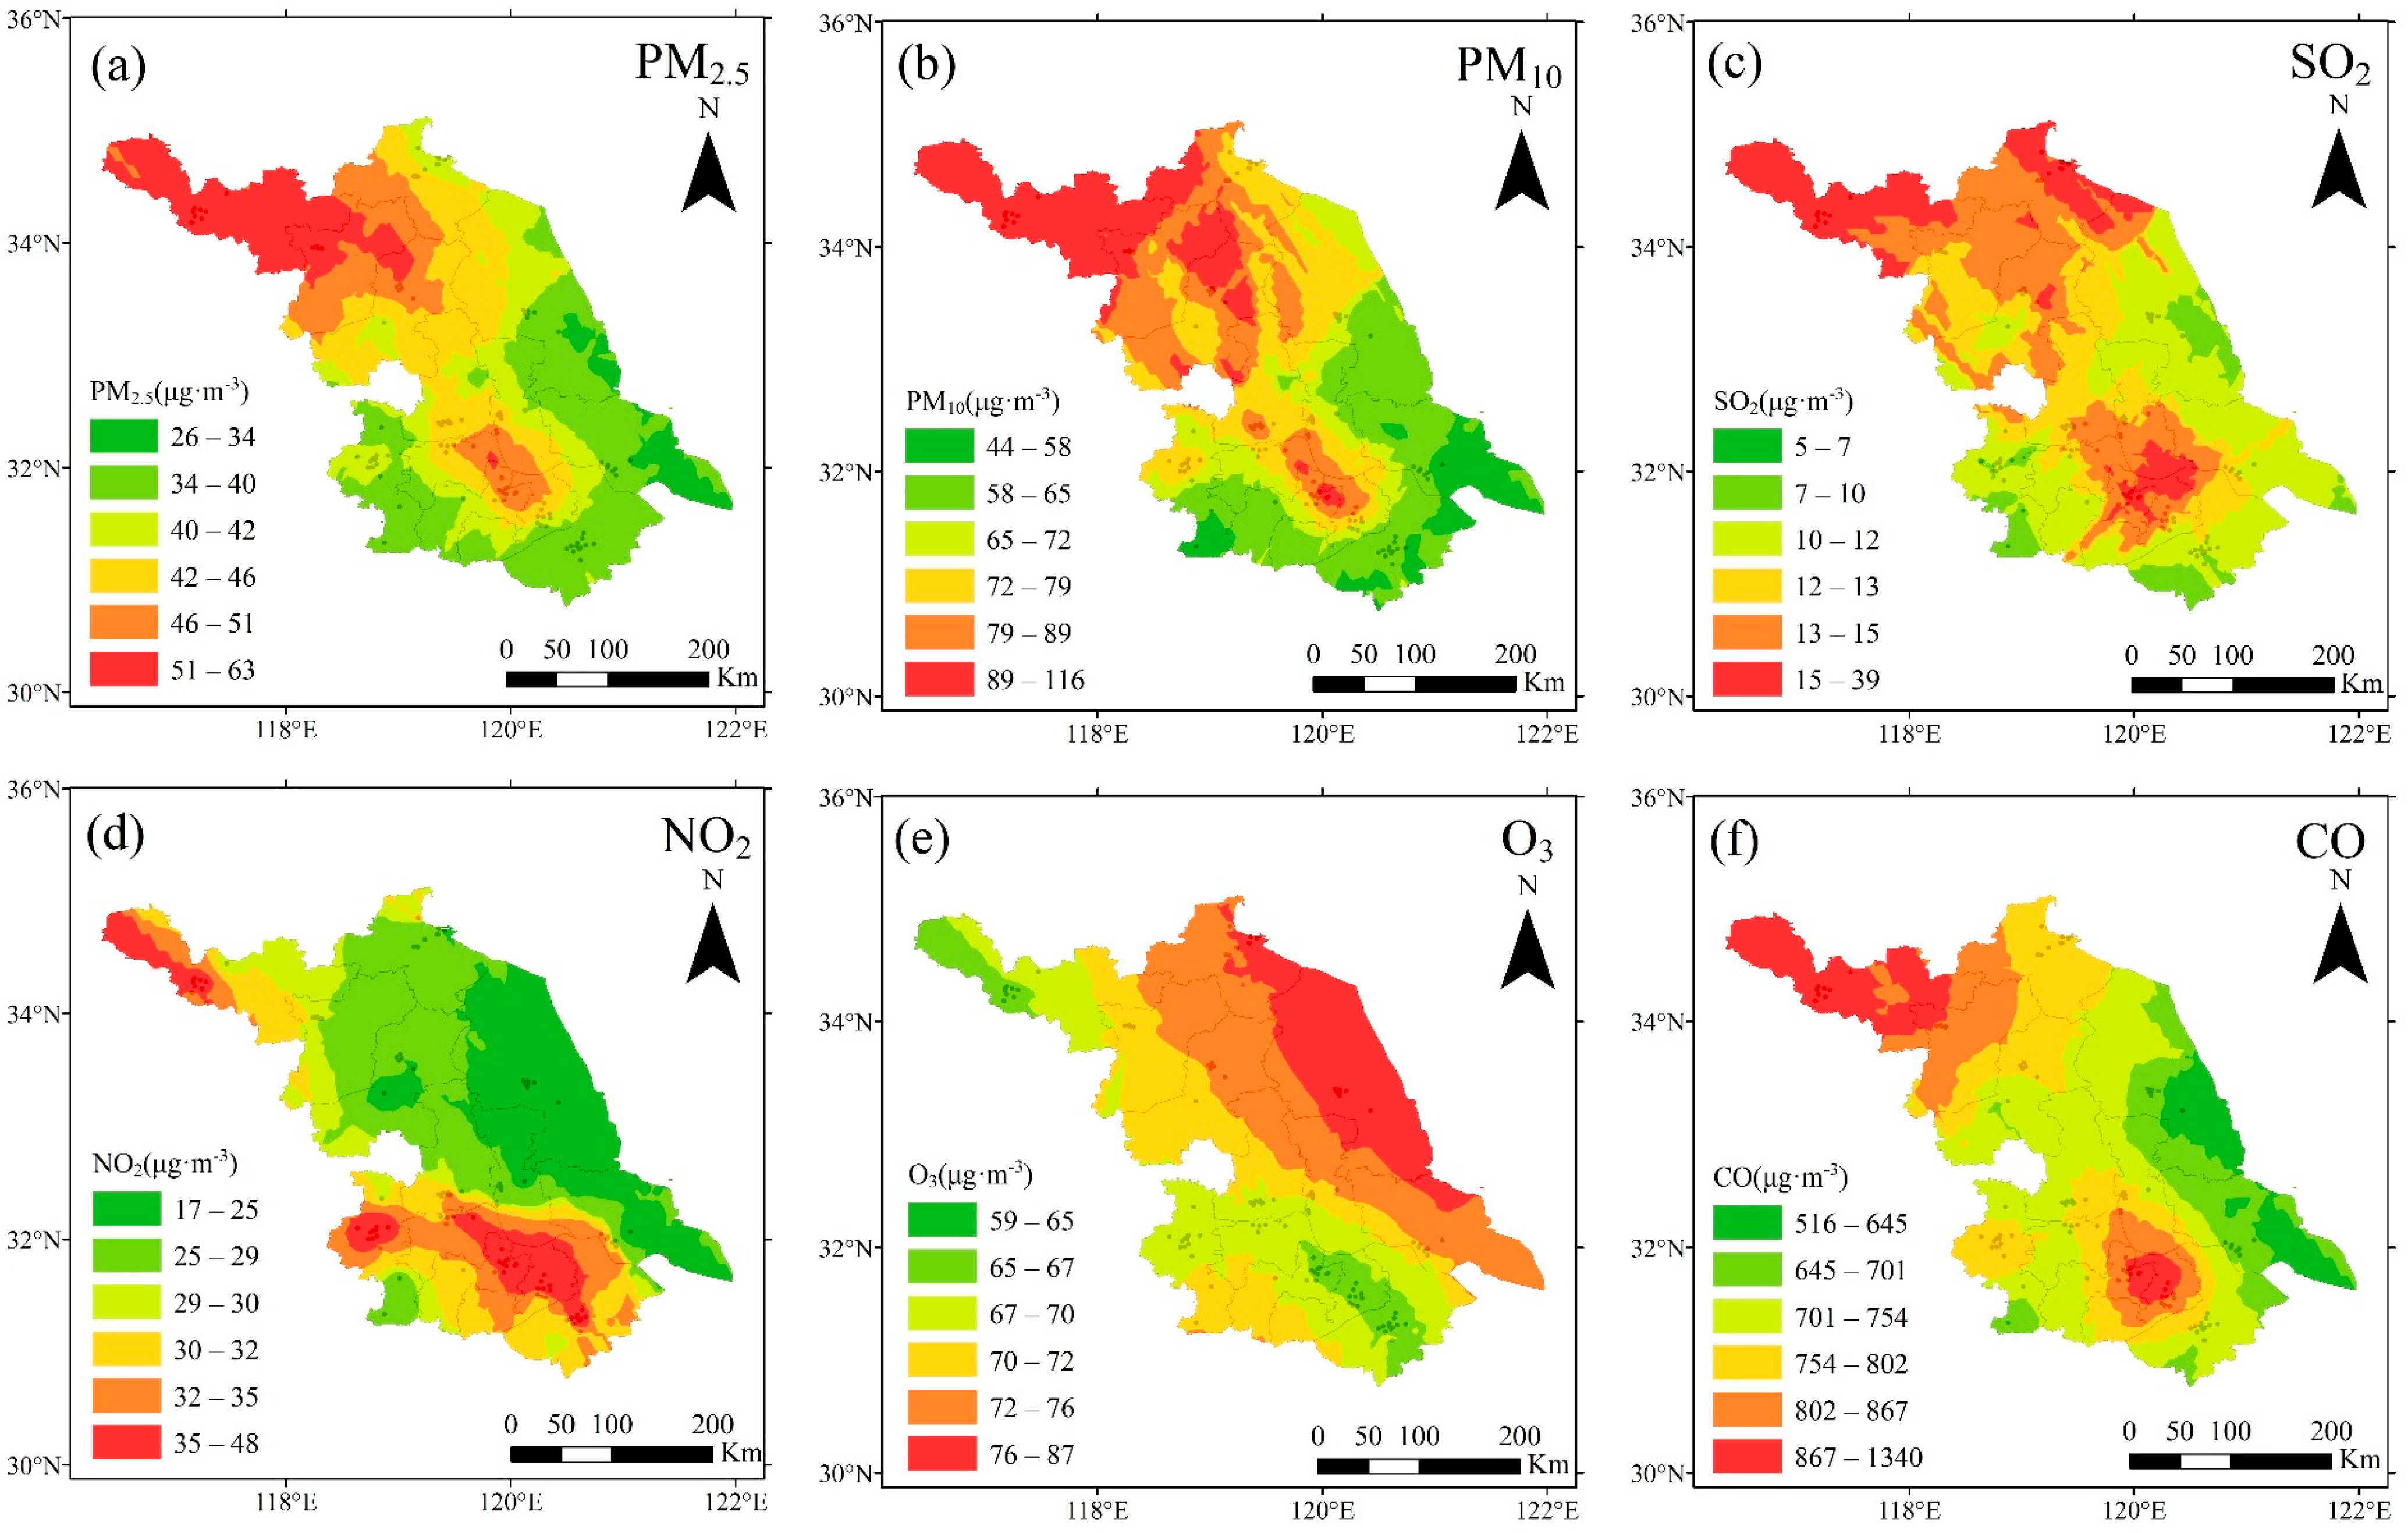
Figure 2 shows that the regional distribution of the 9-year average mass concentration levels of pollutants in Jiangsu varied significantly from 2014 to 2022. The higher mass concentrations of PM2.5, PM10, SO2 and CO were concentrated in the northern Jiangsu region, including Xuzhou, Suqian, and Huai’an, with concentrations above 42 μg·m−3, 70 μg·m−3, 12 μg·m−3, and 750 μg·m−3, respectively. The low values were concentrated in the southern Jiangsu region, including Wuxi, Nantong and Suzhou (<42 μg·m−3, 60 μg·m−3, 10 μg·m−3 and 700 μg·m−3). The higher NO2 concentration values were concentrated in southern Jiangsu, such as Nanjing, Changzhou, and Wuxi (>35 μg·m−3), while the lower values were concentrated in northern Jiangsu, such as Suqian, Lianyungang, and Yancheng (<25 μg·m−3). O3 concentration was higher in eastern coastal cities (>75 μg·m−3), such as Lianyungang, Yancheng and Nantong, and lower in western inland cities (<70 μg·m−3).
Figure S1 shows that temperature and precipitation were low in the north and high in the south, which were roughly opposite to the distribution of pollutants. The mass concentration levels of pollutants were low in areas with large precipitation due to the scavenging effect of precipitation on pollutants. Pressure was high in the east and low in the west. Wind speed and RH showed a decreasing trend from the southeast coast to the northwest inland, but there were also high wind speed values in Wuxi, Changzhou and southern Nanjing. The wind speed near Nantong and Suzhou was high, the diffusion condition was good, and pollutant concentrations had been at low levels. Visibility was higher in coastal areas but lower in inland cities, especially in Xuzhou, northern Jiangsu, and parts of southern Jiangsu, which were very poor, corresponding to the distribution of PM2.5 and PM10 concentrations.

3.1.2. Annual Variation in Pollutant Distribution Characteristics

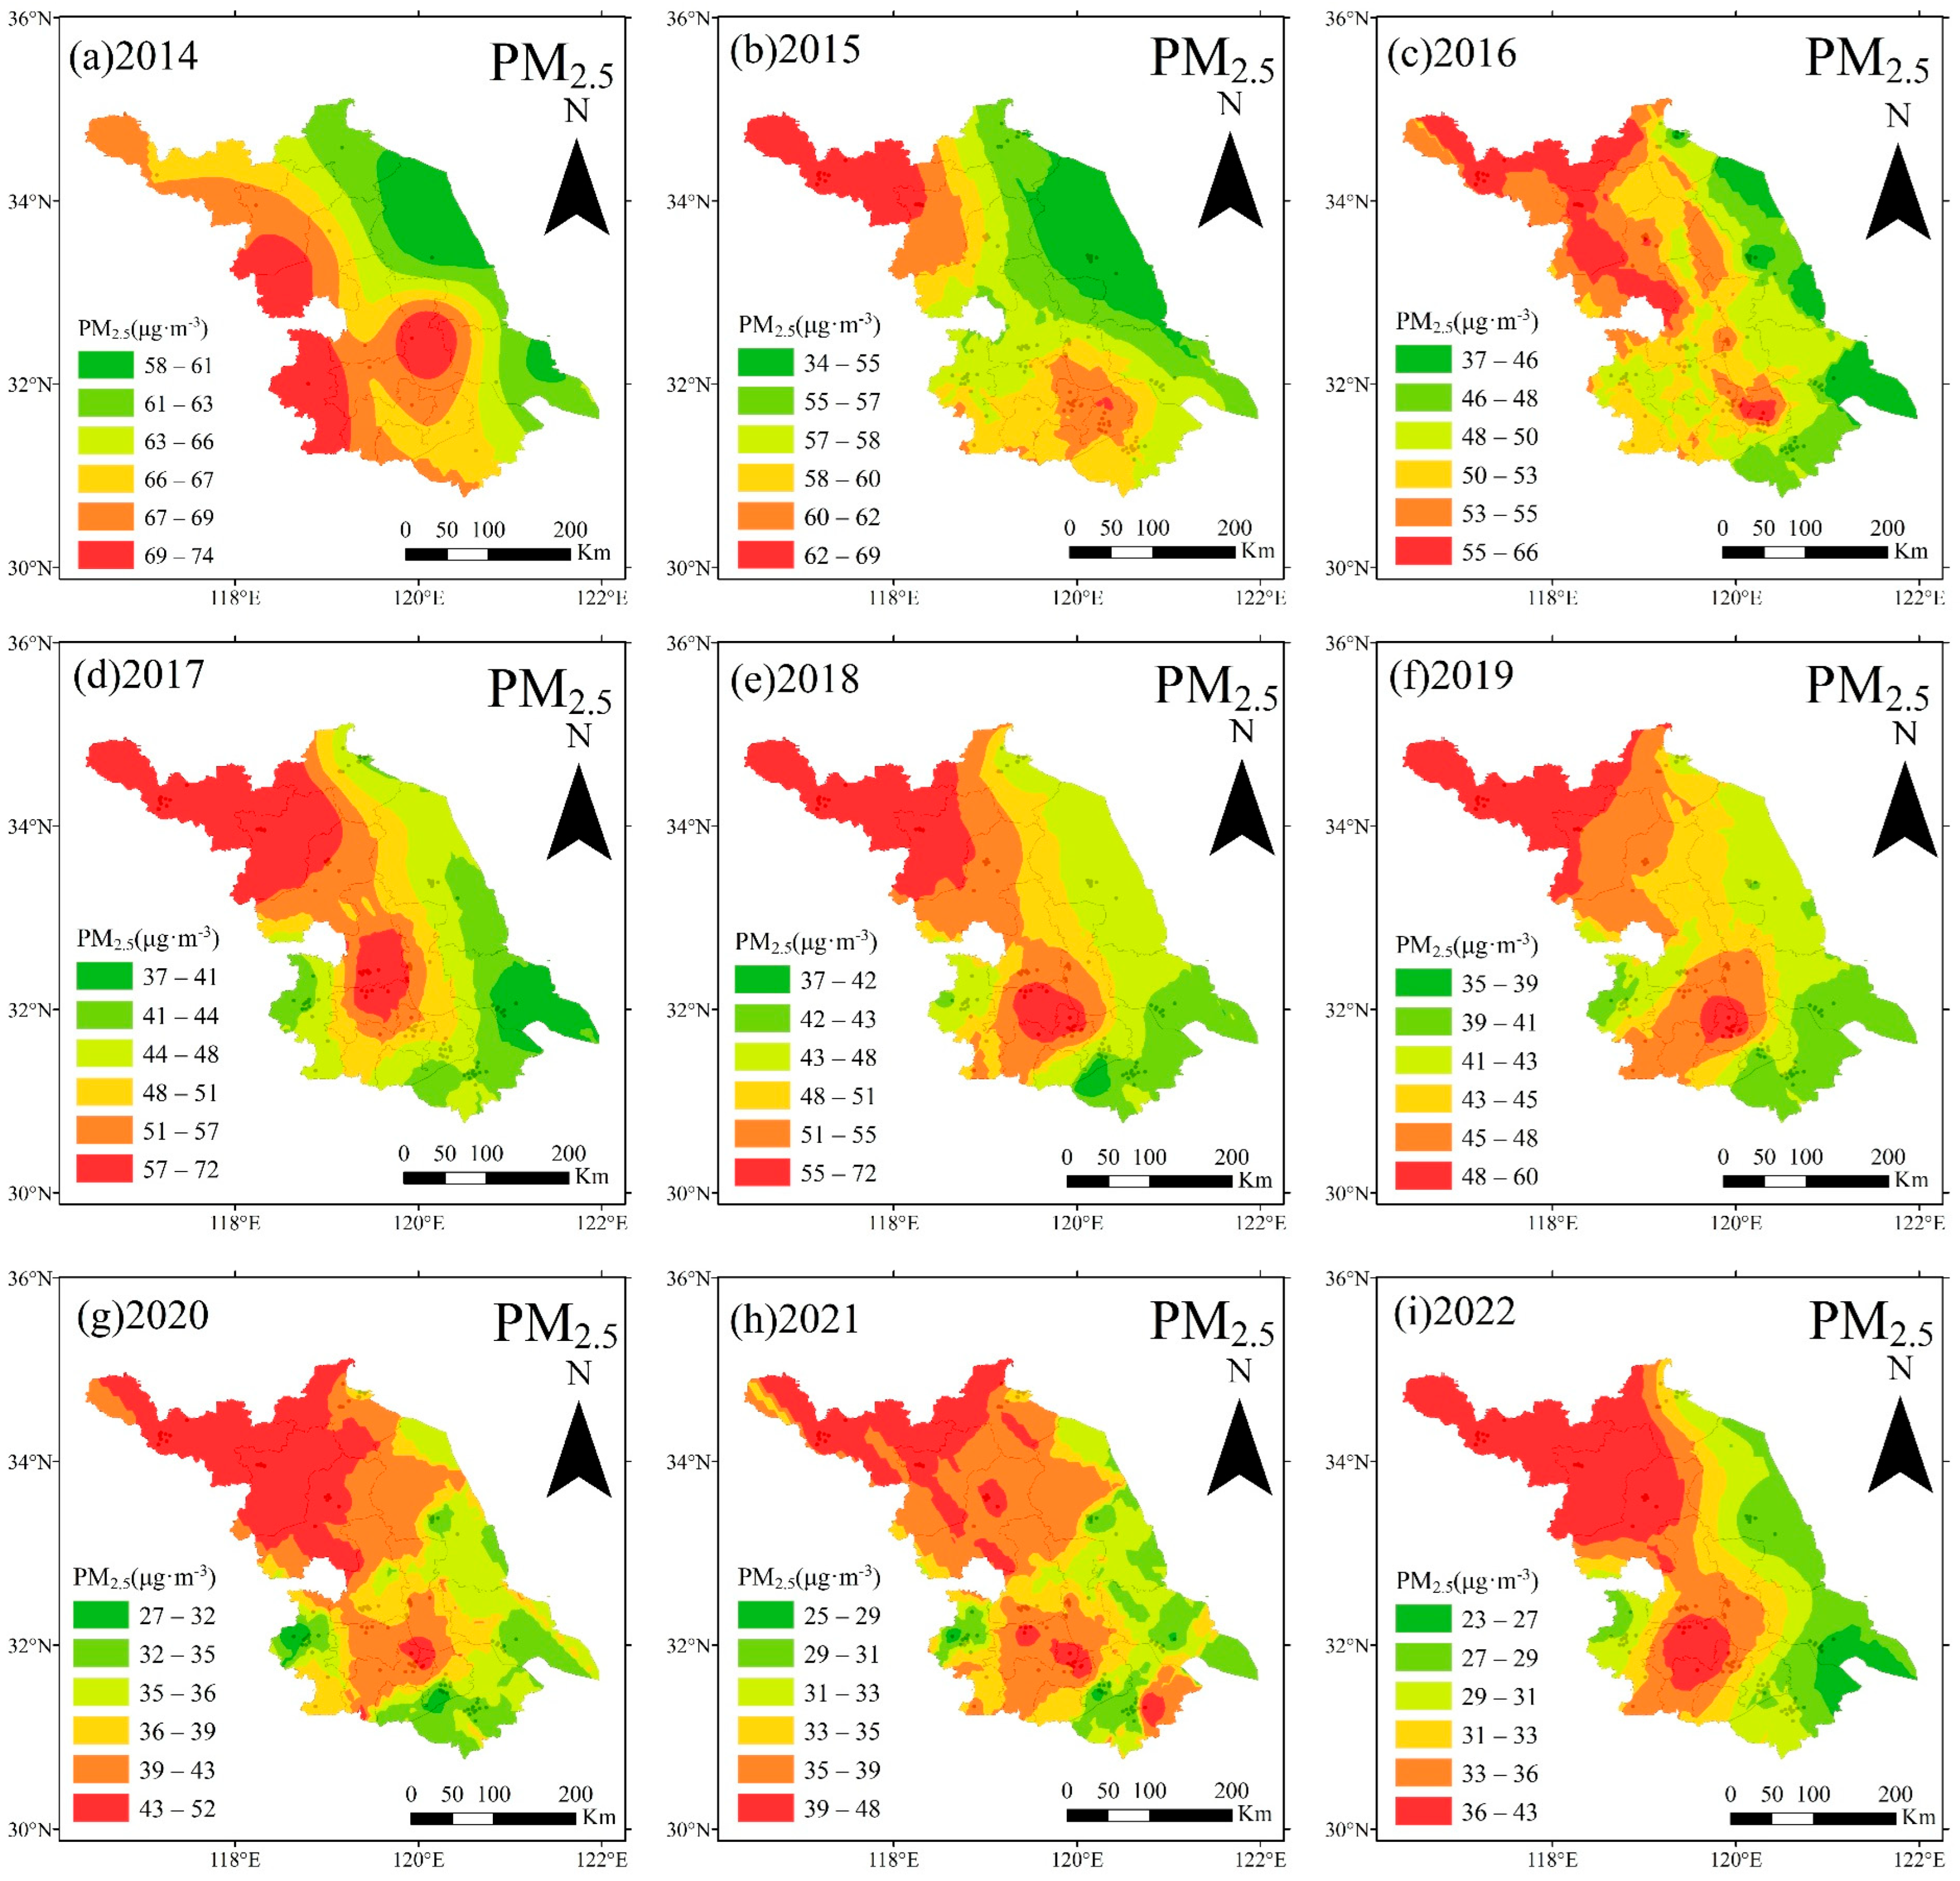
Figure 3 shows that the annual PM2.5 mean mass concentration showed a downward trend during the study period. Figure 3 shows that the overall distribution of PM2.5 mass concentration is high in the northern and central regions, and low in the southeastern region. The PM2.5 mass concentration was higher in the central region of Jiangsu, including Huai’an, Taizhou, and Nanjing, and lower in the eastern coastal areas in 2014. The PM2.5 mass concentration in northern Jiangsu was higher, especially in Xuzhou and Suqian. The concentration in the central region, including Taizhou, Zhenjiang, and other surrounding cities, was also higher.
In contrast, the concentrations in the eastern coastal cities and the southwest region remained at a lower level from 2015 to 2022. The annual spatial distribution of PM10 was similar to that of PM2.5, with high-value areas concentrated in most parts of northern Jiangsu (Figure S2). This may be due to the better dispersion conditions due to higher wind speeds in the eastern coastal areas (Figure S1c), as well as higher precipitation in southern Jiangsu (Figure S1f), which has a more pronounced wet scavenging effect on pollutants [25,32].
Figure S3 shows that the O3 mass concentration was high in the eastern coastal areas and low in the western inland areas, with a high concentration in Yancheng. This may be related to the high O3 production rate caused by the strong atmospheric oxidation capacity in coastal regions [38] and also to the topographic differences between coastal and inland areas. The coastal regions are greatly affected by sea–land breezes, which significantly impact the ozone transport path [39]. The annual mean O3 mass concentration increased by 24% in Jiangsu from 2014 to 2022, indicating that O3 pollution has become more severe in recent years. The increasing trend in the O3 mass concentration level was more pronounced in the southwestern urban agglomerations, including Nanjing, Zhenjiang, Changzhou, Wuxi, and specific areas of Suzhou. This may be related to the city’s higher gross domestic product (GDP), larger population, higher vehicle ownership, and higher level of development (Figures S4–S6). In addition to the rapid growth of the city, it was also related to the decreasing trend of PM2.5 (Figure 3). Xu et al. [40] found that the increase in radiative forcing and the decrease in free radical scattering caused by the reduction of PM2.5 mass concentration both promoted the formation of O3.

3.1.3. Seasonal Variation in Pollutant Distribution Characteristics

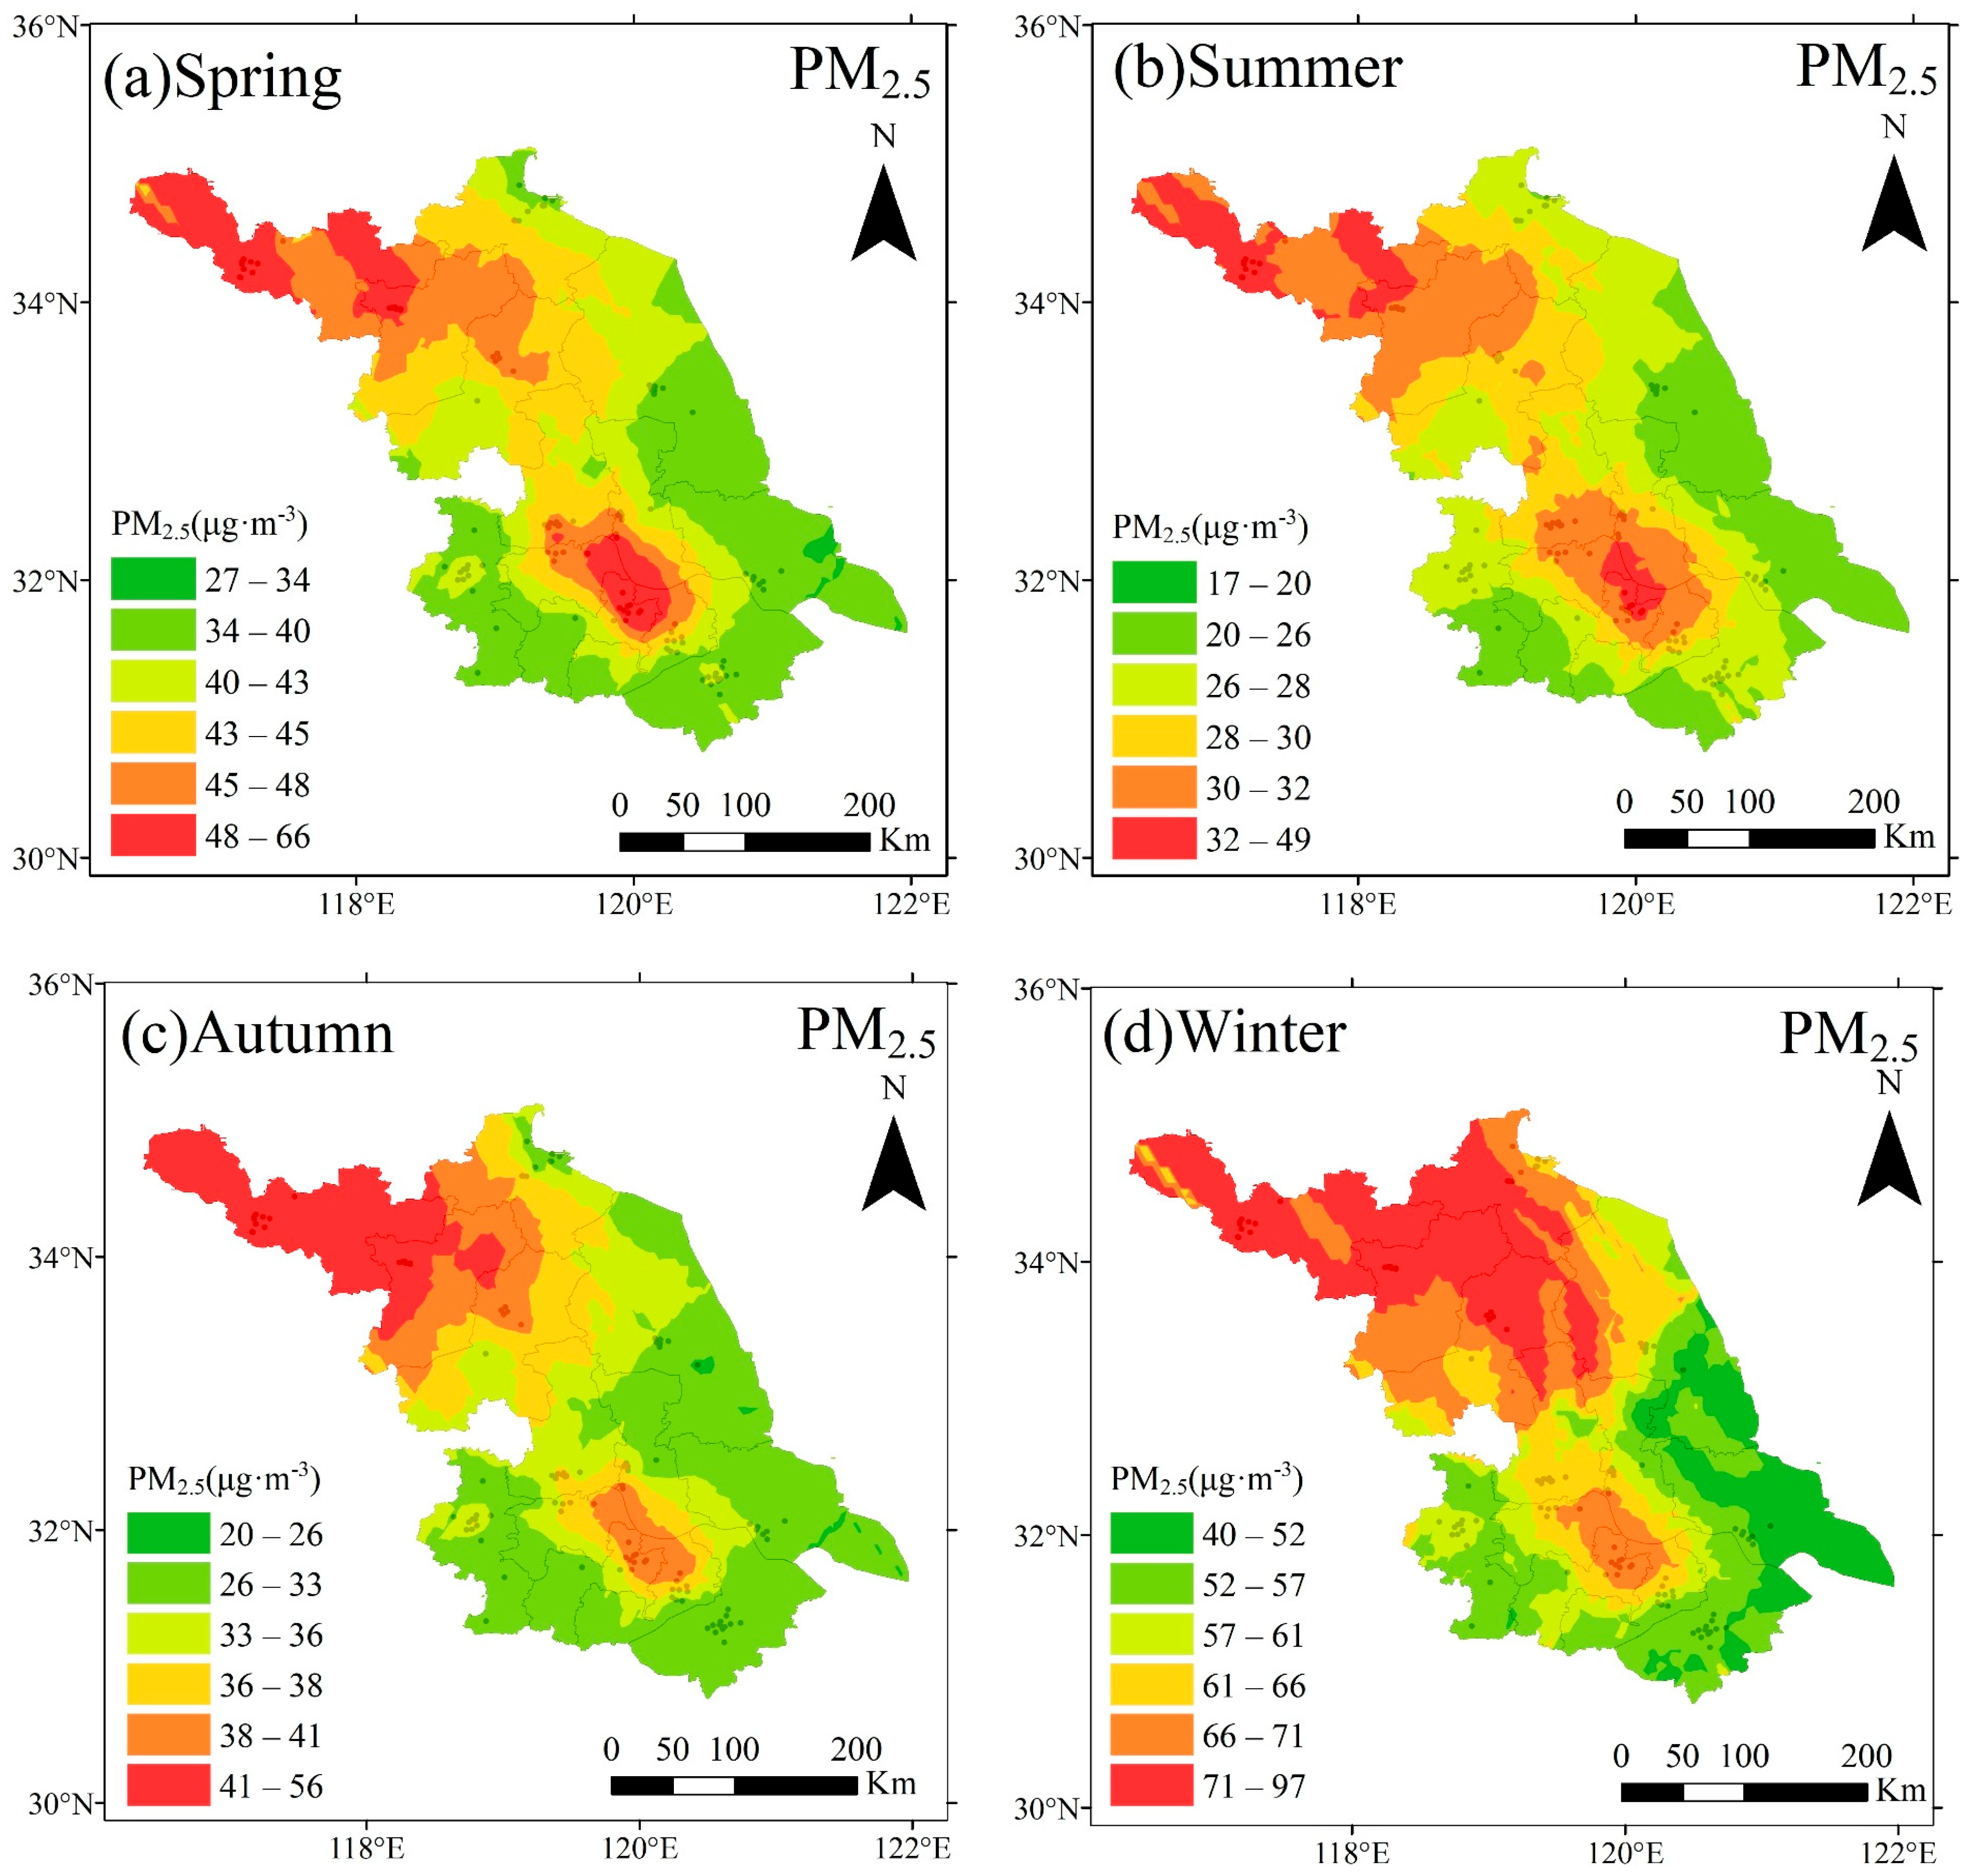
Figure 4 shows that the seasonal distribution characteristics of PM2.5 were different in Jiangsu. PM2.5 mass concentration was high in winter, and the mean mass concentration in most areas of northern Jiangsu was more than 70 μg·m−3. The regional pollution was severe, followed by the low concentration in spring and autumn, and the lowest concentration in summer. This may be related to the severe emission pollution resulting from large-scale coal combustion and poor dispersion conditions, which are exacerbated by low wind speeds in most parts of Jiangsu during winter (Figure S10). The seasonal variation of PM10 mass concentration was similar to that of PM2.5, showed the highest concentration in winter and the lowest concentration in summer, and PM10 concentration in spring is only lower than that in winter (Figure S11), then it may be related to the dusty weather due to the transport of East Asian dust aerosols through long distances to East China under the influence of the cyclone in spring [41].
Figure S12 shows that the seasonal distribution of O3 mass concentration was roughly opposite to that of PM2.5. The concentration was higher in summer, followed by spring and autumn, and the lowest in winter. The highest concentration in winter was only 62 μg·m−3, which was lower than the lowest concentration in summer (67 μg·m−3). This may be due to the strong solar radiation and intense photochemical reactions in summer, which are conducive to the formation of O3 [42]. Consequently, Xuzhou and Suqian inland areas are prone to high O3 mass concentrations in summer.

3.2. Distribution of Pollution Days

3.2.1. Distribution Characteristics of Total Pollution Days During 2014 to 2022

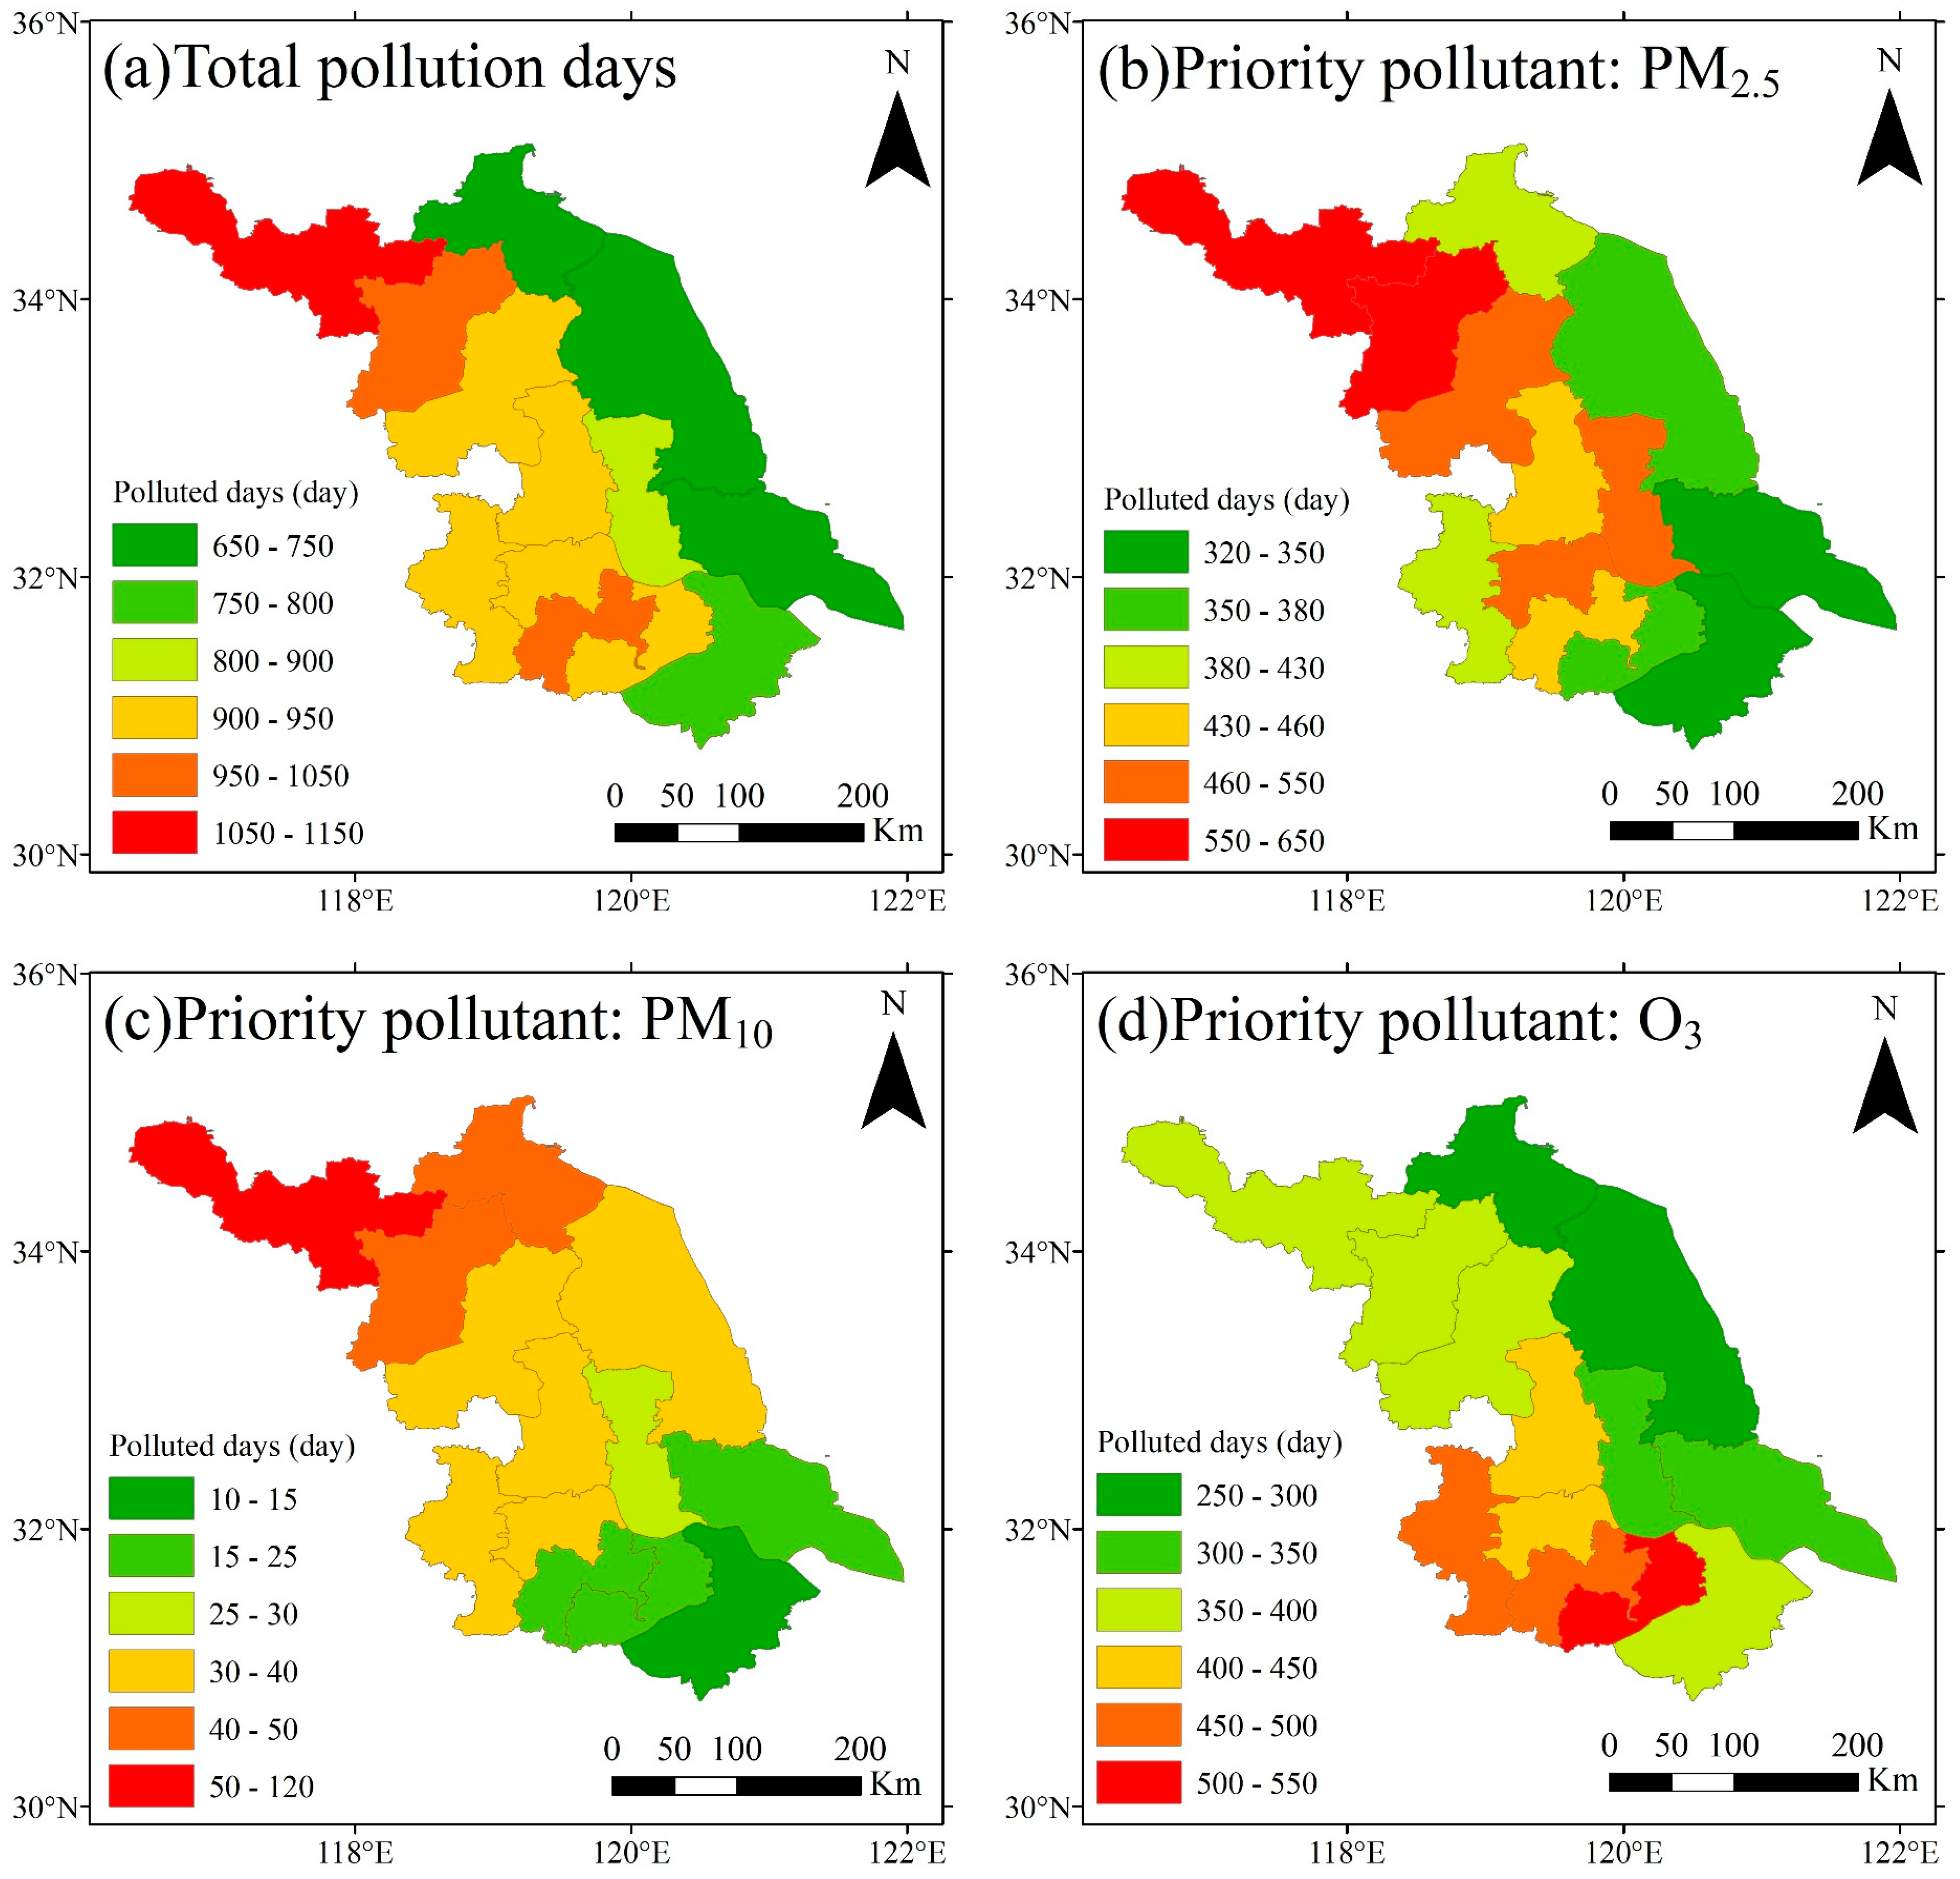
Figure 5a shows that the total number of pollution days (AQI > 100 for any pollutant on those days) in various regions of Jiangsu from 2014 to 2022 exhibited a distribution characteristic of more in the east and less in the west. In the western inland cities, Xuzhou had the most serious pollution, with a total of 1124 pollution days. The total pollution days amounted to 650–750 in the eastern coastal cities. The number of total pollution days in Yancheng was the lowest, at only 665 days, accounting for approximately 20% of the total days over the 9 years.
Figure 5b shows that the distribution characteristics of “PM2.5 pollution days” (the priority pollutant is PM2.5 on these days) were similar to those of total pollution days. The most serious area of PM2.5 pollution was Xuzhou, with 633 days, accounting for 19% of the total days. The PM2.5 pollution in Nantong was the lightest among coastal cities, with only 326 pollution days, accounting for approximately 10% of the total days. The number of “PM10 pollution days” (where PM10 is the priority pollutant) was fewer than that of PM2.5 pollution days, indicating a trend of decreasing from northern Jiangsu to southern Jiangsu. Xuzhou had the most significant number of PM10 pollution days (117 days), while Suzhou had the fewest (10 days) (Figure 5c).
Figure 5d shows that the distribution of “O3 pollution days” (where O3 is the priority pollutant) was similar to that of PM2.5 pollution days in coastal areas, which was lower. This was contrary to the higher concentration of O3 pollutants in coastal cities, which may be due to the fact that coastal O3 pollution events occurred less frequently. Still, their severity was higher, and their mass concentration on O3 pollution days was greater than that in inland areas. The distribution of O3 pollution days in the inland cities of western Jiangsu was opposite to that of PM2.5 pollution days, and the number of O3 pollution days had an increasing trend from Xuzhou to Wuxi. O3 pollution days peaked in Wuxi at 513 days, accounting for approximately 15% of the total days. This is also related to the higher level of urban development and the greater impacts of urban human activities.

3.2.2. Annual Variation in Pollution Days Distribution Characteristics

Figure S16 shows that the number of total pollution days in each city of Jiangsu showed a downward trend from 2014 to 2022. It was the highest in 2014 (1707 days) and the lowest in 2021 (857 days), representing a 50% reduction. In particular, the number of total pollution days decreased significantly from 2020 to 2022. This was related to the good foundation laid by the 13th Five-Year Plan and the development of the 14th Five-Year Plan. In 2015 and later, the areas with higher total pollution days began to spread to northern Jiangsu. This may be due to the transfer of industries from southern Jiangsu to northern Jiangsu during the 12th Five-Year Plan period, which promoted the development of northern Jiangsu but also increased the proportion of total pollution days in some cities in the north.
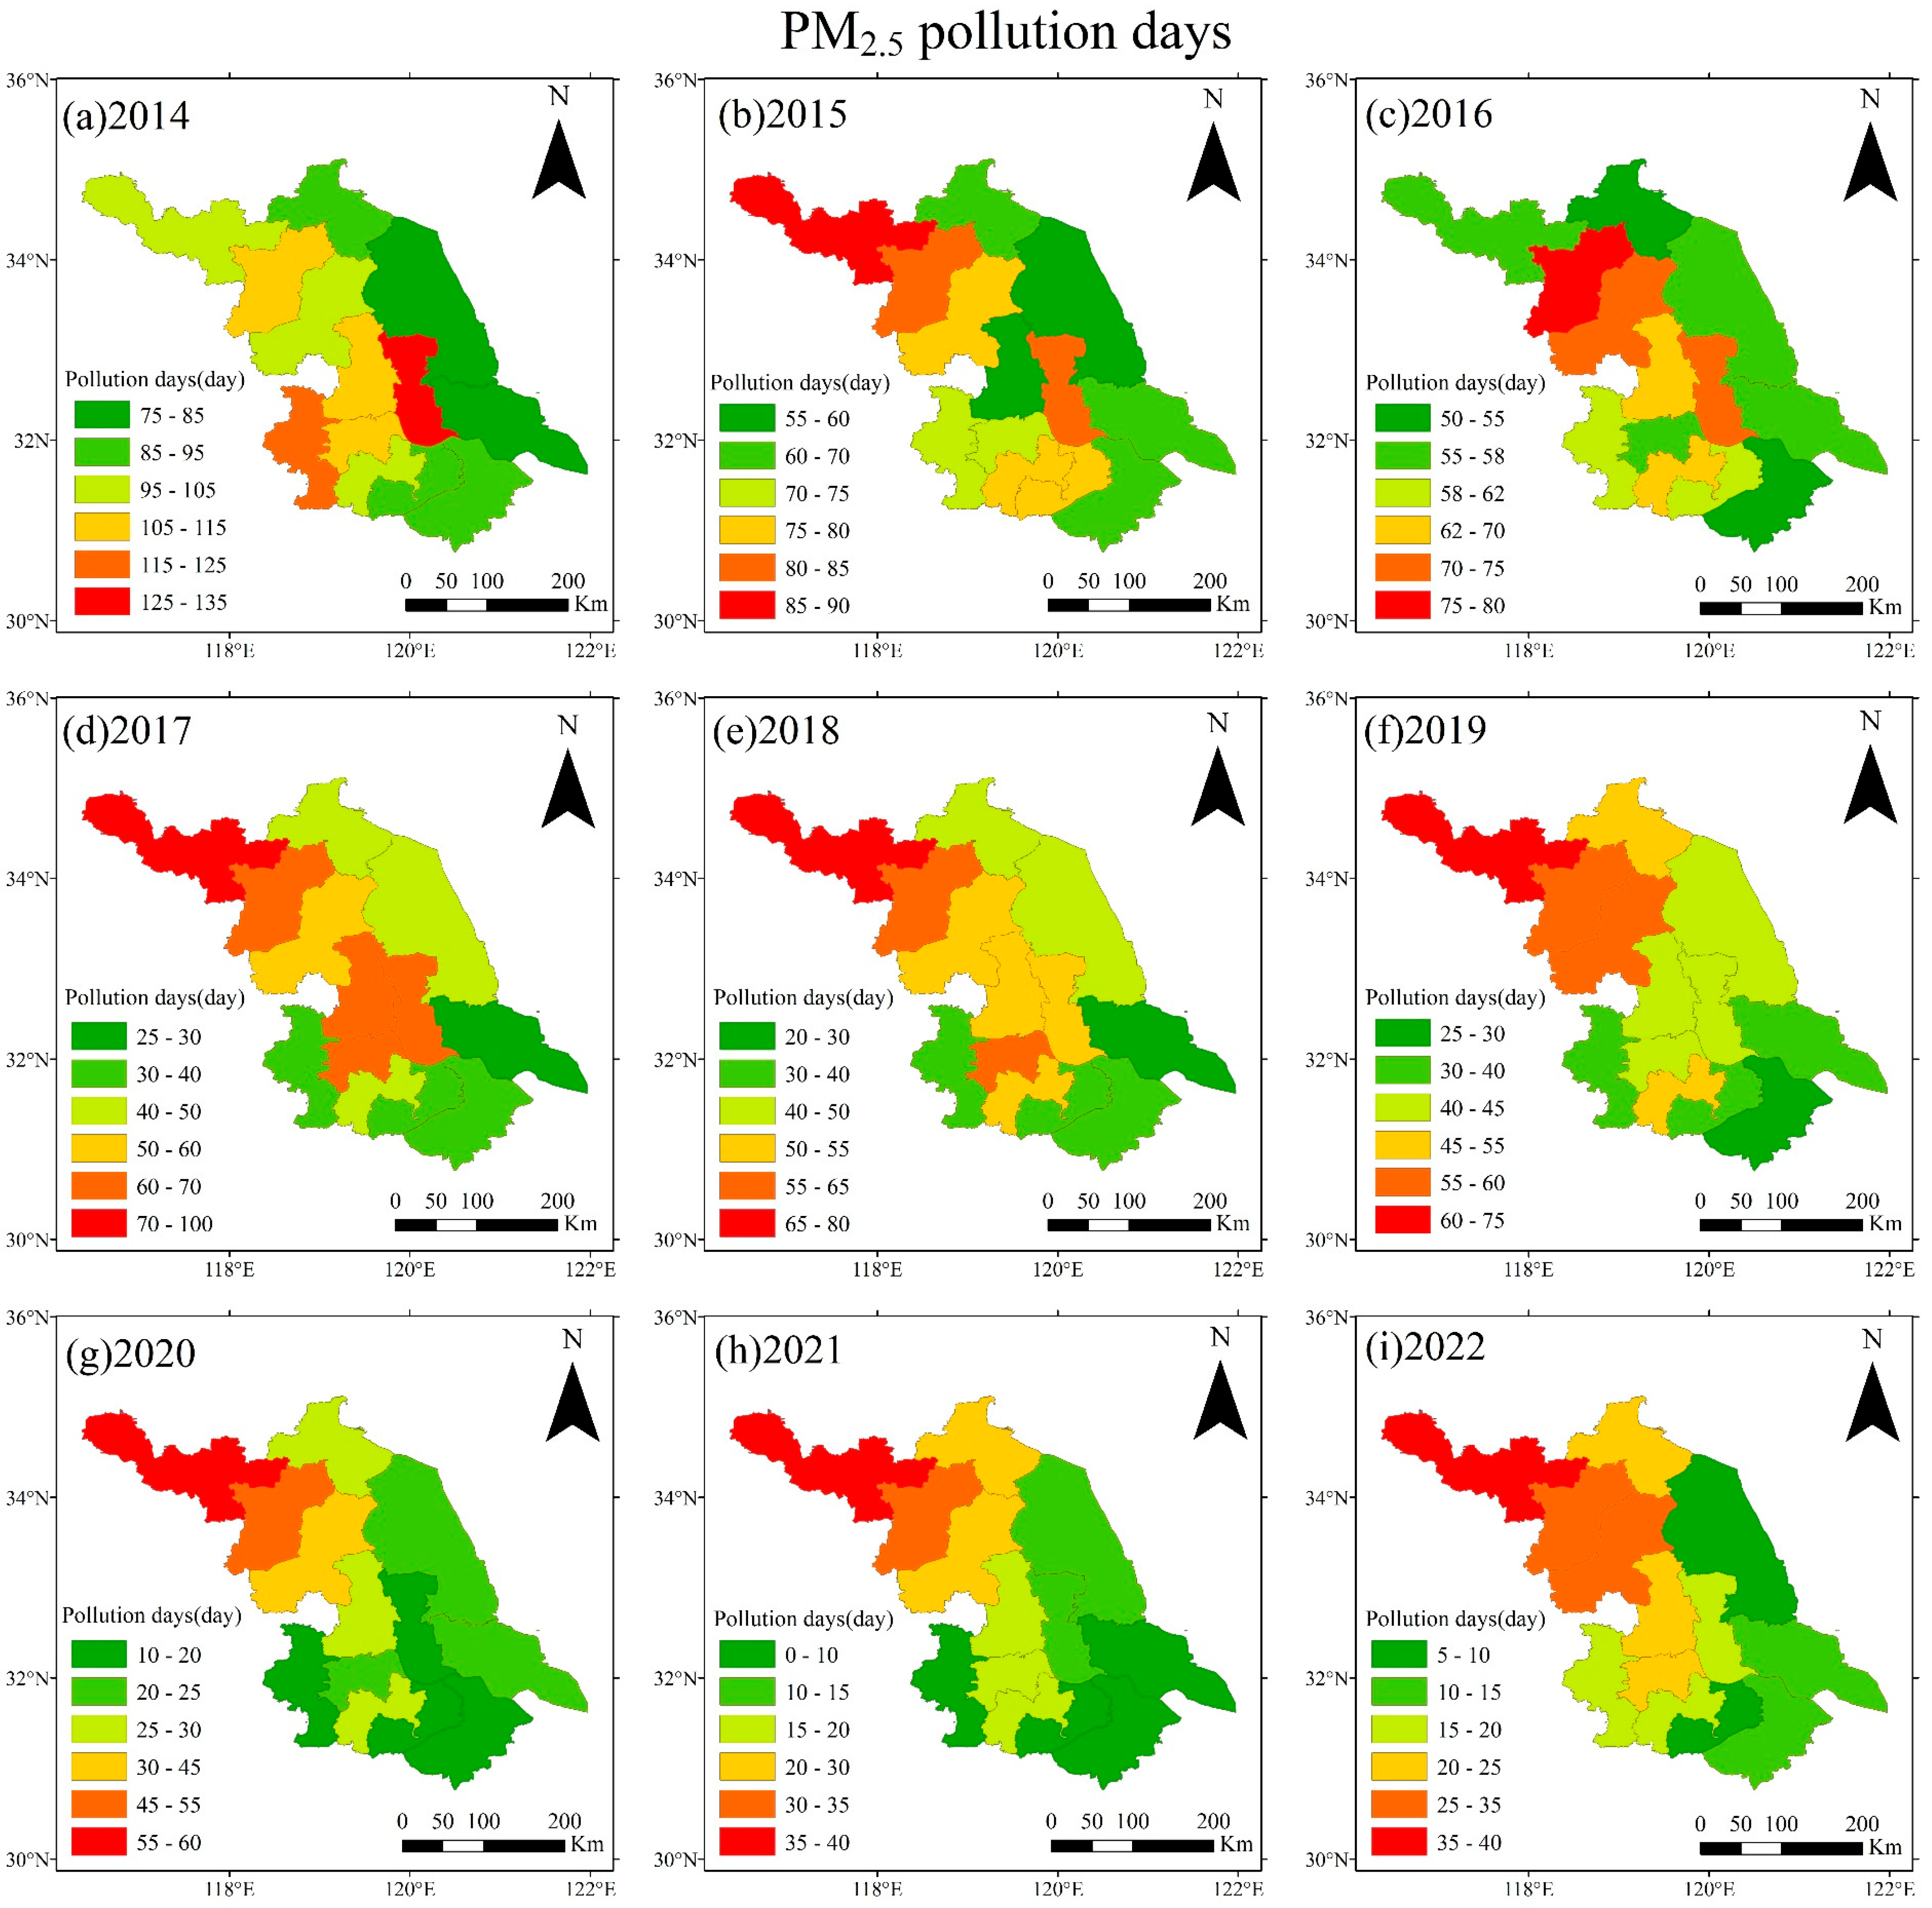
Figure 6 shows that the number of days with PM2.5 pollution in Jiangsu exhibited a downward trend from 2014 to 2022. Except for the fact that the number of PM2.5 pollution days in 2022 was 17% higher than that in 2021, the number of such days had been decreasing from 2014 to 2021. Specifically, there were 1316 PM2.5 pollution days in 2014 and 224 in 2021, representing an 83% decrease in pollution days. This shows that the government’s various environmental governance and emission reduction policies have been very effective. The areas with higher PM2.5 pollution days were concentrated in central Jiangsu and its surrounding areas in 2014, among which Taizhou had the most pollution days (132 days), accounting for 36% of the total days in this year. The areas with higher PM2.5 pollution days were concentrated in northern Jiangsu, specifically in Xuzhou, Suqian, and Huai’an, from 2015 to 2022. Xuzhou was the city with the highest PM2.5 pollution days in 2015 and from 2017 to 2022, and Suqian had the highest PM2.5 pollution days in 2016 (77 days), accounting for 21% of the year.
Figure S17 shows that the total number of O3 pollution days in Jiangsu showed a fluctuating upward trend from 2014 to 2022. The total number of O3 pollution days was 299 in 2014 and 753 in 2022, representing a 152% increase. O3 pollution days were also relatively high in 2017 (751 days) and 2019 (687 days), with an increase of about 45% compared with the previous year in each case. Additionally, the increase in 2022 was 42% compared with the previous year. The cities with the highest year-on-year growth rates in 2017, 2019 and 2022 were Yangzhou (65 days), Zhenjiang (64 days) and Xuzhou (63 days). Their year-on-year growth rates were 85.7%, 68.4% and 133.3%, respectively. The level of urban development in southern Jiangsu was relatively high, and urban O3 pollution was prone to occur. With the development of the economy (Figure S4), the pollution of some cities in northern Jiangsu has increased after 2017, such as Xuzhou in 2017 (75 days), followed by Suqian (73 days), and Suqian in 2019 (69 days).

3.2.3. Seasonal Variation in Pollution Days Distribution Characteristics

Figure S19 shows that there were seasonal differences in pollution days of cities in Jiangsu from 2014 to 2022. The number of total pollution days peaked in winter, followed by spring and summer, with autumn being the least, at only 43.5% of the number in winter. In addition to Suqian in northern Jiangsu, Nanjing and Changzhou in southern Jiangsu also had higher total pollution days. In winter, Xuzhou had the highest total pollution days (432 days). In terms of distribution characteristics, spring was similar to autumn, with higher concentrations in parts of northern Jiangsu and southern Jiangsu. In contrast, summer was opposite to autumn, with higher concentrations of south Jiangsu during summer and in the north of Jiangsu during winter. This may be due to the significant heating demand in some areas of northern Jiangsu in winter, and the high proportion of coal combustion, which is prone to pollution events.
Figure 7 shows that the number of PM2.5 pollution days in Jiangsu from 2014 to 2022 peaked in winter (3718 days), followed by spring (1035 days), autumn (810 days), and was the fewest in summer (219 days), which accounts for 5.9% of those in winter. In the spring, there were more days with high PM2.5 pollution in northern Jiangsu and central Jiangsu, with the highest number in Taizhou (105 days). Other cities with higher PM2.5 pollution days were Yangzhou (95 days), Zhenjiang (96 days), Xuzhou (97 days) and Suqian (95 days). In summer, it was concentrated in the central region of Jiangsu and some parts of southern Jiangsu. Taizhou had the highest PM2.5 pollution days (36 days), followed by Yangzhou (31 days). Nanjing (24 days) and Zhenjiang (25 days) were cities with higher PM2.5 pollution days in southern Jiangsu. The distribution of PM2.5 pollution days in autumn was similar to that in winter. The cities with higher PM2.5 pollution days were concentrated in northern Jiangsu, but the number of PM2.5 pollution days was higher during winter. In autumn, Xuzhou had the highest PM2.5 pollution days (116 days), followed by Suqian (85 days) and Huai’an (73 days). In winter, Xuzhou had the most days with PM2.5 pollution (405 days), followed by Suqian (369 days) and Huai’an (339 days), which also experienced higher PM2.5 pollution levels.
Figure S20 shows that most cities with higher PM10 pollution days were concentrated in northern Jiangsu, especially Xuzhou, where all four seasons had the most PM10 pollution days. The total number of PM10 pollution days peaked in spring (278 days), followed by autumn (105 days), winter (89 days), and the lowest in summer (10 days). This can be explained by the fact that spring is a high-incidence season for dust weather in Jiangsu, and due to the significant contribution of dust weather to PM10, there is little such weather in summer [43]. Figure S21 shows that cities with higher O3 pollution days are concentrated in southern Jiangsu, including Nanjing, Zhenjiang, Changzhou, Yangzhou, and Wuxi. In summer, the total number of O3 pollution days in the province was the highest (2646 days). This is also consistent with the fact that ozone pollution tends to occur in summer. In addition to the above-mentioned urban areas, Xuzhou and Suqian in northern Jiangsu also had higher O3 pollution days. There were no O3 pollution days in the entire province during winter.

3.3. Impacts of Meteorological Factors on Pollutants

3.3.1. Correlation Between Pollutants and Meteorological Factors

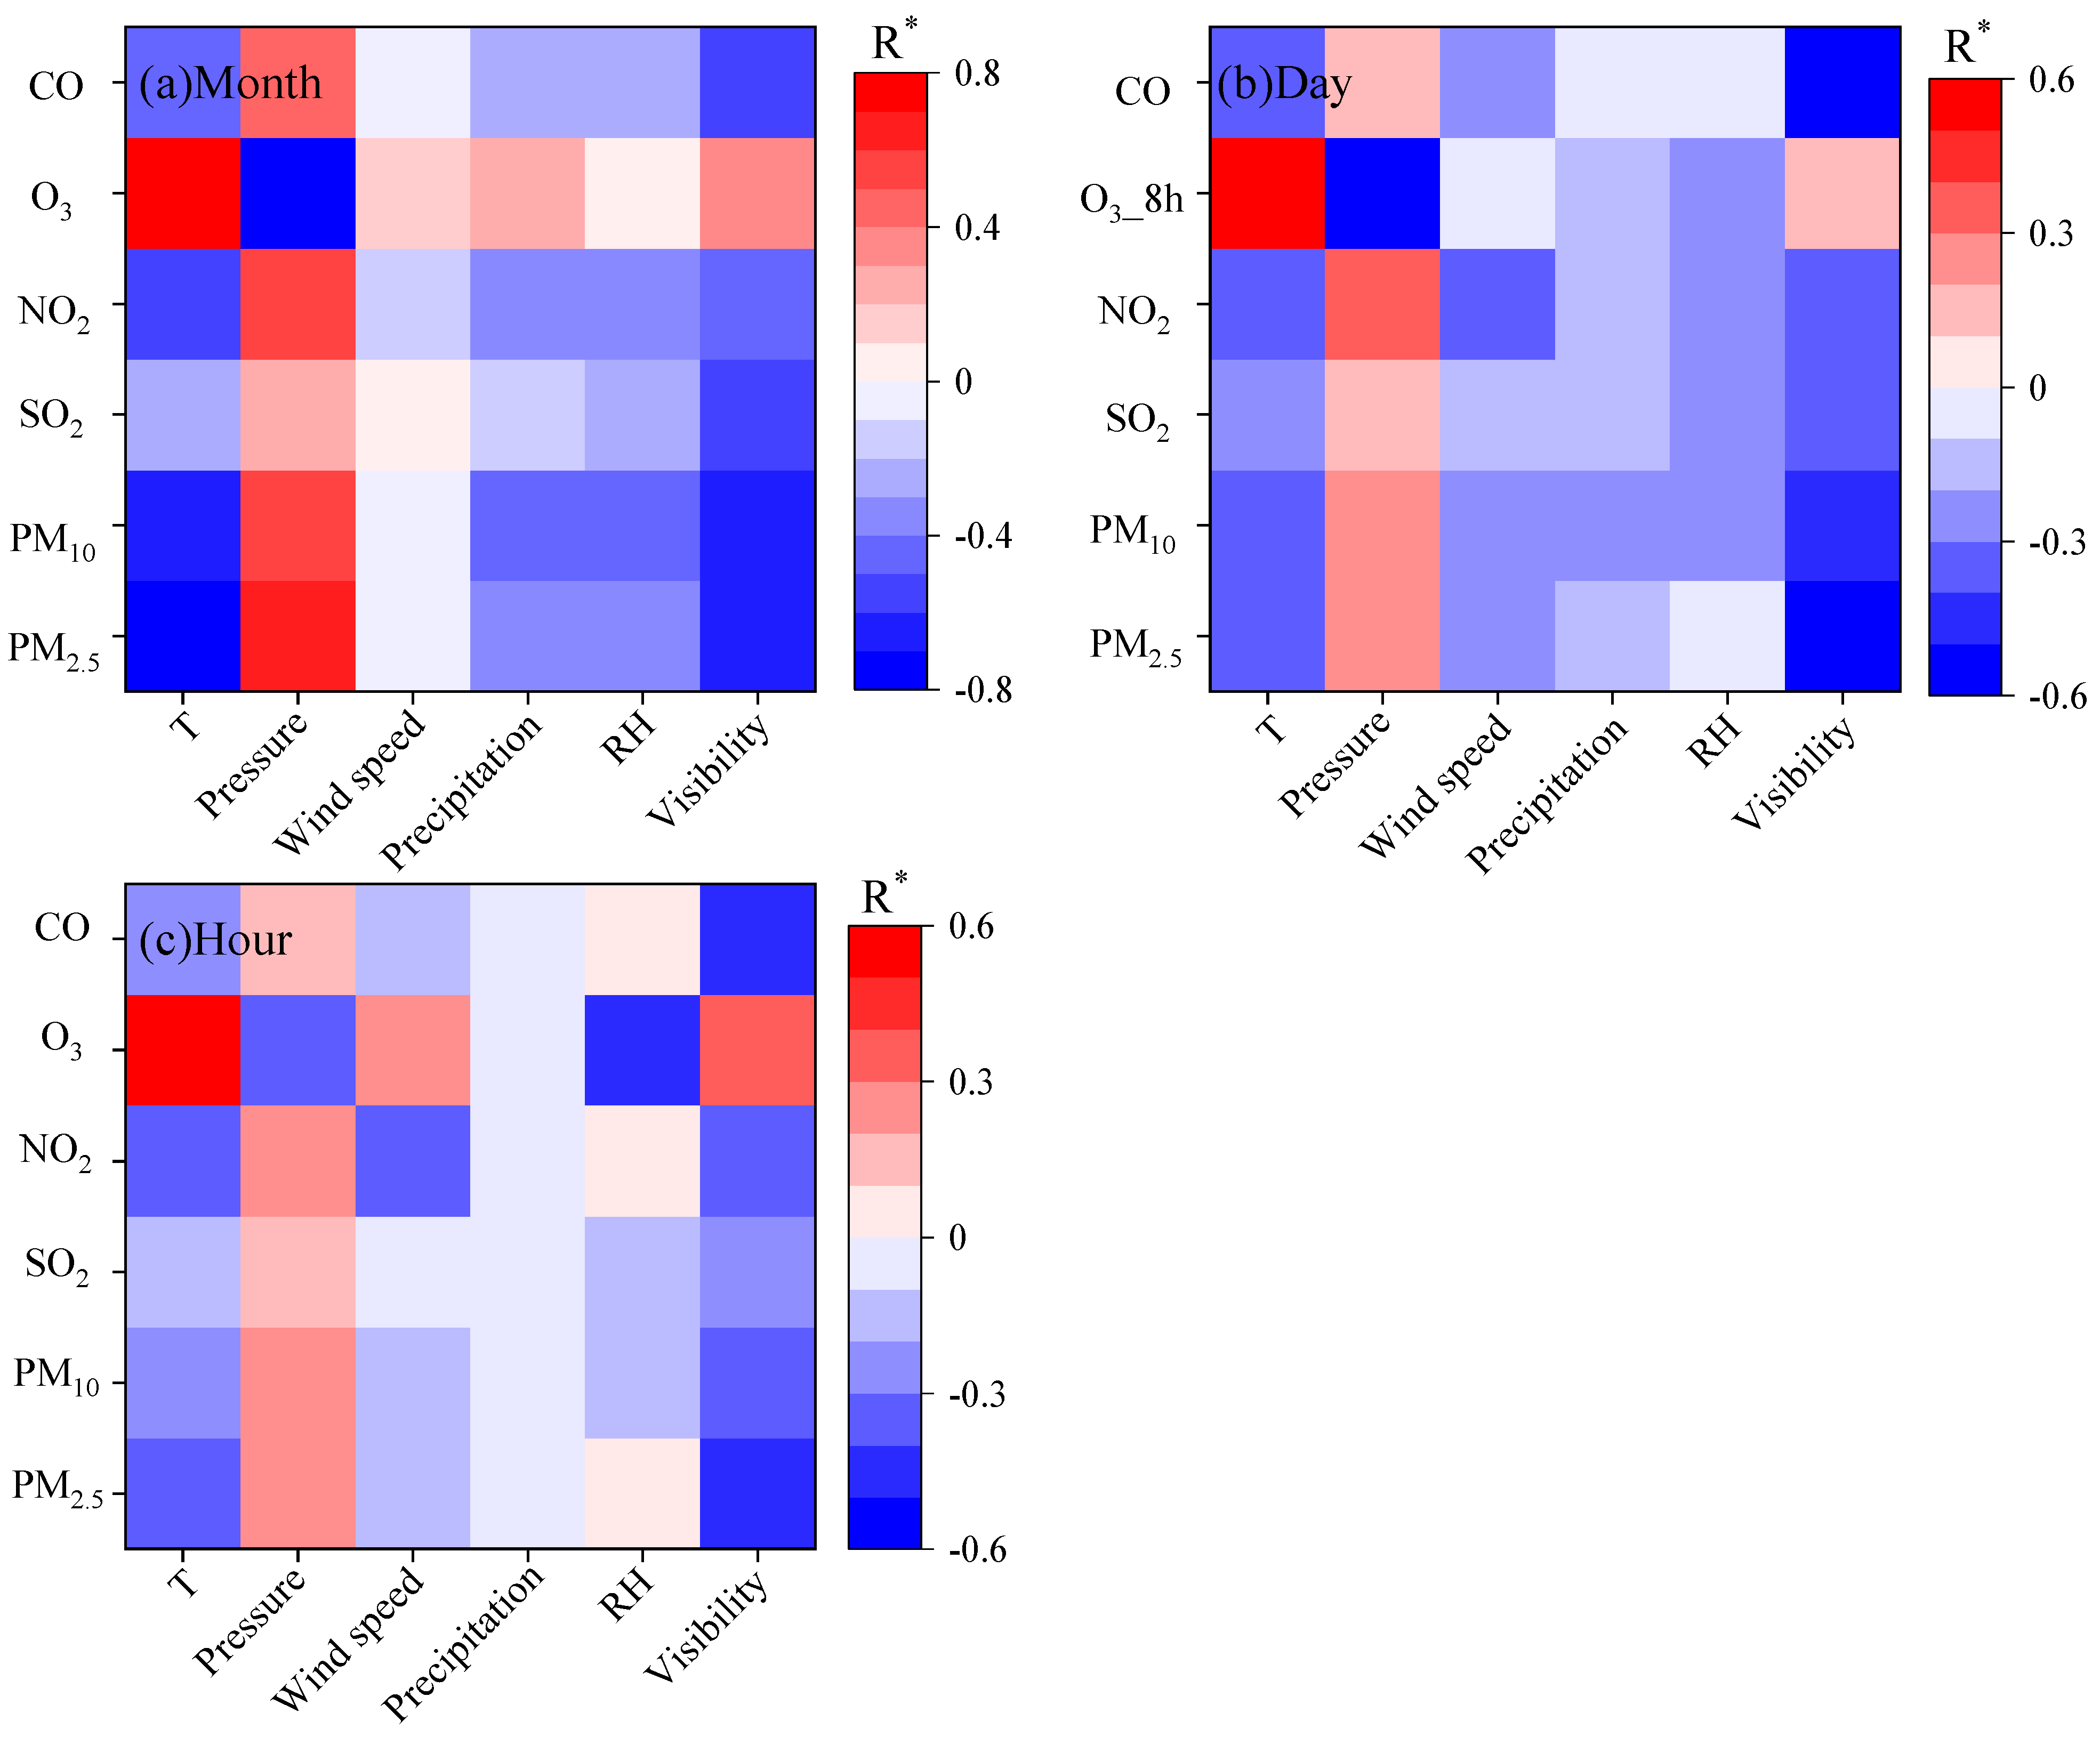
Figure 8 shows the Correlation between air pollutants mass concentrations and meteorological factors at different scales. At the monthly scale, PM2.5, PM10, NO2, CO, and SO2 were negatively correlated with temperature, with a correlation coefficient of −0.73 between PM2.5 and temperature. The increase in temperature will promote the activity of atmospheric molecules, causing pollutants to diffuse and dilute more easily, thereby reducing their concentration [44]. There was a significant positive correlation between O3 and temperature (R = 0.80). The photochemical reaction efficiency of volatile organic compounds was higher at higher temperatures, which was conducive to the formation of O3 [42]. The Correlation between pollutants and pressure is essentially positive. There was a weak negative correlation between PM2.5, PM10, NO2, CO, SO2 and precipitation and RH (−0.44 < R < −0.16), which was related to the wet scavenging effect of precipitation on air pollutants [32], and the RH was also higher when precipitation occurred. There was a weak positive correlation between O3 and precipitation and RH. This was because the monthly precipitation in summer was significant, and the RH was also large, resulting in a false phenomenon of positive Correlation. The Correlation between pollutants and wind speed was weak (−0.10 < R < 0.10). O3 was positively correlated with visibility, and other pollutants were negatively correlated with visibility (−0.66 < R < −0.48). PM2.5 and PM10 were the main reasons for the decrease in visibility.
The correlations (−0.36 < R < −0.13) between PM2.5, PM10, NO2, CO, SO2 and wind speed at the daily scale and hourly scale were more obvious than that at the monthly scale, probably because average wind speed varies more significantly with smaller time scales. The positive correlations between O3 and precipitation and RH at the monthly scale become weak negative correlations at the daily and hourly scales. This is because an increase in cloud cover will accompany the increase in RH, and the intensity of solar radiation passing through the cloud layer will be weakened, resulting in a weakening of the photochemical reaction and a decrease in O3 mass concentration [30]. Clouds can influence the overall oxidizing capacity of the troposphere on a global scale by stimulating the production of OH radicals through ozone photolysis by UV and visible light at the air–water interface [45]. The Correlation between pollutants and precipitation at the hourly scale was not significant, which may be due to the short time period and the insignificant change in precipitation.

3.3.2. Impacts of Precipitation, Wind Speed and Direction

To distinguish different degrees of precipitation, according to the Grade of Precipitation (GB/T 28592-2012 [46]) specified by the China Meteorological Administration, the days on which precipitation occurs depending on the 24 h daily precipitation are divided into six types of precipitation days: scattered rain days (<0.1 mm), light rain days (0.1–9.9 mm), moderate rain days (10.0–24.9 mm), heavy rain days (25.0-49.9 mm), torrential rain days (50.0–99.9 mm) and severe torrential rain days (100.0–249.9 mm) (Table 1).
Table 1 shows that the greater the daily precipitation, the more obvious the removal of pollutants. Precipitation had the most pronounced effect on PM10 removal. Except for light rain days, the mass concentration reduction in precipitation days relative to scattered rain days was the largest among the pollutants, among which the reduction in moderate rain days was 47.2%, and the reduction in severe torrential rain days was 69.1%. The removal of PM2.5 by precipitation was also obvious. The average mass concentration of PM2.5 on light rain to heavy rain days was 20.3–66.3% lower than that on scattered rain days. The mass concentration of SO2 in light rain days decreased by 28.4% compared with that in scattered rain days, and the removal effect of precipitation to a greater degree was not much different, with a decrease of about 40%. The scavenging effect of precipitation on NO2 was poor, with an average reduction of 30.2% compared with the mass concentration in scattered rain days., The precipitation had the most significant effect on the removal of CO, with a decrease of only 6.5% in light rain and 19.0% in heavy rain, resulting in an average decrease of 13.4% compared to the mass concentration on scattered rain days. Precipitation also exhibits a significant scavenging effect on O3. The impact of precipitation on the removal of O3 did not increase with increasing precipitation. The removal effect of O3 was roughly the same in light rain, moderate rain and torrential rain days, with an average decrease of 17.6% compared with the mass concentration in scattered rain days. Compared to the mass concentration on scattered rain days, the decrease in heavy rain days was the smallest, at 14.7%, and the decrease in severe torrential rain days was the largest, at 25.9%.
Figure 9 for the data obtained from one meteorological station in each prefecture-level city in Jiangsu, for a total of 13 stations. It shows that the easterly wind accounted for a large proportion in spring and summer in Jiangsu during 2014 to 2022, and the northerly wind and easterly wind were dominant in autumn and winter. In general, there were more easterly winds in Jiangsu, and the wind speed is larger, mainly above 3 m·s−1. This is because Jiangsu is a coastal province and is significantly influenced by sea breezes. Most pollutants were transported to inland cities by sea breeze, resulting in lower concentrations in coastal areas and higher concentrations in inland regions. Secondly, the proportion of northerly wind in autumn and winter was also higher. Combined with the overall distribution characteristics of pollutants (Figure 2), some areas in northern Jiangsu were obviously affected by the transport of northerly wind.
Currently, this study has certain limitations: first, it lacks sufficient temporal and spatial detail. Although it covers the period from 2014 to 2022, it does not conduct an in-depth analysis of the abnormal effects of special climatic conditions, such as extreme heat, on pollutants. Additionally, it lacks a detailed correlation analysis of differences in emission sources (such as industrial types and traffic flow) among cities in northern and southern Jiangsu Province. Second, the consideration of influencing factors is incomplete, as it does not fully incorporate the role of land surface factors such as topography and vegetation cover in pollutant dispersion. Third, the discussion of O3 formation mechanisms is superficial, as it only establishes a positive Correlation between O3 and temperature and the limited influence of precipitation, but does not explore the quantitative relationship between the emission intensities of precursors, such as VOCs and NOx, and O3 formation.
However, based on the current research and analysis findings, these empirical data and summaries of patterns not only provide a solid data foundation for formulating future environmental policies in Jiangsu Province but also specifically identify key directions for pollution control efforts. Specifically, efforts can be focused on the following three areas: First, strengthen precise control of ozone pollution. Target coastal regions such as Yancheng and Nantong, which have high O3 levels, and address the seasonal characteristics of high O3 levels during summer. Promote the coordinated reduction in VOCs and NOx emissions, and establish an emergency control mechanism for high-temperature periods in the summer. Second, implement regionally differentiated governance. In northern Jiangsu, cities such as Xuzhou and Suqian, which have high PM2.5 and PM10 levels, should strengthen their pollution control efforts, while southern Jiangsu should focus on preventing ozone pollution. At the same time, establish a joint prevention and control mechanism between coastal and inland cities to address the impact of pollutant transport caused by easterly winds from the East China Sea. Third, optimize emission reduction strategies based on meteorological conditions. During winter, strengthen pollution control measures for coal-fired heating systems to target particulate matter. During the summer, leverage the pollutant-clearing effect of precipitation on pollutants to advance simultaneous emission reductions.

4. Conclusions

From 2014 to 2022, pollutants in Jiangsu Province exhibited significant spatiotemporal differences with marked regional variations. Temporally, O3 concentrations increased year by year, while other pollutants decreased annually. Seasonally, O3 peaked in summer and was lowest in winter, while other pollutants peaked in winter and reached their lowest levels in summer. Pollution days also show regional differentiation. Temporally, PM2.5 and PM10 pollution days decreased annually, while O3 pollution days increased yearly. Seasonally, PM2.5 pollution days are higher in northern Jiangsu during autumn and winter, while O3 pollution days are higher in southern Jiangsu during spring, summer, and autumn.
The association between pollutants and meteorological factors exhibits distinct characteristics. The negative Correlation between PM2.5, PM10, NO2, CO, SO2 and wind speed is more pronounced at daily and hourly scales than at the monthly scale. The positive Correlation between O3 and temperature is significant in spring and autumn but weaker in summer; high winter humidity tends to exacerbate PM2.5 concentrations. Relative humidity (RH) shows a significant negative correlation with PM10 in spring, summer and autumn. The removal effect of precipitation on pollutants varies by type and intensity: except for O3, pollutant concentrations decrease with increasing precipitation. Compared to light rain days, O3 concentration decreases are smallest on heavy rain days (14.7%) and largest on extreme heavy rain days (25.9%). Most pollutants in Jiangsu are influenced by easterly sea breezes, exhibiting “lower coastal, higher inland” distribution. Additionally, the details of the analysis are provided in the supplement.
In summary, while this study has certain limitations, such as failing to consider the impact of underlying surface and emission source factors on pollutant dispersion, and conducting only simple correlation analysis between pollutants and meteorological factors, it can still provide some data support for future pollution control in Jiangsu Province.

Supplementary Materials

The following supporting information can be downloaded at: https://www.mdpi.com/article/10.3390/atmos16091079/s1, Table S1. Concentration limits of pollutants. Table S2. The level and type of Air Quality Index (AQI). Table S3. The correlation between pollutants and meteorological factors in different seasons. Figure S1. The distribution of meteorological elements in Jiangsu during 2014 to 2022. Figure S2. Annual distribution of PM10 mean mass concentration in Jiangsu during 2014 to 2022. Figure S3. Annual distribution of O3 mean mass concentration in Jiangsu during 2014 to 2022. Figure S4. Annual distribution of GDP in Jiangsu during 2014 to 2022. Figure S5. Annual distribution of population in Jiangsu during 2014 to 2022. Figure S6. Annual distribution of vehicle in Jiangsu during 2014 to 2022. Figure S7. Annual distribution of SO2 mean mass concentration in Jiangsu during 2014 to 2022. Figure S8. Annual distribution of NO2 mean mass concentration in Jiangsu during 2014 to 2022. Figure S9. Annual distribution of CO mean mass concentration in Jiangsu during 2014 to 2022. Figure S10. Seasonal distribution of mean wind speed in Jiangsu during 2014 to 2022. Figure S11. Seasonal distribution of PM10 mean mass concentration in Jiangsu during 2014 to 2022. Figure S12. Seasonal distribution of O3 mean mass concentration in Jiangsu during 2014 to 2022. Figure S13. Seasonal distribution of SO2 mean mass concentration in Jiangsu during 2014 to 2022. Figure S14. Seasonal distribution of NO2 mean mass concentration in Jiangsu during 2014 to 2022. Figure S15. Seasonal distribution of CO mean mass concentration in Jiangsu during 2014 to 2022. Figure S16. Annual distribution of total pollution days in Jiangsu during 2014 to 2022. Figure S17. Annual distribution of O3 pollution days in Jiangsu during 2014 to 2022. Figure S18. Annual distribution of PM10 pollution days in Jiangsu during 2014 to 2022. Figure S19. Seasonal distribution of total pollution days in Jiangsu during 2014 to 2022. Figure S20. Seasonal distribution of PM10 pollution days in Jiangsu during 2014 to 2022. Figure S21. Seasonal distribution of O3 pollution days in Jiangsu during 2014 to 2022.

Author Contributions

Conceptualization, Z.W., Y.Y., X.Z., J.C., K.C., J.G., J.W., K.W. and Y.W.; Methodology, H.W., Y.K., Y.Y., J.C., K.C., J.W., K.W. and Y.W.; Software, Y.K.; Validation, Z.W.; Investigation, Z.W.; Resources, Y.Y. and X.Z.; Data curation, H.W. and X.Z.; Writing—original draft, Z.W. and H.W.; Writing—review & editing, Z.W. and H.W.; Supervision, Z.W., H.W., Y.K., J.C., K.C., J.G., J.W., K.W. and Y.W.; Funding acquisition, H.W., Y.Y. and J.G. All authors have read and agreed to the published version of the manuscript.

Funding

This research was funded by the Weather Modification Ability Construction Project in central China of China Meteorological Administration (ZQC-T22253), the Natural Science Foundation of Jiangsu Province (BK20231300) and Meteorological soft science research project of Jiangsu Meteorological Bureau (No. 202407).

Institutional Review Board Statement

Not applicable.

Informed Consent Statement

Not applicable.

Data Availability Statement

The data presented in this study are available on request from the corresponding author.

Conflicts of Interest

The authors declare no conflict of interest.

References

  1. Lovett, G.M.; Tear, T.H.; Evers, D.C.; Findlay, S.E.G.; Cosby, B.J.; Dunscomb, J.K.; Driscoll, C.T.; Weathers, K.C. Effects of Air Pollution on Ecosystems and Biological Diversity in the Eastern United States. Ann. N.Y. Acad. Sci. 2009, 1162, 99–135. [Google Scholar] [CrossRef]
  2. Amoatey, P.; Baawain, M.S. Effects of pollution on freshwater aquatic organisms. Water Environ. Res. 2019, 91, 1272–1287. [Google Scholar] [CrossRef]
  3. Geng, G.; Zheng, Y.; Zhang, Q.; Xue, T.; Zhao, H.; Tong, D.; Zheng, B.; Li, M.; Liu, F.; Hong, C.; et al. Drivers of PM2.5 air pollution deaths in China 2002–2017. Nat. Geosci. 2021, 14, 645–650. [Google Scholar] [CrossRef]
  4. Ye, T.; Guo, S.; Xie, Y.; Chen, Z.; Abramson, M.J.; Heyworth, J.; Hales, S.; Woodward, A.; Bell, M.; Guo, Y.; et al. Health and related economic benefits associated with reduction in air pollution during COVID-19 outbreak in 367 cities in China. Ecotoxicol. Environ. Saf. 2021, 222, 112481. [Google Scholar] [CrossRef] [PubMed]
  5. Huang, W.; Zhou, Y.; Chen, X.; Zeng, X.; Knibbs, L.D.; Zhang, Y.; Jalaludin, B.; Dharmage, S.C.; Morawska, L.; Guo, Y.; et al. Individual and joint associations of long-term exposure to air pollutants and cardiopulmonary mortality: A 22-year cohort study in Northern China. Lancet Reg. Health West. Pac. 2023, 36, 100776. [Google Scholar] [CrossRef] [PubMed]
  6. Li, S.; Guo, B.; Jiang, Y.; Wang, X.; Chen, L.; Wang, X.; Chen, T.; Yang, L.; Silang, Y.; Hong, F.; et al. Long-term Exposure to Ambient PM2.5 and Its Components Associated with Diabetes: Evidence from a Large Population-Based Cohort from China. Diabetes Care 2023, 46, 111–119. [Google Scholar] [CrossRef]
  7. Feng, Z.; Xu, Y.; Kobayashi, K.; Dai, L.; Zhang, T.; Agathokleous, E.; Calatayud, V.; Paoletti, E.; Mukherjee, A.; Agrawal, M.; et al. Ozone pollution threatens the production of major staple crops in East Asia. Nat. Food 2022, 3, 47–56. [Google Scholar] [CrossRef]
  8. Wang, T.; Xue, L.; Feng, Z.; Dai, J.; Zhang, Y.; Tan, Y. Ground-level ozone pollution in China: A synthesis of recent findings on influencing factors and impacts. Environ. Res. Lett. 2022, 17, 063003. [Google Scholar] [CrossRef]
  9. Jiang, Y.; Huang, J.; Li, G.; Wang, W.; Wang, K.; Wang, J.; Wei, C.; Li, Y.; Deng, F.; Baccarelli, A.A.; et al. Ozone pollution and hospital admissions for cardiovascular events. Eur. Heart J. 2023, 44, 1622–1632. [Google Scholar] [CrossRef]
  10. Wang, W.; Li, X.; Cheng, Y.; Parrish, D.; Ni, R.; Tan, Z.; Liu, Y.; Lu, S.; Wu, Y.; Chen, S.; et al. Ozone pollution mitigation strategy informed by long-term trends of atmospheric oxidation capacity. Nat. Geosci. 2024, 17, 20–25. [Google Scholar] [CrossRef]
  11. Dominski, F.; JBranco, J.; Buonanno, G.; Stabile, L.; Silva, M.; Andrade, A. Effects of air pollution on health: A mapping review of systematic reviews and meta-analyses. Environ. Res. 2021, 201, 111487. [Google Scholar] [CrossRef]
  12. Hu, M.; Guo, S.; Peng, J.; Wu, Z. Insight into characteristics and sources of PM2.5 in the Beijing–Tianjin–Hebei region, China. Natl. Sci. Rev. 2015, 2, 257–258. [Google Scholar] [CrossRef]
  13. Zhu, T. Air pollution in China: Scientific challenges and policy implications. Natl. Sci. Rev. 2017, 4, 800. [Google Scholar] [CrossRef]
  14. Anand, J.S.; Monks, P.S. Estimating daily surface NO2 concentrations from satellite data—A case study over Hong Kong using land use regression models. Atmos. Chem. Phys. 2016, 17, 8211–8230. [Google Scholar] [CrossRef]
  15. Bottalico, F.; Travaglini, D.; Chirici, G.; Garfì, V.; Giannetti, F.; De Marco, A.; Fares, S.; Marchetti, M.; Nocentini, S.; Paoletti, E.; et al. A spatially-explicit method to assess the dry deposition of air pollution by urban forests in the city of Florence, Italy. Urban For. Urban Green. 2017, 27, 221–234. [Google Scholar] [CrossRef]
  16. Alimissis, A.; Philippopoulos, K.; Tzanis, C.G.; Deligiorgi, D. Spatial estimation of urban air pollution with the use of artificial neural network models. Atmos. Environ. 2018, 191, 205–213. [Google Scholar] [CrossRef]
  17. Ning, G.; Wang, S.; Ma, M.; Ni, C.; Shang, Z.; Wang, J.; Li, J. Characteristics of air pollution in different zones of Sichuan Basin, China. Sci. Total Environ. 2018, 612, 975–984. [Google Scholar] [CrossRef]
  18. Huang, Y.; Yao, T.; Fung, J.C.H.; Lu, X.; Lau, A.K.H. Application of air parcel residence time analysis for air pollution prevention and control policy in the Pearl River Delta region. Sci. Total Environ. 2019, 658, 744–752. [Google Scholar] [CrossRef]
  19. Xie, Y.; Zhao, B.; Zhang, L.; Luo, R. Spatiotemporal variations of PM2.5 and PM10 concentrations between 31 Chinese cities and their relationships with SO2, NO2, CO and O3. Particuology 2015, 20, 141–149. [Google Scholar] [CrossRef]
  20. Feng, Y.; Ning, M.; Lei, Y.; Sun, Y.; Liu, W.; Wang, J. Defending blue sky in China: Effectiveness of the “Air Pollution Prevention and Control Action Plan” on air quality improvements from 2013 to 2017. J. Environ. Manag. 2019, 252, 109603. [Google Scholar] [CrossRef] [PubMed]
  21. Ouyang, J.; Song, L.; Ma, L.; Luo, M.; Dai, X.; Zhang, J.; Xu, D. Quantification of secondary particle loading during a heavy air pollution event in Beijing: A simplified method based on coal emission indicators. Atmos. Environ. 2019, 215, 116896. [Google Scholar] [CrossRef]
  22. Zhao, H.; Wu, Z.; Liu, J.; Wu, G. Two air pollution events in the coastal city of Tianjin, north China plain. Atmos. Pollut. Res. 2019, 10, 1780–1794. [Google Scholar] [CrossRef]
  23. Dai, H.; Zhu, J.; Liao, H.; Li, J.; Liang, M.; Yang, Y.; Yue, X. Co-occurrence of ozone and PM2.5 pollution in the Yangtze River Delta over 2013–2019: Spatiotemporal distribution and meteorological conditions. Atmos. Res. 2021, 249, 105363. [Google Scholar] [CrossRef]
  24. Fan, Q.; Lan, J.; Liu, Y.; Wang, X.; Chan, P.; Hong, Y.; Feng, Y.; Liu, Y.; Zeng, Y.; Liang, G. Process analysis of regional aerosol pollution during spring in the Pearl River Delta region, China. Atmos. Environ. 2015, 122, 829–838. [Google Scholar] [CrossRef]
  25. Hu, M.; Wang, Y.; Wang, S.; Jiao, M.; Huang, G.; Xia, B. Spatial-temporal heterogeneity of air pollution and its relationship with meteorological factors in the Pearl River Delta, China. Atmos. Environ. 2021, 254, 118415. [Google Scholar] [CrossRef]
  26. Zhao, S.; Yu, Y.; Yin, D.; Qin, D.; He, J.; Dong, L. Spatial patterns and temporal variations of six criteria air pollutants during 2015 to 2017 in the city clusters of Sichuan Basin, China. Sci. Total Environ. 2018, 624, 540–557. [Google Scholar] [CrossRef]
  27. Hu, Y.; Wang, S. Formation mechanism of a severe air pollution event: A case study in the Sichuan Basin, Southwest China. Atmos. Environ. 2021, 246, 118135. [Google Scholar] [CrossRef]
  28. Chen, B.; Song, Y.; Kwan, M.P.; Huang, B.; Xu, B. How do people in different places experience different levels of air pollution? Using worldwide Chinese as a lens. Environ. Pollut. 2018, 238, 874–883. [Google Scholar] [CrossRef]
  29. Kalisa, E.; Fadlallah, S.; Amani, M.; Nahayo, L.; Habiyaremye, G. Temperature and air pollution relationship during heatwaves in Birmingham, UK. Sustain. Cities Soc. 2018, 43, 111–120. [Google Scholar] [CrossRef]
  30. Chen, L.; Zhu, J.; Liao, H.; Yang, Y.; Yue, X. Meteorological influences on PM2.5 and O3 trends and associated health burden since China’s clean air actions. Sci. Total Environ. 2020, 744, 140837. [Google Scholar] [CrossRef] [PubMed]
  31. Kamińska, J.A. The use of random forests in modelling short-term air pollution effects based on traffic and meteorological conditions: A case study in Wrocław. J. Environ. Manag. 2018, 217, 164–174. [Google Scholar] [CrossRef]
  32. Li, R.; Wang, Z.; Cui, L.; Fu, H.; Zhang, L.; Kong, L.; Chen, W.; Chen, J. Air pollution characteristics in China during 2015–2016: Spatiotemporal variations and key meteorological factors. Sci. Total Environ. 2019, 648, 902–915. [Google Scholar] [CrossRef]
  33. He, J.; Gong, S.; Yu, Y.; Yu, L.; Wu, L.; Mao, H.; Li, R. Air pollution characteristics and their relation to meteorological conditions during 2014–2015 in major Chinese cities. Environ. Pollut. 2017, 223, 484–496. [Google Scholar] [CrossRef]
  34. Zhang, Y. Dynamic effect analysis of meteorological conditions on air pollution: A case study from Beijing. Sci. Total Environ. 2019, 684, 178–185. [Google Scholar] [CrossRef] [PubMed]
  35. Zhu, Y.; Zhan, Y.; Wang, B.; Li, Z.; Qin, Y.; Zhang, K. Spatiotemporally mapping of the relationship between NO2 pollution and urbanization for a megacity in Southwest China during 2005–2016. Chemosphere 2019, 220, 155–162. [Google Scholar] [CrossRef] [PubMed]
  36. QX/T 152-2012; Meteorological Industry Standard of the People’s Republic of China: Division of Climate and Seasons. Meteorological Press: Beijing, China, 2012.
  37. HJ 633-2012; Technical Regulation on Ambient Air Quality Index (on trial). The Ministry of Environmental Protection of People’s Republic of China: Beijing, China, 2012.
  38. Wang, H.; Lyu, X.; Guo, H.; Wang, Y.; Zou, S.; Ling, Z.; Wang, X.; Jiang, F.; Zeren, Y.; Pan, W.; et al. Ozone pollution around a coastal region of South China Sea: Interaction between marine and continental air. Atmos. Chem. Phys. 2018, 18, 4277–4295. [Google Scholar] [CrossRef]
  39. Caicedo, V.; Delgado, R.; Luke, W.T.; Ren, X.; Kelley, P.; Stratton, P.R.; Dickerson, R.R.; Berkoff, T.A.; Gronoff, G. Observations of bay-breeze and ozone events over a marine site during the OWLETS-2 campaign. Atmos. Environ. 2021, 263, 118669. [Google Scholar] [CrossRef]
  40. Xu, B.; Wang, T.; Ma, D.; Song, R.; Zhang, M.; Gao, L.; Li, S.; Zhuang, B.; Li, M.; Xie, M. Impacts of regional emission reduction and global climate change on air quality and temperature to attain carbon neutrality in China. Atmos. Res. 2022, 279, 106384. [Google Scholar] [CrossRef]
  41. Huang, X.; Wang, T.; Jiang, F.; Liao, J.; Cai, Y.; Yin, C.; Zhu, J.; Han, Y. Studies on a severe dust storm in East Asia and its impact on the air quality of Nanjing, China. Aerosol Air Qual. Res. 2013, 13, 179–193. [Google Scholar] [CrossRef]
  42. Liu, Z.; Cui, Y.; He, Q.; Guo, L.; Gao, X.; Feng, Y.; Wang, Y.; Wang, X. Seasonal Variations of Carbonyls and Their Contributions to the Ozone Formation in Urban Atmosphere of Taiyuan, China. Atmosphere 2021, 12, 510. [Google Scholar] [CrossRef]
  43. Chen, B.; Song, Z.; Huang, J.; Zhang, P.; Hu, X.; Zhang, X.; Guan, X.; Ge, J.; Zhou, X. Estimation of Atmospheric PM 10 Concentration in China Using an Interpretable Deep Learning Model and Top-of-the-Atmosphere Reflectance Data from China’s New Generation Geostationary Meteorological Satellite, FY-4A. JGR Atmos. 2022, 127, e2021JD036393. [Google Scholar] [CrossRef]
  44. Chen, Y.; Liu, H.; Alatalo, J.M.; Jiang, B. Air quality characteristics during 2016–2020 in Wuhan, China. Sci. Rep. 2023, 13, 8477. [Google Scholar] [CrossRef] [PubMed]
  45. Anglada, J.M.; Martins-Costa, M.; Ruiz-López, M.F.; Francisco, J.S. Spectroscopic signatures of ozone at the air–water interface and photochemistry implications. Proc. Natl. Acad. Sci. USA 2014, 111, 11618–11623. [Google Scholar] [CrossRef] [PubMed]
  46. GB/T 28592-2012; Grade of Precipitation: General Administration of Quality Supervision. Inspection and Quarantine of the People’s Republic of China: Beijing, China, 2012.
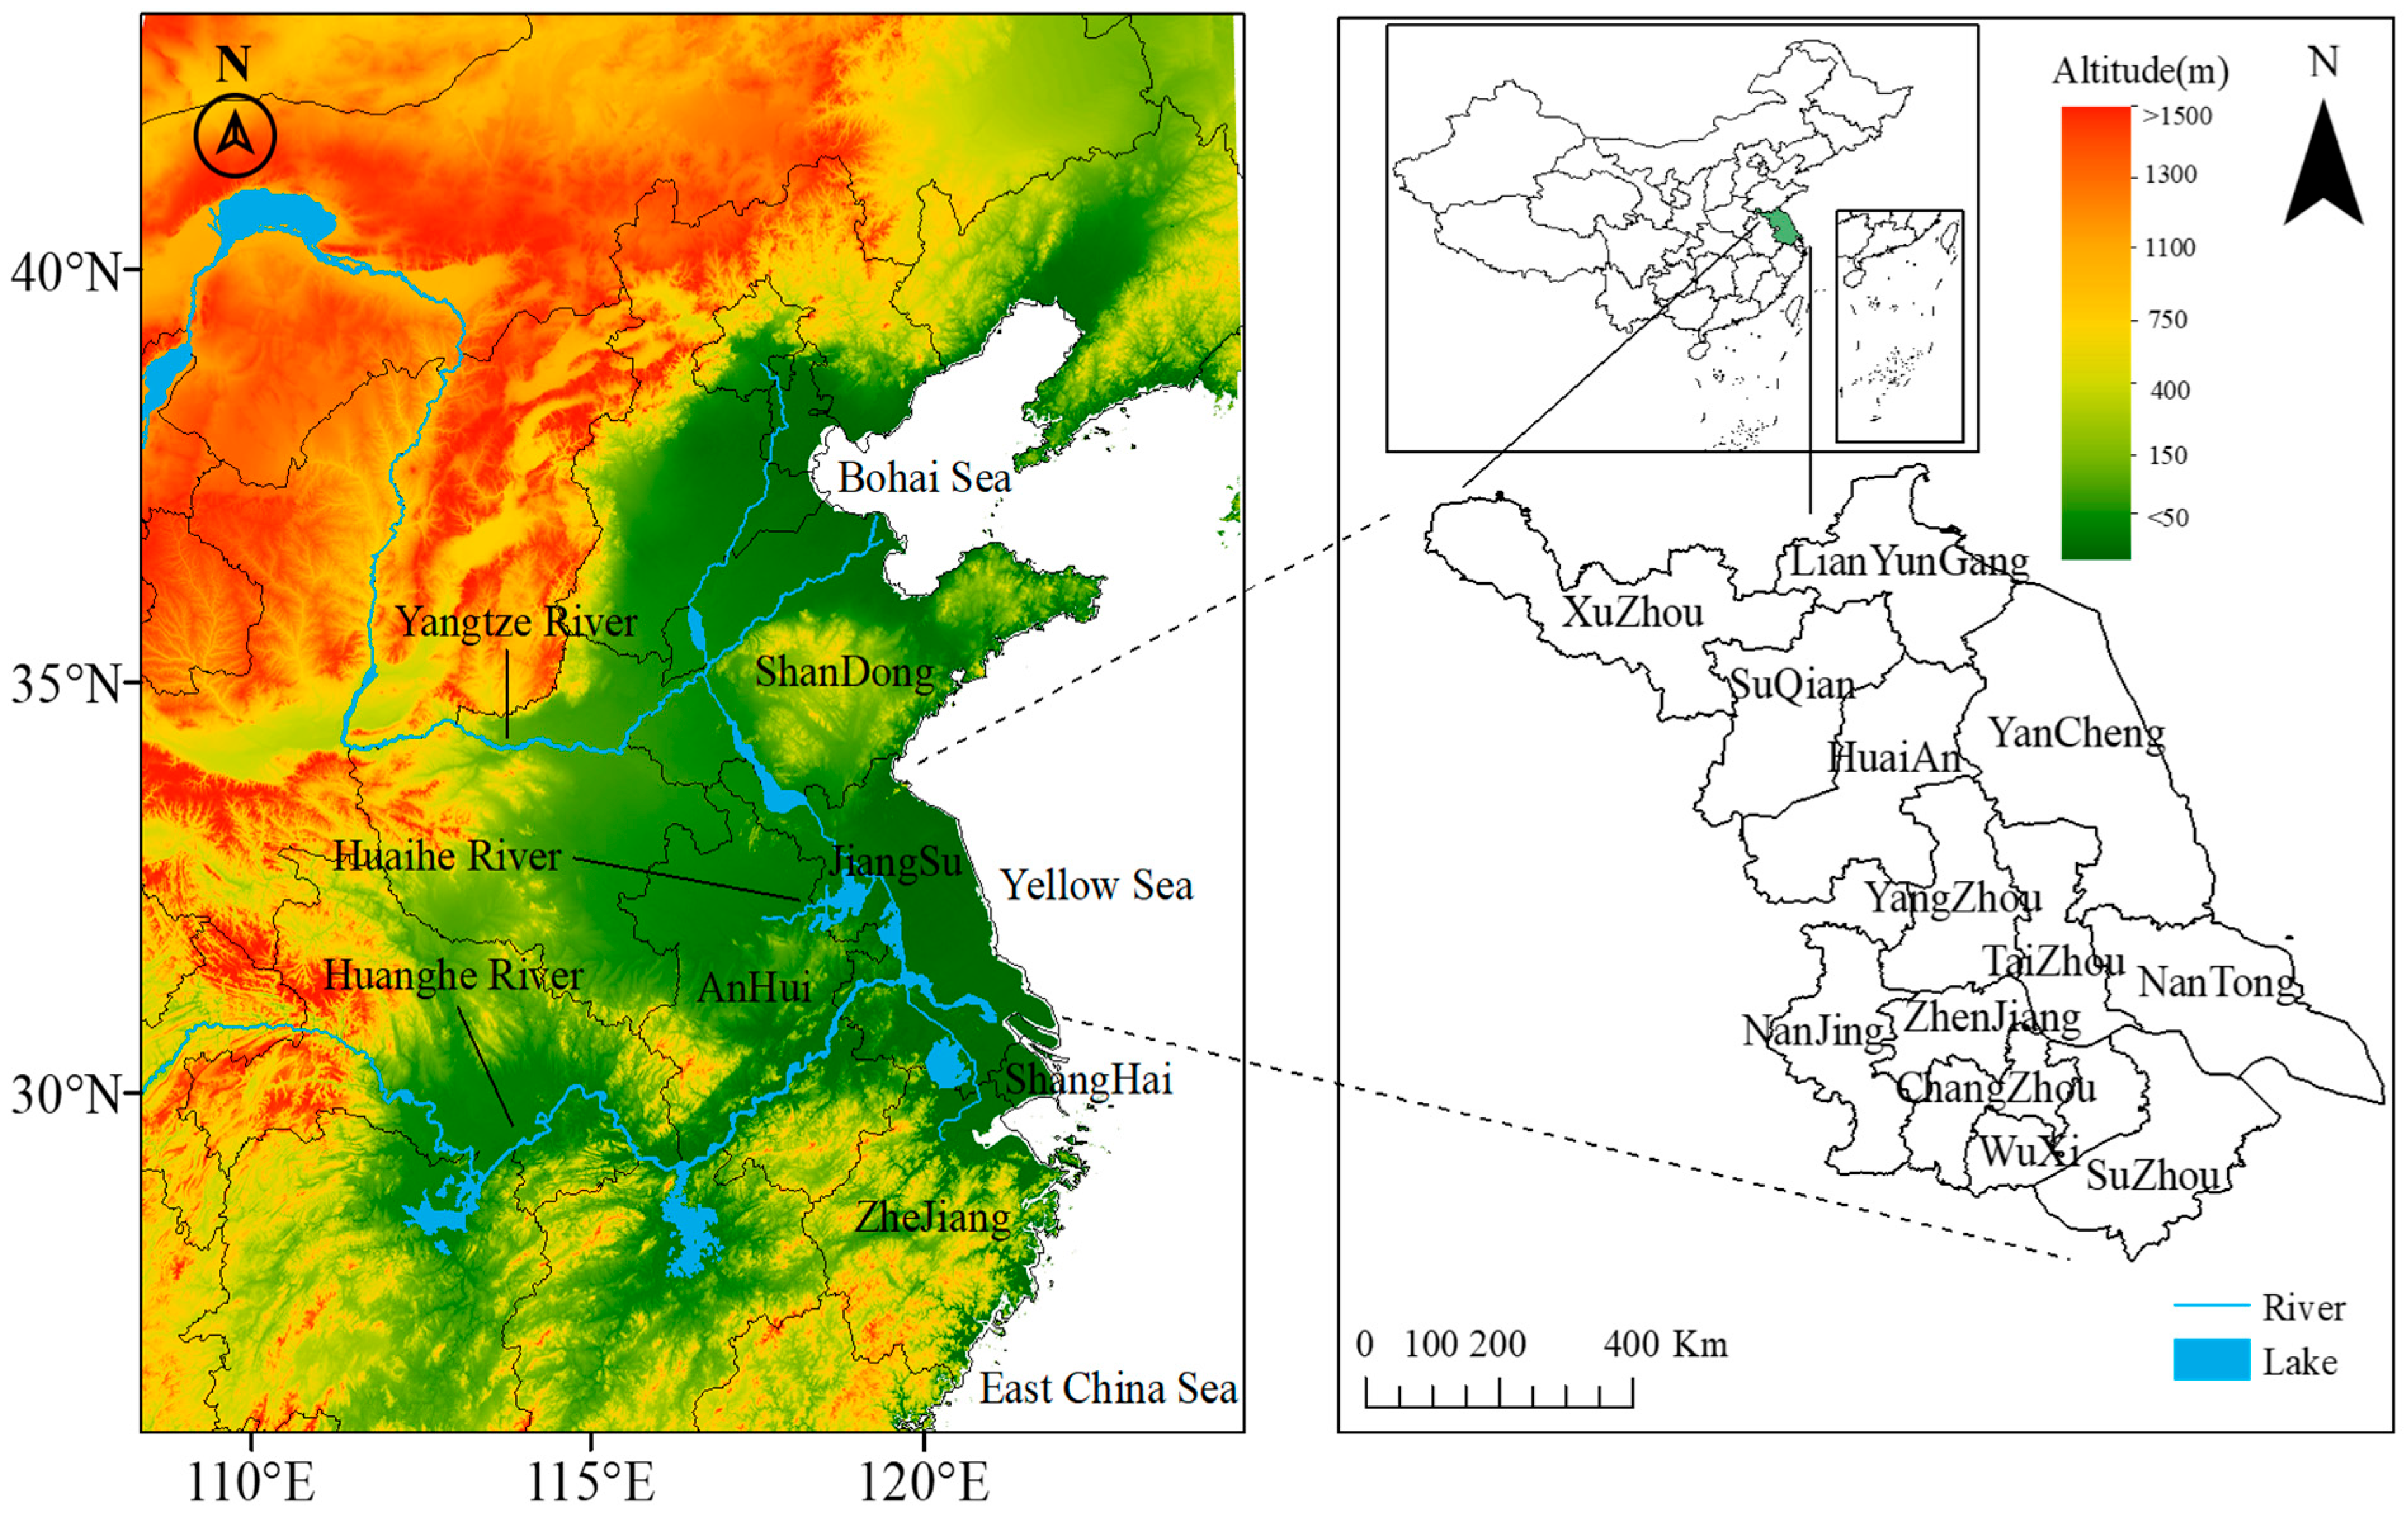
Figure 1. Geographic location of Jiangsu Province and the surrounding terrain height distribution.
Atmosphere 16 01079 g001
Figure 2. The average mass concentration distribution of pollutants in Jiangsu from 2014 to 2022. (a) PM2.5; (b) PM10; (c) SO2; (d) NO2; (e) O3; (f) CO. (The black dots in Figure 2 represent the distribution of observation stations.).
Atmosphere 16 01079 g002
Figure 3. Annual distribution of PM2.5 mean mass concentration in Jiangsu from 2014 to 2022. (a) 2014; (b) 2015; (c) 2016; (d) 2017; (e) 2018; (f) 2019; (g) 2020; (h) 2021; (i) 2022.
Atmosphere 16 01079 g003
Figure 4. Seasonal distribution of PM2.5 mean mass concentration in Jiangsu from 2014 to 2022. (a) Spring; (b) Summer; (c) Autumn; (d) Winter.
Atmosphere 16 01079 g004
Figure 5. Distribution of pollution days in Jiangsu from 2014 to 2022. (a) Total pollution days; (b) Priority pollutant: PM2.5; (c) Priority pollutant: PM10; (d) Priority pollutant: O3.
Atmosphere 16 01079 g005
Figure 6. Annual distribution of PM2.5 pollution days in Jiangsu from 2014 to 2022. (a) 2014; (b) 2015; (c) 2016; (d) 2017; (e) 2018; (f) 2019; (g) 2020; (h) 2021; (i) 2022.
Atmosphere 16 01079 g006
Figure 7. Seasonal distribution of PM2.5 pollution days in Jiangsu from 2014 to 2022. (a) Spring; (b) Summer; (c) Autumn; (d) Winter.
Atmosphere 16 01079 g007
Figure 8. Correlation between pollutants and meteorological elements at monthly, daily and hourly scales (* denoting significant Correlation at p < 0.05). (a) Month; (b) Day; (c) Hour.
Atmosphere 16 01079 g008
Figure 9. Seasonal wind direction and wind speed frequency in Jiangsu from 2014 to 2022. (a) Spring; (b) Summer; (c) Autumn; (d) Winter.
Atmosphere 16 01079 g009
Table 1. Classification of precipitation grades and the pollutants’ mean concentrations under different precipitation grades.
Precipitation GradePrecipitation
(mm)
PM2.5
(μg·m−3)
PM10
(μg·m−3)
SO2
(μg·m−3)
NO2
(μg·m−3)
O3
(μg·m−3)
CO
(μg·m−3)
Scattered rain<0.149.385.215.535.672.7832.2
Light rain0.1–9.939.361.411.129.560.1778.2
Moderate rain10.0–24.929.2459.62659.8743.6
Heavy rain25.0–49.923.4378.923.462710.2
Torrential rain50.0–99.921.333.4923.159.8699.2
Severe torrential rain100.0–249.916.626.38.922.353.9674.1
Disclaimer/Publisher’s Note: The statements, opinions and data contained in all publications are solely those of the individual author(s) and contributor(s) and not of MDPI and/or the editor(s). MDPI and/or the editor(s) disclaim responsibility for any injury to people or property resulting from any ideas, methods, instructions or products referred to in the content.