Article

Dynamic Characteristics of Key Meteorological Elements and Their Impacts on Major Crop Yields in Albic Soil Region of Sanjiang Plain in China

1
Heilongjiang Academy of Agricultural Sciences, Harbin 150086, China
2
Heilongjiang Provincial Key Laboratory of Soil Environment and Plant Nutrition, Harbin 150086, China
3
Department of Hydraulic Engineering, Hebei University of Water Resources and Electric Engineering, Cangzhou 061001, China
4
Hebei Technology Innovation Center for Coastal Wetland Water Resources Allocation and Ecological Protection, Cangzhou 061001, China
5
Beidahuang Group Heilongjiang 852 Farm Co., Ltd., Shuangyashan 155100, China
*
Author to whom correspondence should be addressed.
Atmosphere 2025, 16(8), 984; https://doi.org/10.3390/atmos16080984
Submission received: 10 June 2025 / Revised: 23 July 2025 / Accepted: 15 August 2025 / Published: 19 August 2025
(This article belongs to the Section Meteorology)

Abstract

The vulnerability of regional agricultural systems continues to intensify under the influence of global climate change. Understanding the spatiotemporal variation in meteorological elements and their agricultural response mechanisms has become a critical scientific challenge for ensuring food security. This study focuses on the 852 Farm in the typical area of the albic soil region on the Sanjiang Plain in China. This research integrates multi-source meteorological observations and crop yield data from 2001 to 2024. Using methods such as wavelet analysis, grey relational analysis, and cross-wavelet analysis, this study systematically investigates the dynamic changes and cyclical evolution patterns of key meteorological factors and their impact on the yields of different staple crops. The results indicate that, in terms of trend evolution, air temperature, relative humidity, and surface temperature show no significant upward trend (Z > 0; p > 0.05), while precipitation significantly increases (Z > 0; p < 0.05). Evaporation and sunlight show a nonsignificant downward trend (Z < 0; p > 0.05). The yields of rice, soybean, and corn generally exhibit fluctuating upward trends (Z > 0; p > 0.05). In terms of periodic coupling characteristics, meteorological factors exhibit multi-time-scale oscillations at 22a, 12a, and 8a. The yields of the three staple crops form significant time–frequency couplings with meteorological factors in the 22a and 8a periods. Regarding the correlation, air temperature demonstrates the highest grey correlation degree (γ ≥ 0.8) and strong coherence with crop yields, followed by precipitation and sunlight. These findings provide a theoretical and quantitative basis for understanding the multi-scale interactive mechanisms of climate adaptation in agricultural systems of the albic soil region, as well as for managing and optimizing climate-resilient farming practices.

1. Introduction

Frequent extreme weather events and fluctuations in resource and environmental conditions caused by global climate change are profoundly reshaping the productivity patterns and stability of regional agricultural systems [1,2,3,4]. According to the Sixth Assessment Report of the Intergovernmental Panel on Climate Change (IPCC), the global average temperature has increased by approximately 1.1 °C since the pre-industrial era, with the warming rate accelerating significantly [5,6]. Against this backdrop, the sensitivity of agricultural production systems to climatic factors has continued to increase. In particular, the spatiotemporal heterogeneity of heat and water resources exerts a profound influence on crop growth cycles and yield formation [7,8,9]. As a core part of the global black soil belt, Northeast China, and, specifically, the Sanjiang Plain, serves as a key national commercial grain base, playing a strategic role in safeguarding food security [10,11,12]. Notably, albic soil accounts for approximately 25% of the region’s arable land. The distinctive albic horizon, characterized by high bulk density and low permeability, results in a shallow plow layer and weak regulation of hydrothermal conditions. Together with the surrounding black soil, it forms a binary “black and white” soil matrix that amplifies the adverse effects of climate change on crop production [13,14,15,16,17]. Therefore, elucidating the dynamic evolution of key meteorological elements and their interactions with crop productivity in this region is of great scientific and practical significance for optimizing climate-resilient cropping systems and ensuring food security.
In recent years, the impact of climate change on agricultural systems has become a key focus in international academic research. Numerous scholars have conducted extensive studies on the response of crop yields to climate variability. Feng et al. analyzed climate and yield data across the world’s top ten corn-producing countries using a multivariate distribution method and concluded that compound dry and hot conditions significantly increase the risk of corn yield reduction [18]. Li et al. employed the Agricultural Production Systems Simulator model to simulate corn yield in nine types of individual extreme weather events in Northeast China, assessing both the combined and separate effects of drought and high temperature [19]. Baig et al. applied an autoregressive distributed lag (ARDL) model to identify key meteorological factors affecting grain yield in India [20]. Zhan et al. used spatial principal component analysis (SPCA) and predictive discriminant analysis (PDA) to investigate the differentiated responses of major food crops in China, including rice, wheat, corn, and cotton, to droughts across multiple temporal scales. They found that the sensitivity of crop yields to drought exhibited significant spatiotemporal heterogeneity and was strongly dependent on the time scale used for drought assessment [21]. Li et al. applied a coupling coordination degree model and geographically weighted regression to perform a spatiotemporal analysis of crop cultivated land systems on the Loess Plateau of China from 2000 to 2020. Their findings revealed the influence of climate change on the coordination between crops and cultivated land and indicated that the overall coordination degree has shown an increasing trend in this region [22]. Although these studies provide a theoretical foundation for understanding the influence of meteorological factors on crop yield, most focus on the effects of individual climatic variables, such as air temperature or precipitation, or rely on short-term observational data. The feedback mechanisms among soil, climate, and crops, particularly in regions characterized by albic soil, remain insufficiently studied.
Against this background, the present study focuses on the 852 Farm, a representative albic soil region in the Sanjiang Plain of China, utilizing meteorological and crop yield data from 2001 to 2024. To address the nonlinear, multi-temporal, and multivariate nature of climate–crop interactions, this study employs a combination of wavelet periodic analysis, grey relational analysis, and cross-wavelet transform. These methods are well-suited for capturing dynamic, scale-dependent relationships between variables, especially under complex agroclimatic conditions. Previous studies have demonstrated the efficacy of wavelet analysis in identifying periodicities in agro-climatic systems, while grey relational analysis and cross-wavelet methods have been successfully used to quantify the coupling strength and phase relationships in hydrological and agricultural domains. Based on this methodological framework, the objectives of this study are as follows: (1) to identify the dynamic trends and multi-temporal scale periodic characteristics of key meteorological factors, including air temperature, precipitation, and evaporation; (2) to reveal the development processes and periodic patterns of different crop yields; and (3) to quantify the time–frequency coupling relationships between meteorological factors and various crops. The results aim to provide scientific guidance for implementing effective agricultural adaptation strategies to climate change and ensuring regional food security.

2. Research Area and Methodology

2.1. Overview of Study Area

The 852 Farm is situated in the eastern part of Heilongjiang Province, within the albic soil region of the Sanjiang Plain. Its geographical coordinates extend from 46°06′ to 46°37′ north latitude, and from 132°18′ to 132°54′ east longitude (Figure 1) [23,24]. The terrain is flat and open, with an average elevation of approximately 55 m. The farm has a large expanse of cultivated land, totaling about 84,000 hectares. It features typical characteristics of albic soil, such as a dense plow pan, poor water retention, and low nutrient availability, which amplify the sensitivity of local agricultural production to climate change. As one of the largest state-owned farms in Northeast China, the 852 farm features highly mechanized and large-scale agricultural production, playing a vital role in ensuring national grain security.
The study region experiences a semi-arid to semi-humid continental monsoon climate, characterized by long and cold winters, and warm and rainy summers. The synchrony of rainfall and thermal conditions creates a favorable climate for crop growth. The annual mean air temperature ranges between 2 and 4 °C. In January, the average temperature falls below minus 20 °C, while in July, it exceeds 20 °C. Annual precipitation varies from approximately 500 to 650 mm, with the majority occurring between June and August, accounting for roughly 60 to 70% of the annual total. These advantageous hydrothermal conditions make the region one of China’s key grain-producing areas, with rice, soybean, and corn serving as the dominant crops [25,26].

2.2. Experimental Design

This study first analyzed the dynamic trends and periodic patterns of six meteorological factors, namely, air temperature, precipitation, evaporation, sunlight, relative humidity, and surface temperature, at the 852 Farm from 2001 to 2024. These six variables were selected because they are key environmental indicators that directly or indirectly affect crop growth and yield formation. Air temperature and surface temperature represent thermal conditions essential for photosynthesis and phenological development. Precipitation and evaporation jointly determine the water balance and moisture availability for crops. Relative humidity influences transpiration and stomatal behavior, while sunlight directly impacts photosynthetic efficiency. Together, these factors reflect the multidimensional hydrothermal environment that governs crop responses to climate variability.

2.3. Measurement Items and Methods

When analyzing the dynamic trends and periodic patterns of key meteorological factors and crop yields, the linear trend method and Mann–Kendall (MK) test [27] were first applied to determine their change trends and significance. This non-parametric test is widely used to detect monotonic trends in time-series data without assuming a specific distribution. A positive Z-value indicates an upward trend, while a negative Z-value implies a downward trend. However, if the associated p-value exceeds the conventional significance level of 0.05, the result is not considered statistically significant, and the null hypothesis of no trend cannot be rejected. Then, the complex Morlet wavelet transform [28,29] was used to identify their periodic scale evolution and main cycles. This method is particularly suitable for detecting localized time–frequency structures and multi-scale periodic features in non-stationary time series, making it widely applicable in agro-climatic research. To quantify the time–frequency coupling relationships between meteorological factors and crops, Pearson correlation, grey relational analysis [30], and principal component analysis (PCA) [31] were initially employed to preliminarily identify the important meteorological factors affecting crop yield. Pearson correlation captures linear associations, grey relational analysis evaluates similarity trends across normalized sequences, and PCA reduces dimensionality to rank the relative contributions of input variables. These methods complement each other and enhance the robustness of variable screening. Finally, cross-wavelet analysis [32] was employed to study the correlation and phase relationship between meteorological elements and crop yield at different time scales and frequency domains. This technique is effective for revealing co-oscillation patterns and phase synchronization between paired time series, thus providing deeper insights into the synergistic variation mechanisms between climate variables and crop yield.

2.4. Data Processing

This study investigated the dynamic variation characteristics and time–frequency periodic coupling relationships between key meteorological factors and the yields of different crops at the 852 Farm from 2001 to 2024. Long-term daily data of meteorological factors, including air temperature, precipitation, evaporation, sunlight, relative humidity, and surface temperature, along with yield and cultivated area data for various grain crops (rice, soybean, and corn), were primarily provided by Beidahuang Group Heilongjiang 852 Farm Co., Ltd. in Shuangyashan, China. The data exhibited good completeness and strong continuity. Annual averages of meteorological factors were derived from the daily data, while the crop yield per unit area was calculated as the ratio of annual crop production to the total cultivated area each year.

3. Results and Analysis

3.1. Multi-Timescale Dynamic Variations in Meteorological Factors

3.1.1. Temporal Scale Variation Characteristics of Meteorological Factors

The variation trends of six meteorological factors, including air temperature, precipitation, evaporation, sunlight, relative humidity, and surface temperature, at the 852 Farm from 2001 to 2024 were compiled and plotted. Their development trends and significance were identified using the Mann–Kendall (MK) test. This non-parametric statistical method is widely used to detect monotonic trends in time-series data and does not require the data to conform to any specific distribution. Within this framework, a positive Z-value indicates an increasing trend, whereas a negative Z-value signifies a decreasing trend. Comprehensive analysis of Figure 2 and Table 1 shows that the Z-value for air temperature is 1.256, which is greater than 0, indicating an overall upward trend consistent with global warming. However, since p = 0.051 is greater than 0.05, the warming trend is not statistically significant. Air temperature gradually increased from 2.4 °C in 2001 to 4 °C in 2024. Precipitation showed a significant increasing trend with Z equal to 0.571 and p equal to 0.001, rising from 626.9 mm in 2001 to 801.6 mm in 2024, with considerable interannual fluctuations. Evaporation decreased from 1100.2 mm in 2001 to 1053.3 mm in 2024 with noticeable fluctuations and an overall nonsignificant decreasing trend, as indicated by Z being less than 0 and p being greater than 0.05. Sunlight hours showed a nonsignificant downward trend with a Z of less than 0 and a p greater than 0.05, declining from 2306.4 h in 2001 to 2229.5 h in 2024. Relative humidity rose from 72% in 2001 to 76% in 2024, with Z equal to 0.422 and p equal to 0.055, indicating a nonsignificant increasing trend with notable interannual variability. Surface temperature exhibited a nonsignificant increase, with Z equal to 2.307 and p equal to 0.100, rising from 3.28 °C in 2001 to 5 °C in 2024.
Although the Mann–Kendall test yielded negative Z-values for both evaporation (Z = −0.967) and sunlight duration (Z = −0.906), the corresponding p-values (0.053 and 0.060, respectively) marginally exceeded the conventional significance threshold of 0.05. These results suggest that neither variable exhibited a statistically significant decreasing trend during the study period. Furthermore, visual inspection of the time-series plots in Figure 2 confirms the presence of short-term fluctuations without a consistent downward trajectory. Accordingly, these two variables were characterized as exhibiting statistically nonsignificant and marginally declining trends, a conclusion that aligns with both the Mann–Kendall test results and the temporal patterns observed in the time-series data.

3.1.2. Evolutionary Patterns of Meteorological Factors at Periodic Scales

This section applies complex Morlet wavelet transform analysis to study the periodic evolution patterns of six meteorological factors at the 852 Farm from 2001 to 2024, shown in Figure 2. The positive and negative variations of the contour lines in Figure 2 can reflect the alternating pattern of the time series: black contour lines with positive values correspond to the increasing period of the time series; red contour lines with negative values correspond to the decreasing period of the time series. According to the main period statistics in Table 2 and the wavelet real part contour plots in Figure 2, the meteorological factors exhibit relatively consistent local changes in the time domain and multi-level periodic structure characteristics. These mainly occur at periodic scales of 18–25a, 10–15a, and 5–9a, showing features of direct nesting and mutual inclusion between longer and shorter time scales. The main periods corresponding to these three scales are 22a, 12a, and 8a, which primarily govern the periodic evolution of the meteorological factors at the farm during 2001 to 2024. Further examination of Figure 3a–f shows that the wavelet coefficient real part contour for relative humidity in 2024 is negative, indicating that relative humidity is in a declining cycle at that time. The negative contour lines remain unclosed afterward, suggesting that relative humidity is likely to continue its downward trend in the short term after 2024. Except for relative humidity, the wavelet coefficient real part contours for the other five meteorological factors in 2024 are positive and remain unclosed, indicating that air temperature, precipitation, evaporation, sunlight, and surface temperature are expected to show an upward trend in the short term after 2024.

3.2. Dynamic Development of Yield for Different Crops

3.2.1. Comparison of Crop-Planting Structures

Based on the analysis of the annual changes in the planting area proportions of different crops at the 852 Farm shown in Figure 4, it can be seen that soybean has been the dominant crop for many years. The current planting structure is maintained at a ratio of rice to soybean to corn of 1:5:4. From 2001 to 2024, the proportion of rice planting remained stable, while the proportion of soybean planting gradually decreased year by year, and the proportion of corn planting increased.

3.2.2. Temporal Dynamics of Different Crop Yields

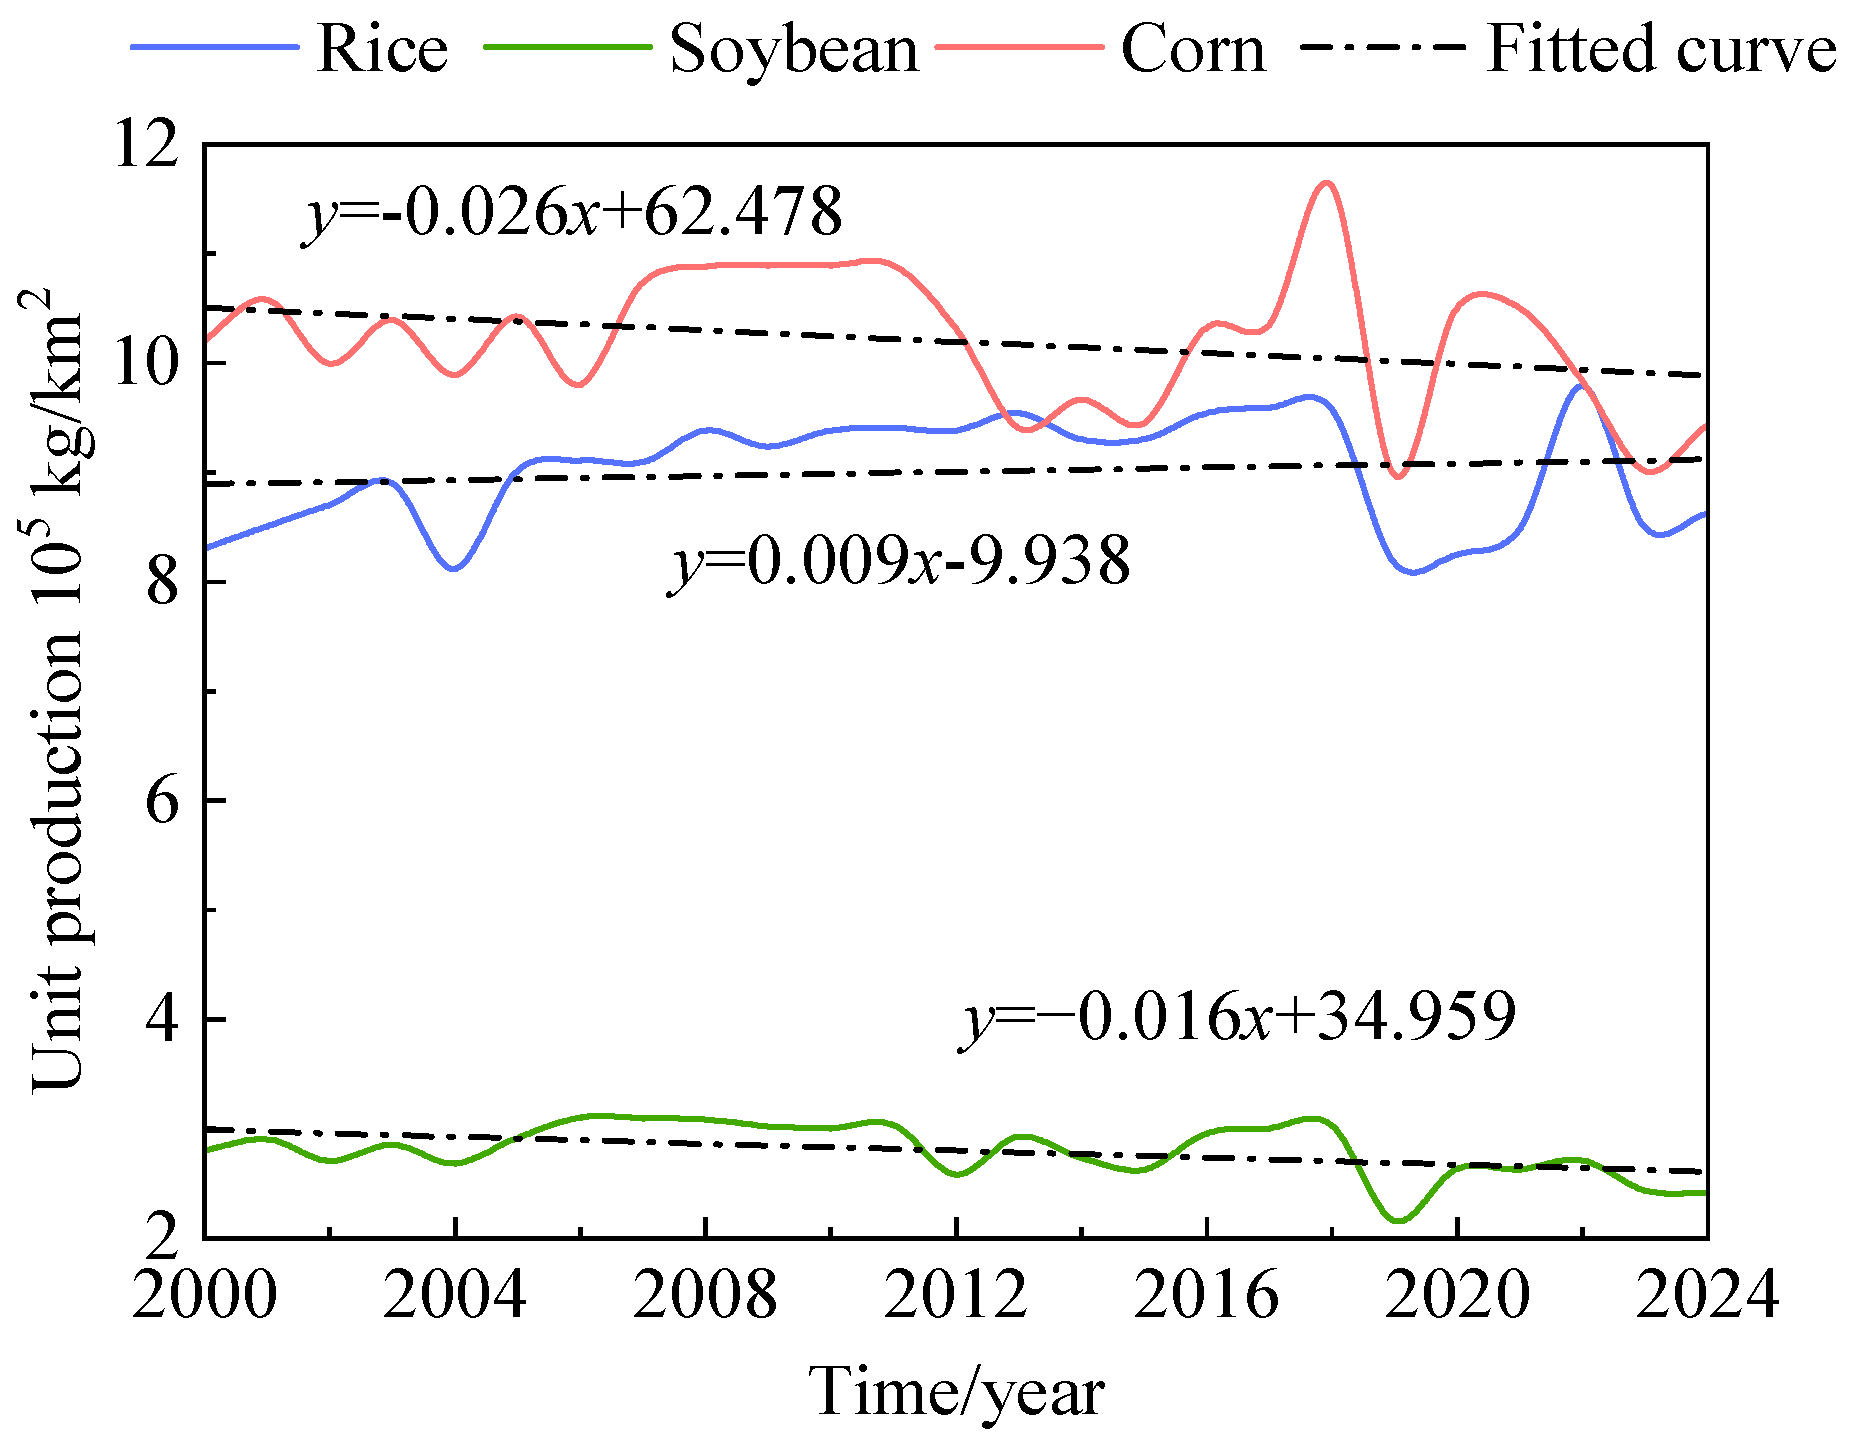
The dynamic changes in the yield per unit area of the three crops rice, soybean, and corn at the 852 Farm from 2001 to 2024 were calculated and visualized. The Mann–Kendall (MK) test was employed to assess the statistical significance of the yield trends. As shown in Figure 5 and Table 3, all three crops exhibited upward trends that were not statistically significant throughout the study period. Specifically, the Z-value for rice was 1.796, with a corresponding p-value of 0.335, which exceeded the 0.05 significance threshold. For soybean, the Z-value was 0.739, with a p-value of 0.144. In the case of corn, the Z-value reached 2.257, and the p-value was 0.277. Among the three crops, the apparent rate of increase was greatest for corn, followed by rice and then soybean. However, the yield trajectories presented in Figure 5 demonstrate pronounced interannual fluctuations and lack a coherent upward direction over time. In particular, for soybean and corn, the relatively large p-values combined with the absence of a visually sustained trend suggest that the observed increases were neither statistically significant nor temporally consistent. This interpretation ensures consistency between the statistical inference and the graphical evidence.

3.2.3. Periodic Evolution Patterns of Different Crops

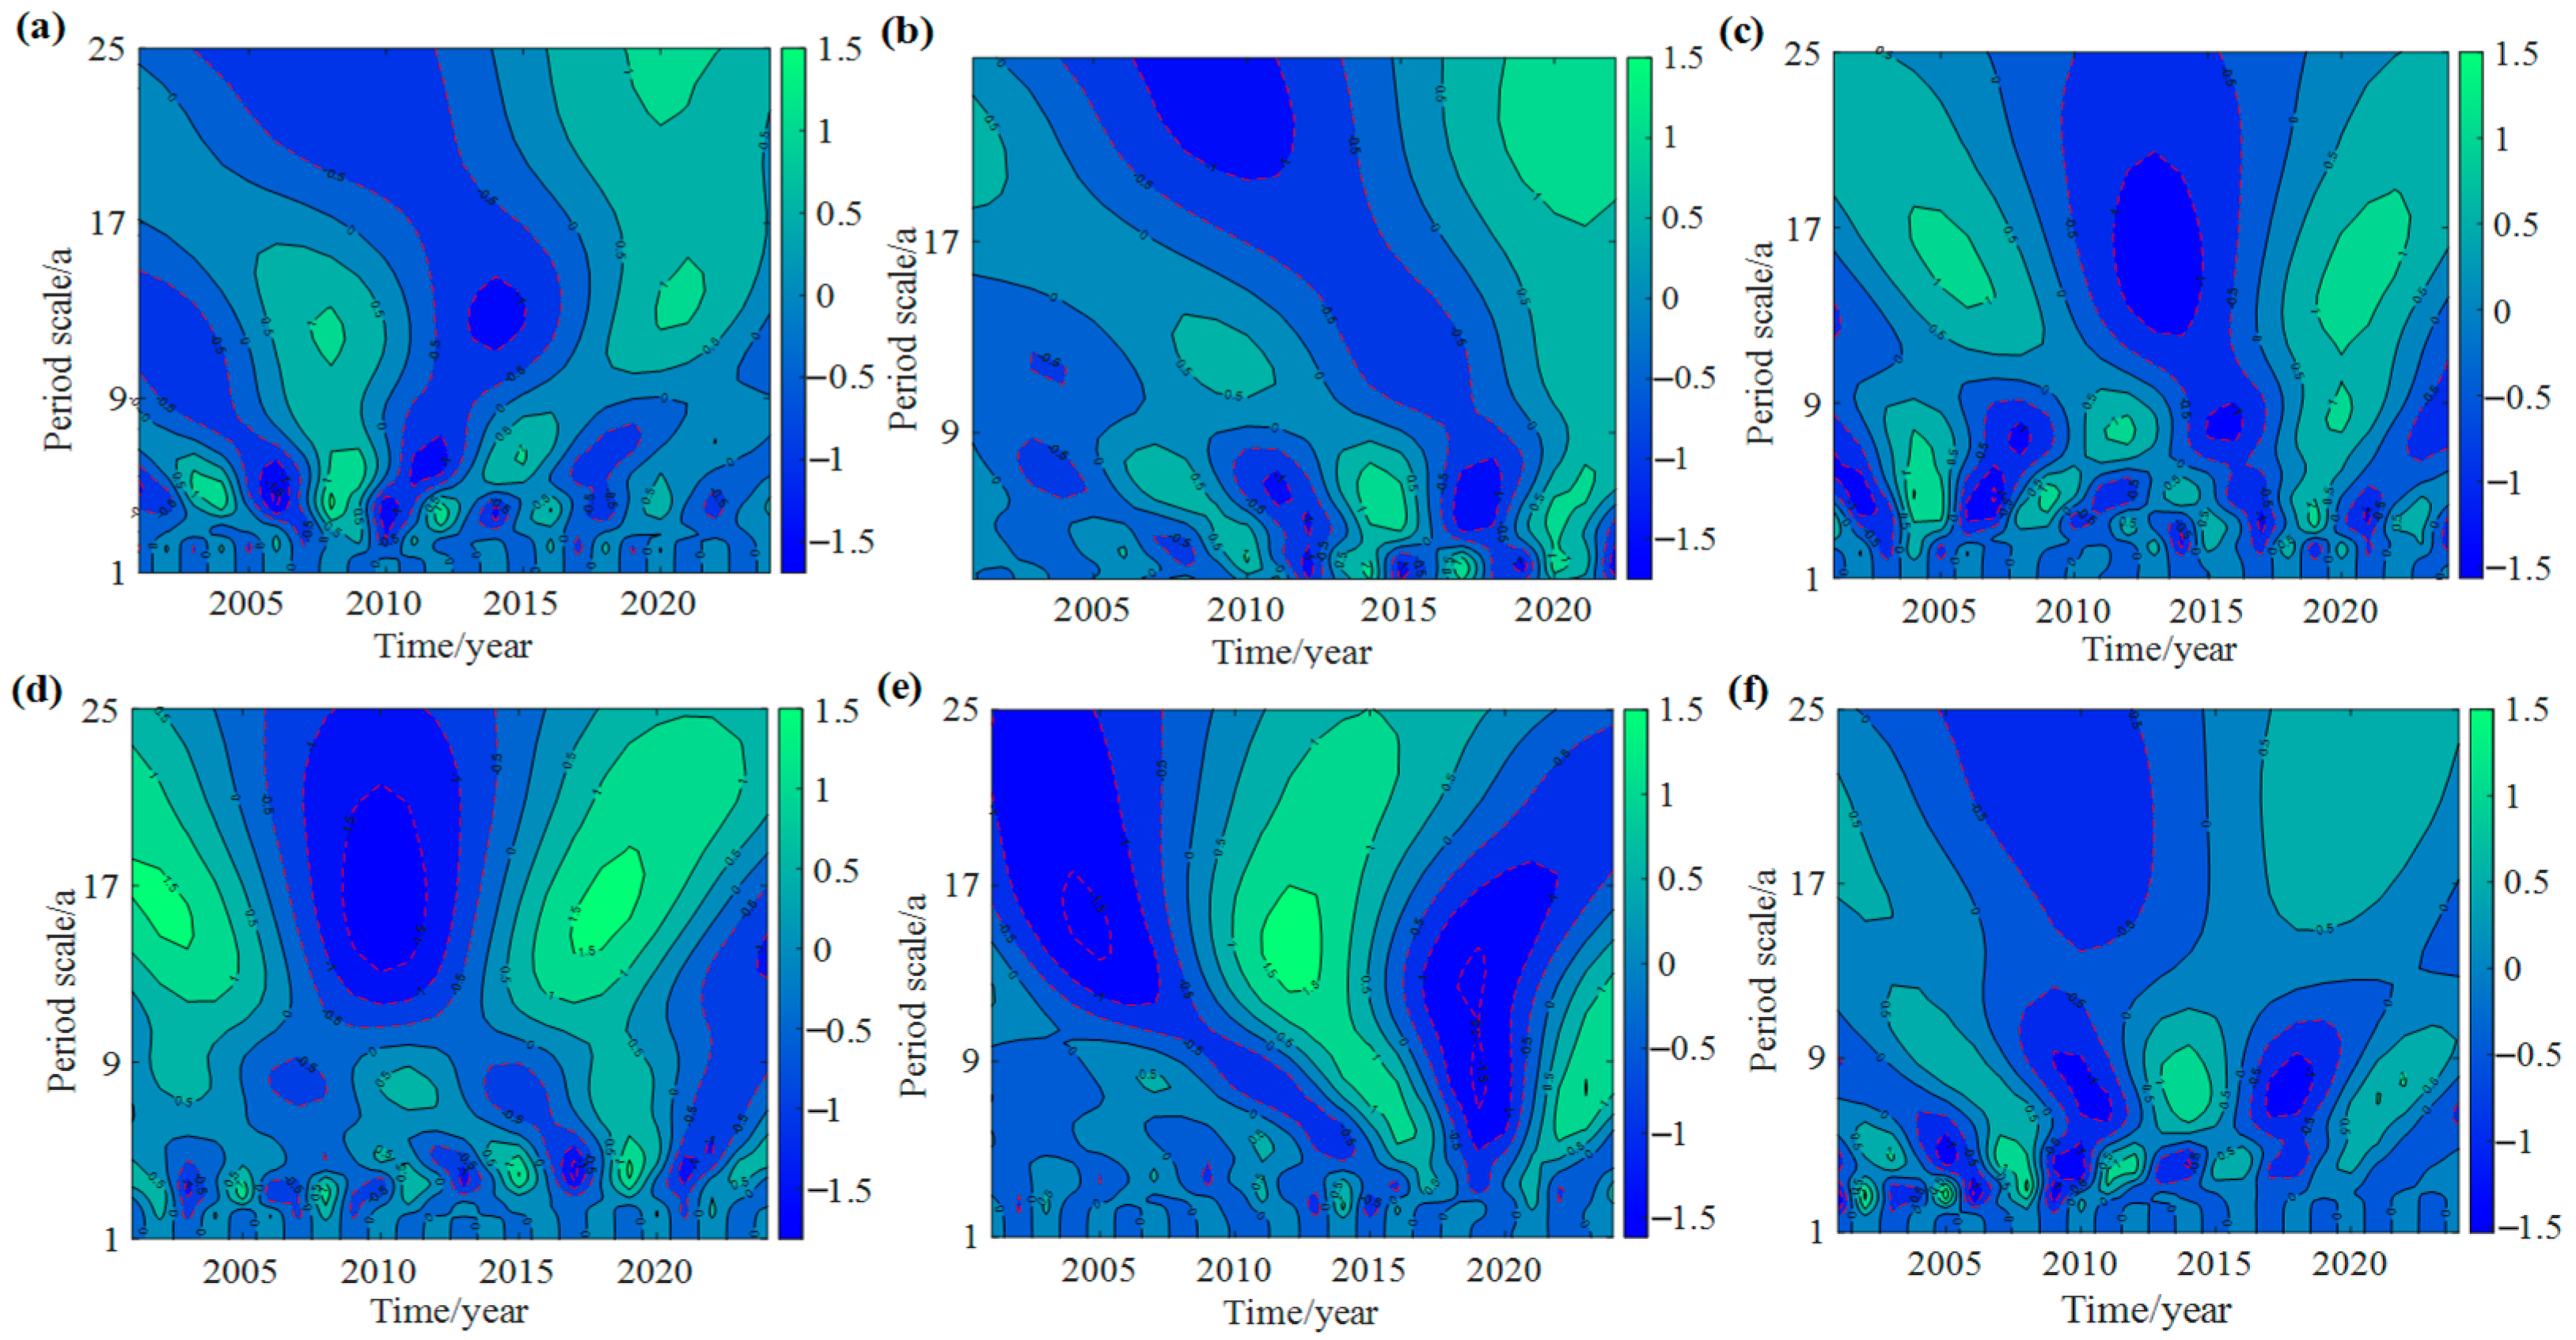
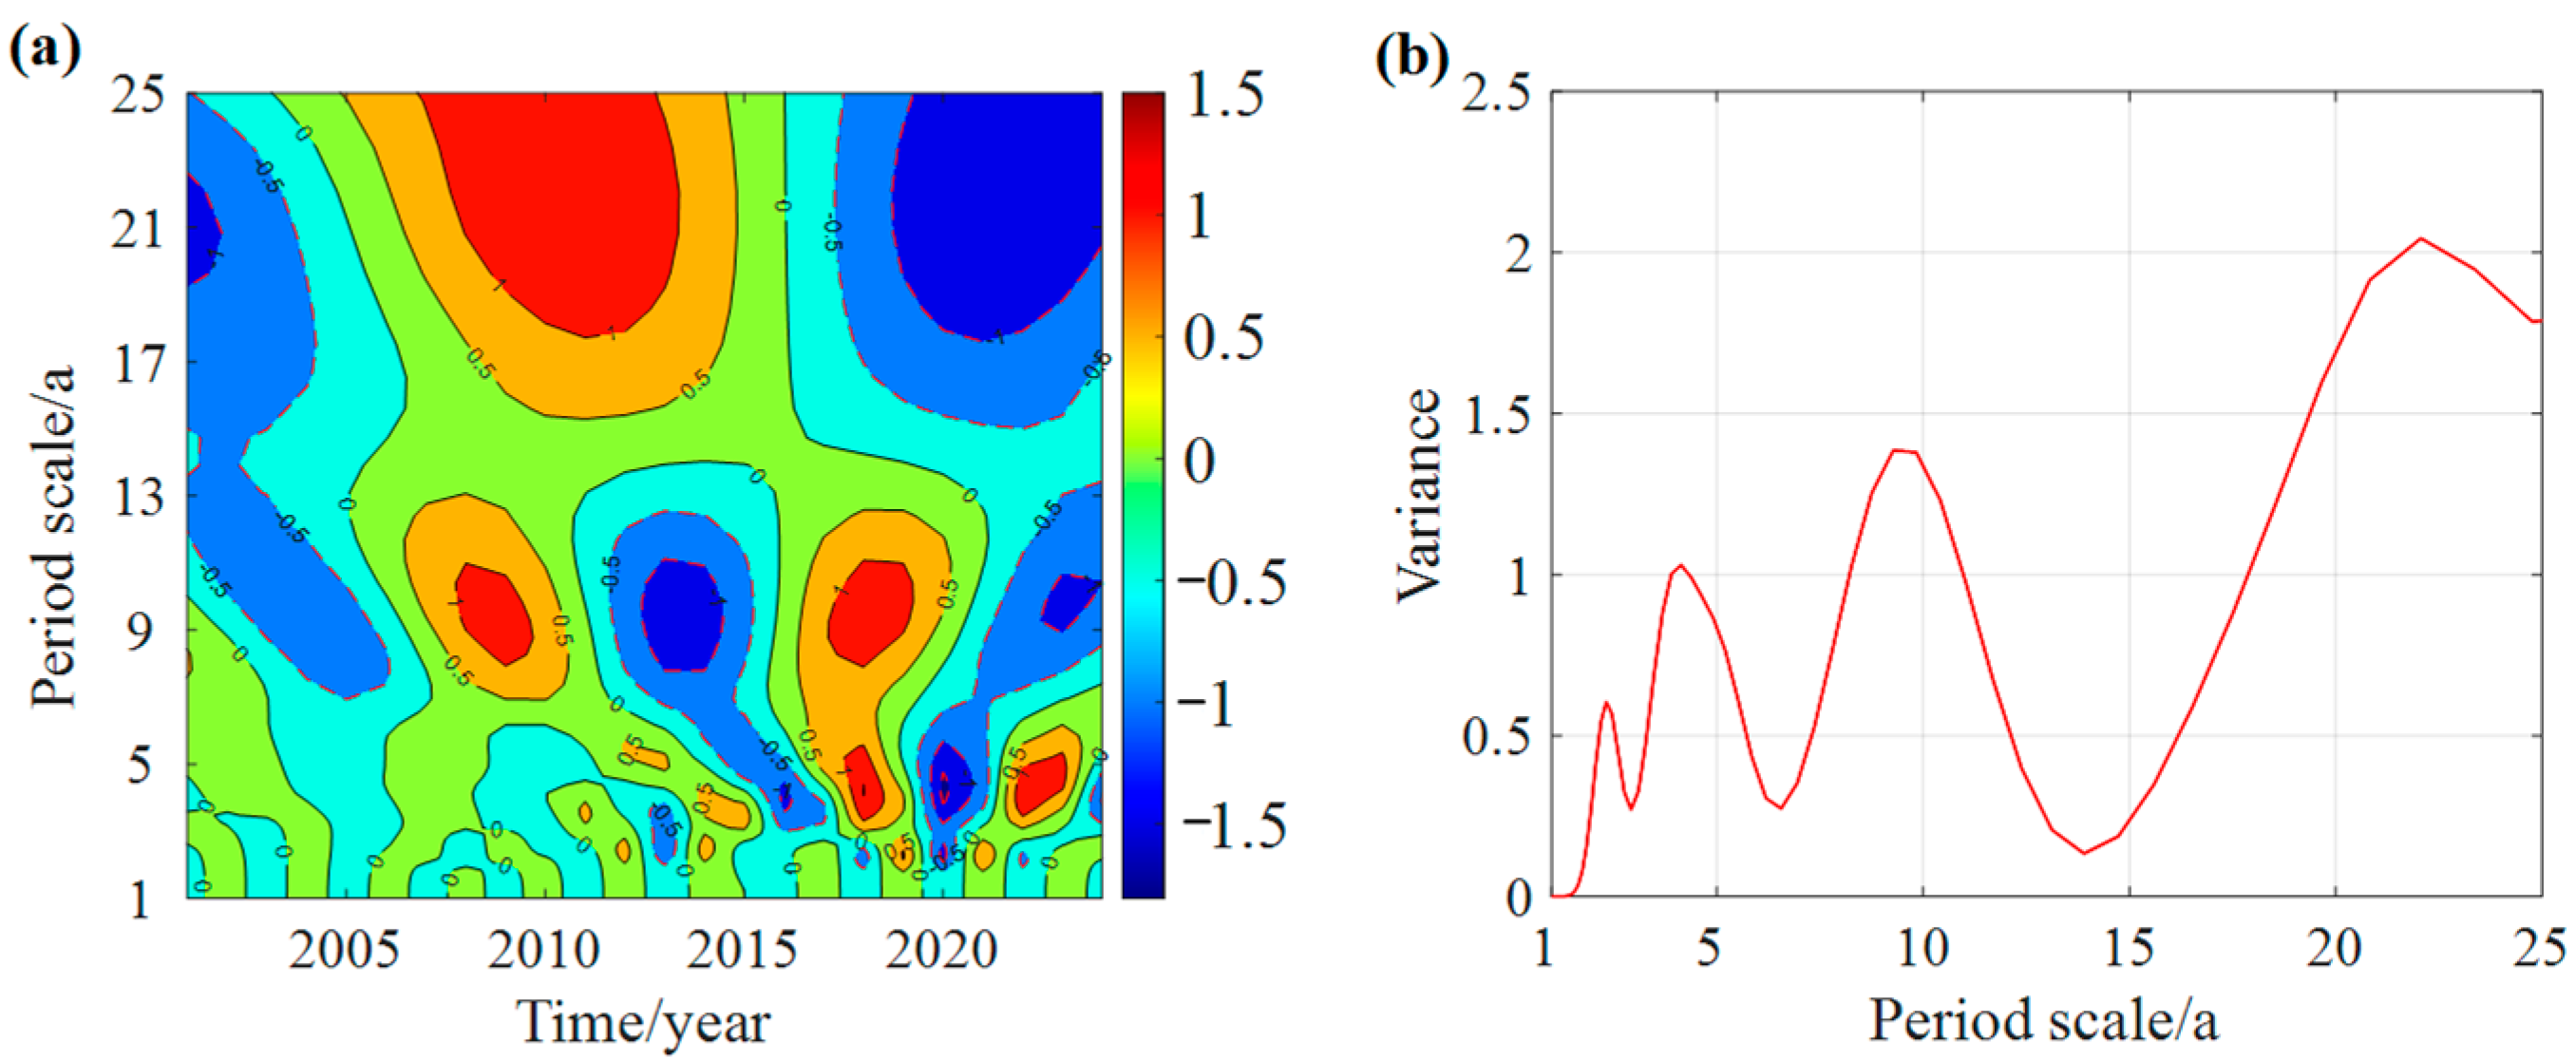
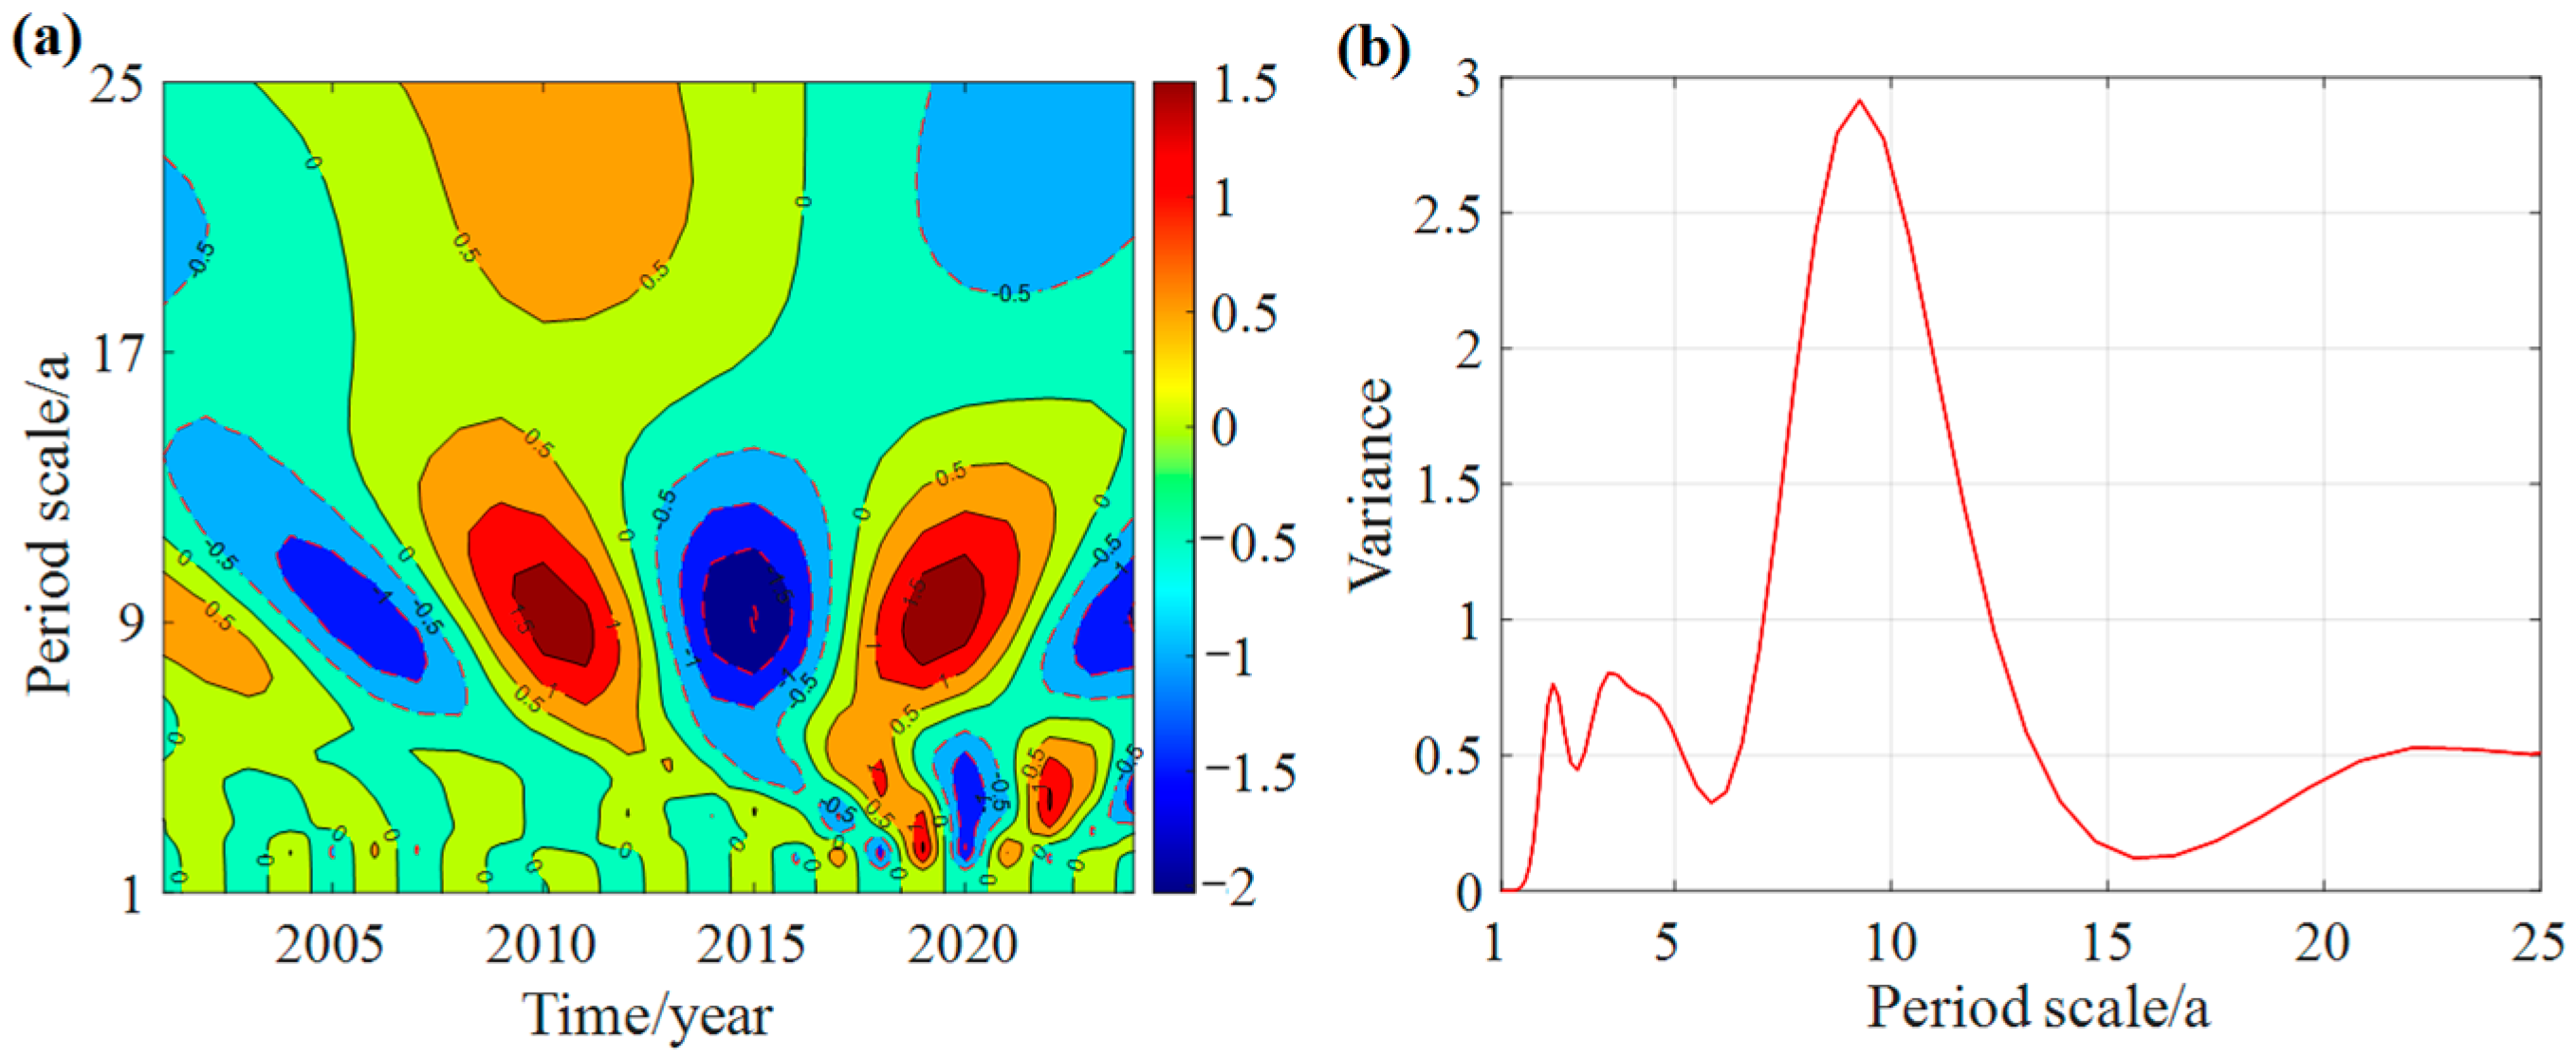
This section presents the wavelet periodicity analysis of the yields of three crops at the 852 Farm from 2001 to 2024. As shown in Figure 6a, rice yield exhibits periodic scales of 18–25a, 6–11a, and 2–6a, with corresponding main periods of 22a, 8a, and 5a. Figure 7a indicates that soybean yield also shows periodic scales of 18–25a, 6–11a, and 2–6a, with main periods of 22a, 8a, and 4a. Figure 8a shows that corn yield displays periodic scales of 18–25a, 6–11a, and 2–5a, with main periods of 22a, 8a, and 3a. The smaller time-scale oscillations with main periods of 4a or 3a for the three crops are characterized by strong fluctuations and poor local regularity in periodic variation; their signals appear disordered and unstable, so this periodic scale is disregarded. Therefore, rice, soybean, and corn share similar periodic characteristics, mainly manifested as multi-scale patterns with periodic scales of 18–25a and 6–11a and main periods of 22a and 8a. Integrating the results from Section 3.1.2, it can be concluded that the periodic evolution of the three crops aligns well with the periodic scales of the six meteorological factors, showing a significant time–frequency coupling in the 22a and 8a bands. This indicates that the crop yields display notable dynamic variation features and periodicity closely related to long-term changes in meteorological elements. According to Figure 6, Figure 7 and Figure 8, the real part of the wavelet coefficients for the three crops in 2024 is negative, and the negative contours have not yet fully closed, indicating that the three crops will be in a declining cycle after 2024, with yields likely to show a downward trend in the short term.

3.3. Crop and Meteorological Factor Correlation Analysis

3.3.1. Correlation Analysis

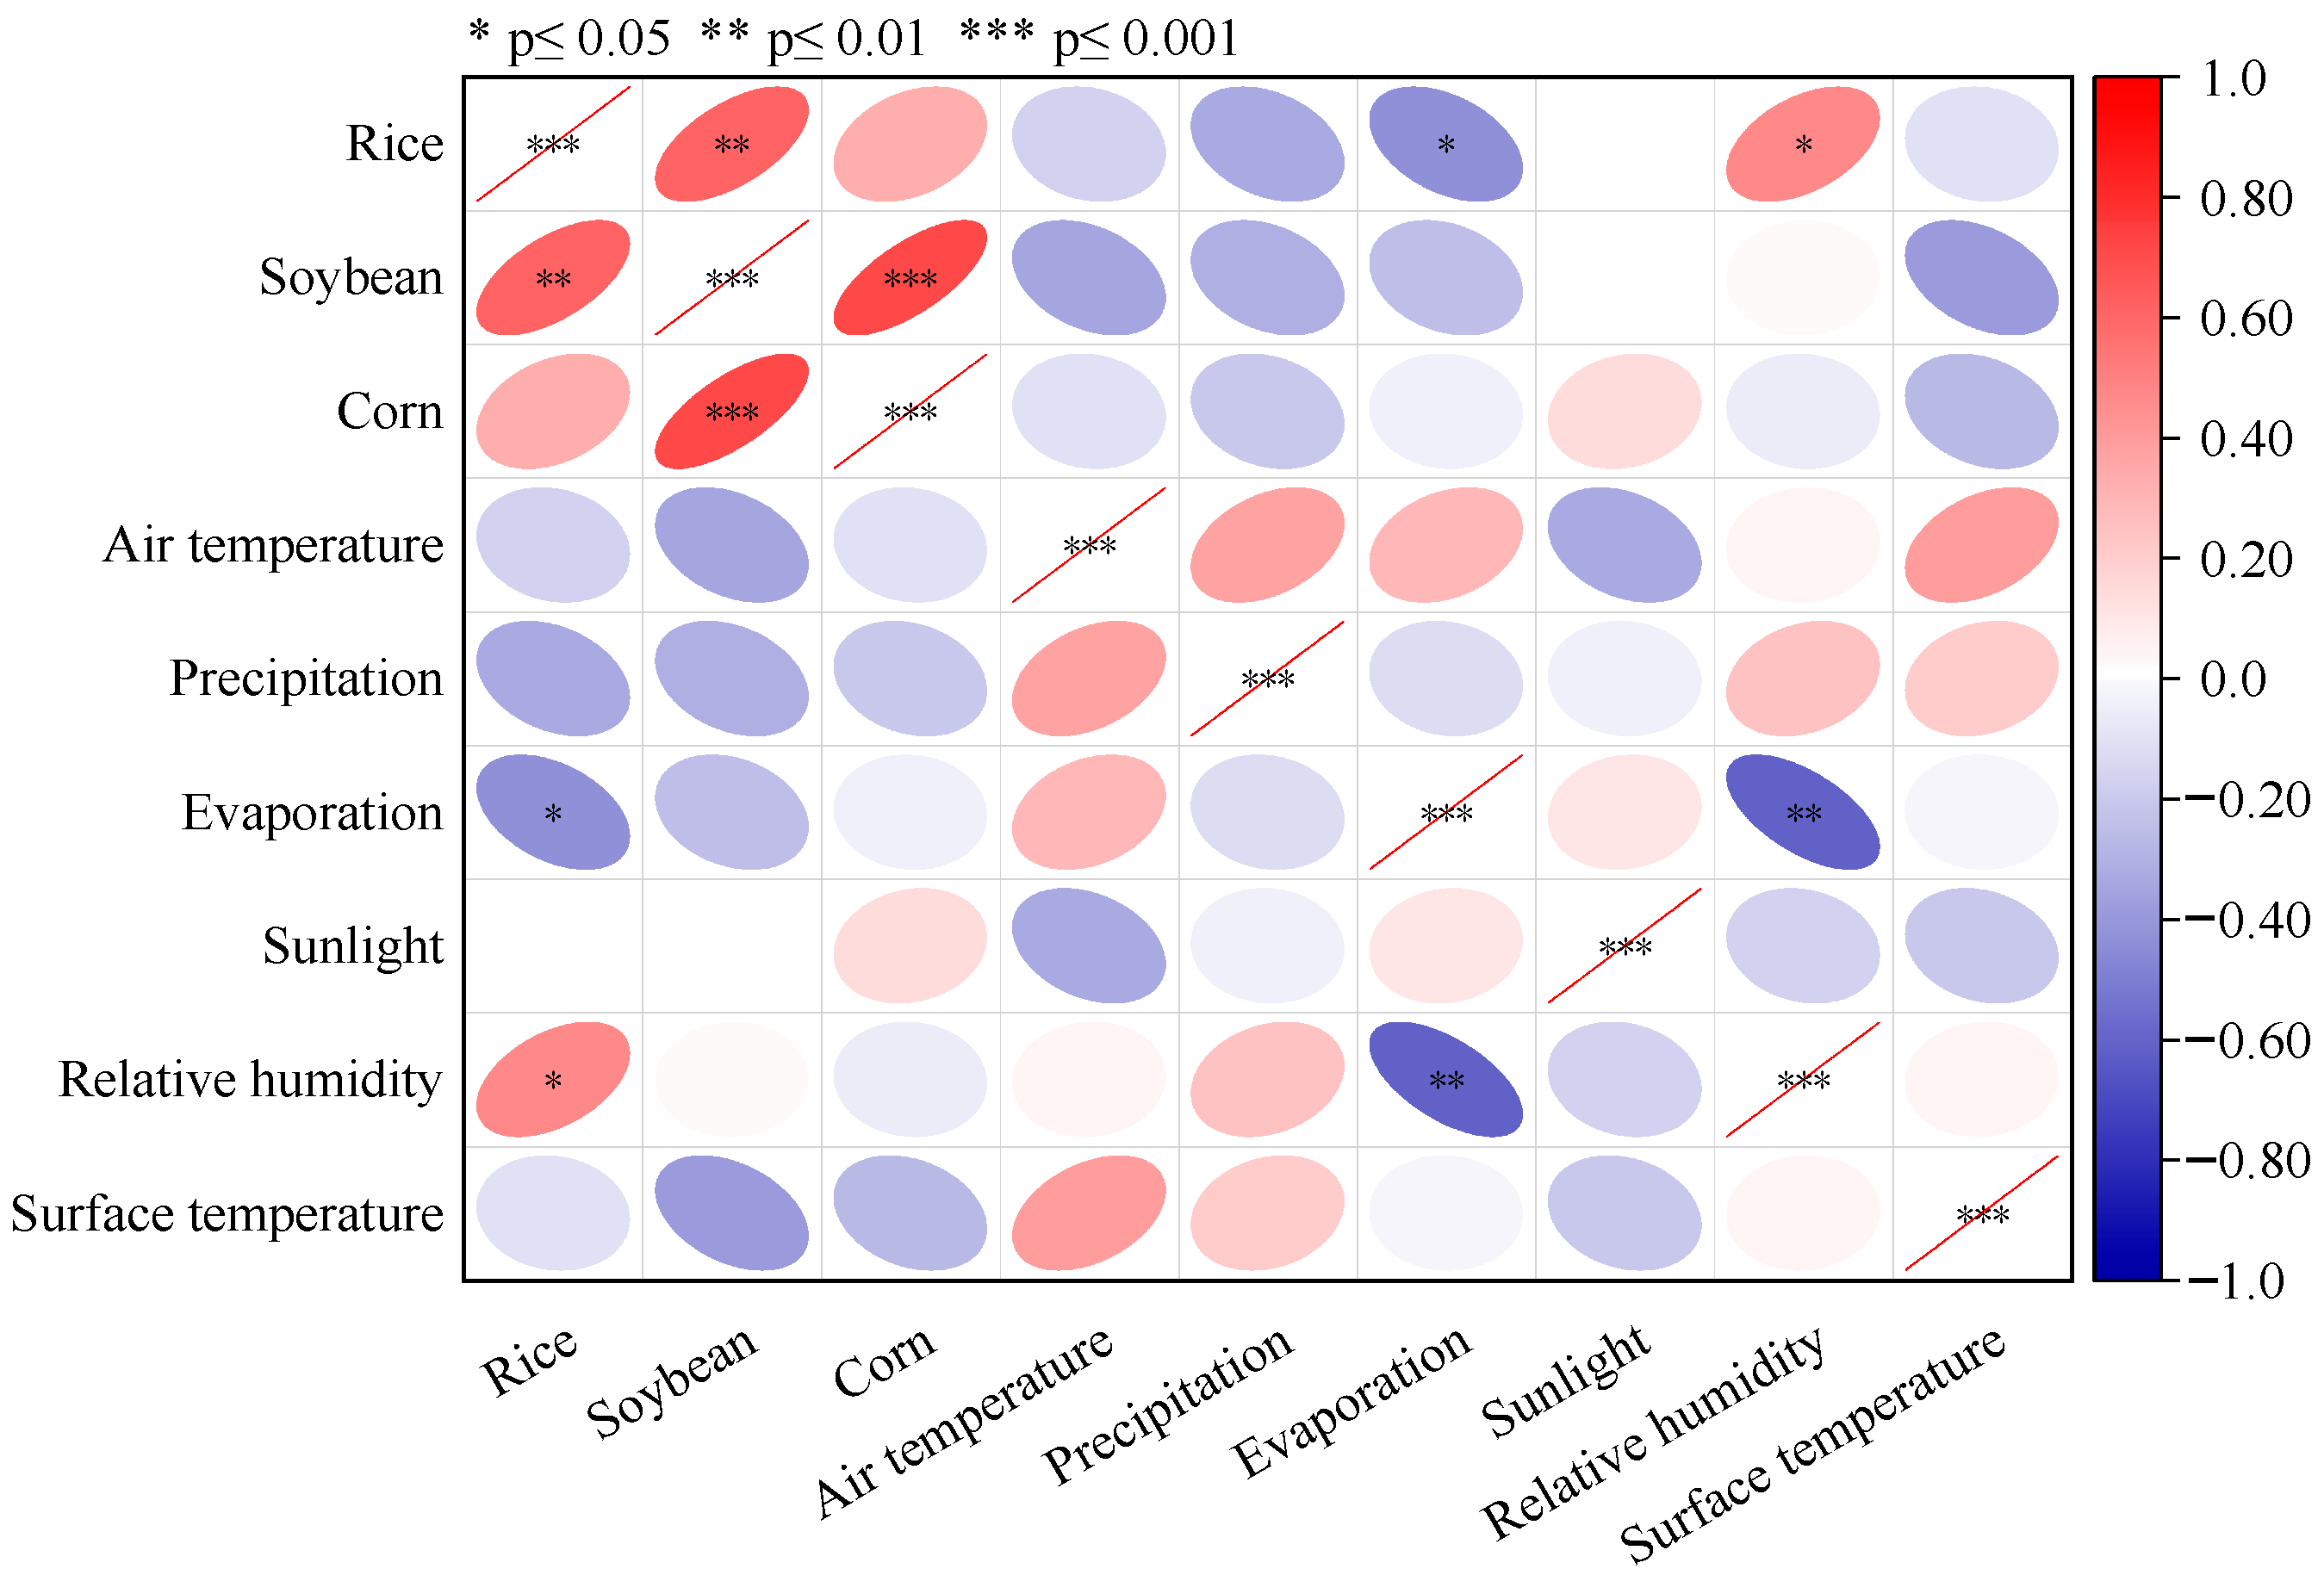
Pearson correlation analysis was used to preliminarily assess the correlation coefficients between the three crops and six meteorological factors. Figure 9 shows the correlation heatmap between crop yields and meteorological factors. The ellipse represents the magnitude of the Pearson correlation coefficient. The major axis of the ellipse indicates the positive or negative nature of the correlation (right upper tilt indicates positive, left lower tilt indicates negative); the area of the ellipse is proportional to the absolute value of the correlation coefficient; the color is labeled according to the color scale to indicate the intensity (the darker the red, the stronger the positive correlation; the darker the blue, the stronger the negative correlation). The figure indicates that rice has relatively high correlation coefficients with air temperature, precipitation, evaporation, and relative humidity (R ranges from 0.4 to 0.7). Among them, precipitation has the highest correlation coefficient with rice (R = 0.682), as precipitation is the main source of water required for rice growth. Rice is significantly positively correlated with relative humidity (R = 0.531), reflecting its strong dependence on a high-humidity environment, which promotes growth, especially during the heading and grain-filling stages. Rice is significantly negatively correlated with evaporation (R = −0.503); increased evaporation usually causes water deficits during rice growth, especially under conditions of insufficient precipitation or poor irrigation, significantly limiting rice yield.
Soybean shows relatively high correlations with air temperature, precipitation, evaporation, and surface temperature (R ranges from 0.4 to 0.6). Among these, precipitation has the highest correlation coefficient with soybean (R = 0.551), serving as the main water source for soybean growth. However, excessive precipitation can lead to waterlogging and increased diseases, which suppress yield. Soybean is positively correlated with air temperature (R = 0.432) and surface temperature (R = 0.403). Suitable air and surface temperatures increase soybean yield, but high temperatures reduce photosynthetic efficiency, especially during flowering and grain-filling stages when heat stress causes reduced pod-setting rates.
Corn shows relatively high correlations with precipitation and surface temperature (R ranges from 0.4 to 0.5). Precipitation has the highest correlation coefficient with corn (R = 0.482) as it is an important water source during corn growth. However, excessive precipitation causes field waterlogging, limiting root respiration and nutrient uptake, thus inhibiting plant growth and reducing yield. Corn is negatively correlated with surface temperature (R = 0.413). Higher surface temperatures increase soil water evaporation, causing soil dryness and inhibiting water absorption by corn roots.

3.3.2. Grey Relational Analysis

The gray relational degree between the yields of three crops and six meteorological factors from 2001 to 2024 was calculated. As shown in Figure 10, the correlation between the yields of rice, soybean, and corn and air temperature is the highest, indicating that air temperature is the dominant factor affecting crop yields at the 852 Farm. The boxplots of the correlation coefficients are relatively concentrated with low dispersion, showing that air temperature consistently promotes crop yields in multiple years. Next in terms of influence are sunlight and precipitation, with stable data distributions, indicating that sunlight and precipitation have strong effects on soybean yield and are important factors. Other factors have relatively smaller correlations and wider data distributions with greater fluctuations, indicating significant variability in their impact on crop yields across different years.
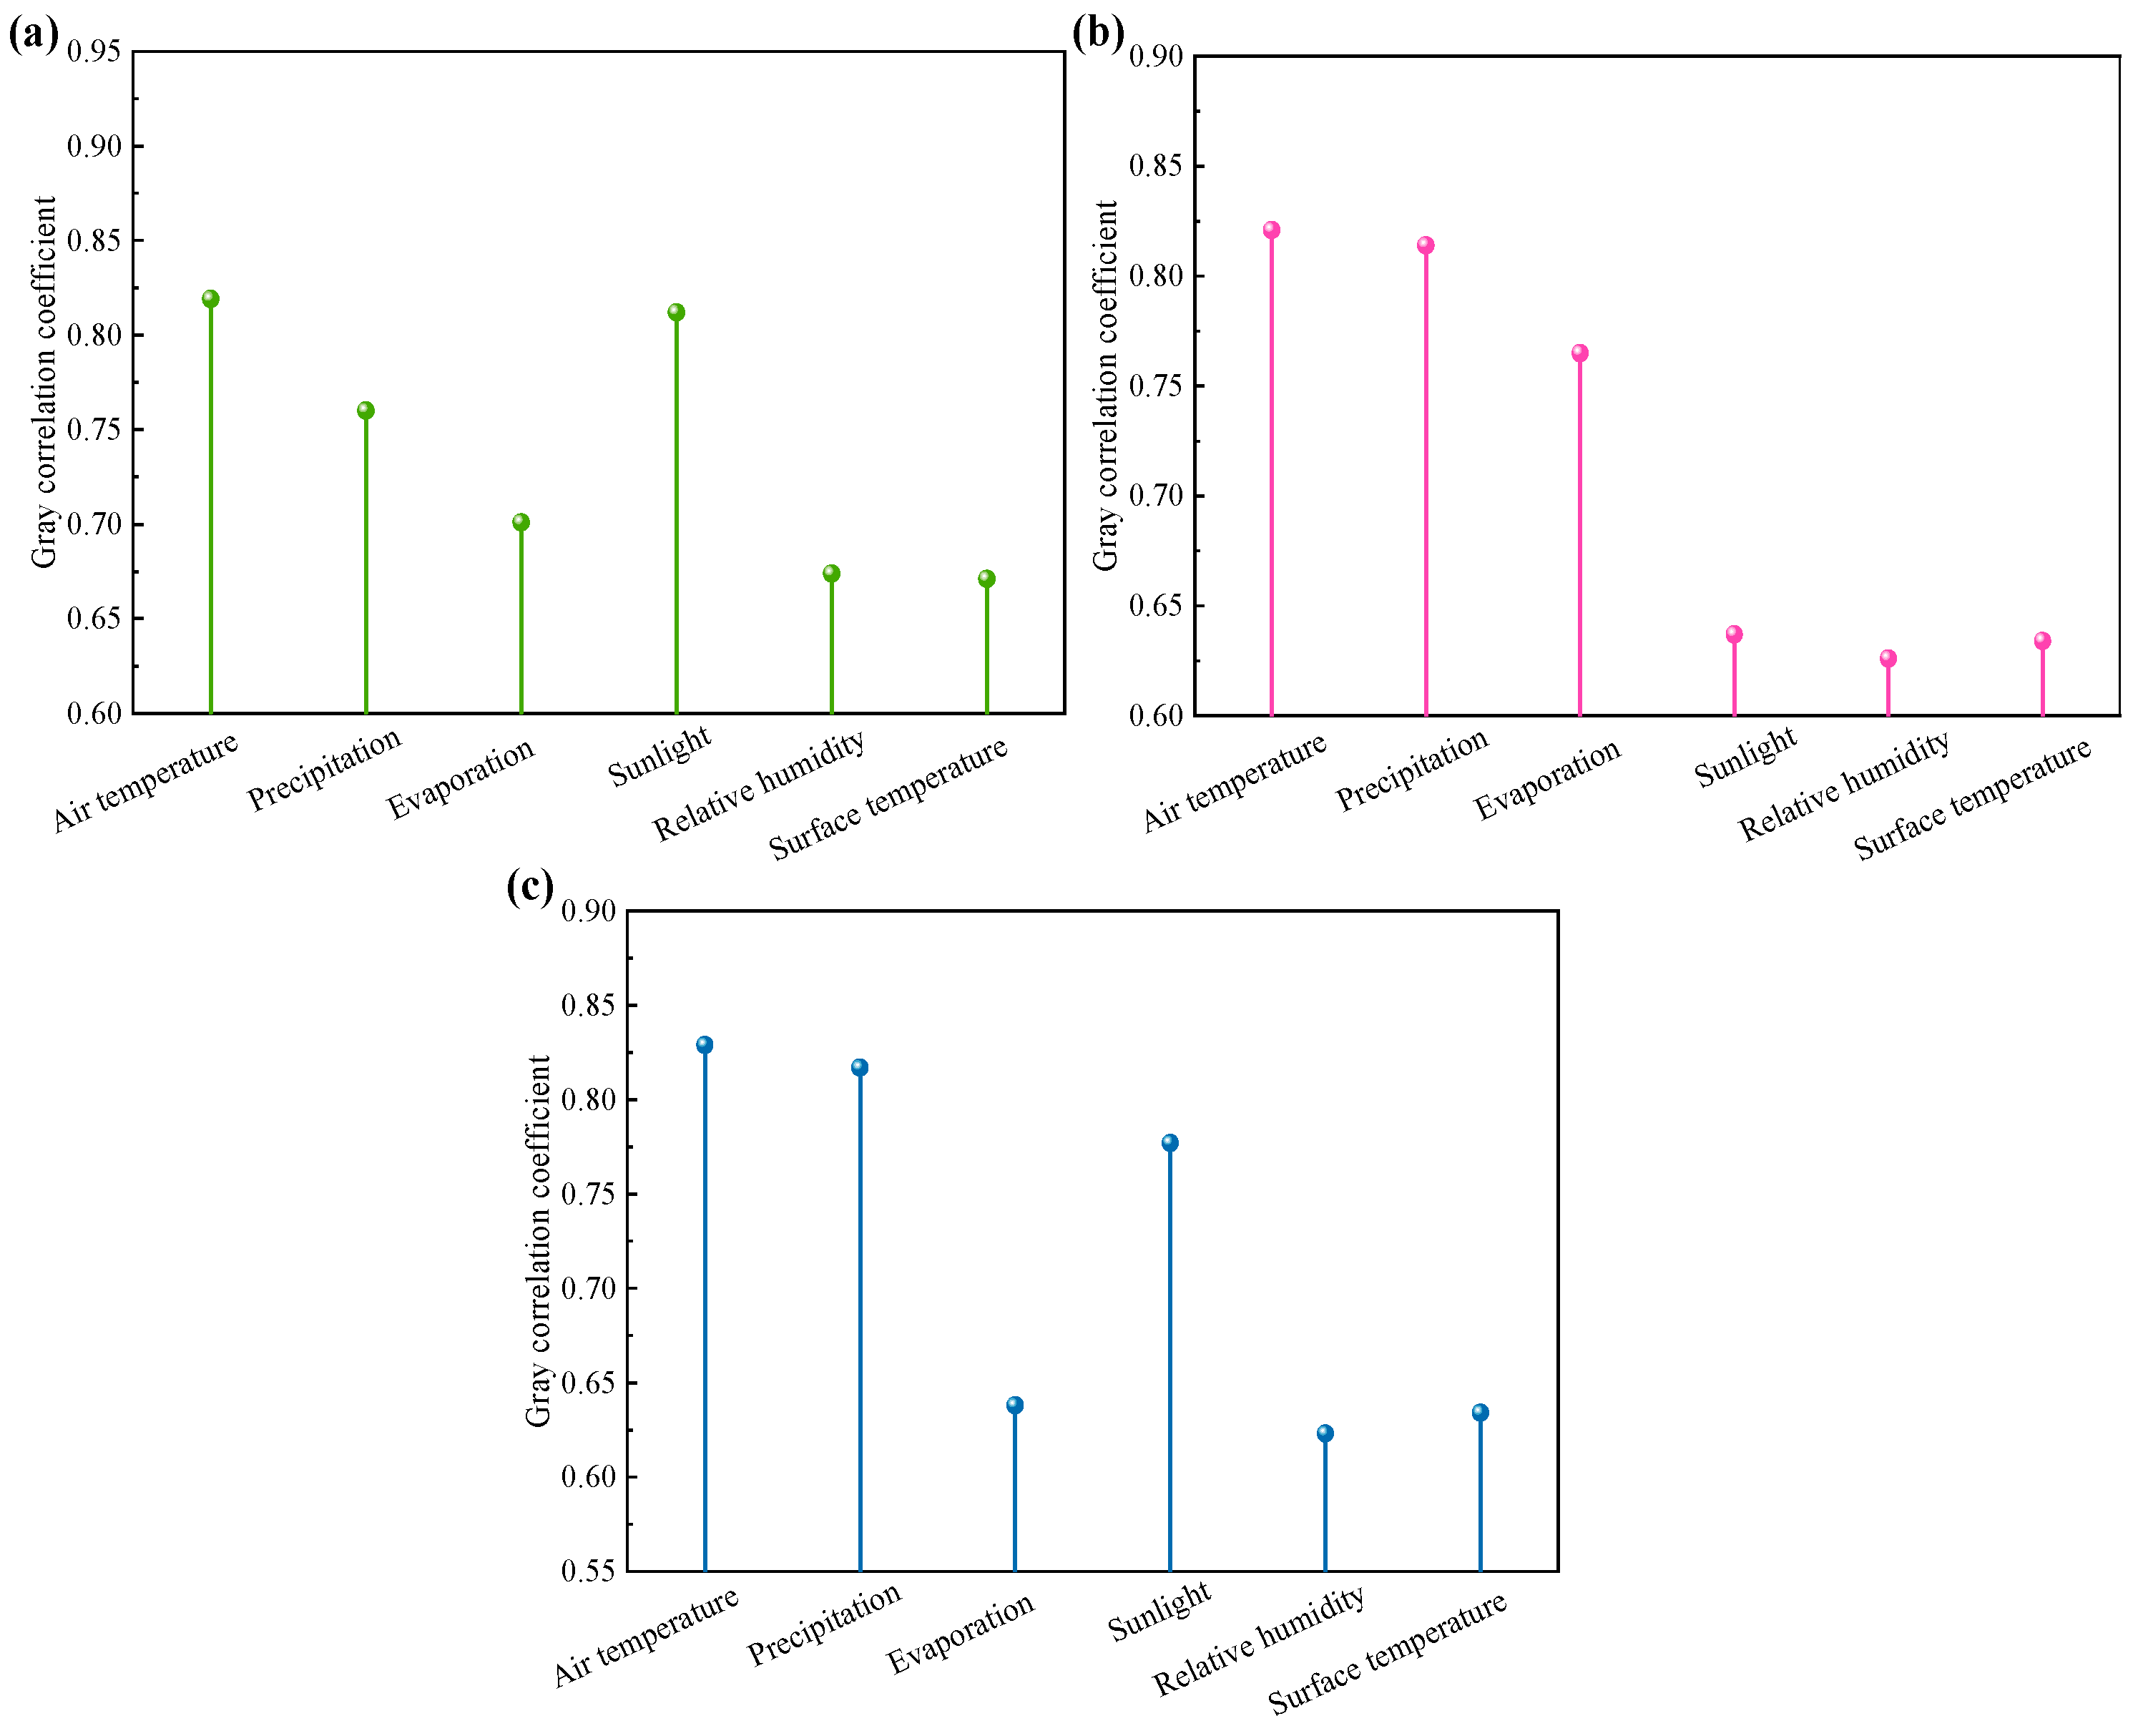
Further analysis used the annual average correlation degree to represent the influence of meteorological factors on crop yields, as shown in Table 4 and Figure 11. The figures indicate that rice has the highest gray relational coefficient with air temperature (γ = 0.819 ≥ 0.8), followed by sunlight (0.812), suggesting that rice yield is most affected by air temperature and sunlight. Soybean has the highest correlation with air temperature (0.821), followed by precipitation (0.814), indicating soybean yield is mainly influenced by air temperature and precipitation. Corn has the highest gray relational coefficient with air temperature (0.829), followed by precipitation (0.817), showing that corn yield is predominantly influenced by air temperature and precipitation. Other factors have weaker influences on the yields of the three crops (around 0.6), implying that evaporation, relative humidity, and surface temperature have limited direct effects on crop yield and mainly affect yield indirectly by regulating the local climate. Therefore, air temperature, precipitation, and sunlight are the key meteorological factors affecting crop yields at the 852 Farm, with the most significant comprehensive impacts on rice, soybean, and corn yields. Specifically, air temperature and sunlight are key factors influencing rice yield, while air temperature and precipitation are the main factors affecting soybean and corn yields.

3.4. Crop Yield Response Mechanisms to Climate Change

3.4.1. Quantification of Key Meteorological Factors

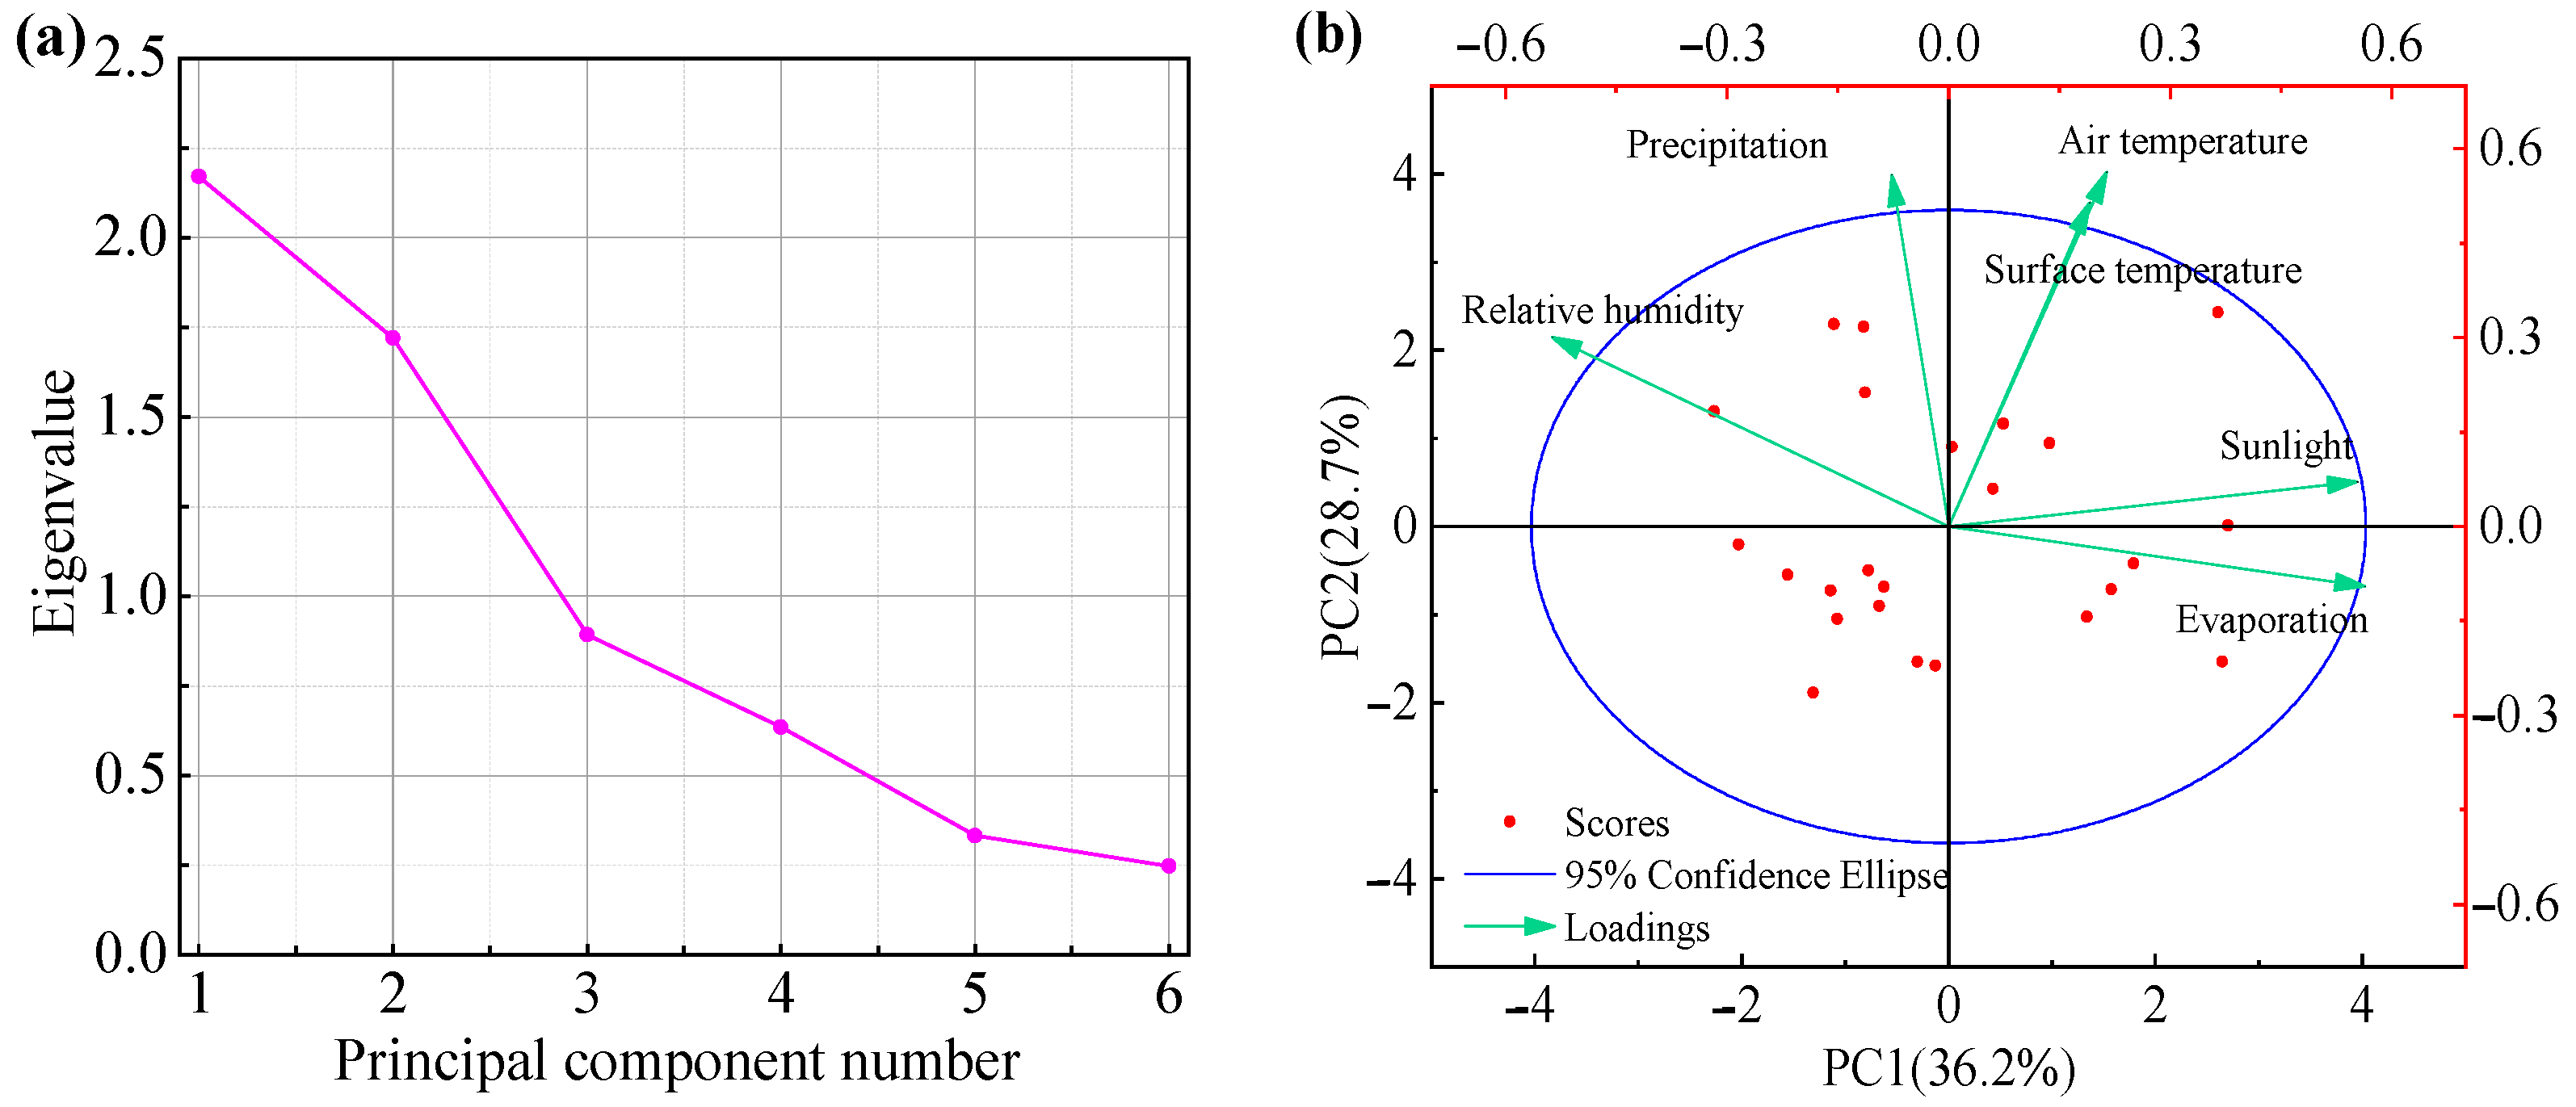
This section applies principal component analysis (PCA) to quantify the key meteorological factors affecting crop yield. According to Table 5 and Figure 12, the eigenvalues of the first two principal components (PC1 and PC2) are 2.171 and 1.720, respectively, both greater than 1. PC1 explains 36.178% of the variance and is the most significant component influencing yield. PC2 accounts for 28.659% of the variance, complementing the unexplained portion of PC1. Together, they contribute 64.837% of the total variance, providing a comprehensive reflection of the meteorological factors affecting crop yield. Further analysis from Table 6 and Figure 12 shows that air temperature projects negatively (−0.405) on the PC1 axis with the strongest loading, indicating that excessively high temperatures exert stress on crop yield. On the PC2 axis, air temperature projects positively (0.411), suggesting that suitable temperature conditions promote yield. Thus, air temperature exhibits a dual role (both positive and negative correlations) and is one of the significant factors affecting yield.
Precipitation exhibits a strong positive projection on the first principal component (PC1), with a loading value of 0.389, and its position distant from the origin indicates a significant contribution. It serves as the primary positive driving factor of PC1. On the second principal component (PC2), precipitation also displays a positive projection, with a loading of 0.451, further confirming its dominant influence in both dimensions. As a critical meteorological factor affecting crop yield, the stability and sufficiency of precipitation are essential for crops such as soybean and corn. Sunlight also projects positively on both PC1 and PC2, suggesting that it contributes to yield enhancement through its role in photosynthesis, although its relative influence is smaller. Other meteorological variables exhibit lower loading values on PC1 and PC2, indicating a limited direct effect on yield. Their influence is primarily exerted indirectly through the modulation of air temperature, precipitation, and sunlight.
In summary, air temperature has the most significant positive driving effect on crop yield, showing a dual nature: suitable temperatures are necessary for growth, but excessively high temperatures cause stress. A stable precipitation supply is essential for high yield. Increased sunlight enhances photosynthesis, thereby increasing yield. Although other factors contribute less to the principal components, their indirect effects should not be overlooked in practical agricultural management.

3.4.2. Time–Frequency Coupling Relationship Between Crop Yield and Meteorological Factors

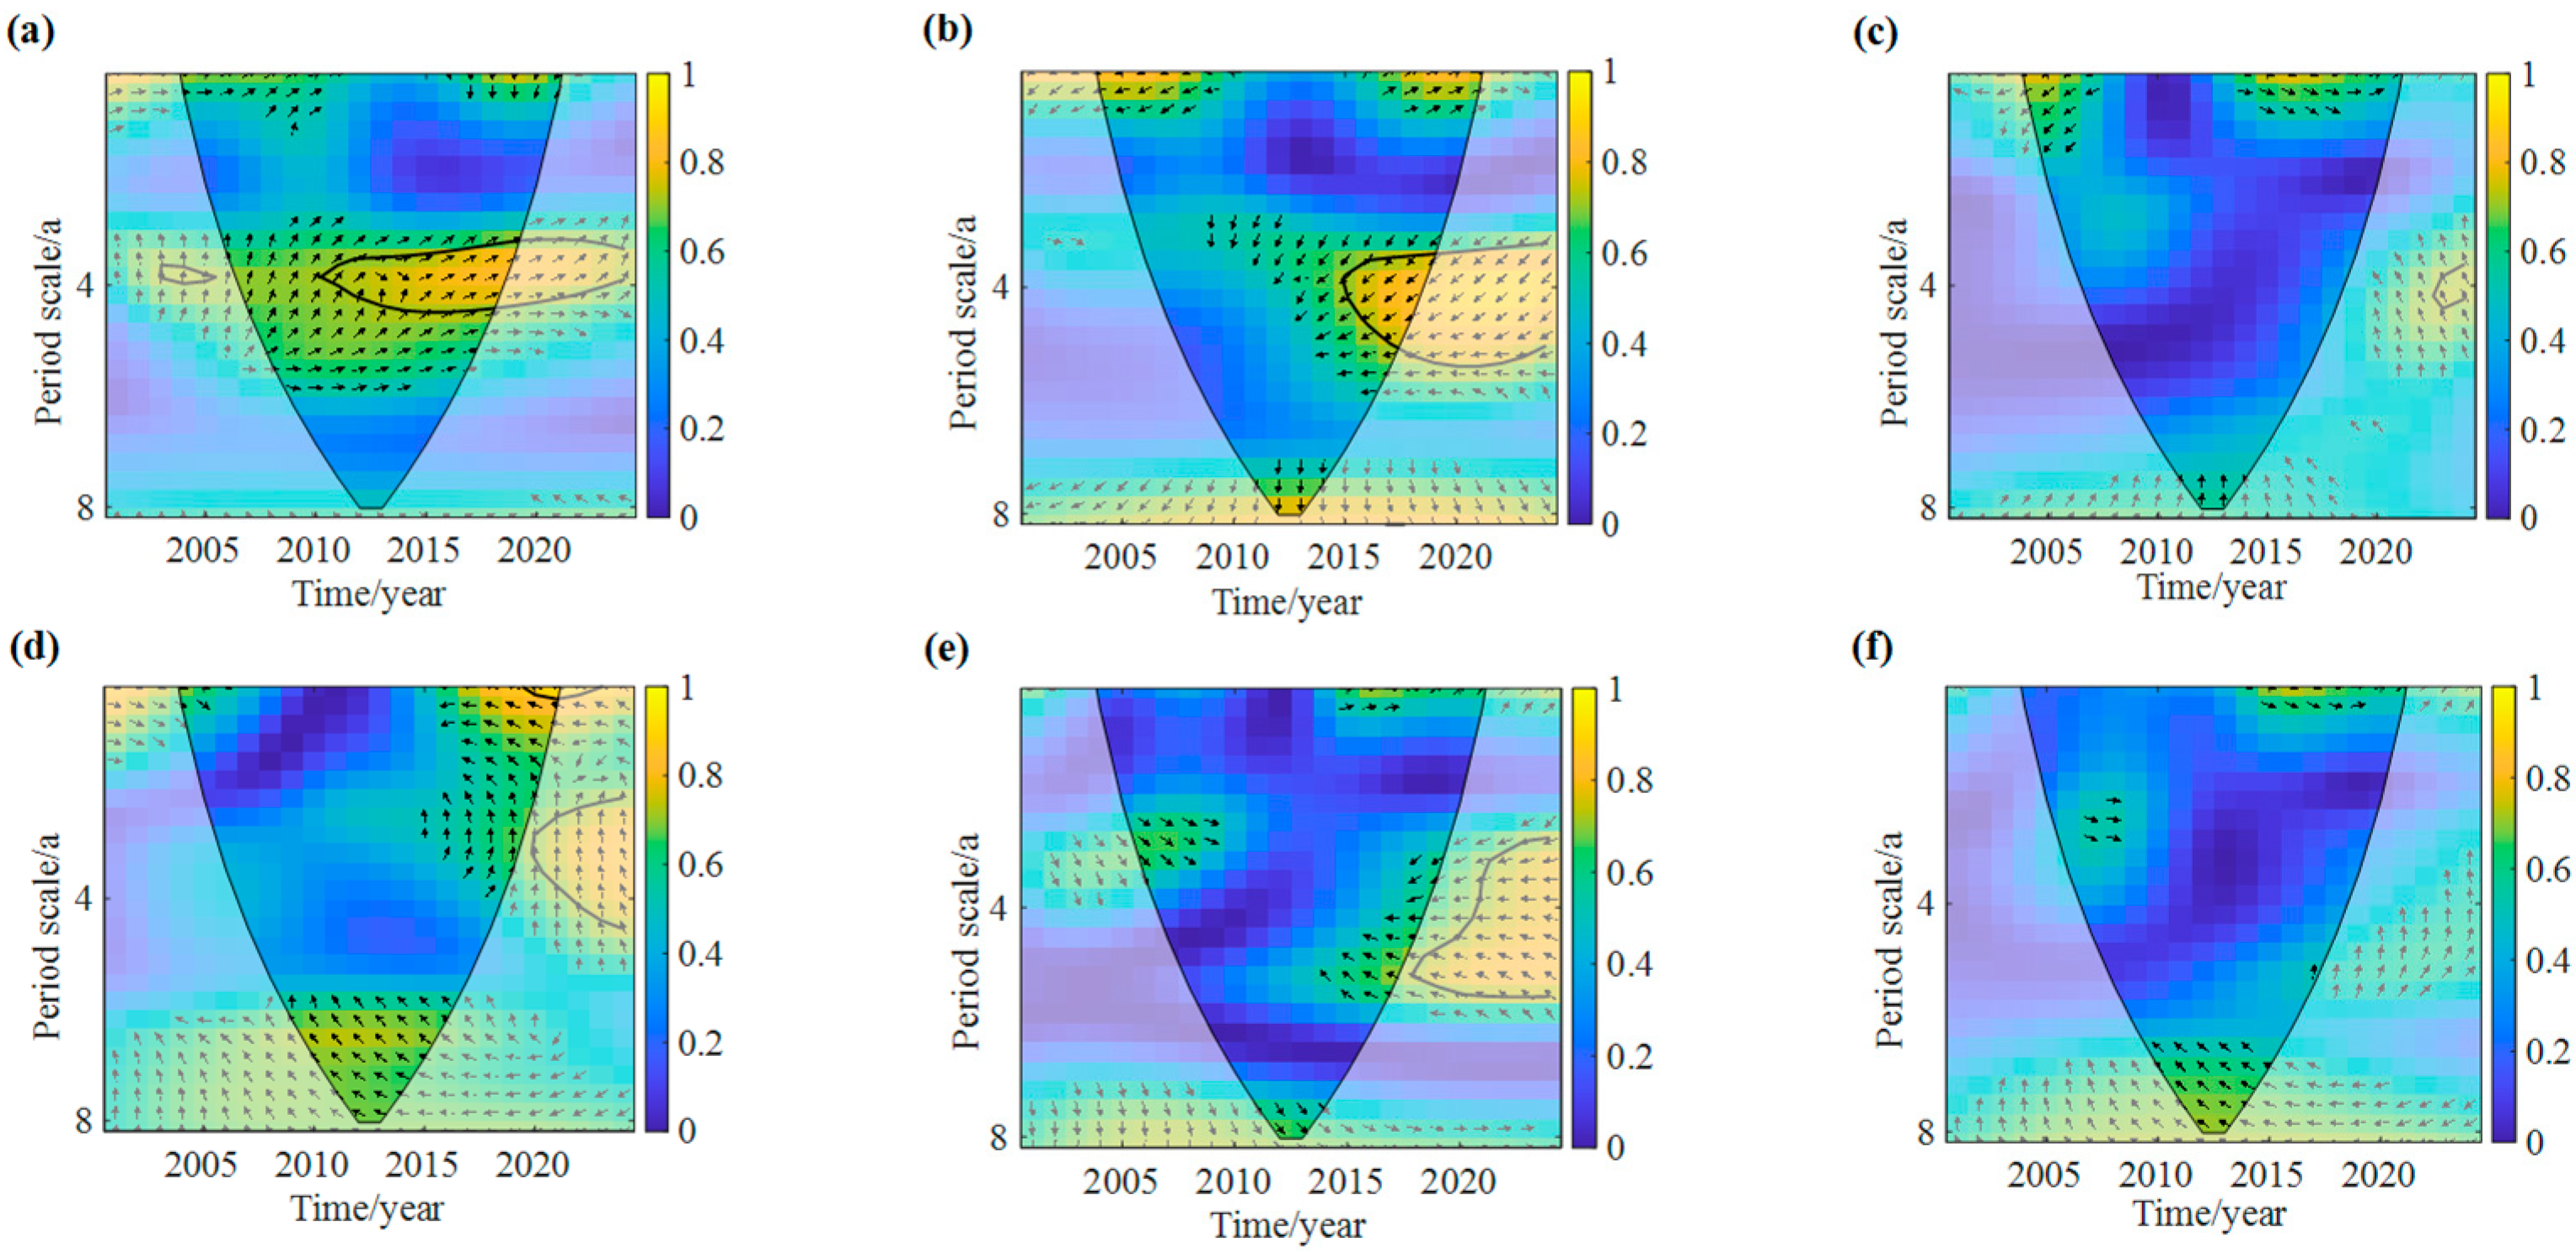
Cross-wavelet analysis was used to investigate the time–frequency coupling relationship between crops and meteorological factors. The arrows indicate the phase relationship between the two sets of sequences. The arrows pointing to the left indicate that the two sets of signals are opposite, suggesting a negative correlation between the sequences; the arrows pointing to the right indicate that the signals are the same, indicating a positive correlation between the sequences; the arrows pointing upwards indicate that the former sequence precedes the latter sequence; the arrows pointing downwards indicate that the former sequence lags behind the latter sequence in Figure 13, Figure 14 and Figure 15. Comprehensive analysis of Figure 13, Figure 14 and Figure 15 shows that air temperature, precipitation and sunlight exhibit strong coherence intensity with the three crops, with relatively large coherent areas. These factors demonstrate significant synchronized variation patterns, and their fluctuations are highly synchronous with crop yield. Other meteorological factors show weaker and less extensive wavelet coherence with yield, with unstable correlations and a weakening trend, indicating that their effects on crop production are indirect and unstable. Compared with precipitation, air temperature influences crop yield over a longer time scale and has the highest correlation, indicating a broader and more sustained impact. This highlights its dominant role in crop production and indirectly reflects that suitable temperatures are crucial for rice to complete photosynthesis and accumulate organic matter.
Meteorological factors interact and constrain each other, jointly affecting crop yield. Therefore, rice, soybean, and corn yields at the 852 Farm in the Sanjiang Plain are influenced by the combined effects of multiple meteorological factors. In the future, precise meteorological services could be utilized to improve the balanced growth and yield stability of crops.

4. Discussion

This study employed multi-scale analytical methods to uncover the dynamic coupling mechanisms between meteorological factors and crop yields in the albic soil region of the 852 Farm in the Sanjiang Plain. The results demonstrate both consistency with previous research and distinct differences that reflect regional spatiotemporal heterogeneity and methodological advancements. For example, Ding et al. [33] reported precipitation periodicities of 9–11a and 2–3a, with dominant cycles at 3 and 9a, based on data from the 852 Farm during the period from 1958 to 2008. In comparison, the present study, which analyzed data from 2001 to 2024, identified longer-term periodic structures, with dominant cycles occurring at approximately 22a, 12a, and 8a. This difference is primarily attributed to the transitional nature of the climate during the study period. As global warming intensifies, low-frequency climate oscillations such as the Pacific Decadal Oscillation have played an increasingly prominent role in shaping the spatial and temporal distribution of regional water and heat resources [34]. Furthermore, this study identified a statistically significant upward trend in precipitation from 2001 to 2024, with the Z-statistic greater than zero and the p-value below the 0.05 significance threshold. This finding is consistent with the conclusions of the IPCC’s Sixth Assessment Report, which notes the intensification of the East Asian summer monsoon and indicates a restructuring of regional moisture transport patterns in response to climate change [35]. Wang [36] and Li [37] previously emphasized the dominant influence of climate change on crop yields in the Sanjiang Plain. Building on this, the present study quantitatively assessed the contribution gradient of key meteorological variables and identified air temperature as the most influential positive driver of crop yield, with a correlation coefficient greater than or equal to 0.8. The strength of coherence and the frequency-domain coverage between air temperature and crop yield were substantially higher than those of precipitation and sunlight. These findings are in line with the “synergistic water and heat regulation” concept proposed by Ren et al. [38], but they further underscore the central regulatory role of temperature under conditions of increasingly frequent extreme climate events.
It is important to note that air temperature exerts a dual effect on crop yields. On the one hand, moderate warming may extend the growing season and promote growth; on the other hand, extremely high temperatures intensify evapotranspiration stress and may negatively impact yield. This observation is consistent with Zhao’s [39] research on thermal thresholds during the corn-growing season in Heilongjiang Province. Under the combined influence of various climatic factors, significant changes can occur in the sown area, planting structure, and yields of agricultural crops [40]. In addition, agricultural production is also influenced by external factors such as crop variety selection, farming techniques, infrastructure development, pest and disease pressure, and market-driven economic policies [41,42]. Therefore, this study not only enhances the current understanding of the relationships between meteorological factors and crop yields but also provides a theoretical foundation and decision-making reference for future adaptive management in agriculture. In subsequent research, our team plans to further explore the intrinsic connections between crop yields and key influencing factors such as varietal selection and production conditions, with the aim of precisely quantifying the individual contributions of these factors. This work will help establish a more robust theoretical framework and offer practical guidance for optimizing agricultural production in the albic soil region of the Sanjiang Plain, ultimately improving the resilience of regional agriculture to external environmental and socioeconomic changes.

5. Conclusions

This study investigated the dynamic characteristics, periodic patterns, and time–frequency coupling relationships between key meteorological factors and the yields of major crops in the albic soil region of the 852 farm on the Sanjiang Plain from 2001 to 2024. The main conclusions are as follows:
(1)
Trend characteristics: Among the six meteorological variables, only precipitation showed a statistically significant increasing trend. Air temperature, surface temperature, and relative humidity exhibited nonsignificant upward trends, while evaporation and sunlight duration declined slightly without significance. The crop yields for rice, soybean, and corn also showed overall upward trends, but none were statistically significant.
(2)
Periodic coherence: Both meteorological factors and crop yields exhibited dominant periodicities of around 22 and 8 years. These shared cycles revealed strong multi-scale time–frequency coherence, indicating that climate variability plays a long-term regulatory role in agricultural production.
(3)
Key drivers: Air temperature was the most influential factor for all three crops, followed by precipitation and sunlight duration. Rice was primarily affected by air temperature and sunlight, while soybean and corn were more sensitive to changes in air temperature and precipitation.
In summary, this research provides a quantitative understanding of how crop yields in cold-region albic soil areas respond to climatic fluctuations. The results offer theoretical support for designing climate-resilient agricultural strategies. Future studies should further explore the roles of precipitation variability and accumulated temperature in optimizing crop system adaptation.

Author Contributions

Conceptualization, J.L. and H.L.; methodology, Q.W. and Q.M.; software, H.L.; validation, J.Z. and C.Z.; formal analysis, H.L. and Y.J.; investigation, C.Z.; resources, J.L. and Q.W.; data curation, H.L.; writing—original draft, J.Z. and Y.J.; writing—review and editing, H.L.; visualization, Q.M. and C.Z.; supervision, Q.W.; project administration, Q.W. and Y.J.; funding acquisition, J.L., H.L. and Q.W. All authors have read and agreed to the published version of the manuscript.

Funding

This study was supported by the National Key Research and Development Program (2022YFD1500800), the Outstanding Youth Project of Heilongjiang Provincial Agricultural Science and Technology Innovation Leap Project (CX25JC15), Technology Integration and Application for High Yield and Efficiency of Major Crops (CX25GG03-01), the Doctoral Fund Project of Hebei University of Water Resources and Electric Engineering (SYBJ2402), Science and Technology Innovation Project of Cangzhou Association for Science and Technology (CZKX2025316), and Natural Science Foundation of Cangzhou (23241002015N).

Data Availability Statement

Dataset available on request from the authors. The raw data supporting the conclusions of this article will be made available by the authors on request.

Acknowledgments

The authors gratefully acknowledge Beidahuang Group Heilongjiang 852 Farm Co., Ltd. for their strong support in the crop yield and related research.

Conflicts of Interest

Author Yu Jiang was employed by the company Beidahuang Group Heilongjiang 852 Farm Co., Ltd. The remaining authors declare that the research was conducted in the absence of any commercial or financial relationships that could be construed as a potential conflict of interest.

References

  1. Yang, Y.; Tilman, D.; Jin, Z.; Smith, P.; Barrett, C.B.; Zhu, Y.G.; Burney, J.; D’Odorico, P.; Fantke, J.; Fargione, J. Climate change exacerbates the environmental impacts of agriculture. Science 2024, 385, 11. [Google Scholar] [CrossRef] [PubMed]
  2. Krishnakumar, S.; Sreevidhya, V.; Vivek, S.; Priya, V. Drought vulnerability assessment using GIS and remote sensing techniques: A case study in part of Coimbatore, Tamil Nadu, India. J. Indian Soc. Remote Sens. 2025, 53, 1077–1091. [Google Scholar] [CrossRef]
  3. Meng, H.Y.; Qian, L. Performances of different yield-detrending methods in assessing the impacts of agricultural drought and flooding: A case study in the middle-and-lower reach of the Yangtze River, China. Agric. Water Manag. 2024, 296, 108812. [Google Scholar] [CrossRef]
  4. Sharma, A.; Kumar, J.; Redhu, M.; Kumar, P.; Godara, M.; Ghiyal, P.; Fu, P.; Rahimi, M. Estimation of rice yield using multivariate analysis techniques based on meteorological parameters. Sci. Rep. 2024, 14, 12626. [Google Scholar] [CrossRef]
  5. Verma, K.K.; Song, X.-P.; Kumari, A.; Jagadesh, M.; Singh, S.K.; Bhatt, R.; Singh, M.; Seth, C.S.; Li, Y. Climate change adaptation: Challenges for agricultural sustainability. Plant Cell Environ. 2025, 48, 2522–2533. [Google Scholar] [CrossRef]
  6. Barbieri, L.; Bittner, C.; Wollenberg, E.; Adair, E.C. Climate change adaptation and mitigation in agriculture: A review of the evidence for synergies and tradeoffs. Environ. Res. Lett. 2024, 19, 013005. [Google Scholar] [CrossRef]
  7. Li, C.; Yao, H.; Li, Z.; Wu, F.; Liu, B.; Wu, Y.; Chun, K.P.; Octavianti, T.; Cui, X.; Xu, Y. A bibliometric analysis of global research on climate change and agriculture from 1985 to 2023. Agronomy 2024, 14, 2729. [Google Scholar] [CrossRef]
  8. Bwire, D.; Watanabe, F.; Suzuki, S.; Suzuki, K. Improving irrigation water use efficiency and maximizing vegetable yields with drip irrigation and poly-mulching: A climate-smart approach. Water 2024, 16, 3458. [Google Scholar] [CrossRef]
  9. Luo, B.; Dou, X. Climate change, agricultural transformation and climate smart agriculture development in China. Heliyon 2024, 10, e40008. [Google Scholar] [CrossRef]
  10. Wu, Z.Z.; Zhao, X.Y.; Yong, J.W.H.; Sehar, S.; Adil, M.F.; Riaz, M.; Verma, K.K.; Li, M.Y.; Huo, J.L.; Yang, S.; et al. Slow-release boron fertilizer improves yield and nutritional profile of Beta vulgaris L. grown in Northeast China by increasing boron supply capacity. Front. Plant Sci. 2024, 15, 1441226. [Google Scholar] [CrossRef]
  11. Yang, E.J.; Zhao, X.L.; Qin, W.; Jiao, J.; Han, J.Q.; Zhang, M. Temporal impacts of dryland-to-paddy conversion on soil quality in the typical black soil region of China: Establishing the minimum data set. Catena 2023, 231, 107303. [Google Scholar] [CrossRef]
  12. Liu, D.; Chen, W.F.; Li, L.N. Disentangling the relative effects of climate change and anthropogenic activities on paddy expansion in the northern Sanjiang Plain of China. Ecol. Indic. 2023, 154, 110543. [Google Scholar] [CrossRef]
  13. Gong, X.J.; Yu, Y.; Lv, G.Y.; Hao, Y.B.; Wang, L.L.; Ma, J.T.; Jiang, Y.B.; Zou, J.H.; Li, J.Y.; Wang, Q.J. Construction and effect analysis of a mixed actinomycete flora for straw returning to albic soil in Northeast China. Microorganisms 2025, 13, 385. [Google Scholar] [CrossRef] [PubMed]
  14. Huang, P.; Xie, H.; Li, D.; Hu, X.; Liu, C.; Kurshid, B.; Xu, Y.; Song, C.; Dai, C.; Khan, S.; et al. Projected high-resolution ETo spatiotemporal variation under future climate change and paddy area expansion in the Sanjiang Plain, Northeast China. J. Hydrol. Reg. Stud. 2023, 50, 101574. [Google Scholar] [CrossRef]
  15. Zhang, L.; Wang, Z.; Shixuan, E.; Du, G.; Chen, Z. Analysis of climatic basis for the change of cultivated land area in Sanjiang Plain of China. Front. Earth Sci. 2022, 10, 862141. [Google Scholar] [CrossRef]
  16. Zhang, D.; Jiang, B.Z.; Liu, G.H.; Zhang, H.; Nie, F.; Sun, Q.; Ji, M.Y. Applicability of spatial interpolation methods to predict total phosphorus in the typical irrigated areas of the Sanjiang Plain. Chin. J. Eco-Agric. 2021, 29, 1405–1416. [Google Scholar]
  17. Sootahar, M.K.; Zeng, X.; Su, S.; Wang, Y.N.; Bai, L.Y.; Zhang, Y.; Li, T.; Zhang, X.J. The effect of fulvic acids derived from different materials on changing properties of albic black soil in the Northeast Plain of China. Molecules 2019, 24, 1535. [Google Scholar] [CrossRef]
  18. Feng, S.; Hao, Z.; Zhang, X.; Hao, F. Changes in climate-crop yield relationships affect risks of crop yield reduction. Agric. For. Meteorol. 2021, 304, 108401. [Google Scholar] [CrossRef]
  19. Li, E.; Zhao, J.; Pullens, J.W.M.; Yang, X. The compound effects of drought and high temperature stresses will be the main constraints on corn yield in Northeast China. Sci. Total Environ. 2021, 812, 152461. [Google Scholar] [CrossRef]
  20. Baig, I.A.; Irfan, M.; Salam, M.A.; Iik, C. Addressing the effect of meteorological factors and agricultural subsidy on agricultural productivity in India: A roadmap toward environmental sustainability. Environ. Sci. Pollut. Res. 2022, 30, 15881–15898. [Google Scholar] [CrossRef] [PubMed]
  21. Zhan, C.; Liang, C.; Zhao, L.; Zhang, J.; Wang, H. Differential responses of crop yields to multi-timescale drought in mainland China: Spatiotemporal patterns and climate drivers. Sci. Total Environ. 2024, 906, 167559. [Google Scholar] [CrossRef]
  22. Li, S.K.; Liu, Y.S.; Shao, Y.J.; Zhang, L.F. Impact of climate change on crop-cropland coupling relationship: A case study of the Loess Plateau in China. Chin. Geogr. Sci. 2025, 35, 92–110. [Google Scholar] [CrossRef]
  23. Zhao, H.J.; Luo, C.; Kong, D.P.; Yu, Y.F.; Zang, D.Q.; Wang, F. Spatial and temporal variations in soil organic matter and their influencing factors in the Songnen and Sanjiang Plains of China (1984–2021). Land 2024, 13, 1447. [Google Scholar] [CrossRef]
  24. Liu, H.W.; Wang, J.J.; Sun, X.; McLaughlin, N.B.; Jia, S.X.; Liang, A.Z.; Zhang, S.X. The driving mechanism of soil organic carbon biodegradability in the black soil region of Northeast China. Sci. Total Environ. 2023, 884, 163835. [Google Scholar] [CrossRef] [PubMed]
  25. Dong, F.J.; Zhang, Z.B.; Jiang, F.H.; Wang, J.H.; Wang, Q.J.; Li, L.L.; Peng, X.H. Spatial distribution of the buried depth and thickness of albic soil albic layer in Sanjiang Plain and its influencing factors. Acta Pedol. Sin. 2025, 62, 362–374. [Google Scholar]
  26. Wang, S.Z.; Wang, M.Y.; Gao, X.; Zhao, W.Q.; Miao, P.W.; Liu, Y.N.; Zhang, R.T.; Wang, X.; Sui, X.; Li, M.H. The diversity and composition of soil microbial communities differ in three land use types of the Sanjiang Plain, Northeastern China. Microorganisms 2024, 12, 780. [Google Scholar] [CrossRef]
  27. Wu, J.H.; Deng, H.B.; Sun, R. Analysis of spatiotemporal variation in precipitation on the Loess Plateau from 1961 to 2016. Sustainability 2025, 16, 11119. [Google Scholar] [CrossRef]
  28. Zhang, J.; Sun, H.; Gao, D.; Chen, X. Detection of canopy chlorophyll content of corn based on continuous wavelet transform analysis. Remote Sens. 2020, 12, 2741. [Google Scholar] [CrossRef]
  29. Gu, X.F.; Jamshidi, S.; Gu, L.L.; Li, Y.Y. Drought dynamics in California and Mississippi: A wavelet analysis of meteorological to agricultural drought transition. J. Environ. Manag. 2024, 370, 122883. [Google Scholar] [CrossRef]
  30. Zhou, Y.; Zhang, Q.L.; Bai, G.Y.; Liu, H.X. Groundwater dynamics clustering and prediction based on grey relational analysis and LSTM model: A case study in Beijing Plain, China. J. Hydrol. Reg. Stud. 2024, 56, 102011. [Google Scholar] [CrossRef]
  31. Parding, K.M.; Benestad, R.E.; Dyrrdal, A.V.; Haugen, J.E. A principal-component-based strategy for regionalisation of precipitation intensity-duration-frequency (IDF) statistics. Hydrol. Earth Syst. Sci. 2023, 27, 719–3732. [Google Scholar] [CrossRef]
  32. Song, S.H.; Li, H.H.; Yang, M.; Zhang, T.X. Study on response process and time delay effect of groundwater dynamic in northeastern margin of Tibetan Plateau. Water 2023, 15, 2838. [Google Scholar] [CrossRef]
  33. Ding, H.; Wang, X.Y.; Liu, D. Multi-time scale analysis of precipitation series in 51a of 852 Farm. J. Heilongjiang Hydraul. Eng. Coll. 2009, 36, 79–81. [Google Scholar]
  34. Guan, Y.L.; Liu, J.G.; Cui, W.H.; Zhang, B.F. Elevation regulates the response of climate heterogeneity to climate change. Geophys. Res. Lett. 2024, 51, e2024GL109483. [Google Scholar] [CrossRef]
  35. Solecki, W.; Roberts, D.; Seto, K.C. Strategies to improve the impact of the IPCC Special Report on Climate Change and Cities. Nat. Clim. Change 2024, 14, 85–691. [Google Scholar] [CrossRef]
  36. Wang, S. Study on Characteristics of Climate Change and Its Impact on Agricultural Production in the Sanjiang Plain. Master’s Thesis, Northeast Agricultural University, Harbin, China, 2018. [Google Scholar]
  37. Li, M. Study on Thermal and Precipitation Zoning Characteristics and Suitable Cultivation Methods in the Northeast Plain. Master’s Thesis, Northeast Agricultural University, Harbin, China, 2021. [Google Scholar]
  38. Ren, X.L.; Li, H.L.; Zhang, Y.H.; Meng, X.Z. Characteristics and influencing factors of water requirements of major crops in the Sanjiang Plain from 2000 to 2015. Arid Land Geogr. 2019, 42, 854–866. [Google Scholar]
  39. Zhao, C.S. Characteristics of Extreme Temperature and Precipitation and Their Impacts on Spring Corn Yield in Heilongjiang Province. Master’s Thesis, Northeast Agricultural University, Harbin, China, 2023. [Google Scholar]
  40. Bouteska, A.; Sharif, T.; Bhuiyan, F.; Tesfaye, S. Impacts of the changing climate on agricultural productivity and food security: Evidence from Ethiopia. J. Clean. Prod. 2024, 449, 141793. [Google Scholar] [CrossRef]
  41. Ma, X.Z.; Zhao, Y.; Zheng, Y.; Wang, L.L.; Zhang, Y.L.; Sun, Y.; Ji, J.H.; Hao, X.Y.; Liu, S.Q.; Sun, N. Effect of different fertilization on soil fertility, biological activity, and corn yield in the albic soil area of China. Plants 2025, 14, 810. [Google Scholar] [CrossRef]
  42. Priatmadi, B.J.; Septiana, M.; Saidy, A.R. Growth performance and yield of rice grown in three different types of soil collected from rice fields with coal fly ash application. Plant Soil Environ. 2023, 69, 314–323. [Google Scholar] [CrossRef]
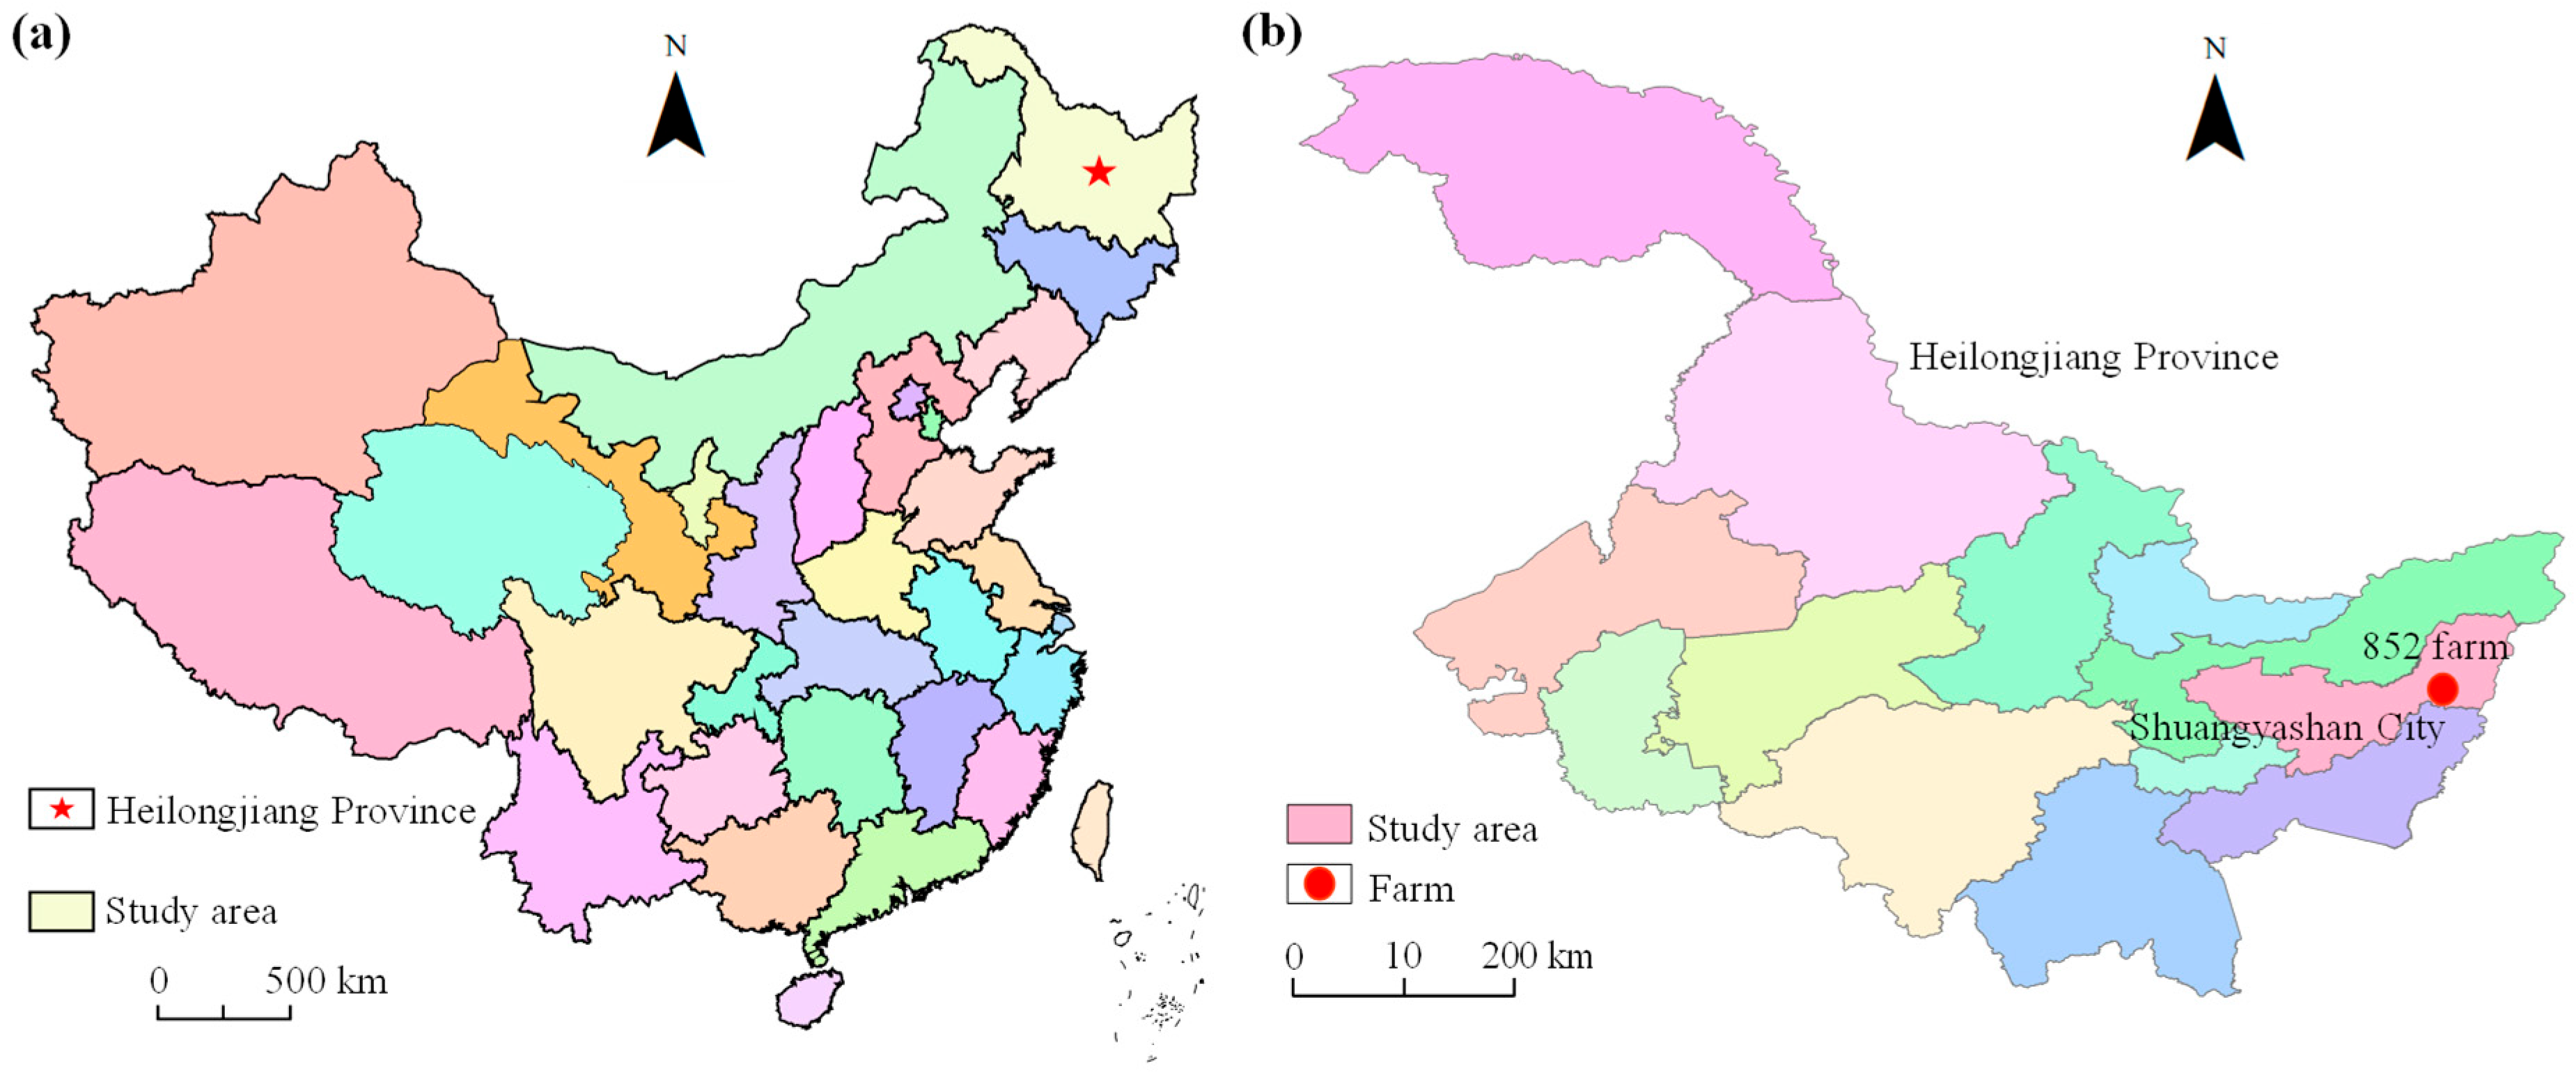
Figure 1. Geographic location map of the study area: (a) China’s administrative divisions; (b) location of the 852 Farm.
Atmosphere 16 00984 g001
Figure 2. Dynamic variation process of meteorological elements.
Atmosphere 16 00984 g002
Figure 3. Contour lines of the real part of the wavelet of meteorological elements: (a) air temperature; (b) precipitation; (c) evaporation; (d) sunlight; (e) relative humidity; and (f) surface temperature.
Atmosphere 16 00984 g003
Figure 4. Changes in the crop planting structure at the 852 Farm.
Atmosphere 16 00984 g004
Figure 5. Annual variation curves of yields for different crops.
Atmosphere 16 00984 g005
Figure 6. Wavelet periodicity of rice yields: (a) contour lines of the real part; (b) wavelet variance.
Atmosphere 16 00984 g006
Figure 7. Wavelet periodicity of soybean yields: (a) contour lines of the real part; (b) wavelet variance.
Atmosphere 16 00984 g007
Figure 8. Wavelet periodicity of corn yields: (a) contour lines of the real part; (b) wavelet variance.
Atmosphere 16 00984 g008
Figure 9. Heatmap of correlation between meteorological elements and crops.
Atmosphere 16 00984 g009
Figure 10. Boxplot of grey relational degree for different crops: (a) rice; (b) soybean; (c) corn.
Atmosphere 16 00984 g010
Figure 11. Bar chart of correlation degrees for different crops: (a) rice; (b) soybean; (c) corn.
Atmosphere 16 00984 g011
Figure 12. PCA of meteorological elements: (a) scree plot of the number of principal components; (b) principal component loading scores.
Atmosphere 16 00984 g012
Figure 13. Cross-wavelet coherence between rice and meteorological elements: (a) air temperature; (b) precipitation; (c) evaporation; (d) sunlight; (e) relative humidity; (f) surface temperature.
Atmosphere 16 00984 g013
Figure 14. Cross-wavelet coherence between soybean and meteorological elements: (a) air temperature; (b) precipitation; (c) evaporation; (d) sunlight; (e) relative humidity; (f) surface temperature.
Atmosphere 16 00984 g014
Figure 15. Cross wavelet coherence between corn and meteorological elements: (a) air temperature; (b) precipitation; (c) evaporation; (d) sunlight; (e) relative humidity; (f) surface temperature.
Atmosphere 16 00984 g015
Table 1. MK test results of meteorological elements.
Meteorological ElementsZ-Valuep-Value
Air temperature1.2560.051
Precipitation0.5710.001
Evaporation−0.9670.053
Sunlight−0.9060.060
Relative humidity0.4220.055
Surface temperature2.3070.100
Table 2. Statistical analysis of main period scales of meteorological elements.
Meteorological ElementsMain Period/a
Air temperature23, 12, 8
Precipitation22, 12, 8
Evaporation22, 13, 8
Sunlight22, 12, 8
Relative humidity23, 13, 8
Surface temperature23, 12, 7
Table 3. MK test results for yields of different crops.
CropMK StatisticsResults
RiceZ-value1.796
p-value0.335
SoybeanZ-value0.739
p-value0.144
CornZ-value2.257
p-value0.277
Table 4. Ranking of multi-year grey relational degree between meteorological elements and different crops.
Meteorological ElementsRiceRankingSoybeanRankingCornRanking
Air temperature0.81910.82110.8291
Precipitation0.76030.81420.8172
Evaporation0.70140.76530.6384
Sunlight0.81220.63740.7773
Relative humidity0.67450.62660.6236
Surface temperature0.67160.63450.6345
Table 5. Statistical table of PCA eigenvalues and variance contribution ratios for meteorological elements.
FactorEigenvalueExtraction of Principal Components
After Rotation
EigenvalueVariance
Explanation Ratio %
Cumulative %EigenvalueVariance
Explanation Ratio %
Cumulative %
12.17136.17836.178215.07035.84535.845
21.72028.65964.837173.95328.99264.837
30.89314.88579.722
40.63510.58590.307
50.3335.55195.858
60.2484.142100
Table 6. Matrix of principal component scores for meteorological elements.
FactorFactor1Factor2
Air temperature−0.4050.411
Precipitation0.3890.451
Evaporation−0.1410.010
Sunlight0.2560.206
Relative humidity0.0520.148
Surface temperature0.0440.132
Disclaimer/Publisher’s Note: The statements, opinions and data contained in all publications are solely those of the individual author(s) and contributor(s) and not of MDPI and/or the editor(s). MDPI and/or the editor(s) disclaim responsibility for any injury to people or property resulting from any ideas, methods, instructions or products referred to in the content.