Article

Exploring NDVI Responses to Regional Climate Change by Leveraging Interpretable Machine Learning: A Case Study of Chengdu City in Southwest China

1
Chongzhou Meteorological Bureau, Chongzhou 611230, China
2
Sichuan Mt. Emei Forest Ecosystem National Observation and Research Station, Forest Ecology and Conservation in the Upper Reaches of the Yangtze River Key Laboratory of Sichuan Province, College of Forestry, Sichuan Agricultural University, Chengdu 611130, China
3
Chengdu Meteorological Bureau, Chengdu 610072, China
4
College of Soil and Water Conservation, Southwest Forestry University, Kunming 650224, China
5
Yunnan Meteorological Observatory, Kunming 650034, China
*
Authors to whom correspondence should be addressed.
Atmosphere 2025, 16(8), 974; https://doi.org/10.3390/atmos16080974 (registering DOI)
Submission received: 16 July 2025 / Revised: 12 August 2025 / Accepted: 14 August 2025 / Published: 17 August 2025
(This article belongs to the Special Issue Vegetation–Atmosphere Interactions in a Changing Climate)

Abstract

Regional extreme climate change remains a major environmental issue of global concern. However, in the context of the joint effects of urban expansion and the urban ecological environment, the responses of the normalized difference vegetation index (NDVI) to regional climate change and its driving mechanism remain unclear. This study takes Chengdu as an example, selects the air temperature (Ta), precipitation (P), wind speed (WS), and soil water content (SWC) within the period from 2001 to 2023 as influencing factors, and uses Theil-Sen median trend analysis and interpretable machine learning models (random forest (RF), BP neural network, support vector machine (SVM), and extreme gradient boosting (XG-Boost) models). The average absolute value of Shapley additive explanations (SHAPs) is adopted as an indicator to explore the key mechanism driving regional climate change in Chengdu in terms of NDVI changes. The analysis results reveal that the NDVI exhibited an extremely significant increasing trend during the study period (p = 8.6 × 10⁻⁶ < 0.001), and that precipitation showed a significant increasing trend (p = 1.2 × 10⁻⁴ < 0.001); however, the air temperature, wind speed, and soil-relative volumetric water content all showed insignificant increasing trends. A simulation of interpretable machine learning models revealed that the random forest (RF) model performed exceptionally well in terms of simulating the dynamics of the urban NDVI (R2 = 0.746), indicating that the RF model has an excellent ability to capture the complex ecological interactions of a city without prior assumptions. The dependence relationship between the simulation results and the main driving factors indicates that the Ta and P are the main factors affecting the NDVI changes. In contrast, the SWC and WS had relatively small influences on the NDVI changes. The prediction analysis results reveal that a monthly average temperature of 25 °C and a monthly average precipitation of approximately 130 mm are conducive to the stability of the NDVI in the study area. This study provides a reference for exploring the responses of NDVI changes to regional climate change in the context of urban expansion and urban ecological construction.

1. Introduction

Climate change, especially extreme regional climate change, remains a major environmental issue of global concern. Affected by both human activities and natural factors, regional climates are undergoing uncertain changes in single or multiple combinations, causing various environmental problems [1]. Vegetation is the main body of terrestrial ecosystems and a “barometer” of global ecological changes, playing a crucial role in the study of these changes. It not only has the characteristics of a wide distribution and renewability, but also serves as a natural barrier for ecological security. Plants are highly sensitive to climate and environmental changes, are among the core elements for improving the ecological environment, and can be regarded as indicators of ecosystem responses to climate change [2]. Continuous drought and high temperatures, as well as extreme and torrential rains, will lead to the degradation and even death of increasing amounts of forest vegetation, severely affecting the stable functioning of forest ecosystems [3]. Therefore, a thorough exploration of the interrelationships between vegetation dynamics and meteorological factors is crucial for comprehending the interactions between ecosystems and the climate.
With the rapid advancement of multisource remote sensing technology, the normalized difference vegetation index (NDVI) has become one of the most widely utilized parameters for characterizing vegetation coverage [4]. It not only effectively reflects the extent of vegetation cover but also indicates the growth vigour and biomass of vegetation. Numerous scholars have employed NDVI data to investigate temporal trends in regional vegetation coverage and their correlations with climatic factors. Zhu et al. [5] applied Geodetector to disentangle the contributions of natural and anthropogenic factors to NDVI variations in the middle reaches of the Heihe River Basin, and their study revealed that the NDVI across the study area significantly increased from 2000 to 2015. Gong et al. [6] explored mesoscale NDVI prediction models in arid and semiarid regions of China under changing environments and reported that the impact of climate change on vegetation has distinct spatiotemporal characteristics and that the influences differ depending on the month and location. Vegetation has greened in most arid and semiarid areas of China during the historical periods. In addition, Zhou et al. [7] reported that both natural and anthropogenic factors were identified as significant driving forces of NDVI changes, and that the land use conversion type, mean annual precipitation, and soil type had the greatest influence. Therefore, the NDVI is advantageous due to its universality and accessibility in vegetation research, with climatic factors serving as the primary driving forces influencing vegetation dynamics.
Furthermore, with the continuous advancement in research theories and ongoing innovations in statistical methodologies, an increasing number of scholars have recently established linear relationships and periodic characteristics between climate variables and vegetation changes using techniques such as cross wavelets, wavelet coherence, and linear regression [8]. However, these traditional methods often struggle to address the multicollinearity among variables, thereby limiting their ability to accurately interpret complex interactions. Recent studies have indicated that machine learning algorithms such as the random forest (RF), back propagation neural network (BPNN), support vector machine (SVM), and extreme gradient boosting (XG-Boost) algorithms demonstrate superior performance in terms of handling large-scale datasets, reducing the risk of overfitting, and accommodating categorical features. When integrated with interpretable machine learning frameworks such as Shapley additive explanations (SHAPs), these models enable a deeper understanding of the internal mechanisms that drive prediction outcomes, thus offering more robust support for climate change forecasting and management. Mohammadi et al. [9] used the NARX neural network model to simulate the quality and quantity parameters for the Ghezel Ozan River of northwestern Iran and quantified the impact of climate change on the surface water, which is highly important. Li et al. [10] estimated the forest-realized potential carbon density/storage (RPCD/RPCS) in China through the use of a time-varying Boruta SHAP random forest (TBSRF) model. Wang et al. [11] adopted the random forest (RF) approach to identify vegetation greening, which was prominent in 85.90% of the study area; however, 5.59% of the area still experienced significant vegetation degradation, and population pressure was an important factor in altering the signs of long-term vegetation trends. Thakur et al. [12] proposed a framework to increase the reliability of global climate model simulations, supporting robust regional-scale hydrological modelling and climate change impact assessments by employing an extreme gradient boosting algorithm. Coskun and Akbas [13] revealed the future complexity of urban water scarcity and drought via a support vector machine in the semiarid Bursa urban area. Machine learning provides an extremely effective analytical method for investigating how forest vegetation responds to climate change across various temporal scales.
In recent years, research on vegetation cover changes and their driving mechanisms across different temporal and spatial scales has gradually increased. Studies have shown that in most regions worldwide, vegetation continues to exhibit a gradual greening trend, with temperature and precipitation identified as the primary climatic factors that influence vegetation growth [14]. Research has indicated that in areas receiving less than 2000 mm/year of precipitation, changes in vegetation coverage are predominantly controlled by precipitation levels [15]. On the regional scale, the combined effects of precipitation and temperature on vegetation dynamics are more significant than the individual effects of either factor alone [16]. Against the backdrop of global climate change, the rate of temperature increase in China notably surpassed the global average during the same period. The frequency and intensity of extreme weather events have also increased, exerting considerable impacts on forest ecosystems and posing challenges to the sustainable development of forestry ecology. Between 1988 and 2018, human activities accounted for more than 70% of the increase in vegetation cover across China; however, prior to 2000, vegetation cover changes in southern China were driven primarily by climate change [17]. In recent years, scholars have reported that, against the backdrop of global climate change, the combined effects of drought and high temperatures in southern China, such as Sichuan, Jiangxi, Chongqing, and Yunnan, have become increasingly pronounced [18]. Furthermore, more drought events [19] and disproportionate increases in floods [20] have occurred across various administrative regions and prefecture-level cities (counties), and some other mountainous areas have experienced landslides [21], mudslides [22], and even minor earthquakes [23]. In contrast, less attention has been given to ecosystems on the regional scale. However, terrestrial ecosystem responses to global climate change are scale-dependent and influenced by global-scale spatial asynchrony. Therefore, the conclusions of global-scale studies may not be applicable on the regional scale, and may even contradict the regional reality. Therefore, understanding the relationships between regional climate characteristics and vegetation patterns can provide a scientific foundation for addressing regional climate change and environmental degradation. However, the current research on quantitatively assessing the impact of regional climate change on vegetation remains limited and requires further in-depth investigations.
Chengdu is located in the Sichuan Basin and has unique geographical features, including its geographical location, climate type, urbanization process, agricultural activities, and water resource distribution. In addition, the climate of Chengdu is a humid subtropical climate with distinct seasons and abundant rainfall, and it also faces environmental changes caused by urbanization, which makes it an ideal case study area for studying the changes in the NDVI and their responses to climate change. Therefore, Chengdu City in Sichuan Province, Southwest China, is selected in this study as the case study area.
In view of this, we utilize climate variables (precipitation and air temperature), vegetation data (NDVI), and soil moisture information (relative soil moisture content) from Chengdu City from 2001 to 2023 as the primary data sources. By combining trend estimation with interpretable machine learning models (i.e., random forest (RF), BP neural network, support vector machine (SVM), and extreme gradient boosting (XG-Boost) models), the aims are to (1) analyze the changes exhibited by the P, Ta, WS, and NDVI in the region; (2) explore suitable machine learning models for simulating NDVI changes against the background of regional climate change; and (3) quantify the main environmental factors driving the changes in the regional NDVI and determine the appropriate climate conditions on the basis of the dependency of the simulation results on the main driving factors. This study provides a reference for implementing vegetation management against the background of regional climate change.

2. Materials and Methods

2.1. Study Area

Chengdu is the capital city of Sichuan Province and an important economic city in southwestern China (Figure 1). It is located on the western edge of the Sichuan Basin (East Longitude 102°54′104°53′, North Latitude 30°05′31°26′), with a total area of 14,335 km2. The average altitude is 500 m. Within the city, plains, hills, and mountains account for 40.1%, 27.6%, and 32.3% of the city area, respectively. The unique “two mountains surrounding the city” terrain (Longmen Mountain and Longquan Mountain) has formed a distinctive microclimate environment. The area has a subtropical monsoon climate, with an average annual temperature of 16–18 °C and an annual precipitation level of 1000–1300 mm. Cloudy and foggy weather and less sunlight are prominent characteristics of this area. Chengdu has three mountain systems: a western mountainous area, an eastern hilly area, and a suburban green island. The forest area of the western Longmen Mountain system accounts for 55% of the city’s total forest area, and the forest stock volume accounts for 70% of the total. The ecological core area refers to Longquan Mountain City Forest Park, with a forest coverage rate exceeding 75%, a mixed forest system consisting of low mountains and hills, a carbon storage level of 264.89 million tons, and an annual carbon sequestration rate of over 70 t·ha−2. Suburban large urban parks, which are green urban forest islands, refer to the large urban parks in the suburbs, forming a “tropical rainforest-like” urban green lung, releasing an average of 19.88 tons of oxygen each day.

2.2. Data and Preprocessing

This study utilizes five data types: rainfall, temperature, normalized difference vegetation index (NDVI), soil moisture, and wind speed data. The rainfall, temperature, and NDVI data covering the Qinghai-Tibet Plateau (2001–2023) were acquired from the Qinghai-Tibet Plateau Data Center (https://data.tpdc.ac.cn). Specifically, China’s 1 km-resolution monthly precipitation dataset (1901–2023) in NETCDF (.nc) format is used as the precipitation data. China’s 1 km-resolution monthly mean temperature dataset (1901–2023) in NETCDF format is used as the temperature data. Both datasets are processed using Python.
This study characterizes the soil moisture and wind speed in the study area. The MODIS product is adopted for this study. The spatial resolution of the soil moisture and wind speed data is 250 m, and the data start in 2001 and continue to the present. The temporal resolution is 16 days. The data were downloaded from the National Aeronautics and Space Administration (NASA, https://ladsweb.modaps.eosdis.nasa.gov/, accessed on 15 May 2025). Preprocessing tasks such as radiation correction, geometric correction, image stitching, projection conversion, and resampling are performed on the downloaded MODIS data (from 2001 to 2023) to ensure accurate data. Additionally, IDL programming is used to smooth the original time series of vegetation index data; remove outliers; and reduce the influences of clouds, the atmosphere, and the solar altitude angle, etc.

2.3. Statistical Analysis

2.3.1. Analysis of Time Series Distribution Characteristics

This study employs Theil-Sen median trend analysis to study the change trends of vegetation indices (NDVI) and climate factors (Ta, P, WS, and SWC) on a monthly and annual basis (Formula (1)). A slope > 0 indicates an upwards trend in the dataset over the time series, whereas a slope < 0 indicates a downwards trend [24]. The Mann-Kendall statistical test is used to conduct significance tests on the change trends at the 0.05 level [25].
θ z = Median z j z i j i ,   2001     i   <   j     2023
where θZ represents the slope of the change in a factor; Median is the median function; i and j are two years in the time series, with values ranging from 2001 to 2023; and Zi and Zj are the annual maximum values of the factors corresponding to the i-th and j-th years, respectively. By integrating the results of θZ and the Mann-Kendall significance test, six scenarios can be obtained: an extremely significant increase (θZ > 0, p < 0.01), a significant increase (θZ > 0, 0.01 ≤ p < 0.05), a nonsignificant increase (θZ > 0, p ≥ 0.05), an extremely significant decrease (θZ < 0, p < 0.01), a significant decrease (θZ < 0, 0.01 ≤ p < 0.05), and a nonsignificant decrease (θZ < 0, p ≥ 0.05).

2.3.2. Time Autocorrelation Test

This study employs the Durbin-Watson test for time autocorrelation to analyze the relationship between the NDVI and Ta, SWC, P, and WS, and through multiple linear stepwise regression, Formula (2) is obtained.
NDVI = 0.163 + 0.00962   ×   Ta + 0.005658   ×   SWC + 0.0002   ×   P
The model’s verification parameters are presented in Table 1. As indicated in Table 1, the DW value is 1.8, which is close to 2, suggesting that the temporal autocorrelation of the NDVI with respect to Ta, SWC, P, and WS is relatively weak.

2.3.3. Interpretable Machine Learning

The machine learning algorithms used in this study include the random forest (RF), BP neural network, support vector machine (SVM), and extreme gradient boosting (XG-Boost) algorithms. In this study, all four machine learning algorithm analysis processes are completed via the scikit-learn package (version 1.5.1) in Python 3.12.7.
A grid search is a systematic hyperparameter optimization method that is used in machine learning scenarios. It achieves a global model performance exploration by constructing a full combination search grid on the multidimensional parameter space. Specifically, we employed 10-fold cross-validation for model building, utilized GridSearch for parameter optimization, and then applied the Optuna package (version 1.4.0) for hyperparameter tuning.
(1)
Random Forest (RF)
Random forests (RFs) are widely used in classification and regression tasks. The core principles of an RF include the bagging method and feature randomness. The bagging method randomly selects multiple sample subsets from the training dataset with replacements, and each subset is used to train a decision tree. This random sampling approach reduces the variance of the model and improves its generalizability. Additionally, during the process of building each decision tree, the random forest dynamically selects a preset proportion of attribute subsets from the original feature set as the splitting candidate set. This feature randomness further increases the diversity of the trees, enabling the random forest to better handle high-dimensional data.
First, the training dataset, which usually consists of multiple feature variables and a continuous target variable, is prepared. Second, bootstrap sampling is used to form multiple sample subsets from the training dataset. Then, a decision tree model is built for each sample subset. During the process of building the decision tree, a portion of the feature variables are randomly selected as candidate features each time a node is split, and the optimal splitting point among these features is selected [11]. By calculating indicators such as the mean squared error (MSE) of the splitting point, the optimal splitting point can be selected to divide the data into two child nodes. This process is repeated until the preset maximum depth of the tree or the minimum number of nodes is reached. Each decision tree predicts the input feature variables and outputs a regression value. Finally, the average value of the regression results of all decision trees is taken as the predicted value of the dependent variable.
(2)
BP Neural Network
Backpropagation (BP) neural networks have strong nonlinear modelling capabilities in regression tasks [9]. They calculate the predicted value through forwards propagation, adjust the network parameters through backpropagation to minimize the induced prediction error, and ultimately fit continuous variables precisely. The structure of the BP neural network consists of an input layer, a hidden layer, and an output layer. The neurons between adjacent layers are connected in a fully interconnected manner, and they are interconnected through the weights generated by the system. However, the neurons within each layer do not affect each other. The number of nodes contained in the input layer corresponds to the feature dimensionality; the number of nodes in the hidden layer must be determined through experiments or cross-validation. Commonly, nonlinear functions (such as the Sigmoid, Tanh, and ReLU functions) are introduced to enhance the nonlinear mapping ability of the model and strengthen its ability to express complex data relationships; in regression tasks, the output layer typically uses a single node (single output) or multiple nodes (consistent with the target dimensionality; multi-output), and a linear function is selected as the activation function (such as the identity function) to directly output continuous values.
(3)
Support Vector Machine (SVM)
Support vector machines (SVMs) have gradually become widely applied in the fields of function regression and prediction [26]. They are founded on the VC dimension theory and the principle of minimizing structural risk. An SVM constructs a hyperplane that separates the data points of different classes and simultaneously maximizes the distance between this hyperplane and the nearest data points. Mathematically, this can be expressed as a quadratic optimization problem, with the objective of minimizing the norm of the weight vector while satisfying certain constraints.
(4)
Extreme Gradient Boosting (XG-Boost)
Extreme gradient boosting (XG-Boost) is a machine learning algorithm based on a decision tree ensemble [13]. It provides high-precision predictions through the gradient boosting framework and optimizes the computational efficiency and generalizability of the developed model. It iteratively generates weak learners (decision trees), gradually corrects the prediction residuals of the previous model, and finally forms a strong learner in the form of a weighted combination.
(5)
Model accuracy evaluation
To assess the accuracies of the fitted models, the coefficient of determination (R2) is calculated via Formula (3):
R 2 = 1 i = 1 N ( y o i y c i ) 2 i = 1 N ( y o i y o i ¯ ) 2
where N is the number of samples and yoi, and yci are the observed and predicted values at the ith grid, respectively. And y o i ¯ is the average value of the observed values. R2 ranges from zero to one, and R2 = 1 means that the predicted value perfectly captures the observations.
In addition, the mean absolute error (MAE), root mean square error (RMSE), and mean absolute percentage error (MAPE) are calculated via Formulas (4)–(6).
MAE = 1 N i = 1 N y o i y c i
RMSE = 1 N i = 1 N ( y o i y c i ) 2
MAPE = 1 N i = 1 N y o i y c i y o i × 100 %

2.3.4. Determination and Prediction of the Dominant Climate Factors

(1)
SHAP analysis
Machine learning has shown great potential in regression prediction tasks, but its “black box” characteristic also poses model interpretation challenges. The SHAP method originates from game theory and is used to quantify the contribution of each input variable to the predictions of a model, thereby conducting a quantitative attribution analysis of the prediction results [12]. The SHAP method has excellent interpretability in terms of both global and local perspectives, consistency guarantee, prediction decomposition, and handling interaction effects. In contrast, permutation only performs well in global interpretation, and LIME only excels in local interpretation. Therefore, this study utilizes the SHAP method, which is based on SHAP values, to reflect the influences of all variables in each simulated sample on the NDVI.
(2)
Contribution analysis
The contributions of different characteristics to the prediction results are analyzed on the basis of the additive principle of SHAP values [27]. By calculating the marginal contribution of each feature in all possible combinations and taking the weighted average, the contribution of each feature to the prediction results is fairly allocated. The SHAP framework, which is based on SHAP values, converts the feature contribution into an additive attribution method. The interpretability of the machine learning-based NDVI simulation is investigated from two perspectives: the contribution degrees of the main environmental driving factors to the simulation results and the dependency relationships between the simulation results and the main driving factors.

3. Results

3.1. Vegetation Variations in the Time Series

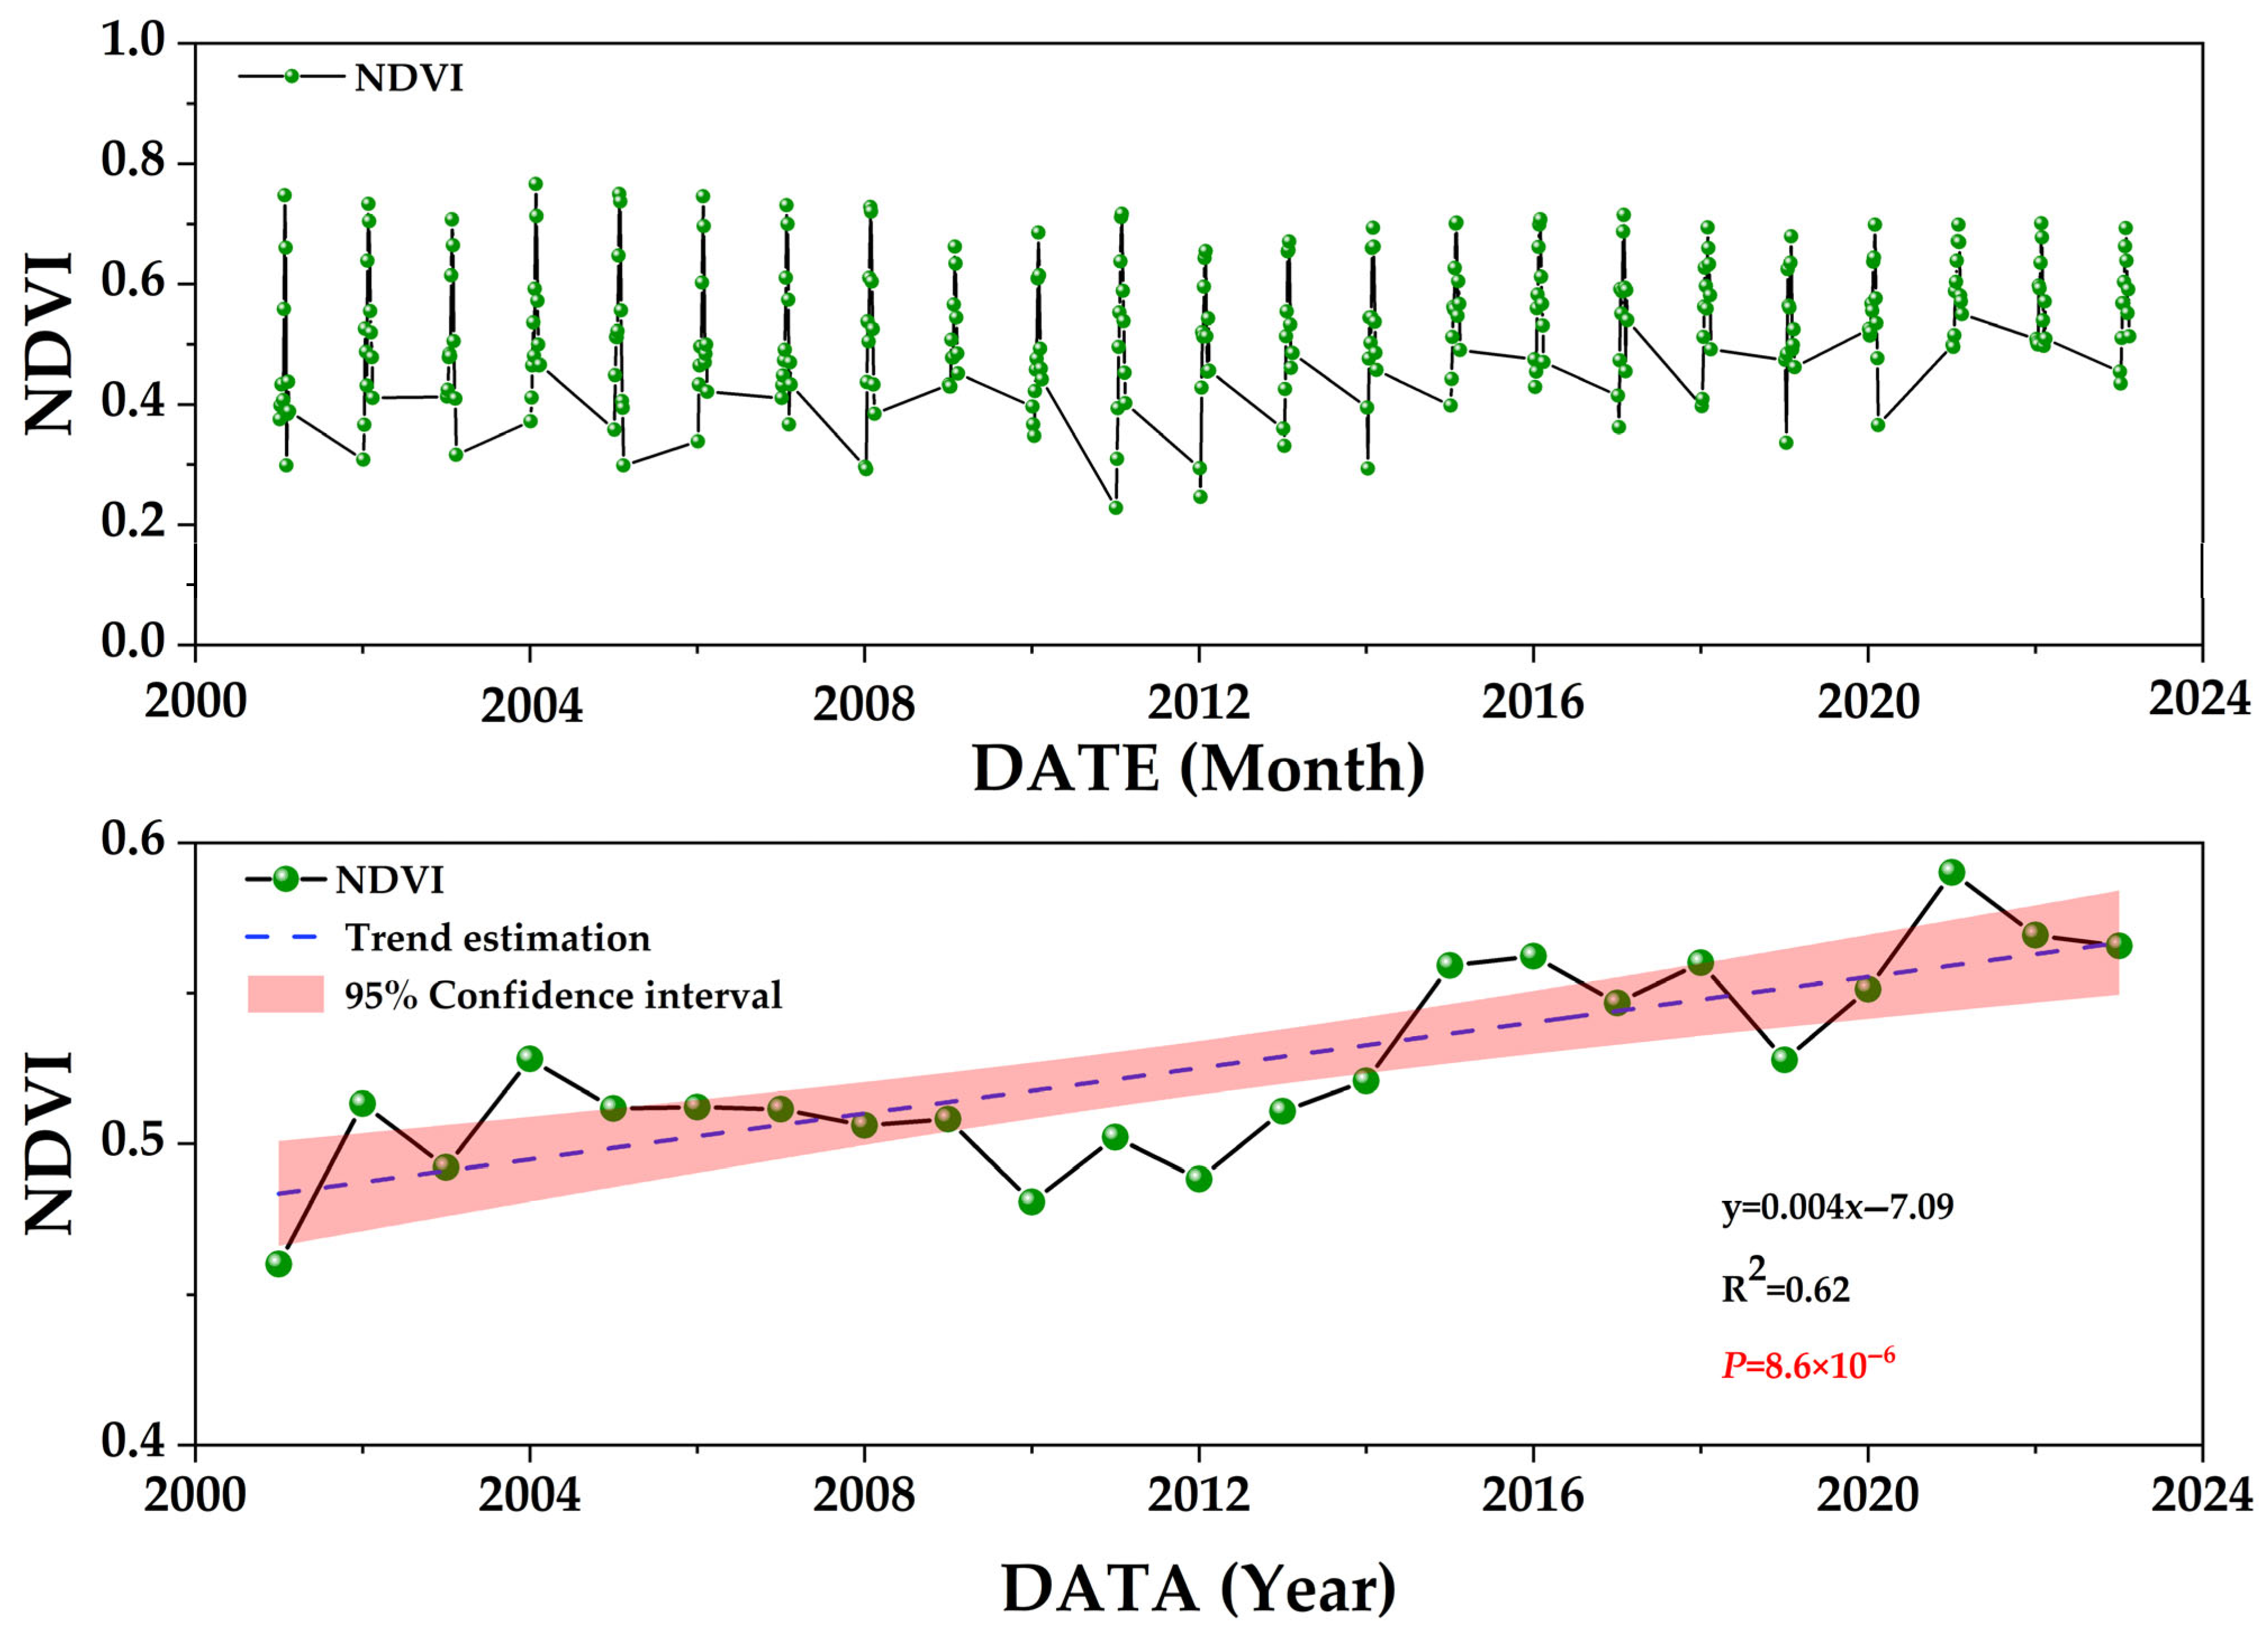
From 2001 to 2023, the analysis results of the NDVI variation revealed that the maximum monthly NDVI was 0.77, the minimum value was 0.23, and the average NDVI was 0.53 ± 0.001. The coefficient of variation of the NDVI within a year was 20.82%. The skewness of the NDVI at the monthly scale was −0.009, and the kurtosis was −0.47. Overall, the metric exhibited regular variation characteristics, with an increasing trend followed by a decreasing trend throughout the year. The peak period was between June and August, with the corresponding NDVI ranging from 0.7 to 0.8. Additionally, the NDVI was between 0.5 and 0.6 from April to May and from September to October, whereas it was between 0.3 and 0.5 from November to March of the following year, which was in line with the phenological responses of vegetation growth and natural law, which states that the rainy seasons promote vegetation growth. The trend analysis conducted on the interannual scale indicated that the annual average NDVI in Chengdu showed a highly significant increasing trend (p = 8.6 × 10⁻⁶ < 0.001) during the study period, with a growth rate of 0.004 per year(Figure 2).

3.2. Variations in the Environmental Factors in the Time Series

3.2.1. Precipitation

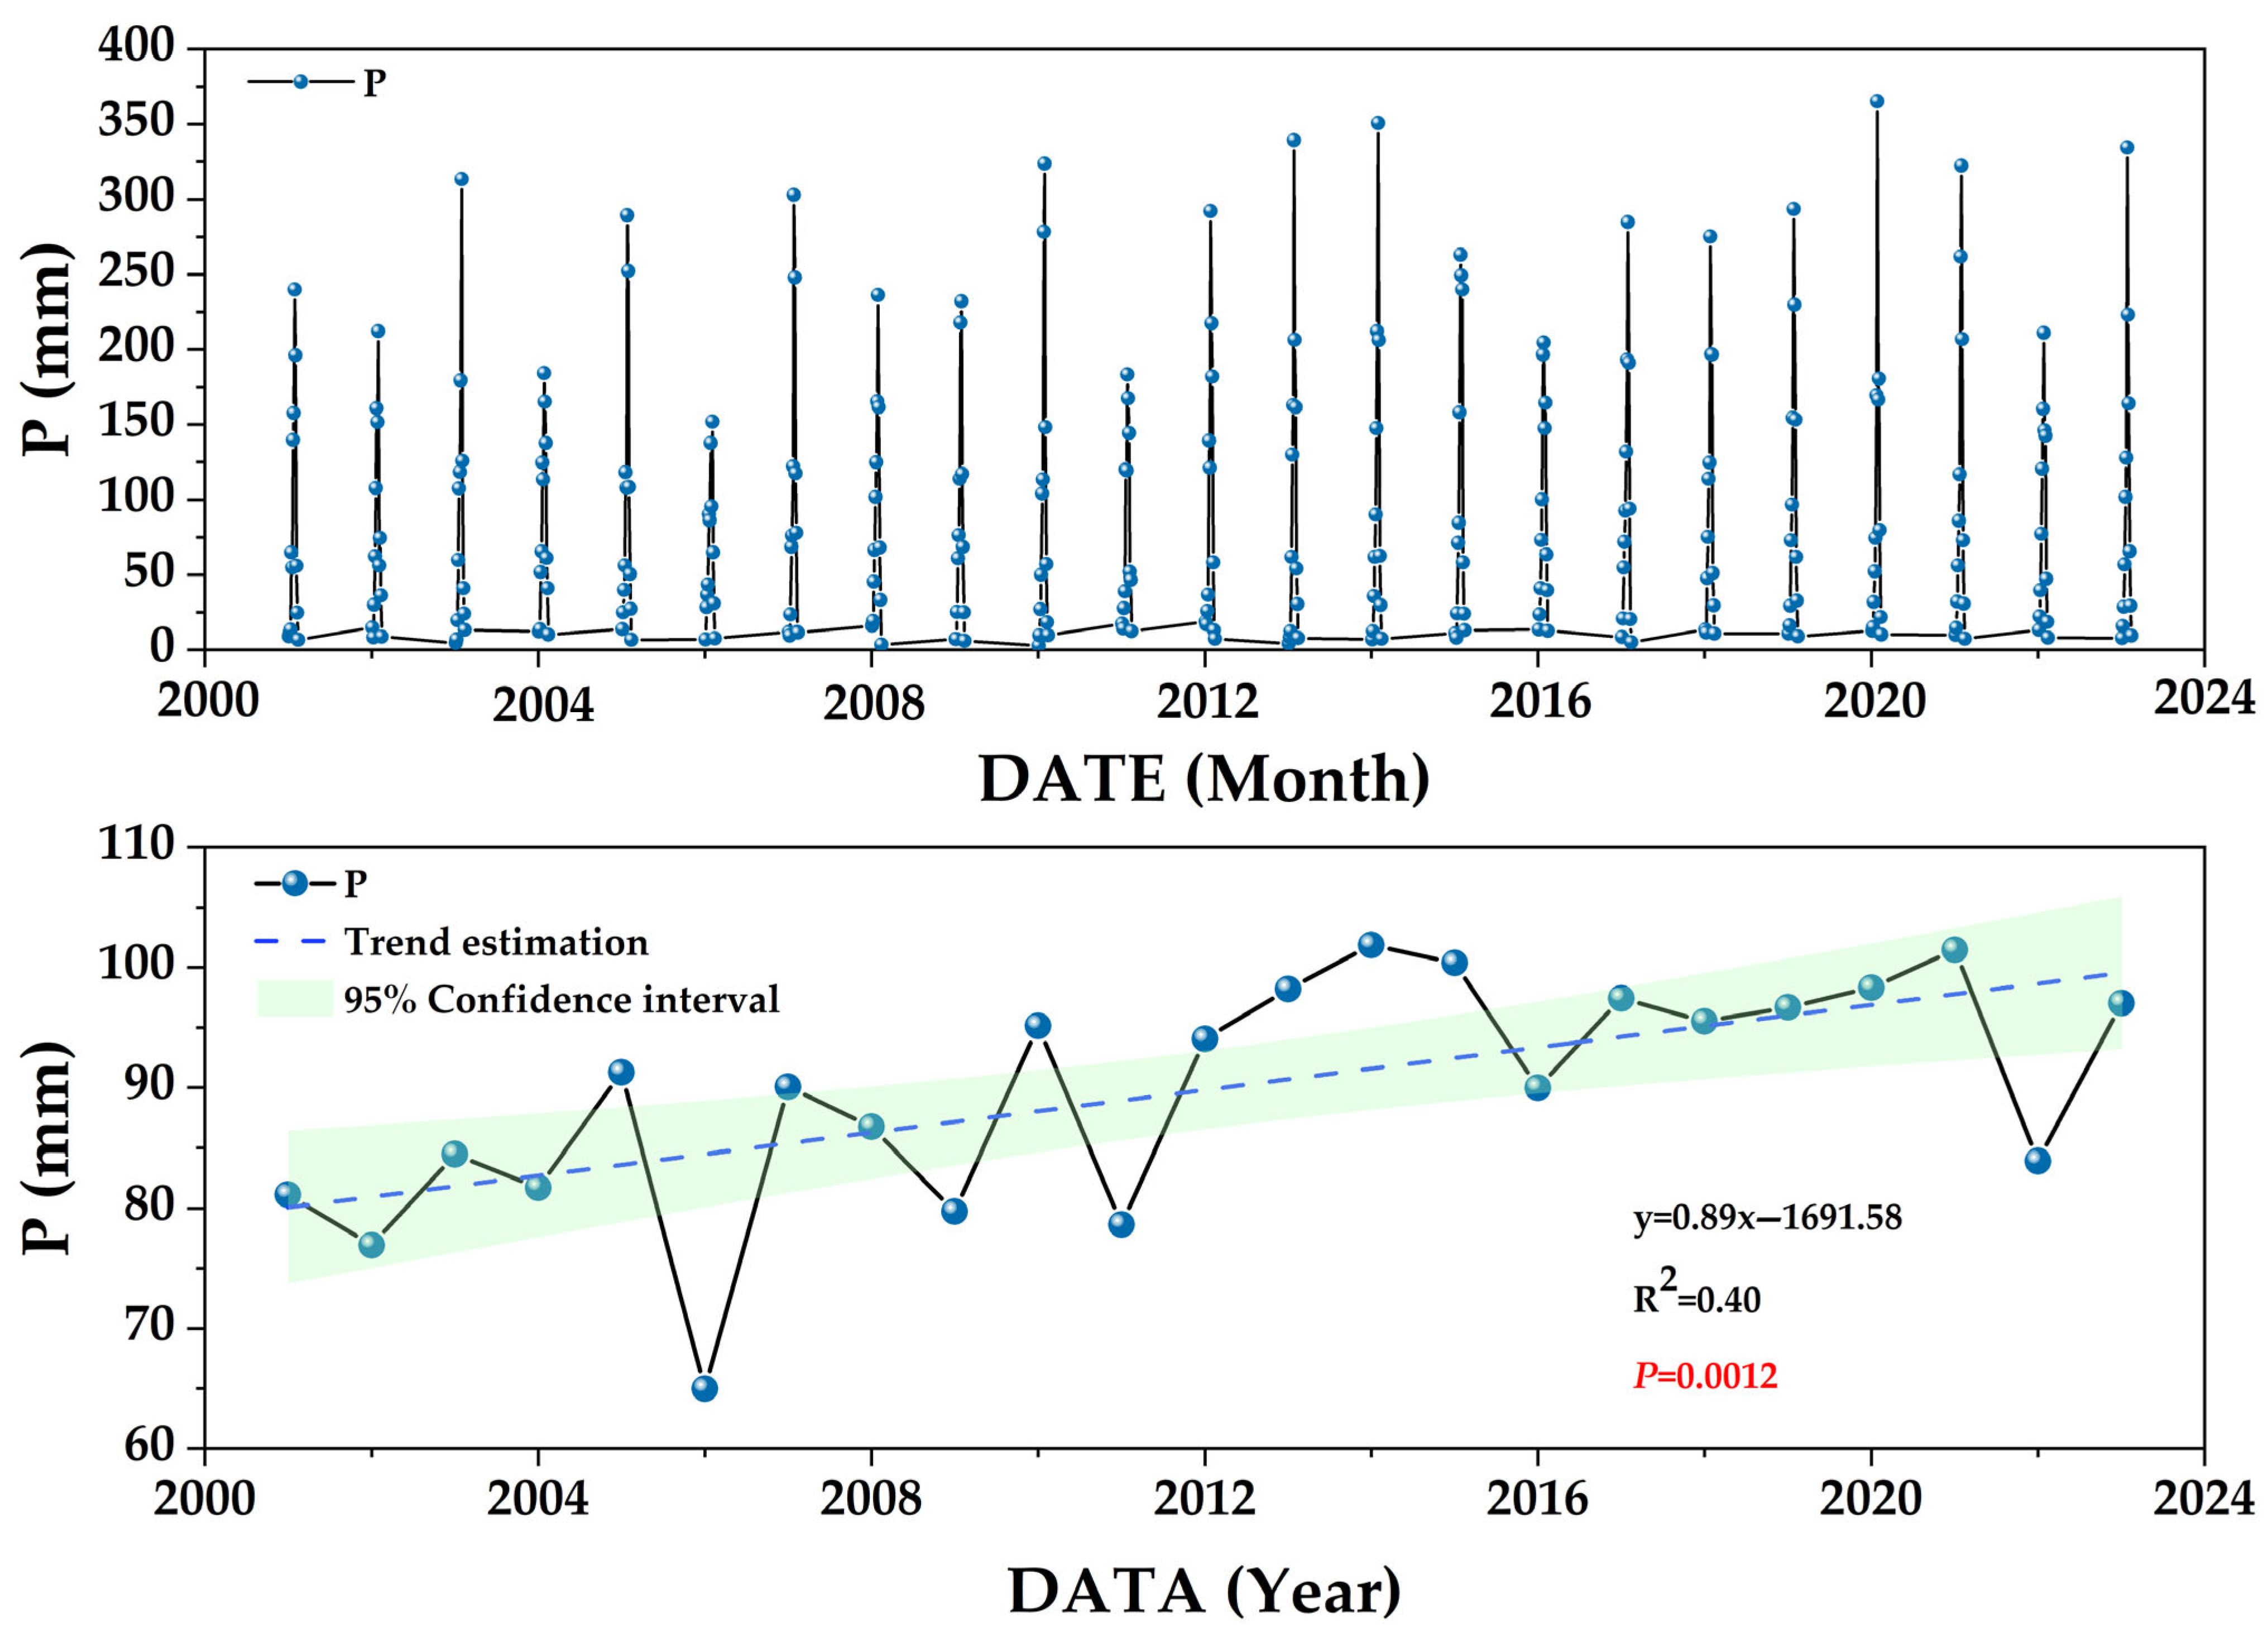
The annual and monthly precipitation (P) variations from 2001 to 2023 are shown in Figure 3. The analysis results indicate that the maximum monthly average precipitation was 365.08 mm, the minimum monthly average precipitation was 2.69 mm, the average precipitation was 89.81 ± 5.11 mm, the coefficient of variation of the annual precipitation was 95.46%, the skewness of the monthly precipitation was 1.14, and the kurtosis was 0.58. Overall, a regular pattern of change was observed. The rainy season is concentrated from June to September or May to August (monthly average precipitation values exceeding 100 mm), but as shown by the very stable pattern, the maximum precipitation in Chengdu occurs in August each year (mostly exceeding 200 mm, and in some years, it exceeds 300 mm). The monthly average precipitation from April to May (in some years) and from November to December was between 10 and 100 mm, and the average precipitation from January to March was less than 10 mm. On the interannual scale, the trend analysis results revealed that the annual average precipitation in Chengdu exhibited an extremely significant upwards trend (p = 1.2 × 10⁻⁴ < 0.001), with a rate of increase of 0.89 mm per year, which is approximately equal to 1 mm.

3.2.2. Air Temperature

The variations in temperature (Ta) across different months and years from 2001 to 2023 are shown in Figure 4. The results of the monthly analysis revealed that the maximum monthly average air temperature across the year was 26.56 °C, the minimum temperature was 3.60 °C, the average air temperature was 16.14 ± 0.41 °C, the coefficient of variation of the annual air temperature was 44.13%, the skewness of the monthly air temperature was −0.16, and the kurtosis was −1.34. The overall pattern exhibited regular variations. The summer is hot, with the highest temperatures concentrated from June to September (monthly average temperature exceeding 20 °C but less than 30 °C). The average monthly air temperature from March to May and from October to November is between 10 °C and 20 °C. The remaining months, January to February and December, have monthly average air temperatures ranging from 0 °C to 10 °C. From an interannual perspective, the trend analysis results indicate that the annual average temperature in Chengdu has a nonsignificant upwards trend (p = 0.10 < 0.05), with a warming rate of 0.01 °C per year.

3.2.3. Wind Speed

The variations in the wind speed (WS) from 2001 to 2023 on the annual and monthly scales are shown in Figure 5. The analysis of the wind speed time series indicates that the maximum monthly average wind speed was 0.88 m/s, the minimum monthly average wind speed was 0.03 m/s, and the monthly average wind speed was 0.45 m/s. The coefficient of variation of the average wind speed was 38.99%, the skewness of the monthly precipitation was −0.22, and the kurtosis was −0.49. Overall, a regular pattern of change was observed. The wind speed reaches its maximum in autumn (exceeding 0.7 m/s) and its minimum in summer (below 0.3 m/s) throughout the year, resulting in concurrent precipitation and heat, which is a typical weather type. The trend analysis conducted on the interannual scale revealed that the annual average wind speed in Chengdu has a nonsignificant upwards trend (p = 0.62 > 0.05).

3.2.4. Soil Volumetric Water Content

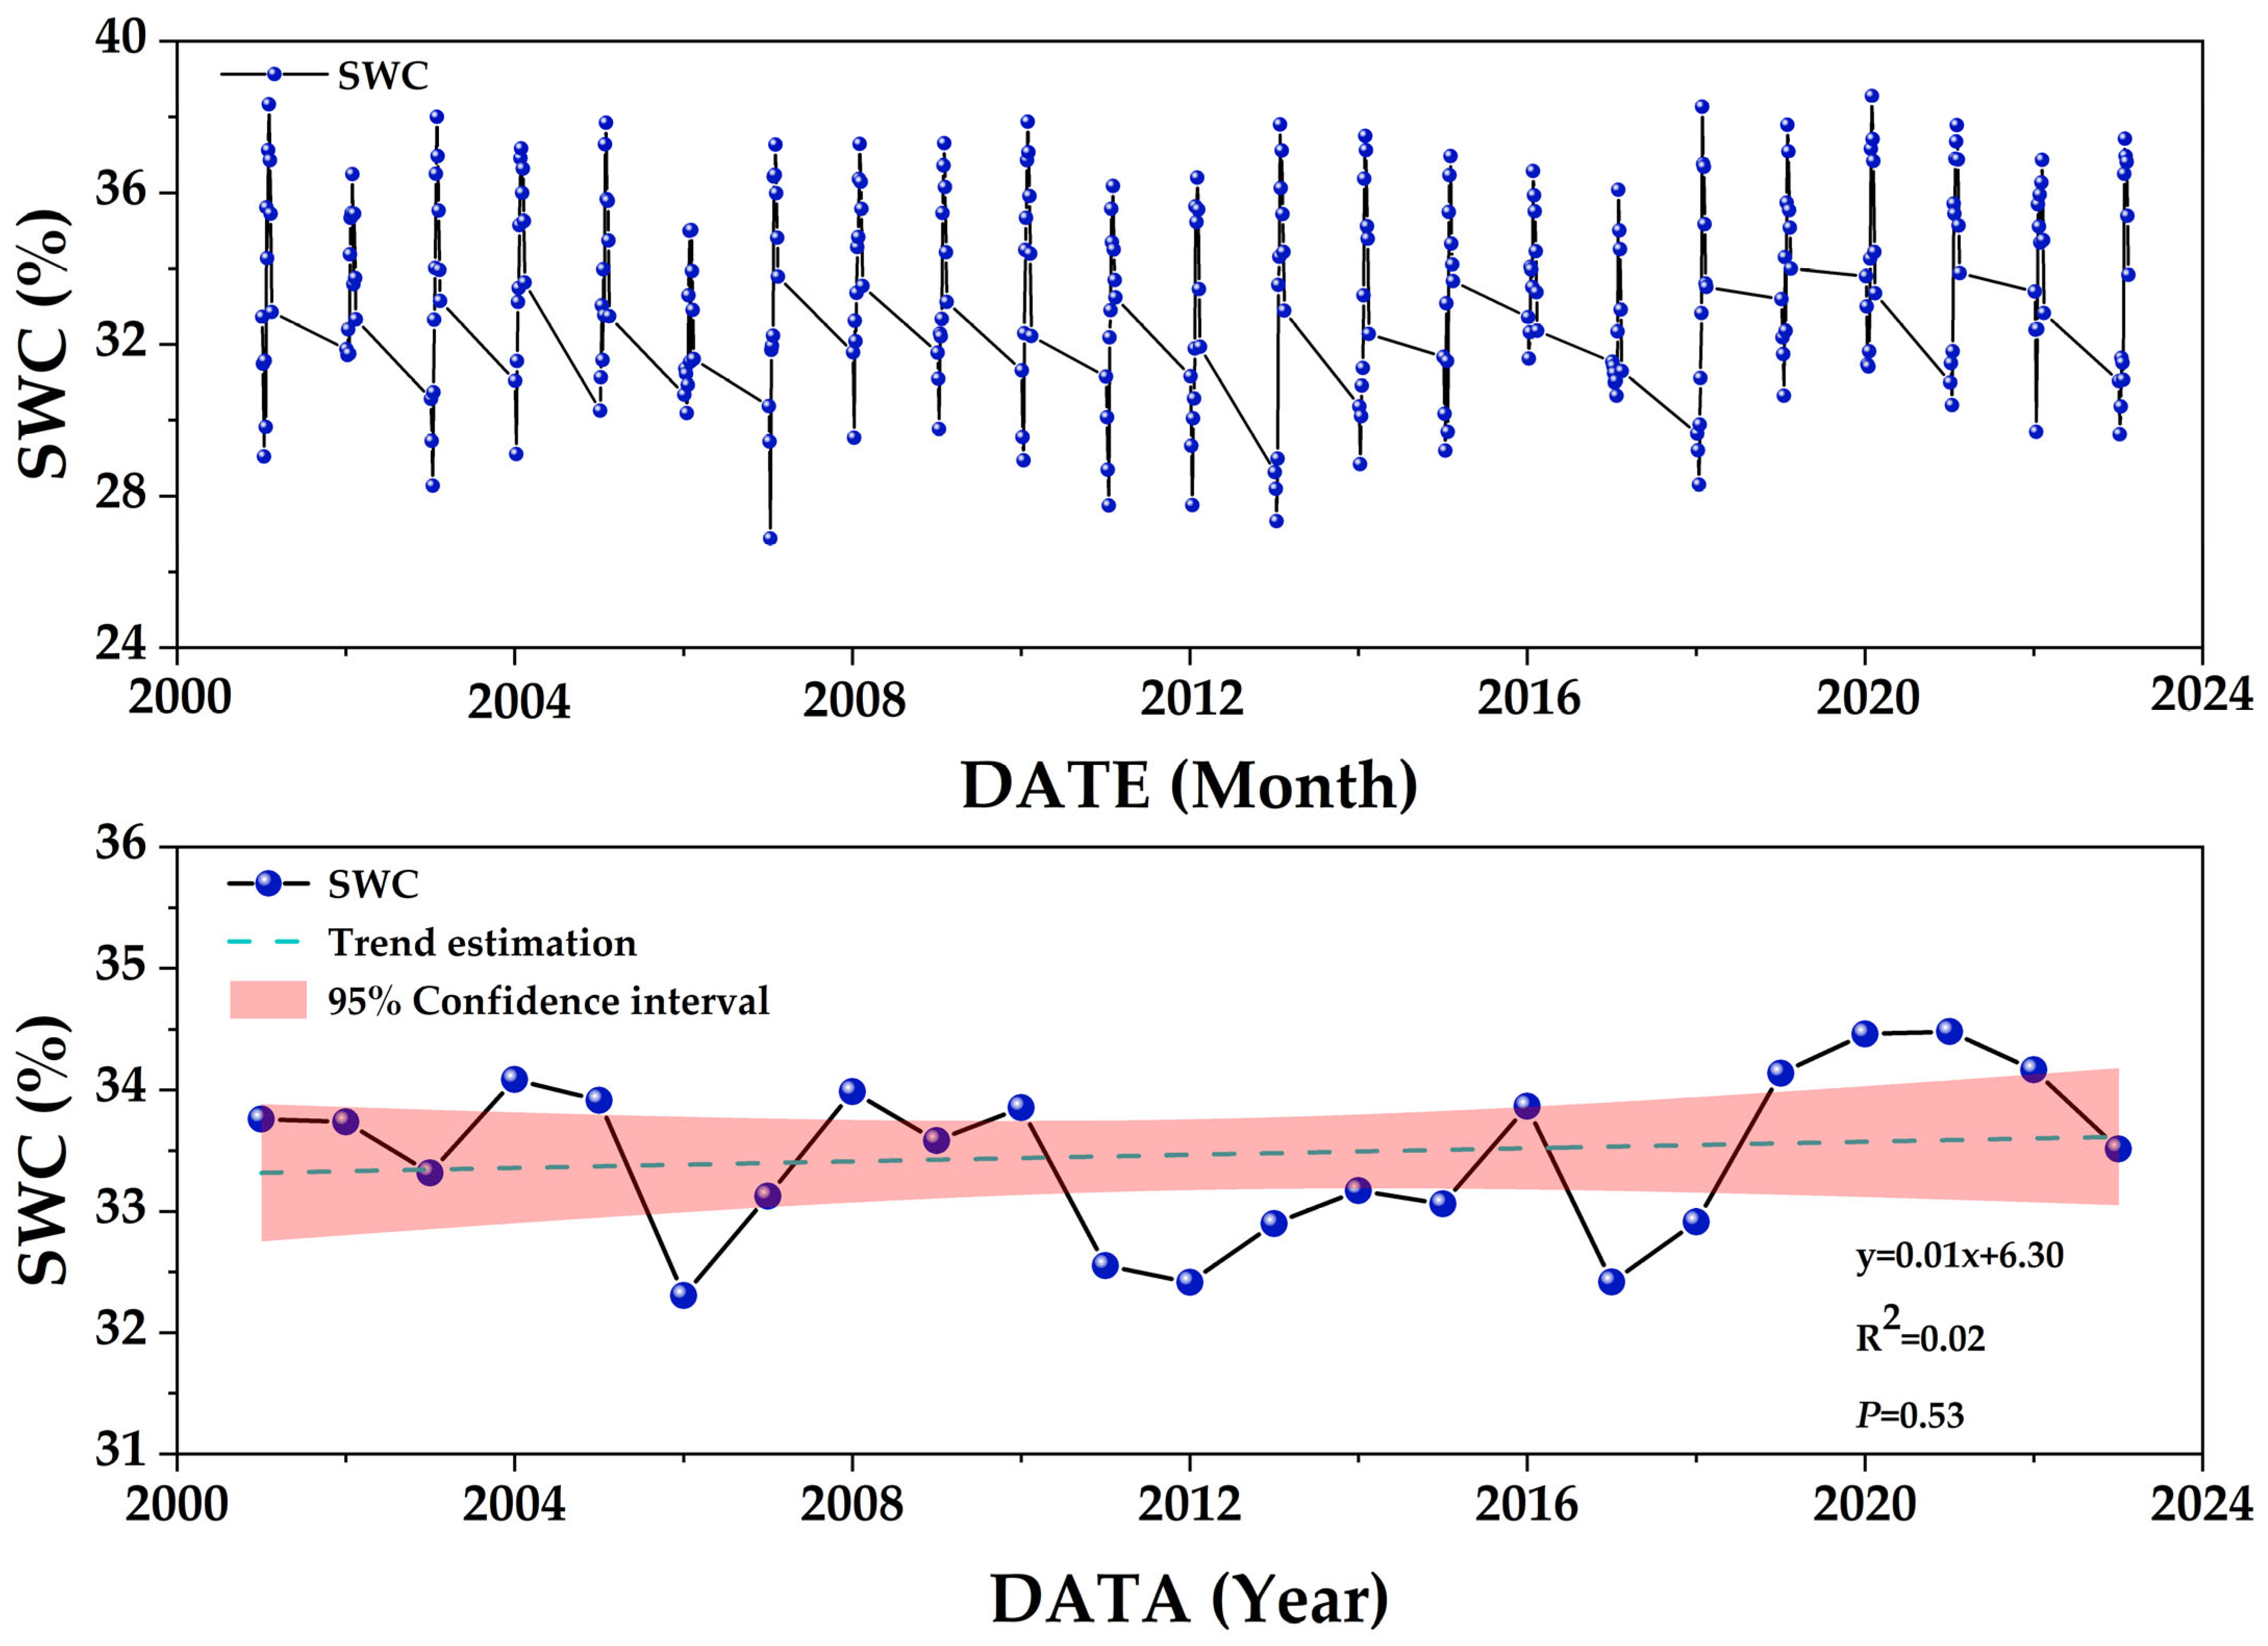
An analysis of the results (Figure 6) revealed that the soil volumetric water content ranged from 30% to 40% during the period from 2001 to 2023. The maximum monthly average soil volumetric water content was 38.55%, the minimum average was 26.88%, and the average was 33.47%. The coefficient of variation of the soil volumetric water content was 7.69%. The skewness of the soil volumetric water content on the monthly scale was −0.15 and the kurtosis was −0.82. Overall, regular characteristics of change were observed. Specifically, from June to December, the soil volumetric water content was greater than 35%, ranging from 35% to 40%. From February to March, it was less than 30%, ranging from 25% to 30%. In April and May, it was between 30% and 35%, which was in line with the response of the soil moisture content to precipitation. The trend analysis conducted for the soil volumetric water content on the interannual scale indicated that during the study period, the annual average soil volumetric water content in Chengdu showed a nonsignificant upwards trend (p = 0.53 > 0.05).

3.3. Responses of Environmental Factors to Vegetation and Predictions on the Basis of Interpretable Machine Learning

3.3.1. Evaluation of the Simulation Accuracies of Different Machine Learning Models

A comparative analysis of the NDVI simulation effects of different models (RF, XGB, BP, and SVM) in Chengdu revealed that the random forest (RF) model demonstrated the best overall performance (Table 2). The coefficient of determination (R2 = 0.746) of this model on the test set was significantly greater than those of the other models, and the root mean square error (RMSE = 0.746) and mean absolute error (MAE = 0.047) were both lower than those of the other models. This finding indicates that the RF model can more accurately capture the dynamic changes exhibited by the NDVI.
Additionally, the learning effect of the RF machine learning model on the NDVI is shown in Figure 7, and the predicted values and actual values fit well. For the training model, the R2, MAE, MSE, RMSE, and MAPE were 0.775, 0.03, 0.003, 0.051, and 8.40%, respectively. For the test model, the R2, MAE, MSE, RMSE, and MAPE were 0.746, 0.03, 0.003, 0.059, and 9.80%, respectively. The R2 values of the two models explained approximately 77.5% and 74.6% of the variability in the NDVI, and the degree of model fit was very good. Moreover, the MAE, RMSE, and MSE were all low (close to 0) and mutually corroborated, all indicating high precision. The influences of environmental factors on the changes in the NDVI can be further analyzed through the RF model.

3.3.2. Influences of Environmental Factors on the Changes in the NDVI

This study employed the average absolute SHAP (SHapley additive exPlanation) values to quantify the contributions of the key driving factors to the simulation outcomes. As illustrated in Figure 8, there is a discernible variation in the importance rankings of these variables. Specifically, the Ta (temperature) has the greatest mean SHAP effect, followed by the P (precipitation), whereas the soil water content (SWC) and wind speed (WS) have lower contributions. This suggests that the Ta is the predominant factor influencing NDVI (normalized difference vegetation index) variability, with the P also exerting a considerable influence. In comparison, the impacts of the SWC and WS on NDVI changes are relatively minor.
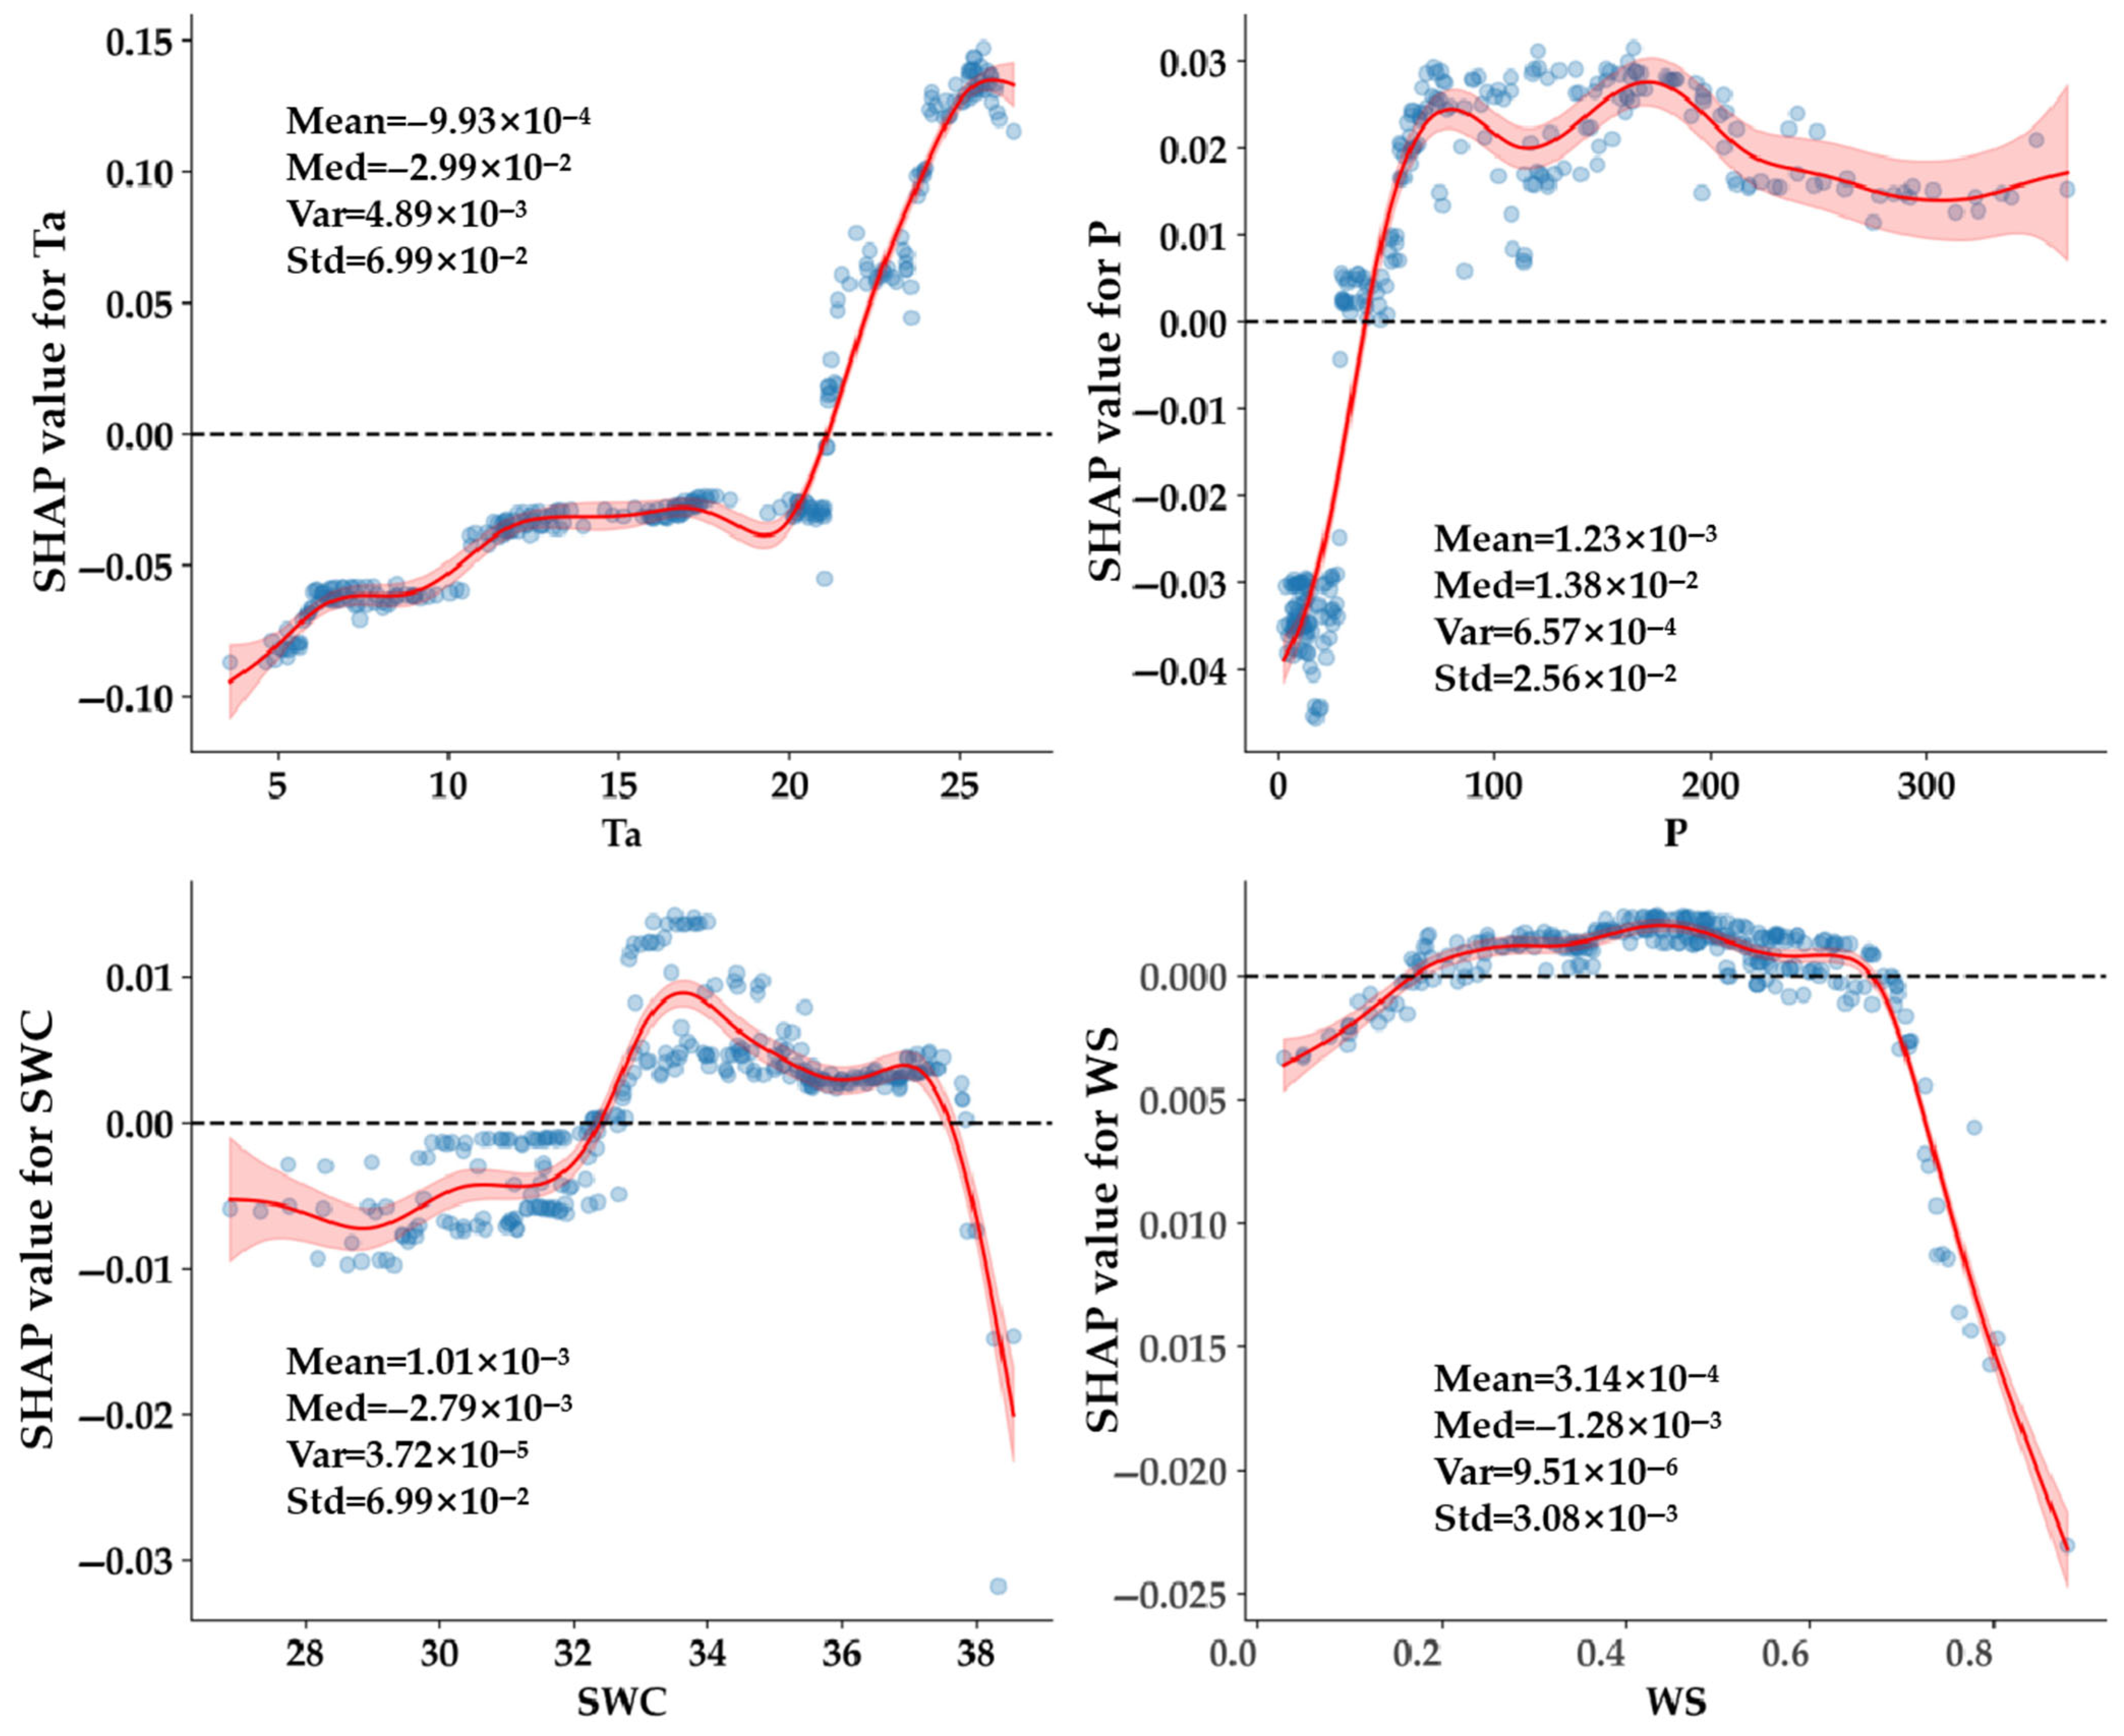
By analyzing the process by which the SHAP values vary with the corresponding values of the main driving factors, the threshold effects of the influencing factors can be interpreted. The analysis results show that the NDVI and temperature factors present a monotonically increasing nonlinear dependency, the NDVI and precipitation present a monotonically increasing dependency and then an unstable nonlinear dependency, the NDVI and soil volumetric water content present a nonmonotonic exponential increase and then a monotonically decreasing dependency, and the NDVI and wind speed present a nonmonotonic logarithmic increase and then a monotonically decreasing dependency. When 21.14 °C < Ta < 25.68 °C, the corresponding SHAP values are all positive, indicating that the monthly average temperature at this time promotes the growth and development of vegetation, especially when the Ta is 25 °C, which is conducive to the stability of the NDVI in a better state. When the Ta < 21.14 °C, the corresponding SHAP values are all negative, indicating that the monthly average temperature at this time inhibits the growth and development of vegetation. When 29.33 mm < p < 365.08 mm, the corresponding SHAP values are all positive, indicating that the monthly average precipitation in this interval promotes the growth and development of vegetation.

4. Discussion

4.1. Climate-Driven Mechanisms of NDVI Changes

In terms of time, the research results revealed that the NDVI in Chengdu significantly increased from 2001 to 2023, with an increase of 0.004 per year (Figure 2). The vegetation status in Chengdu as a whole is improving, which is consistent with the literature [28]. On the one hand, key ecological projects such as returning farmland to forest and grassland, soil and water conservation, and urban and rural greening were promoted in the Sichuan-Chongqing region [29,30,31]. On the other hand, Chengdu has received preferential treatment from national policies such as ecological protection [32]. In addition, owing to the climate types and variations in Chengdu, which are conducive to the integrated development of agriculture and forestry, the vegetation in this area has been restored and improved [33]. The abovementioned factors are positive contributions of national policies to the increase in the NDVI in Chengdu (i.e., human activities). The intricate relationship between climate factors and NDVI dynamics in Chengdu reveals a multifaceted interplay governed by seasonal and interannual climate variability. The influences of environmental factors on the changes in the NDVI in Chengdu can be analyzed from the following perspectives in this study.
First, there was a significant upwards trend in annual precipitation (0.89 mm·year, p = 0.00012 < 0.001) (Figure 3). Researchers have reported that precipitation serves as a primary driver of vegetation growth, directly influencing the availability of soil moisture and photosynthetic activity [34]. This finding aligns with the latest research results, and the analysis indicates that water availability limits the NDVI in subtropical regions, where precipitation seasonality dictates plant phenology [35]. For example, a study in the Sichuan Basin demonstrated that the increase in precipitation was related to the increase in the NDVI, which was attributed to the increase in canopy greenness and the leaf area index [36]. Some studies have noted that precipitation is closely related to the type and amount of vegetation [37]. In addition, our research revealed that the average annual precipitation has a significant effect on the NDVI. With increasing precipitation, vegetation coverage tends to increase, further confirming that water availability is a limiting factor. Previous research has shown that the interannual variations exhibited by the NDVImax of grassland vegetation on the Qinghai-Xizang Plateau are controlled mainly by precipitation [38,39], which is similar to the results of the research conducted in this paper.
Second, the nonsignificant warming trend (0.01 °C/year, p = 0.10 > 0.05) interacts with precipitation to modulate vegetation phenology (Figure 4). In our study, the optimal temperature window (21.14–25.68 °C) identified via the SHAP analysis coincides with the peak growing season (June–August) (Figure 9). Reports indicate that thermal thresholds increase enzyme activity and photosynthetic rates. In addition to thermal thresholds, heat stress disrupts chlorophyll stability [40]. Research on the Chengdu heatwave, where the relationship between heatwaves and the NDVI is complex, revealed that heatwave metrics increased in NDVI classes 1–2 (0.11–0.37) and fluctuated across classes 3–15 (0.42–0.759) before declining beyond class 15. This variation was attributed to the differential cooling effects of various land cover types, including forests, grasslands, and croplands [41]. This dual control mechanism explains why temperature explained more of the variance in the NDVI (Figure 8). The interaction between the Ta and P is critical, as modelled by the partial dependence plots of the RF model, which reveal relatively high NDVIs when both factors are within optimal ranges (Figure 8). Some studies have noted that the interaction between the average annual precipitation and the average annual temperature significantly enhances the influence of precipitation on the NDVI of vegetation [42]. Due to the increases in evaporation and transpiration caused by climate warming, the accurate coupling of precipitation and temperature plays an important role in regulating vegetation growth [43]. This further confirms that the vegetation in temperate areas is restricted by water and heat conditions. Such synergies underscore the need for multivariate climate analyses in vegetation studies.
Third, this study detected a seasonal mismatch between the wind speed (0.03–0.88 m/s) and the peak NDVI (Figure 5), possibly resulting from a biophysical control layer. Increased wind speeds in autumn (>0.7 m/s) accelerate canopy drying, reducing the amount of leaf water compared to under calm conditions [44]. Conversely, low wind speeds in summer (<0.3 m/s) create humid microclimates that favour C4 species, for example, Neosino calamus affinis, in Chengdu [45]. While the wind speed explained less of the variance in the NDVI, its modulating effect on evapotranspiration created indirect feedback loops with soil moisture dynamics.
Fourth, the interplay between the soil volumetric water content (SWC) and vegetation dynamics reveals complex hydroecological feedback, which also explains the changes in the NDVI in Chengdu. A temporal dynamics analysis revealed a significant relationship between the monthly SWC and NDVI during the growing season (April–October), suggesting that soil moisture was the primary factor limiting vegetation productivity in our research (Figure 2 and Figure 6). The seasonal coincidence of the peak SWC (35–40%) in June–December with the maximum NDVI (0.7–0.8) in June–August demonstrated a 1–2-month lag, which is consistent with soil infiltration patterns and root–zone water uptake mechanisms where subsurface moisture reserves sustain mid-summer vegetation growth [46,47]. This phenomenon aligns with findings in subtropical monsoon regions, where soil water recharge during premonsoon periods (April–May) buffers against early summer drought stress [48].
Interestingly, the nonsignificant increase in the SWC (0.12%/year, p = 0.53) contrasts with the highly significant increase in the NDVI (0.004/year, p < 0.001), implying compensatory effects from climate change components. Researchers have reported that elevated atmospheric CO2 concentrations may increase water-use efficiency, allowing vegetation to maintain its productivity under relatively stable soil moisture conditions [49]. The decoupling of SWC–NDVI trends could also reflect land management interventions, as urban greening programmes in Chengdu have increased irrigated vegetation coverage by 22% since 2010 [50]. The negative NDVI anomalies from November to March (0.3–0.5) correspond to the SWC minima (25–30%), indicating that winter drought is constrained by evergreen vegetation [51]. These seasonal dynamics underscore the need for multiscale hydrological modelling studies that integrate soil–plant–atmosphere continuum processes.

4.2. Predicting the Effectiveness of NDVI Changes on the Basis of Explainable Machine Learning

The analysis results (Table 2 and Figure 7) indicate that the simulation results of the four machine learning models show the superior performance of the random forest (RF) model in terms of simulating NDVI dynamics (R2 = 0.746), which emphasizes the ability of the RF model to capture complex ecological interactions without prior assumptions. When some scholars explored the city of Durgapur in West Bengal, India, which also has a subtropical monsoon climate, they used three machine learning algorithms, namely, an ANN, an SVM, and an RF, to predict the future evolution of LST; comparisons of their accuracy and applicability revealed that the RF model performed best and was suitable for predicting changes in the urban thermal environment [52]. Accordingly, this study first identified the main drivers of the NDVI through random forest importance rankings and further conducted a SHAP analysis of the optimal model to reveal the specific impacts of the main drivers on the NDVI.
The analysis results (Figure 8) of the random forest machine learning model in this study show that the Ta is the most important driving factor. Its importance score and variable feature ranking are much greater than those of other environmental factors, and it makes the greatest contribution to the SHAP mean. This result is highly consistent with that of Chen et al. [53]. Other studies on the spatiotemporal variation characteristics of the NDVI and its driving factors have also revealed that the Ta has a major influence on the NDVI [54]. Second is the P, although the corresponding SWC and WS are relatively small. These findings indicate that the Ta is the main driving factor affecting changes in the NDVI and that the P has a greater impact on NDVI changes, whereas the influences of the SWC and WS on the NDVI changes are relatively small. Reports from other scholars further confirm our research results [55]. Relevant studies have shown that warming in spring determines the green-up period of vegetation, whereas cooling in autumn triggers deciduous dormancy, and frost or high-temperature heat waves can directly damage leaf tissues [11]. Other factors are regional differences and scale effects, as well as the interference and intensification of human activities [56]. The latest report provides support by exploring the above- and belowground phenology responses of subtropical Chinese fir (Cunninghamia lanceolata) to soil warming, precipitation exclusion, and their interaction, and stand structural diversity and fine root morphological plasticity synergistically enhance soil’s hydrological effects in Cupressus funebris plantations [57,58].
In addition, the results of the random forest machine learning model analysis in this study revealed that the impact of precipitation on the NDVI is not as great as that of the air temperature, which is consistent with previous research [59]. The influence mechanism can be analyzed from the following perspectives. First, photosynthesis is more sensitive to temperature, whereas precipitation indirectly affects the water absorption efficiency of the root system through soil moisture, with a longer chain of action and a saturation threshold [60]. An increase in nighttime temperature increases the amount of organic matter consumed via dark respiration and reduces the net primary productivity, whereas precipitation has no direct regulatory effect on respiration [61]. Overall, precipitation has a weaker impact on the NDVI than the air temperature due to its indirectness, regional limitations, and hysteresis, whereas temperature becomes a more efficient driver of the NDVI by directly regulating physiological processes and phenological rhythms. The latest research has reported on the effects of soil water and heat conditions on the hydrological effects of cypress in Sichuan, providing support for the viewpoints of this study [46,58]. In the future, it is necessary to combine multiscale models (such as FvCB coupled with climate prediction) to quantify the risk of changes in the NDVIs of different ecosystems under the warming threshold.
The SHAP framework of this study reveals the threshold effects of the Ta, P, SWC, and WS on the NDVI (Figure 9). Overall, a monthly average temperature of 25 °C and monthly average precipitation that is stable at approximately 130 mm are most conducive to the stability of the NDVI in this study area, and similar studies were reported by Li et al. [44]. In contrast, the SHAP values of the SWC and WS are more dispersed; that is, the SWC and WS have relatively small impacts on the NDVI changes observed in the study area. However, both excessively high or low SWC and WS values have reducing effects on the NDVI, which is not conducive to vegetation growth. By prioritizing the Ta and P in the feature importance rankings, the model aligns with ecological niche theory, where energy (temperature) and water (precipitation) are primary resources, and this conclusion confirms some previous research [62].

5. Conclusions

The conclusions of this study include three main aspects. First, the trend analysis conducted on the interannual scale indicated that the annual average NDVI showed a highly significant upwards trend and that the P showed a significant upwards trend in Chengdu during the study period, whereas the Ta, WS, and SWC presented nonsignificant upwards trends. Second, a comparative analysis of the NDVI simulation effects of different models (RF, XGB, BP, and SVM) in Chengdu revealed that the RF model demonstrated the best overall performance, and that this model could more accurately capture the dynamic changes in the NDVI. Third, the Ta is the predominant factor influencing NDVI variability, with the P also exerting a considerable influence. In comparison, the impacts of the SWC and WS on the NDVI changes are relatively minor. In addition, a monthly average temperature of 25 °C and monthly average precipitation that is stable at approximately 130 mm are most conducive to the stability of the NDVI in the study area.

Author Contributions

Conceptualization, Y.X., G.H. and Z.Y.; Data curation, J.L. (Junjie Li), Y.Z., J.L. (Jie Lu), F.N. and H.Y.; Formal analysis, Y.X., G.H., J.L. (Junjie Li), Y.Z., J.L. (Jie Lu), Z.Y., F.N. and H.Y.; Funding acquisition, G.H.; Methodology, Y.X.; Project administration, G.H.; Resources, G.H.; Software, Y.X.; Validation, G.H. and Z.Y.; Visualization, Y.X. and Z.Y.; Writing—original draft, Y.X.; Writing—review and editing, Y.X., G.H. and Z.Y. All authors have read and agreed to the published version of the manuscript.

Funding

This research was funded by the Natural Science Foundation of Sichuan Province (No.2023NSFSC1165), Free exploration project of the dual support plan for discipline construction of Sichuan Agricultural University (2024ZYTS014), and Innovation Training Program (S202310626093). The APC was funded by the Natural Science Foundation of Sichuan Province (No.2023NSFSC1165).

Institutional Review Board Statement

Not applicable.

Informed Consent Statement

Not applicable.

Data Availability Statement

The original contributions presented in this study are included in the article. Further inquiries can be directed to the corresponding author.

Acknowledgments

We would like to thank the anonymous reviewers, editor, and associate editor for the thorough assessment of this paper and for many valuable and helpful suggestions.

Conflicts of Interest

The authors declare no conflicts of interest.

References

  1. Das, S.; Kamruzzaman, M.; Md, A.R.; Islam, T. Assessment of characteristic changes of regional estimation of extreme rainfall under climate change: A case study in a tropical monsoon region with the climate projections from CMIP6 model. J. Hydrol. 2022, 610, 128002. [Google Scholar] [CrossRef]
  2. Kang, J.M.; Zhang, Q.; Zhang, B.L.; Hu, Y.M.; Zhang, C.Y.; Li, C.L. Dual impacts of urban expansion on the carbon sequestration capacity of urban vegetation: A multi-scale global study. Ecol. Indic. 2025, 176, 113746. [Google Scholar] [CrossRef]
  3. Qi, G.Z.; Song, J.X.; Chen, S.Z.; Gong, Y.F.; Bai, H.Y.; She, D.X.; Xia, J.; Fu, Y.S.H. Increasing impacts of compound extreme droughts on vegetation productivity in China. J. Hydrol. 2025, 660, 133447. [Google Scholar] [CrossRef]
  4. Yan, M.L.; Lu, J.Y.; Ma, Y.Y.; Ma, C. A remote sensing evidence on the marginality, stagementation and spatiotemporal heterogeneity of vegetation evolution characteristics in the Yinshan Mountains, China: Based on PKU GIMMS NDVI (1984–2022). Ecol. Indic. 2025, 171, 113193. [Google Scholar] [CrossRef]
  5. Zhu, L.J.; Meng, J.J.; Zhu, L.K. Applying Geodetector to disentangle the contributions of natural and anthropogenic factors to NDVI variations in the middle reaches of the Heihe River Basin. Ecol. Indic. 2020, 117, 106545. [Google Scholar] [CrossRef]
  6. Gong, X.L.; Du, S.P.; Li, F.Y.; Ding, Y.B. Study of mesoscale NDVI prediction models in arid and semiarid regions of China under changing environments. Ecol. Indic. 2021, 131, 108198. [Google Scholar] [CrossRef]
  7. Zhou, Z.H.; Jin, J.X.; Yong, B.; Huang, W.D.; Yu, L.; Yang, P.Q.; Sun, D.C. Enhanced NDVI prediction accuracy in complex geographic regions by integrating machine learning and climate data—A case study of Southwest basin. Int. J. Appl. Earth Obs. 2025, 139, 104498. [Google Scholar] [CrossRef]
  8. Hussain, A.; Liu, H.Z.; Cao, J.H.; Yang, H.; Rezaei, A.; Wang, P.; Luo, Q.K.; Zhou, M.X.; Liang, Z. Recent increase in soil moisture levels concerning climate variability in the karst region of southwest China using wavelet coherence and multi-linear regression. Gondwana Res. 2025, 141, 40–54. [Google Scholar] [CrossRef]
  9. Mohammadi, S.; Karimi, S.; Mohammadi, A.A.; Moghanlo, S.; Alavinejad, M.; Saleh, H.N.; Mohammadi, H.; Hashemi, M.N.; Kisi, O. Prediction of climate change on surface water using NARX neural network model: A case study on Ghezel Ozan River, Northwest, Iran. Desalin. Water Treat. 2023, 304, 112–128. [Google Scholar] [CrossRef]
  10. Li, T.; Wu, Y.; Ren, F.; Li, M.Y. Estimation of unrealized forest carbon potential in China using time-varying Boruta-SHAP-random forest model and climate vegetation productivity index. J. Environ. Manage. 2025, 377, 124649. [Google Scholar] [CrossRef]
  11. Wang, Y.Y.; Chen, X.; Gao, M.; Dong, J.Z. The use of random forest to identify climate and human interference on vegetation coverage changes in southwest China. Ecol. Indic. 2022, 144, 109463. [Google Scholar] [CrossRef]
  12. Thakur, C.; Budamala, V.; Kasiviswanathan, K.S.; Teutschbein, C.; Soundharajan, B.S. Extreme gradient and boosting algorithm for improved bias-correction and downscaling of CMIP6 GCM data across Indian river basin. J. Hydrol.-Reg. Stud. 2025, 59, 102443. [Google Scholar] [CrossRef]
  13. Coskun, S.; Akbas, A. Revealing the future complexity of urban water scarcity and drought via support vector machine: Case from semi-arid Bursa urban area. Urban Clim. 2024, 58, 102211. [Google Scholar] [CrossRef]
  14. Bai, X.L.; Zhang, Z.W.; Gu, D.Q. Driving mechanism of natural vegetation response to climate change in China from 2001 to 2022. Environ. Res. 2025, 276, 121529. [Google Scholar] [CrossRef] [PubMed]
  15. Zhong, R.; Wang, P.F.; Mao, G.Q.; Chen, A.F.; Liu, J.G. Spatiotemporal variation of enhanced vegetation index in the Amazon Basin and its response to climate change. Phys. Chem. Earth 2021, 123, 103024. [Google Scholar] [CrossRef]
  16. Liu, M.; Zhai, H.L.; Zhang, X.C.; Dong, X.F.; Hu, J.X.; Ma, J.Y.; Sun, W. Time-lag and accumulation responses of vegetation growth to average and extreme precipitation and temperature events in China between 2001 and 2020. Sci. Total Environ. 2024, 945, 174084. [Google Scholar] [CrossRef] [PubMed]
  17. Liu, Y.; Liu, H.H.; Chen, Y.; Gang, C.C.; Shen, Y.F. Quantifying the contributions of climate change and human activities to vegetation dynamic in China based on multiple indices. Sci. Total Environ. 2022, 838, part 4. 1–12. [Google Scholar] [CrossRef]
  18. Xiong, Y.F.; Zhang, A.L.; Liu, M.B.; Zhang, X.; Cheng, Q. Drought risk assessment for citrus and its mitigation resistance under climate change and crop specialization: A case study of southern Jiangxi, China. Agr. Water Manag. 2024, 306, 109195. [Google Scholar] [CrossRef]
  19. Wang, S.P.; Zhang, Q.; Liu, Y.Z.; Yue, P.; Wang, J.S. Effects of global warming on drought onset in China. J. Hydrol. 2024, 632, 130964. [Google Scholar] [CrossRef]
  20. She, Z.Y.; Liu, Z.Y.; Cai, H.Y.; Huang, L.Y.; Lan, X.; Fu, T.W.; Yan, Y. Disproportionate increase of flood-exposed population in Chinese cities under urban expansion and climate variation. Ecol. Indic. 2025, 172, 113314. [Google Scholar] [CrossRef]
  21. Duan, Y.; Ding, M.T.; He, Y.F.; Zheng, H.; Delgado-Téllez, R.; Sokratov, S.; Dourado, F.; Fuchs, S. Global projections of future landslide susceptibility under climate change. Geosci. Front. 2025, 16, 102074. [Google Scholar] [CrossRef]
  22. Donatti, C.I.; Nicholas, K.; Fedele, G.; Delforge, D.; Speybroeck, N.; Moraga, P.; Blatter, J.; Below, R.; Zvoleff, A. Global hotspots of climate-related disasters. Int. J. Disast. Risk Reduct. 2024, 108, 104488. [Google Scholar] [CrossRef]
  23. Ren, Z.K.; Zhao, H.R.; Mu, X.Z.; Shi, K.M.; Jin, X. Characteristics of extreme precipitation and its effects on soil and water retention in Sichuan, China under multiple climate change elements. Ecol. Indic. 2025, 176, 113702. [Google Scholar] [CrossRef]
  24. Helsel, D.R.; Frans, L.M. Regional Kendall test for trend. Environ. Sci. Technol. 2006, 40, 4066–4073. [Google Scholar] [CrossRef]
  25. Wu, L.Z.; Ma, X.f.; Dou, X.; Zhu, J.T.; Zhao, C.Y. Impacts of climate change on vegetation phenology and net primary productivity in arid Central Asia. Sci. Total Environ. 2021, 796, 149055. [Google Scholar] [CrossRef]
  26. Genuer, R.; Poggi, J.; Tuleau, C. Random Forests: Some methodological insights. arXiv 2008, arXiv:0811.3619. [Google Scholar] [CrossRef]
  27. Lundberg, S.M.; Lee, S. A unified approach to interpreting model predictions. Adv. Neural Inf. Process. Syst. 2017, 30, 4768–4777. [Google Scholar]
  28. Islam, M.R.; Najafi, M.R. Machine learning-based regional flood frequency framework for climate resilient infrastructure. J. Hydrol. 2025, 661, 133703. [Google Scholar] [CrossRef]
  29. Bai, Z.Q.; Li, F.Y.; Zhang, S.R.; Li, T.; Wang, G.Y.; Xu, X.X.; Pan, X.N.; Zhong, Q.M.; Zhou, W.; Pu, Y.L.; et al. Shapley additive explanations revealed the effects of climate, topography, anthropogenic activities and geochemical properties on soil cobalt, nickel and vanadium contents. J. Hazard. Mater. 2025, 495, 139070. [Google Scholar] [CrossRef]
  30. Xu, L.; Mao, Q.; Li, C.N.; Tu, B.; Li, X.Z. Natural factors outweigh anthropogenic impact on aquatic phoD-harboring communities along Yangtze River basin. Ecol. Indic. 2025, 170, 112995. [Google Scholar] [CrossRef]
  31. Xiang, Y.Q.; Lyu, Q.; Yang, H.Q.; Yin, B.R.; Tang, Z.R.; Hou, G.R.; Chen, G.; Zhao, K.J.; Chen, Y.Q.; Fan, C.; et al. Stand structure influences understory plant diversity through soil factors: Three afforestation types of Masson’s pine in the upper Yangtze River, China. Front. Plant Sci. 2025, 16, 1513038. [Google Scholar] [CrossRef] [PubMed]
  32. Xu, Y.; Dai, Q.Y.; Lu, Y.G.; Zhao, C.; Huang, W.T.; Xu, M.; Feng, Y.X. Identification of ecologically sensitive zones affected by climate change and anthropogenic activities in Southwest China through a NDVI-based spatial-temporal model. Ecol. Indic. 2024, 158, 111482. [Google Scholar] [CrossRef]
  33. He, Y.H.Z.; Wang, L.; Niu, Z.; Nath, B. Vegetation recovery and recent degradation in different karst landforms of southwest China over the past two decades using GEE satellite archives. Ecol. Inform. 2022, 68, 101555. [Google Scholar] [CrossRef]
  34. Liu, Y.Z.; Yang, R.J.; Sun, M.Y.; Zhang, L.; Li, X.H.; Meng, L.Y.; Wang, Y.Z.; Liu, Q. Regional sustainable development strategy based on the coordination between ecology and economy: A case study of Sichuan Province, China. Ecol. Indic. 2022, 134, 108445. [Google Scholar] [CrossRef]
  35. Tong, X.W.; Wang, K.L.; Yue, Y.M.; Brandt, M.; Liu, B.; Zhang, C.H.; Liao, C.J.; Fensholt, R. Quantifying the effectiveness of ecological restoration projects on long-term vegetation dynamics in the karst regions of Southwest China. Int. J. Appl. Earth Obs. 2017, 54, 105–113. [Google Scholar] [CrossRef]
  36. Yan, W.T.; Su, Y.X.; Zhang, J.; Zhang, C.Q.; Liu, L.Y.; Liu, X.D.; Lafortezza, R. Differentiated influences of atmospheric dryness on urban plant cooling effect between temperate and tropical/subtropical zones. Urban Clim. 2024, 55, 101915. [Google Scholar] [CrossRef]
  37. Xiong, Y.L.; Wang, H.L. Spatial relationships between NDVI and topographic factors at multiple scales in a watershed of the Minjiang River, China. Ecol. Inform. 2022, 69, 101617. [Google Scholar] [CrossRef]
  38. Gao, Y.; Huang, J.; Li, S.; Li, S.C. Spatial pattern of non-stationarity and scale-dependent relationships between NDVI and climatic factors—A case study in Qinghai-Tibet Plateau, China. Ecol. Indic. 2012, 20, 170–176. [Google Scholar] [CrossRef]
  39. Xu, L.; Li, J.B.; Li, C.N.; Kou, Y.P.; Yao, M.J.; Wang, C.T.; Kong, W.D.; Wang, J.M.; Li, X.Z. The distribution of soil alkaline phosphatase (phoD) gene harbouring bacteria across Qinghai-Tibet Plateau. Soil Ecol. Lett. 2025, 7, 240282. [Google Scholar] [CrossRef]
  40. Huang, R.Z.; Yu, H.S.; Yang, Y.; Liu, H.Q.; Wu, X.L.; Liu, Z.H.; He, H.Y.; Wu, G.W.; Wang, W.J.; Wang, H. Effects of heat stress during seed filling stage on brassica napus seed oil accumulation and chlorophyll fluorescence characteristics. Phyton-Int. J. Exp. Bot. 2022, 92, 333–348. [Google Scholar] [CrossRef]
  41. Li, Y.X.; Luo, X.L.; Wang, M.H.; Di, B.F.; Li, Y.B.; Tan, C.P.; Pan, Y.W. Spatiotemporal variations and influencing factors of heatwaves in Chengdu, China. Ecol. Inform. 2024, 84, 102924. [Google Scholar] [CrossRef]
  42. Ghaderpour, E.; Mazzanti, P.; Mugnozza, G.S.; Bozzano, F. Coherency and phase delay analyses between land cover and climate across Italy via the least-squares wavelet software. Int. J. Appl. Earth Obs. 2023, 118, 103241. [Google Scholar] [CrossRef]
  43. Ghorbanian, A.; Mohammadzadeh, A.; Jamali, S. Linear and Non-Linear Vegetation Trend Analysis throughout Iran Using Two Decades of MODIS NDVI Imagery. Remote Sens. 2022, 14, 3683. [Google Scholar] [CrossRef]
  44. Ren, W.; Tian, L.; Querejeta, J.I. Key role of ambient temperature in modulating leaf water isotopic enrichment seasonality in a humid subtropical climate. Agr. Forest Meteorol. 2025, 368, 110561. [Google Scholar] [CrossRef]
  45. Chen, L.L.; Kalonji, G.; Xu, L.L.; Ma, P.F.; Hu, L.M. Combining microclimatic monitoring with questionnaires, for understanding thermal comfort in Linpan, a typical agricultural ecosystem settlement in the Chengdu plain. Build. Environ. 2023, 228, 109868. [Google Scholar] [CrossRef]
  46. Hou, G.R.; Zhang, J.F.; Fan, C.; Li, X.W.; Chen, G.; Zhao, K.J.; Zhang, Y.Q.; Zheng, J.K.; Wang, Y. Stand density management of cypress plantations based on the influence of soil hydrothermal conditions on fine root dynamics in southwestern China. Forests 2025, 16, 46. [Google Scholar] [CrossRef]
  47. Zhou, H.L.; Qu, Q.; Xu, H.W.; Wang, M.G.; Xue, S. Effects of vegetation restoration on soil microbial necromass carbon and organic carbon in grazed and degraded sandy land. J. Environ. Manag. 2025, 382, 125380. [Google Scholar] [CrossRef]
  48. Hou, G.R.; Bi, H.X.; Wei, X.; Wang, N.; Cui, Y.H.; Zhao, D.Y.; Ma, X.Z.; Wang, S.S. Optimal configuration of stand structures in a low-efficiency Robinia pseudoacacia forest based on a comprehensive index of soil and water conservation ecological benefits. Ecol. Indic. 2020, 114, 106308. [Google Scholar] [CrossRef]
  49. Li, C.; Zhang, S.Q. Disentangling the impact of climate change, human activities, vegetation dynamics and atmospheric CO2 concentration on soil water use efficiency in global karst landscapes. Sci. Total Environ. 2024, 932, 172865. [Google Scholar] [CrossRef]
  50. Xu, L.; Kou, Y.P.; Mao, Q.; Li, X.Z.; Li, C.N.; Tu, B.; Li, J.B.; Tu, L.H.; Wang, L.X.; Xu, H.W.; et al. Climate outweighs fertiliser effects on soil phoD-harbouring communities in agroecosystems. Soil Biol. Biochem. 2025, 202, 109697. [Google Scholar] [CrossRef]
  51. Chen, H.; Liu, J.X.; He, W.; Xu, P.P.; Nguyen, N.T.; Lv, Y.M.; Huang, C.C. Shifted vegetation resilience from loss to gain driven by changes in water availability and solar radiation over the last two decades in Southwest China. Agr. Forest Meteorol. 2025, 368, 110543. [Google Scholar] [CrossRef]
  52. Du, C.M.; Chen, S.W.; Wang, L.; Xie, J.K.; Dai, S.R.; Xu, Y.P. Evaluating the impact of drought-vegetation loss coupling on eco-hydrological stability in the Yellow River Basin, China. J. Hydrol. 2025, 661, 133823. [Google Scholar] [CrossRef]
  53. Patra, S.; Gavsker, K.K.; Das, T. Assessing urban landscape dynamics and its relations to changing surface thermal character and prospects: A geospatial study of a tropical industrial city using machine learning algorithms. Environ. Sci. Pollut. Res. 2025, 1–35. [Google Scholar] [CrossRef] [PubMed]
  54. Chen, Y.; Xu, Y.; Chen, T.; Zhang, F.; Zhu, S. Exploring the spatiotemporal dynamics and driving factors of net ecosystem productivity in China from 1982 to 2020. Remote Sens. 2024, 16, 60. [Google Scholar] [CrossRef]
  55. Ge, W.Y.; Han, J.Q.; Zhang, D.J.; Wang, F. Divergent impacts of droughts on vegetation phenology and productivity in the Yungui Plateau, southwest China. Ecol. Indic. 2021, 127, 107743. [Google Scholar] [CrossRef]
  56. Gao, M.D.; Piao, S.L.; Chen, A.P.; Yang, H.; Liu, Q.; Fu, Y.S.H.; Janssens, I.A. Divergent changes in the elevational gradient of vegetation activities over the last 30 years. Nat. Commun. 2019, 10, 2970. [Google Scholar] [CrossRef]
  57. Qu, Z.K.; Lin, C.F.; Zhao, H.Y.; Chen, T.T.; Yao, X.D.; Wang, X.H.; Yang, Y.S.; Chen, G.S. Above- and belowground phenology responses of subtropical Chinese fir (Cunninghamia lanceolata) to soil warming, precipitation exclusion and their interaction. Sci. Total Environ. 2024, 933, 173147. [Google Scholar] [CrossRef]
  58. Hou, G.R.; Li, X.W.; Fan, C.; Chen, G.; Zhao, K.J.; Zhang, Y.Q.; Wang, Y.; Zheng, J.K. Stand structural diversity and fine root morphological plasticity synergistically enhance soil hydrological effects. For. Ecol. Manag. 2025, 95, 123047. [Google Scholar] [CrossRef]
  59. Tuoku, L.; Wu, Z.J.; Men, B.H. Impacts of climate factors and human activities on NDVI change in China. Ecol. Inform. 2024, 81, 102555. [Google Scholar] [CrossRef]
  60. Ouyang, W.; Wan, X.Y.; Xu, Y.; Wang, X.L.; Lin, C.Y. Vertical difference of climate change impacts on vegetation at temporal-spatial scales in the upper stream of the Mekong River Basin. Sci. Total Environ. 2020, 701, 134782. [Google Scholar] [CrossRef]
  61. Peng, S.S.; Piao, S.L.; Ciais, P.; Myneni, R.B.; Chen, A.P.; Chevallier, F.; Dolman, A.J.; Janssens, I.A.; Peñuelas, J.; Zhang, G.X.; et al. Asymmetric effects of daytime and night-time warming on Northern Hemisphere vegetation. Nature 2013, 501, 88–92. [Google Scholar] [CrossRef]
  62. Qi, G.; Cong, N.; Qiu, T.Z.; Rong, L.; Ren, P.; Xiao, J.T. Evaluation of impact of climate extremes on vegetation change in Southwest China considering time-lag effect. Glob. Ecol. Conserv. 2025, 58, e03497. [Google Scholar] [CrossRef]
Figure 1. Study area.
Atmosphere 16 00974 g001
Figure 2. Variations in the vegetation normalization vegetation index (NDVI) across different months and years.
Atmosphere 16 00974 g002
Figure 3. Variations in precipitation (P) across different months and years.
Atmosphere 16 00974 g003
Figure 4. Variations in temperature (Ta) across different months and years.
Atmosphere 16 00974 g004
Figure 5. Variations in the wind speed (WS) across different months and years.
Atmosphere 16 00974 g005
Figure 6. Variations in the soil volumetric water content (VWC) across different months and years.
Atmosphere 16 00974 g006
Figure 7. Analysis of the performance of the RF machine learning model. Note, the dotted line represents a 1:1 ratio, the vermilion line represents the fitting line of the training set data, and the blue line represents the fitting line of the test set data.
Atmosphere 16 00974 g007
Figure 8. Responses of environmental factors to the NDVI based on SHAP.
Atmosphere 16 00974 g008
Figure 9. Predictive effects of environmental factors on the NDVI based on SHAP. Note, Ta is temperature, P is precipitation, SWC is soil water content, WS is wind speed, Mean stands for average value, Med stands for median income, Var stands for variance, and Std stands for standard deviation. Each dot represents the feature value of a sample and its corresponding SHAP contribution value. The red curve is the non-parametric fit of the generalized additive model (GAM) to the trend of the dots, reflecting the average impact of the feature on the prediction, while the red area indicates the 95% confidence interval.
Atmosphere 16 00974 g009
Table 1. Model verification parameters.
Model ParametersValues
R20.666
(Radjust)20.662
Standard estimated error0.064
F-statistics4.379
p0.037
Durbin-Watson1.807 ≈ 2
Table 2. Evaluation of the simulation accuracies of different machine learning models.
ParameterRFXGBBPSVM
R20.7460.6530.6230.725
MAE0.0470.0580.0590.049
MSE0.0040.0050.0050.004
RMSE0.0590.0690.0720.062
Disclaimer/Publisher’s Note: The statements, opinions and data contained in all publications are solely those of the individual author(s) and contributor(s) and not of MDPI and/or the editor(s). MDPI and/or the editor(s) disclaim responsibility for any injury to people or property resulting from any ideas, methods, instructions or products referred to in the content.