Article

Diagnosing Tibetan Plateau Summer Monsoon Variability Through Temperature Advection

1
School of Ecology and Environment, Inner Mongolia University, Hohhot 010020, China
2
State Key Laboratory of Cryospheric Science and Frozen Soil Engineering, Northwest Institute of Eco-Environment and Resources, Chinese Academy of Sciences, Lanzhou 730000, China
3
Inner Mongolia Autonomous Region Meteorological Observatory, Hohhot 010051, China
4
Inner Mongolia Autonomous Region Meteorological Information Center, Hohhot 010051, China
*
Authors to whom correspondence should be addressed.
Atmosphere 2025, 16(8), 973; https://doi.org/10.3390/atmos16080973
Submission received: 20 April 2025 / Revised: 12 June 2025 / Accepted: 13 August 2025 / Published: 16 August 2025
(This article belongs to the Section Climatology)

Abstract

It has always been a research topic for some meteorologists to design a new and reasonable calculation scheme of the intensity of the Tibetan Plateau (TP) summer monsoon (TPSM). Existing indices are defined based on dynamic factors. However, the intensity of the TPSM can also be influenced by thermal factors. We therefore propose defining a TPMI in terms of horizontal temperature advection within the main body of the TP. This provides a new index that directly quantifies the extent to which the thermal forcing in the TP region regulates the monsoon system. The new index emphasizes the importance of the atmospheric asymmetry structure in measuring TPSM strength, represents the variability of the TPSM circulation system, effectively reflects the meteorological elements, and accurately represents the climate variation. Tropospheric temperature (TT) and TPSM are linked by the new index. These significant centers of correlation are characterized by alternating positive and negative phases along the Eastern European Plain, across the Turan Plain, and into southwestern and northeastern China. The correlation coefficients are found to be significantly out of phase between high and low altitudes in the vertical direction. This research broadens our minds and helps us to develop a new approach to measuring TPSM strength. It can also predict extreme weather events in advance based on TPMI changes, providing a scientific basis for disaster warnings and the management of agriculture and water resources.

1. Introduction

The largest and highest plateau in the world has an outsized impact on climate [1]. The Tibetan Plateau (TP) is the highest plateau in the world. The exchange of materials and energy in this region can directly impact the middle atmosphere, thereby influencing the regional and even global climates [2,3,4,5]. The Tibetan Plateau monsoon (TPM) was first identified by Ye et al. [6] and subsequently named by Xu et al. [7]. Following systematic research by Tang et al. [8,9,10,11] into its climatic characteristics and interannual variability, the TPM has gradually gained widespread recognition. The intensity and evolution of TPM activity can be characterized by the Tibetan Plateau monsoon index (TPMI). Consequently, it is important to conduct TPMI research to explore changes in the strength of the TPM and its evolutionary patterns.
Since Tang et al. [9] first defined the plateau monsoon index using the 600 hPa height field in 1984, several other indices [12,13,14,15,16,17,18,19,20] have been developed for use in subsequent research projects. So far, all existing TPMI can be categorized into three types based on the defined elemental fields. The first type of TPMI is defined based on the geopotential height field. As described by Tang et al. [9], it primarily takes into account variations in the geopotential height field at 600 hPa. Subsequently, Xun et al. [14] incorporated the center positional parameter of the low-pressure system in the TP near-surface layer into the traditional TPMI. This improves the index’s ability to characterize the variations in the position of the TPM. The second type of TPMI is defined based on the wind field, such as the TPMI defined by the horizontal shear of the latitudinal winds at 600 hPa on the northern and southern sides of the TP [12,13]. Alternatively, when TPMI is defined based on the wind field at 550 hPa, both the latitudinal wind shear on the northern and southern sides and the meridional wind shear on the eastern and western sides of the TP are considered [18]. TPMI can also be defined based on seasonal changes in the wind field [17,20]. The final type of TPMI, which is defined based on diagnostic physical element fields. Examples include TPMI, which is defined based on the divergence field [16], the vorticity field [15] or the combined vorticity and divergence fields [19]. Based on the above TPMI, scientists have systematically mapped the evolution of the TPM [21]. They concluded that the TPM has a significant impact on regional, East Asian, and global climate systems [3,22,23,24,25,26]. Significant progress has also been made in researching the impact of the plateau monsoon on precipitation [27,28,29,30,31].
TPM is a distinctive component of the Asian climate system [2,3,8,9,10] due to its unique thermodynamic properties and the huge, clearly seasonal thermal contrasts between the world’s highest land feature and the mid-tropospheric free atmosphere. However, existing TPMIs are primarily defined based on potential height, wind, and physical element fields due to the impact of thermal effects on the TP, rather than considering the direct impact of thermal differences. In the context of an increasing abundance of observation stations and improved analytical information, there is a need for a more comprehensive definition of TPMI that takes into account the thermal conditions of the TP [15]. In view of this, the aim of this paper is to design a calculation scheme for TPMI based on thermal factors in order to address the lack of a definitional basis for TPMI. At the same time, adding the definition program helps us to gain a deeper understanding of TPM and study it more closely [32,33]. So, what is the best approach to designing a reasonable TPMI based on thermal factors? How can the TPMI be used to measure TPM strength?
To answer these questions, it is important first to elaborate on the asymmetric structure of the atmospheric circulation in order to design metrics describing TPSM variations based on thermal factors; see Section 3. The performance of the index is then measured, and its relationships with the large-scale precipitation and circulation anomalies associated with the TPSM are examined in Section 4. Also in this section we make some preliminary investigations into the correlation between the plateau monsoon and the temperature field. A summary and conclusions are given in Section 5.

2. Data and Methodology

2.1. Data

Reanalysis datasets are essential tools that combine observational data from multiple sources with the outputs of numerical models. Their monthly products play an indispensable role in climate trend analysis, land–atmosphere interaction studies and long-term climate change monitoring [34]. The European Centre for Medium-Range Weather Forecasts (ECMWF) has successively released two generations of reanalysis products: ERA-Interim and ERA-5. These differ significantly in terms of their spatio-temporal resolution, data assimilation systems, and data accuracy [34,35,36,37]. Specifically, ERA-Interim provides monthly data from January 1979 to August 2019 [35]. Its monthly variables are generated by averaging six-hourly instantaneous data, which ensures data stability. By contrast, ERA-5’s monthly data is aggregated from one-hour high-frequency outputs, which enables better preservation of high-frequency climate features [34]. In terms of data consistency, ERA-Interim demonstrates excellent internal consistency between 1979 and 2019, thanks to its fixed assimilation system [38]. However, although ERA-5 significantly improves data accuracy by incorporating multi-source observations, instrument transitions may introduce inhomogeneities in certain physical fields between 1998 and 2002 [39]. Comprehensive evaluations indicate that ERA-5, with its superior spatio-temporal resolution, improved physical parameterization schemes, and real-time updates, is particularly suitable for analyzing extreme climate events and diagnosing regional climates [34,40]. However, ERA-Interim remains valuable as a reference dataset for long-term climate trend analysis during 1979–2019 [38,41]. ERA-Interim was selected as the primary dataset for this study due to its consistent performance during this period. The variables included are surface pressure, geopotential height, air temperature, specific humidity and horizontal winds. The horizontal resolution of the ERA-Interim for atmospheric circulation data is 1.0° × 1.0°. The monthly mean precipitation data is acquired from Global Precipitation Climatology Project (GPCP) datasets [42] with a horizontal resolution of 2.5° latitude by 2.5° longitude. All data between 1979 and 2018 were extracted, and the summer mean field is calculated by simply averaging the original monthly mean data from June to August.

2.2. Methodology

In the existing research, there are two categories of indices reflecting TPSM activity, one based on geopotential height field and the other based on wind. The representative indices defined by Tang et al. [9], Qi et al. [12], Tian et al. [13], Xun et al. [14], Zhou et al. [16] and Zhou et al. [18], written as TPMI, QPMI, TjPMI, DPMI, ZyPMI and ZjPMI, were selected for contrast analysis in the present study.
To assess the applicability of these indices to the general circulation and the physical interpretation of the relationship between the TPSM and precipitation, we use the following equations [43] to calculate Qx and Qy, the column-integrated horizontal water vapor fluxes in the zonal and meridional directions, respectively.
Q x = 1 g p b p t q u d p   and   Q y = 1 g p b p t q v d p ,
where q is the specific humidity, u and v are the zonal and meridional wind components, respectively, g is the acceleration due to gravity, and pb and pt are the pressure at the lower and upper levels of the integration volume, respectively.
Empirical Orthogonal Function (EOF) analysis [44] was used to reduce the dimensionality of geopotential height and temperature field data and extract key information for this paper. Also referred to as principal component analysis (PCA) in meteorology and climatology, EOF analysis is a statistical technique used to identify dominant patterns of variability in spatially and temporally distributed data.
A matrix is the form in which the observations of a climate variable field are given.
X = x 11 x 12 x 1 j x 1 n x 21 x 21 x 2 j x 2 n x i 1 x i 2 x i j x i n x m 1 x m 1 x m j x m n ,
where m denotes a spatial point (i.e., an observation station or grid point) and n denotes a point in time (i.e., the number of observations), xij represents the jth observation taken at the ith station or grid point.
The EOF expansion decomposes Equation (1) into a sum of products of two functions: the spatial function and the temporal function.
x i j = k = 1 m v i k t k j = v i 1 t 1 j + v i 2 t 2 j + + v i m t m j .
Equation (2) can be written in matrix form as follows:
X = V T .
V and T are called the spatial function matrix and the time coefficient matrix, respectively, where
V = v 11 v 21 v 1 m v 21 v 22 v 2 m v m 1 v m 2 v m m ,   T = t 11 t 21 t 1 n t 21 t 22 t 2 n t m 1 t m 2 t m n .
The EOF analysis, Pearson correlation analysis, Student’s t-test (t-test) [44], Mann–Kendall (MK) test [45] and the composite analysis [29] are also applied to study the TPSM variation and its possible mechanism affecting precipitation and TT.

3. Asymmetric Structure of the Atmospheric Circulation

Cold high in winter and warm low in summer [8,9], formed by the coordinated change in temperature and pressure fields over the main body of the TP. Figure 1 shows the structure of the leading EOF mode of the geopotential height and temperature fields at 600 hPa over the TP and their temporal coefficients. It largely reflects the fact that during summer, the main body of the TP is controlled by a strong warm low-pressure system [14], whose geometric centers are located approximately at (32.5° N, 90° E). Obviously, there is a difference in the distribution of the geopotential height and temperature fields. There remains an angle between the isotherm and the isobaric because the two geometric centers are not completely coincident and the warm center is slightly south of the cold center (Figure 1a). The second EOF mode is also used (Figure 1c). Although the main body of the TP is still controlled by the warm low, the low center is located in the western TP, while the warm center is located in the northeast of the TP. The isotherms and isobars are nearly perpendicular. According to the geostrophic equilibrium, there is an angle between the geostrophic wind and the isotherm, which causes the redistribution of the temperature and pressure fields. According to the ω equation, the warm temperature advection zone ( V g T > 0 ), with upward movement ( ω < 0 ), favors the development of cyclonic circulation systems, while the cold temperature advection zone ( V g T < 0 ), with downward movement ( ω > 0 ), suppresses cyclonic circulation systems [46,47,48,49]. It can be seen that TPSM evolution can be induced by temperature advection changes. Geostrophic balance dictates a characteristic angle between geostrophic wind and isotherms, driving temperature and pressure field redistribution. Crucially, when the spatio-temporal evolution of the geopotential height field exhibits phase-locking with the temperature field in both EOF Mode 1 (Figure 1b) and Mode 2 (Figure 1d), thermal forcing emerges as the dominant driver of the TPSM evolution.
In general, the warm surface low over the TP exhibits baroclinic characteristics in summer. To satisfy mass continuity, subsidence occurs in the vertical dimension while horizontal divergence develops in the lower troposphere, resulting in warm advection within the plateau monsoon system due to thermal forcing. The plateau summer monsoon is intensified because the adiabatic downdraft is compressed, the local temperature rises, the warm low-pressure system and the relative vorticity in the surface layer over the plateau are intensified. Conversely, the vertical flow will rise, while the horizontal airflow will converge inwards, and there will be cold advection over the plateau monsoon region. The plateau summer monsoon is weakened because the adiabatic updraft is expanded, the local temperature decreases, and the warm low-pressure system and the relative vorticity in the surface layer over the plateau are weakened.
These show that the evolution of the plateau monsoon can be described by the change in temperature advection in the monsoon region. When the plateau monsoon region is dominated by warm advection, the plateau summer monsoon strengthens, and when cold advection dominates, the plateau summer monsoon weakens. Let us support that the circulation system is not affected by the frictional force, and in geostrophic equilibrium there will be V g = g f p z × k . The geostrophic wind temperature advection V g p T = ( g f p z × k ) p T . Based on the temperature field and the geopotential height field, the TaPMI is defined in terms of thermal factors, which are used to describe the evolution of the warm low-pressure system in the surface layer over the plateau:
T a P M I = V g p T = ( g f p z × k ) p T
where z and T are the geopotential height and temperature at 600 hPa, respectively, g is the gravitational acceleration and f is the Coriolis parameter.

4. Ability of Temperature Advection to Describe the TPSM

4.1. Contrast Analysis and Evolution Characteristics of the Indices

4.1.1. Variation Characteristics of the TPSM

The interannual and interdecadal variations are important indicators to determine the characteristics of the TPSM. If the indices are above zero, the TPSM is a positive anomaly. Indices below zero indicate that the TPSM is a negative anomaly. Figure 2a shows the interannual variation in the standardized plateau summer monsoon indices, i.e., these indices show similar interannual and interdecadal variations and all have a fluctuating increasing trend. The correlation coefficients between any two indices (Table 1) are greater than 0.62, with the 0.001 confidence level reaching a very significant level. It also shows that all the indices have a high consistency over time and that the most significant correlation is between TaPMI and DPMI. Of course, there are also some differences between them in terms of interannual and interdecadal variations. For example, the ZyPMI and TaPMI peak one year before the other indices for the period 1997–2001. This suggests that the movement of these indices is not uniform and that the phase in a given period is delayed along the time axis. In addition, there is the same phase, but the difference in the intensity of the TPSM in a given year and the difference in the amplitude of the fluctuations (Figure 2b) are always present over time. This suggests that the movement of these indices is not uniform and that the phase lags over a given period along the time axis. There is also the same phase, but the TPSM intensity difference in a given year and the difference in fluctuation amplitude always exist over time. At the same time, we must realize that, as with other TPMIs, the new TPMI’s uniqueness is limited by the fact that its calculation process is affected by the calculation area and the height of the isobaric level.
To further reveal the variation characteristics of the TPSM intensity, the MK test is applied to study the abrupt changes in the TPSM indices. Figure 3 shows the UF and UB curves of these indices. As can be seen from the curves of the TPMI in Figure 3a, during the period from 1979 to 2018, an abrupt change appears in 1998, when the variation tendency of the TPSM and the warm low over the TP shifts from weak to strong. The UF values exceed the significant level of 0.05 after 2004, which means that the TPSM is significantly enhanced after this time. The UF and UB curves of the DPMI are shown in Figure 3b, where the UF values are only below zero for a few years before 2000 and do not exceed the critical significant level until 2013. Although the mutation character is not as obvious as for the TPMI, the TPSM shows an increasing trend. For the QPMI (Figure 3c) and ZyPMI (Figure 3d), the TPSM shifts from weak to strong in 1997, and the variation trend is more significant after 2004 and 2006, respectively. The ZjPMI (Figure 3e) shows the same variation trend as the TPMI. The sudden change occurs in 1998; the UF values exceed the significant level of 0.05, and the TPSM improves significantly after 2004. And for the UF and UB curves of the TaPMI (Figure 3f), the variation trends are similar to those of the DPMI, but the abrupt time is clearer, and the increasing trend, especially for the period from 2009 to 2017, is more significant.
Taken together, not only are the interannual and interdecadal changes in these indices generated by the different calculation methods very consistent and follow a significant fluctuating upward trend, but also the abrupt time and significant enhancement time of TPSM are relatively concentrated in 1997–2000 and 2003–2009, respectively. The TPSM reflected by TaPMI shows the same significant fluctuation and enhancement trend as other researchers [18], while the abrupt time is basically consistent with those of plateau eddy activity [50], annual precipitation and runoff in the TP [51]. In this sense, the TaPMI has the ability to measure the strength of the TPSM. It is refreshing that the TPSM described by TaPMI is bound to cause changes in the meteorological elements, as we envisaged. Based on the results mentioned above, the TaPMI has a reasonable performance compared to the existing indices.

4.1.2. Correlation Analysis Between the TPSM and Precipitation

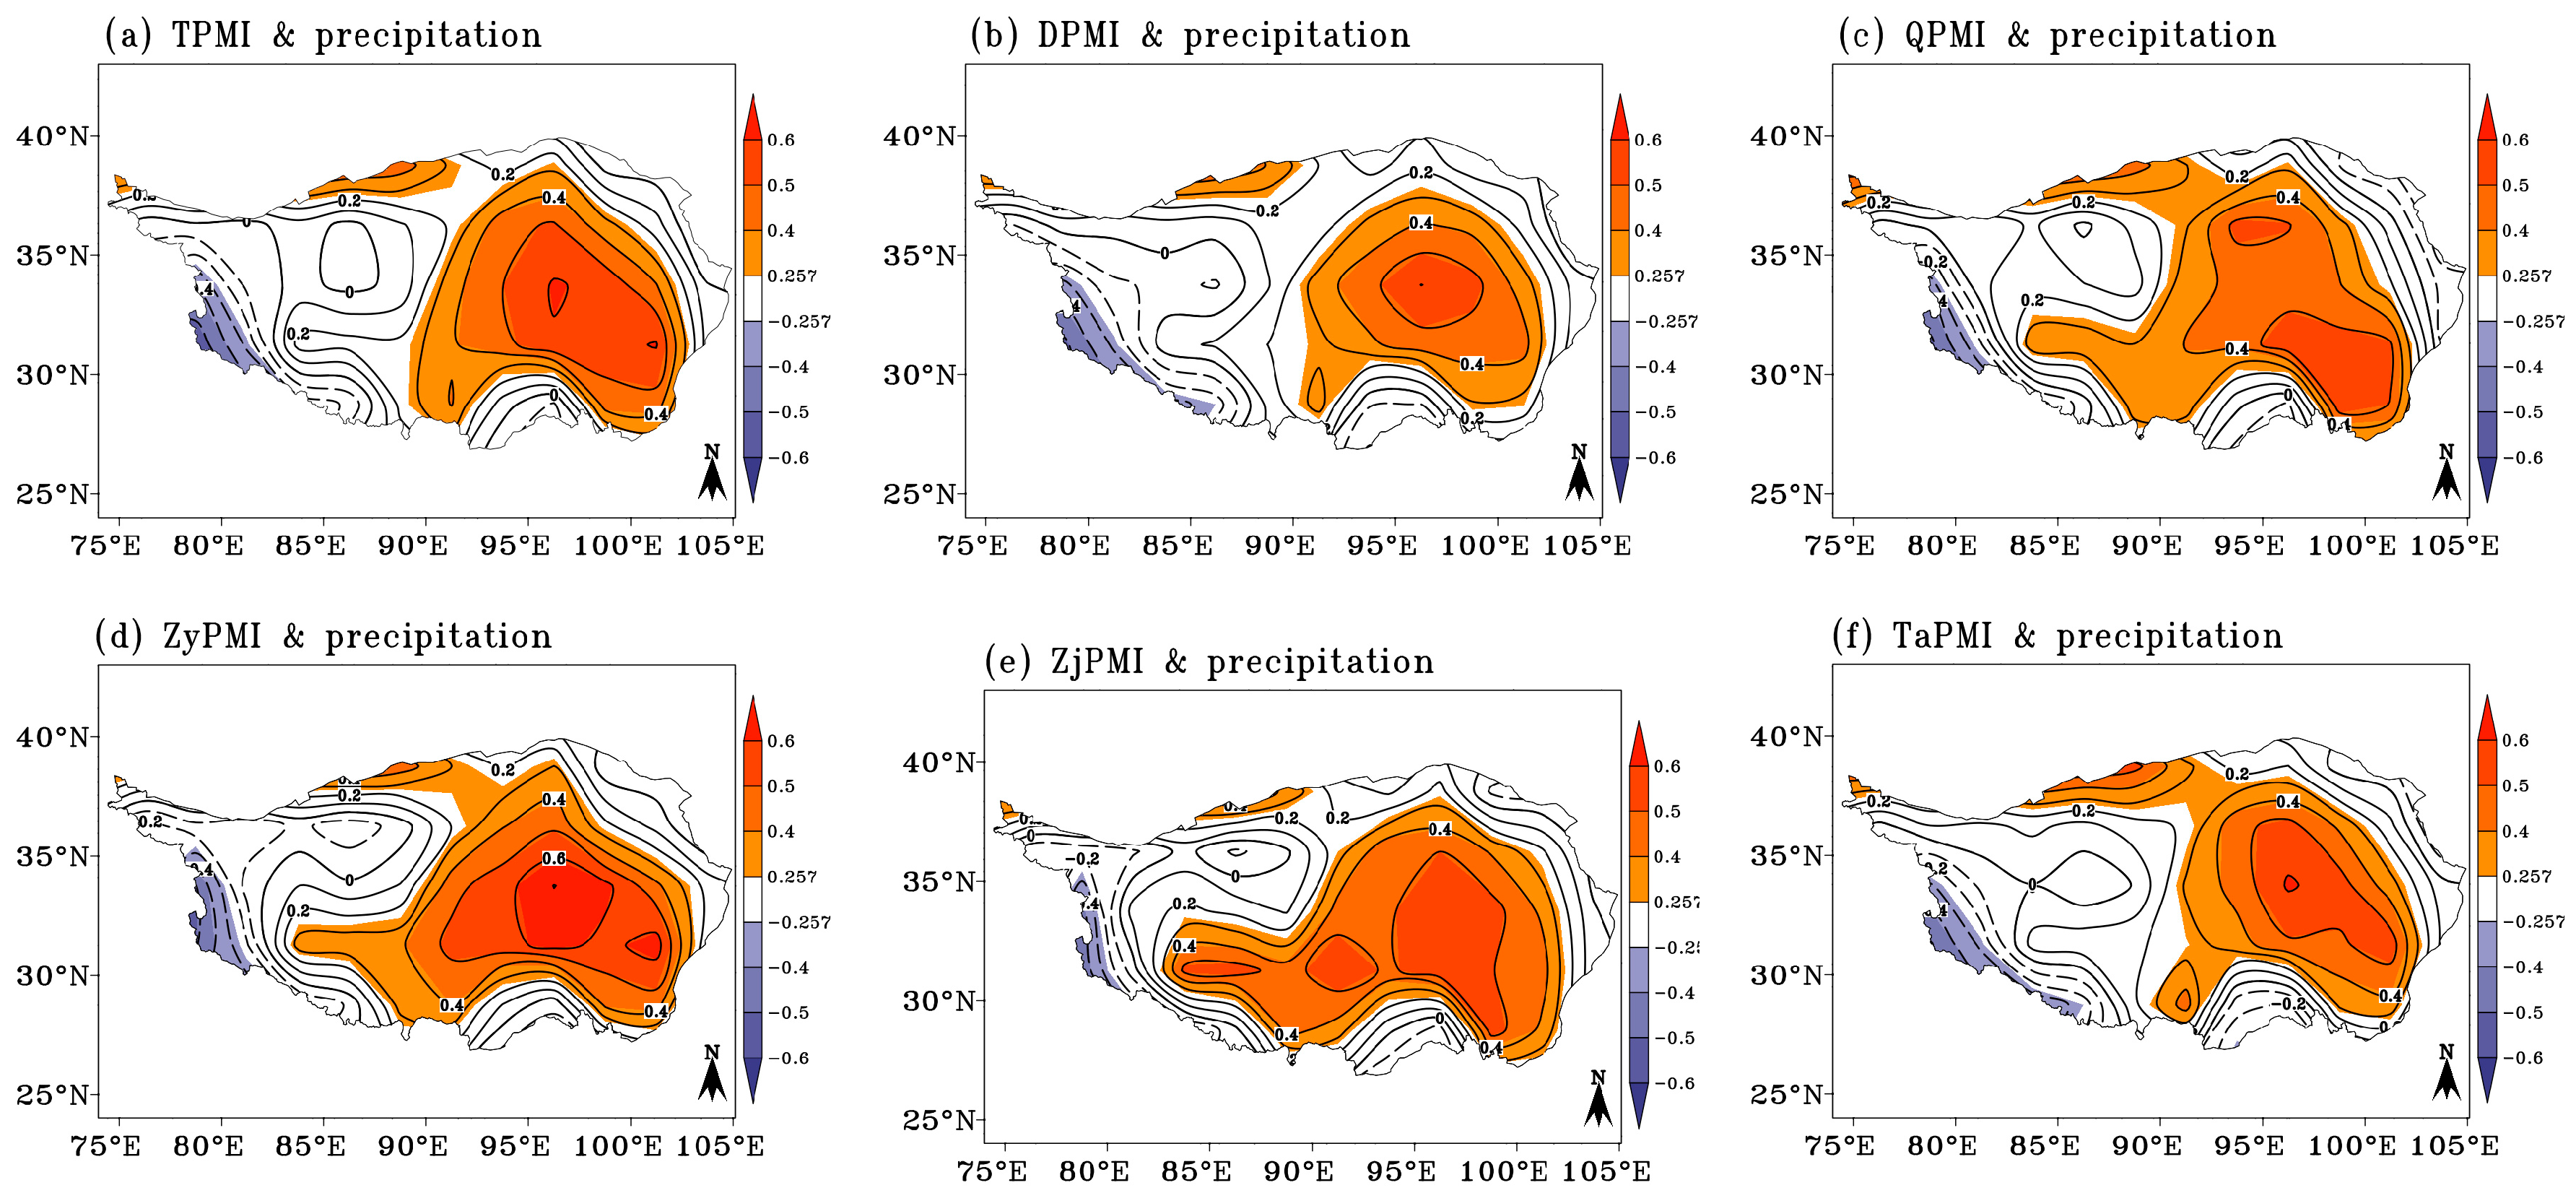
A good monsoon index should indicate the evolution of meteorological elements, especially precipitation, in the monsoon region, and the plateau monsoon region is no exception [14,18]. Considering that the rainy season over the TP is mainly limited to summer, we calculated the correlation coefficients between standardized plateau summer monsoon indices and precipitation (Figure 4), which will be used to discuss the relationship between the TPSM and meteorological elements over the TP in this section. It was found that the spatial patterns of correlations between different plateau summer monsoon indices and precipitation are basically consistent among different monsoon indices.
It can be seen from Figure 4a that the main body of the plateau was covered by significant positive correlations between TPMI and precipitation. The center of the positive correlation is located at (33.5° N, 96.5° E), and the correlation coefficient reaches 0.61. Significant negative correlations were found in the northwest and the western edge of the plateau (Figure 4a). The results show that when the summer monsoon over the plateau is strong, precipitation in the main body of the plateau, especially in the positive correlation center and adjacent areas, is higher than normal, while precipitation over the northwest and western edge of the plateau is lower. When the plateau summer monsoon is weak, precipitation in the main body of the plateau is lower than normal, while precipitation over the northwest and western edge of the plateau is higher. For DPMI (Figure 4b) and TaPMI (Figure 4f), the distribution characteristics of the correlations are similar to that of TPMI, and the positive correlation centers are also generally located at (33.5° N, 96.5° E), but the regions of significant positive correlation over the main body of the plateau decrease slightly, and the correlation coefficients are reduced to 0.54 and 0.57, respectively, compared to that of TPMI. For the other three plateau monsoon indices, QPMI (Figure 4c), ZyPMI (Figure 4d) and ZjPMI (Figure 4e), the regions of significant positive correlation over the main body of the plateau, especially west of 90° E, are larger than those of the TPMI.

4.2. Composite Analysis of Weather Element Fields

Although there are differences in the correlations between different plateau summer monsoon indices and precipitation, the spatial patterns are basically consistent among the different monsoon indices. The method defined by TaPMI is valid because it not only can effectively reflect meteorological elements [52] but also should better reflect the evolution of atmospheric circulation situations [29]. To investigate the general circulation response to plateau summer monsoon anomalies, composites of anomalous flow fields in strong and weak summer monsoon years were analyzed.
Based on the interannual variability of the standardized plateau summer monsoon index (Figure 2a), we can group the years between 1979 and 2018 into anomalously strong and weak plateau summer monsoon years by selecting plateau summer monsoon index anomalies greater than ±1 (Table 2). We consider 1998 as a significant abrupt change in this paper. Before 1998, there was only one summer with positive standardization TPMI or TaPMI and two summers with positive standardization DPMI, but no summer with other positive standardization plateau summer monsoon indices greater than one. On average, more than five summers had a negative standardization plateau summer monsoon index below −1, indicating a weak plateau monsoon during this period. However, after 1998, there were two years with a negative standardization DPMI and only one summer with a negative standardization, with other positive standardization plateau summer monsoon indices below −1. On average, more than five summers had a positive standardization plateau summer monsoon index above 1. Thus, a strong plateau monsoon trend is evident since 1998. According to the above analysis, six years with positive standardization plateau summer monsoon indices >1 were selected to represent strong plateau summer monsoon years; the other six years with negative standardization plateau summer monsoon indices <−1 were selected to represent weak plateau summer monsoon years. Although there were differences between strong and weak years in the plateau summer monsoon indices, this suggests an influence of the definition method through the mathematical definition and physical meaning of the plateau summer monsoon.
Summer rainfall anomalies during strong (weak) plateau summer monsoon years are more (less) intense than normal over the main body of the plateau. The difference means that significant positive anomalies occur in the main body of the plateau, while negative anomalies occur predominantly in the northwestern and western edges of the plateau. That is, the plateau summer monsoon variations appear to modulate plateau precipitation. In the following sections, the modulating mechanism is elucidated by a composite analysis of atmospheric circulation anomalies during strong and weak plateau summer monsoon years.
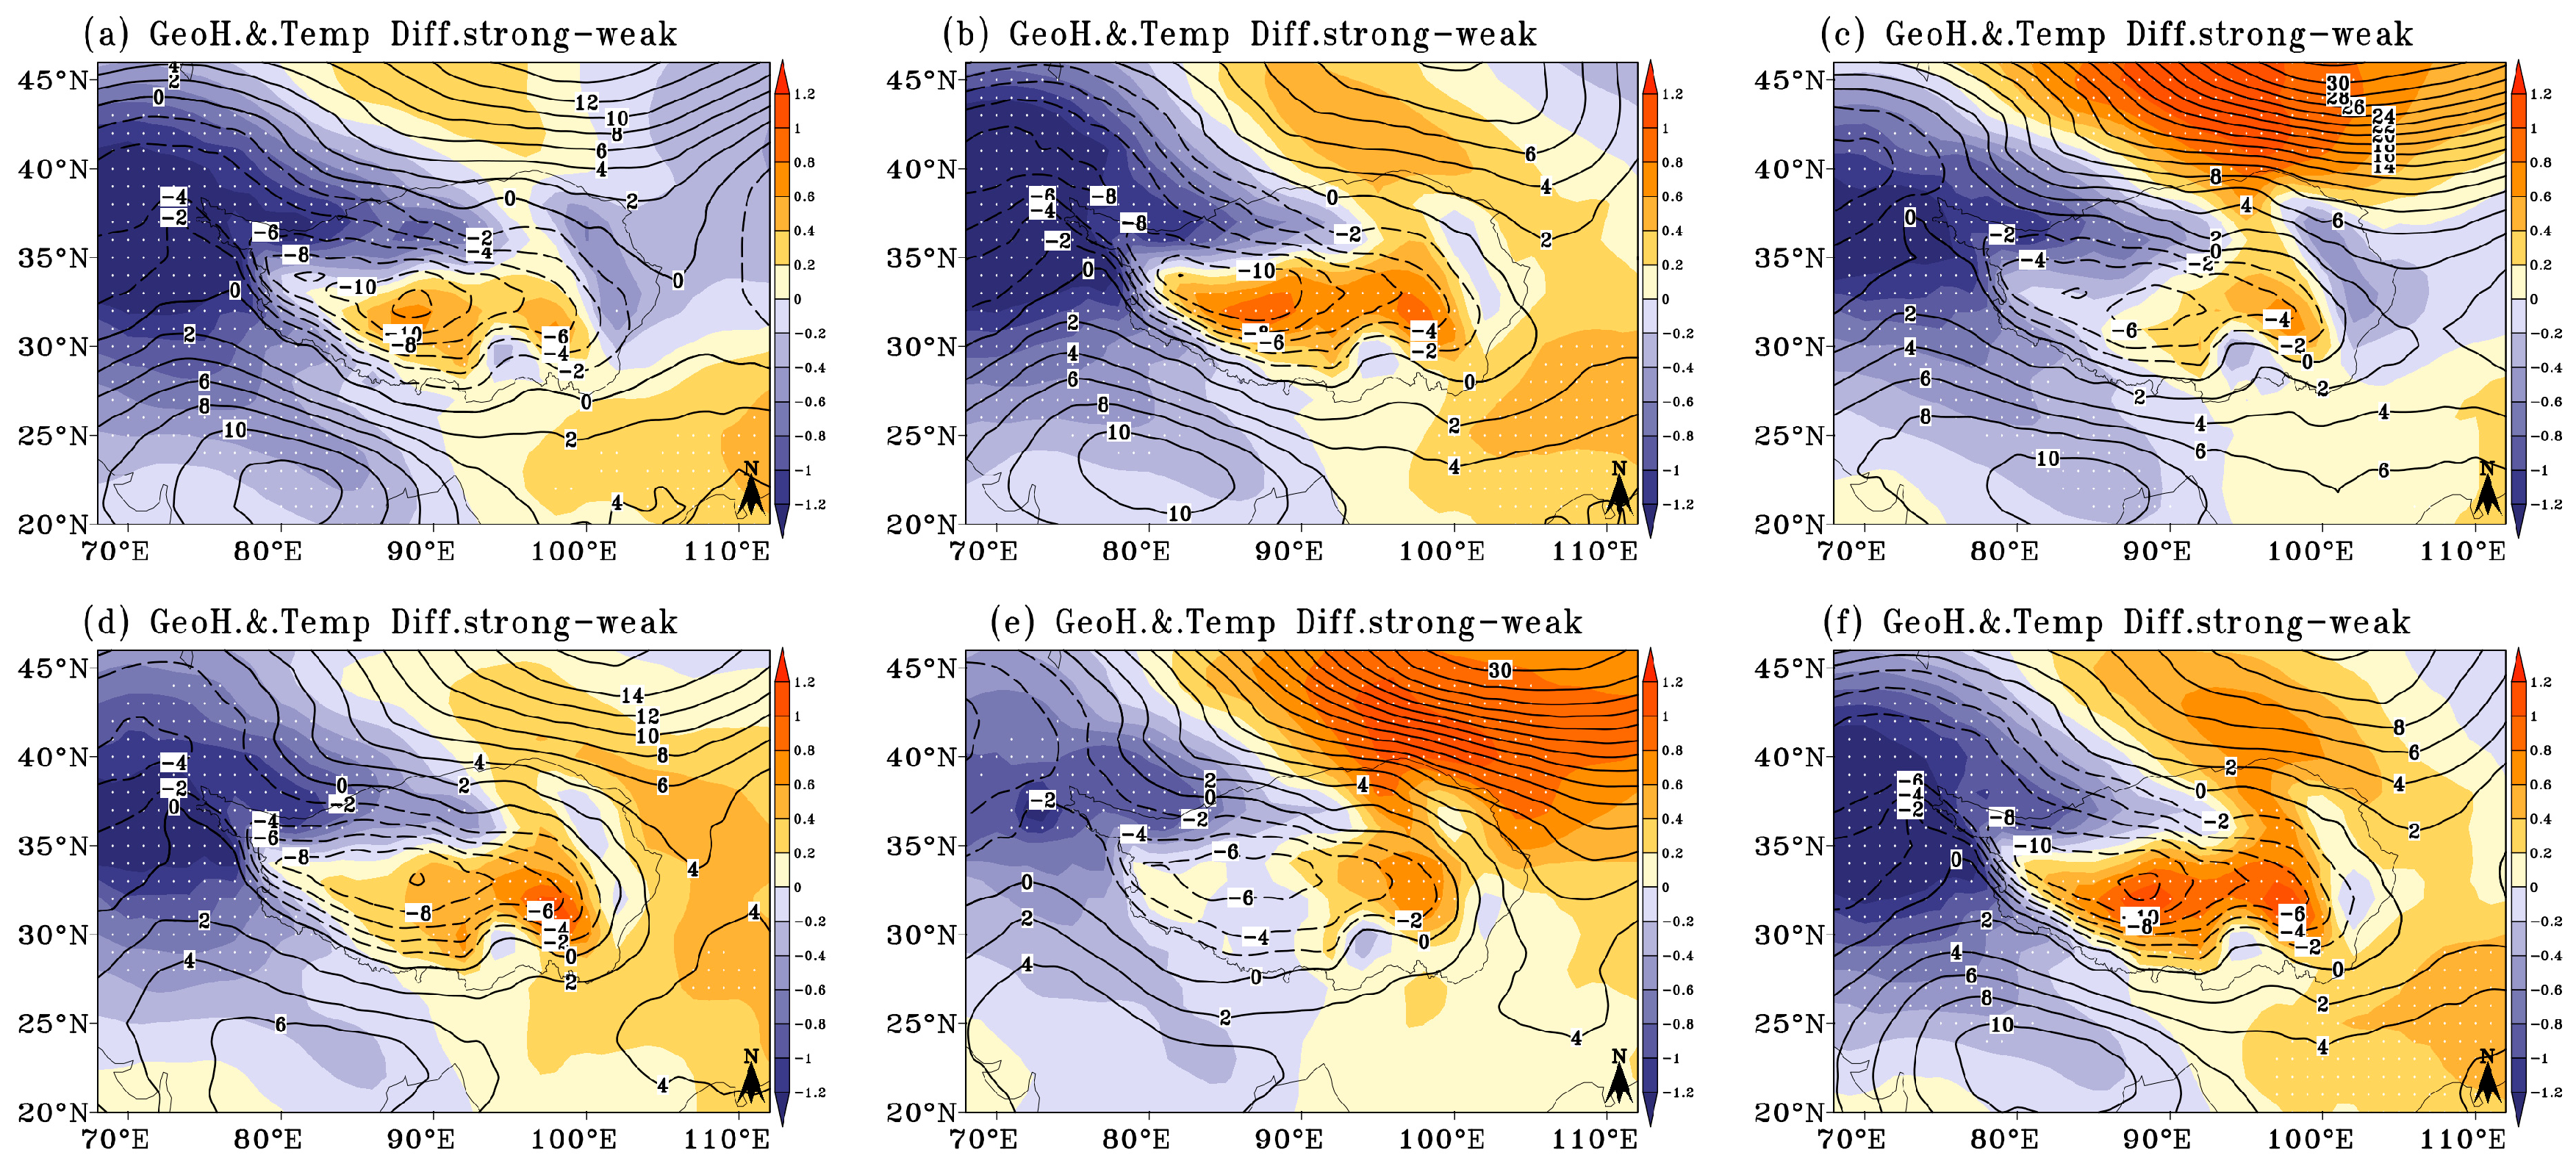
The temperature and geopotential height field composites of strong (weak) plateau summer monsoon years are characterized by an anomalous warm low (cold high) pressure center; the movement of the air flow is towards (outwards) the center to converge (diverge) in the surface layer (600 hPa) above the TP, which means that the plateau summer monsoon activities can be better reflected by each plateau monsoon index. Of course, there are some differences in the distribution, especially in the distribution of the difference between strong and weak plateau summer monsoon years (Figure 5), among the different plateau summer monsoon indices. As can be seen from Figure 5, there is a positive temperature anomaly above 0.2 °C and a negative geopotential height anomaly above 2 dgpm for each plateau summer monsoon index over the plateau. The positive temperature anomaly is mainly distributed over the main body of the plateau for TPMI (Figure 5a), DPMI (Figure 5b) and ZyPMI (Figure 5d), but the distribution decreases from west to east for QPMI (Figure 5c), ZjPMI (Figure 5e) and TaPMI (Figure 5f). Even for ZjPMI (Figure 5e), there is a negative temperature anomaly in the region (85–90° E).
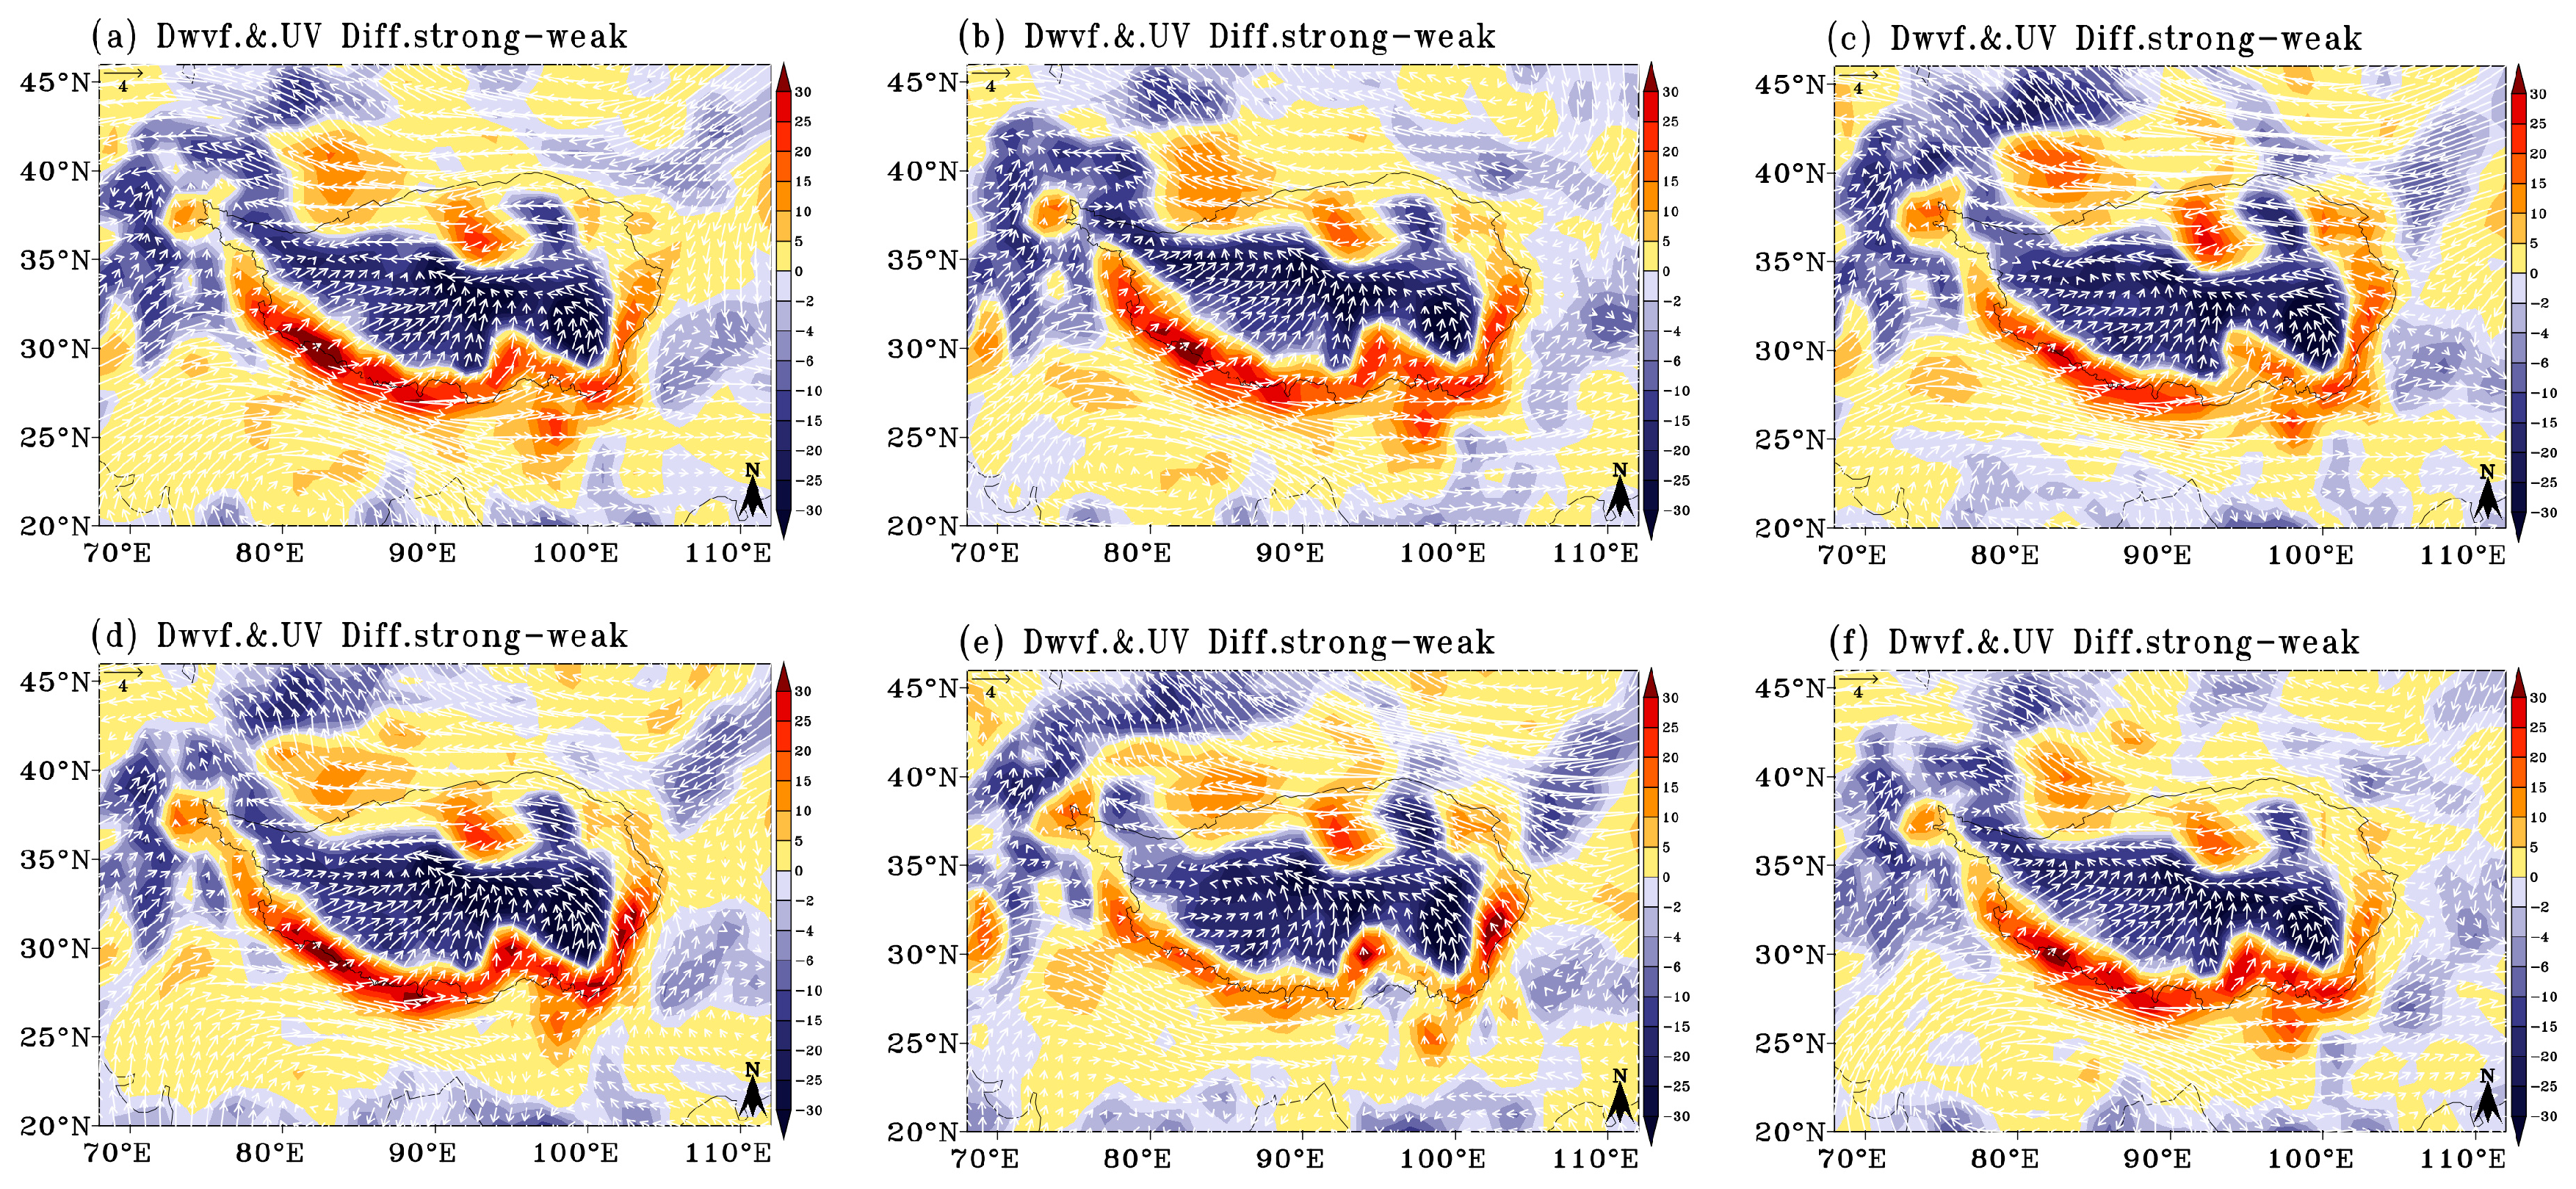
Affected by the change in the warm low-pressure system, the water vapor transport changes significantly with the wind field adjustment in the surface layer over the plateau. Compared to the climatological mean flow, the southern part of the plateau is dominated by enhanced southerlies (northerlies) associated with the cyclonic (anticyclonic) flow anomaly, which is shared by the water vapor flux convergence (divergence) (Figure 6). The main body of the plateau is dominated by enhanced southerlies (northerlies) associated with the anticyclonic (cyclonic) flow anomaly, which is shared by the water vapor flux divergence (convergence) at 300 hPa.
Thus, precipitation over the plateau is influenced by the anomalous atmospheric circulation associated with the variability of the plateau summer monsoon. In strong plateau summer monsoon years, increased precipitation over the plateau can be explained by anomalous southerly winds along the southern flank of the extended and intensified cyclone, which help to converge and transport moisture to high levels over the plateau. In weak plateau summer monsoon years, a reverse pattern occurs over the plateau. The reduced precipitation over the plateau can be explained by anomalous northerly winds along the southern flank of the extended and intensified plateau anticyclone, which hinders moisture convergence and transport to high levels over the plateau. However, precipitation synthesis varies considerably from plateau monsoon index to plateau monsoon index due to the different convergence zones. The water vapor flux convergence zone is mainly over the central plateau and is surrounded by the divergence zone except in the northwest for TPMI (Figure 6a), DPMI (Figure 6b), and ZyPMI (Figure 6d), but except in the northwest and northeast plateau for QPMI (Figure 6c) and TaPMI (Figure 6f), and except in the northeast plateau for ZjPMI (Figure 6e).

4.3. Effect of TPSM on Regional Precipitation

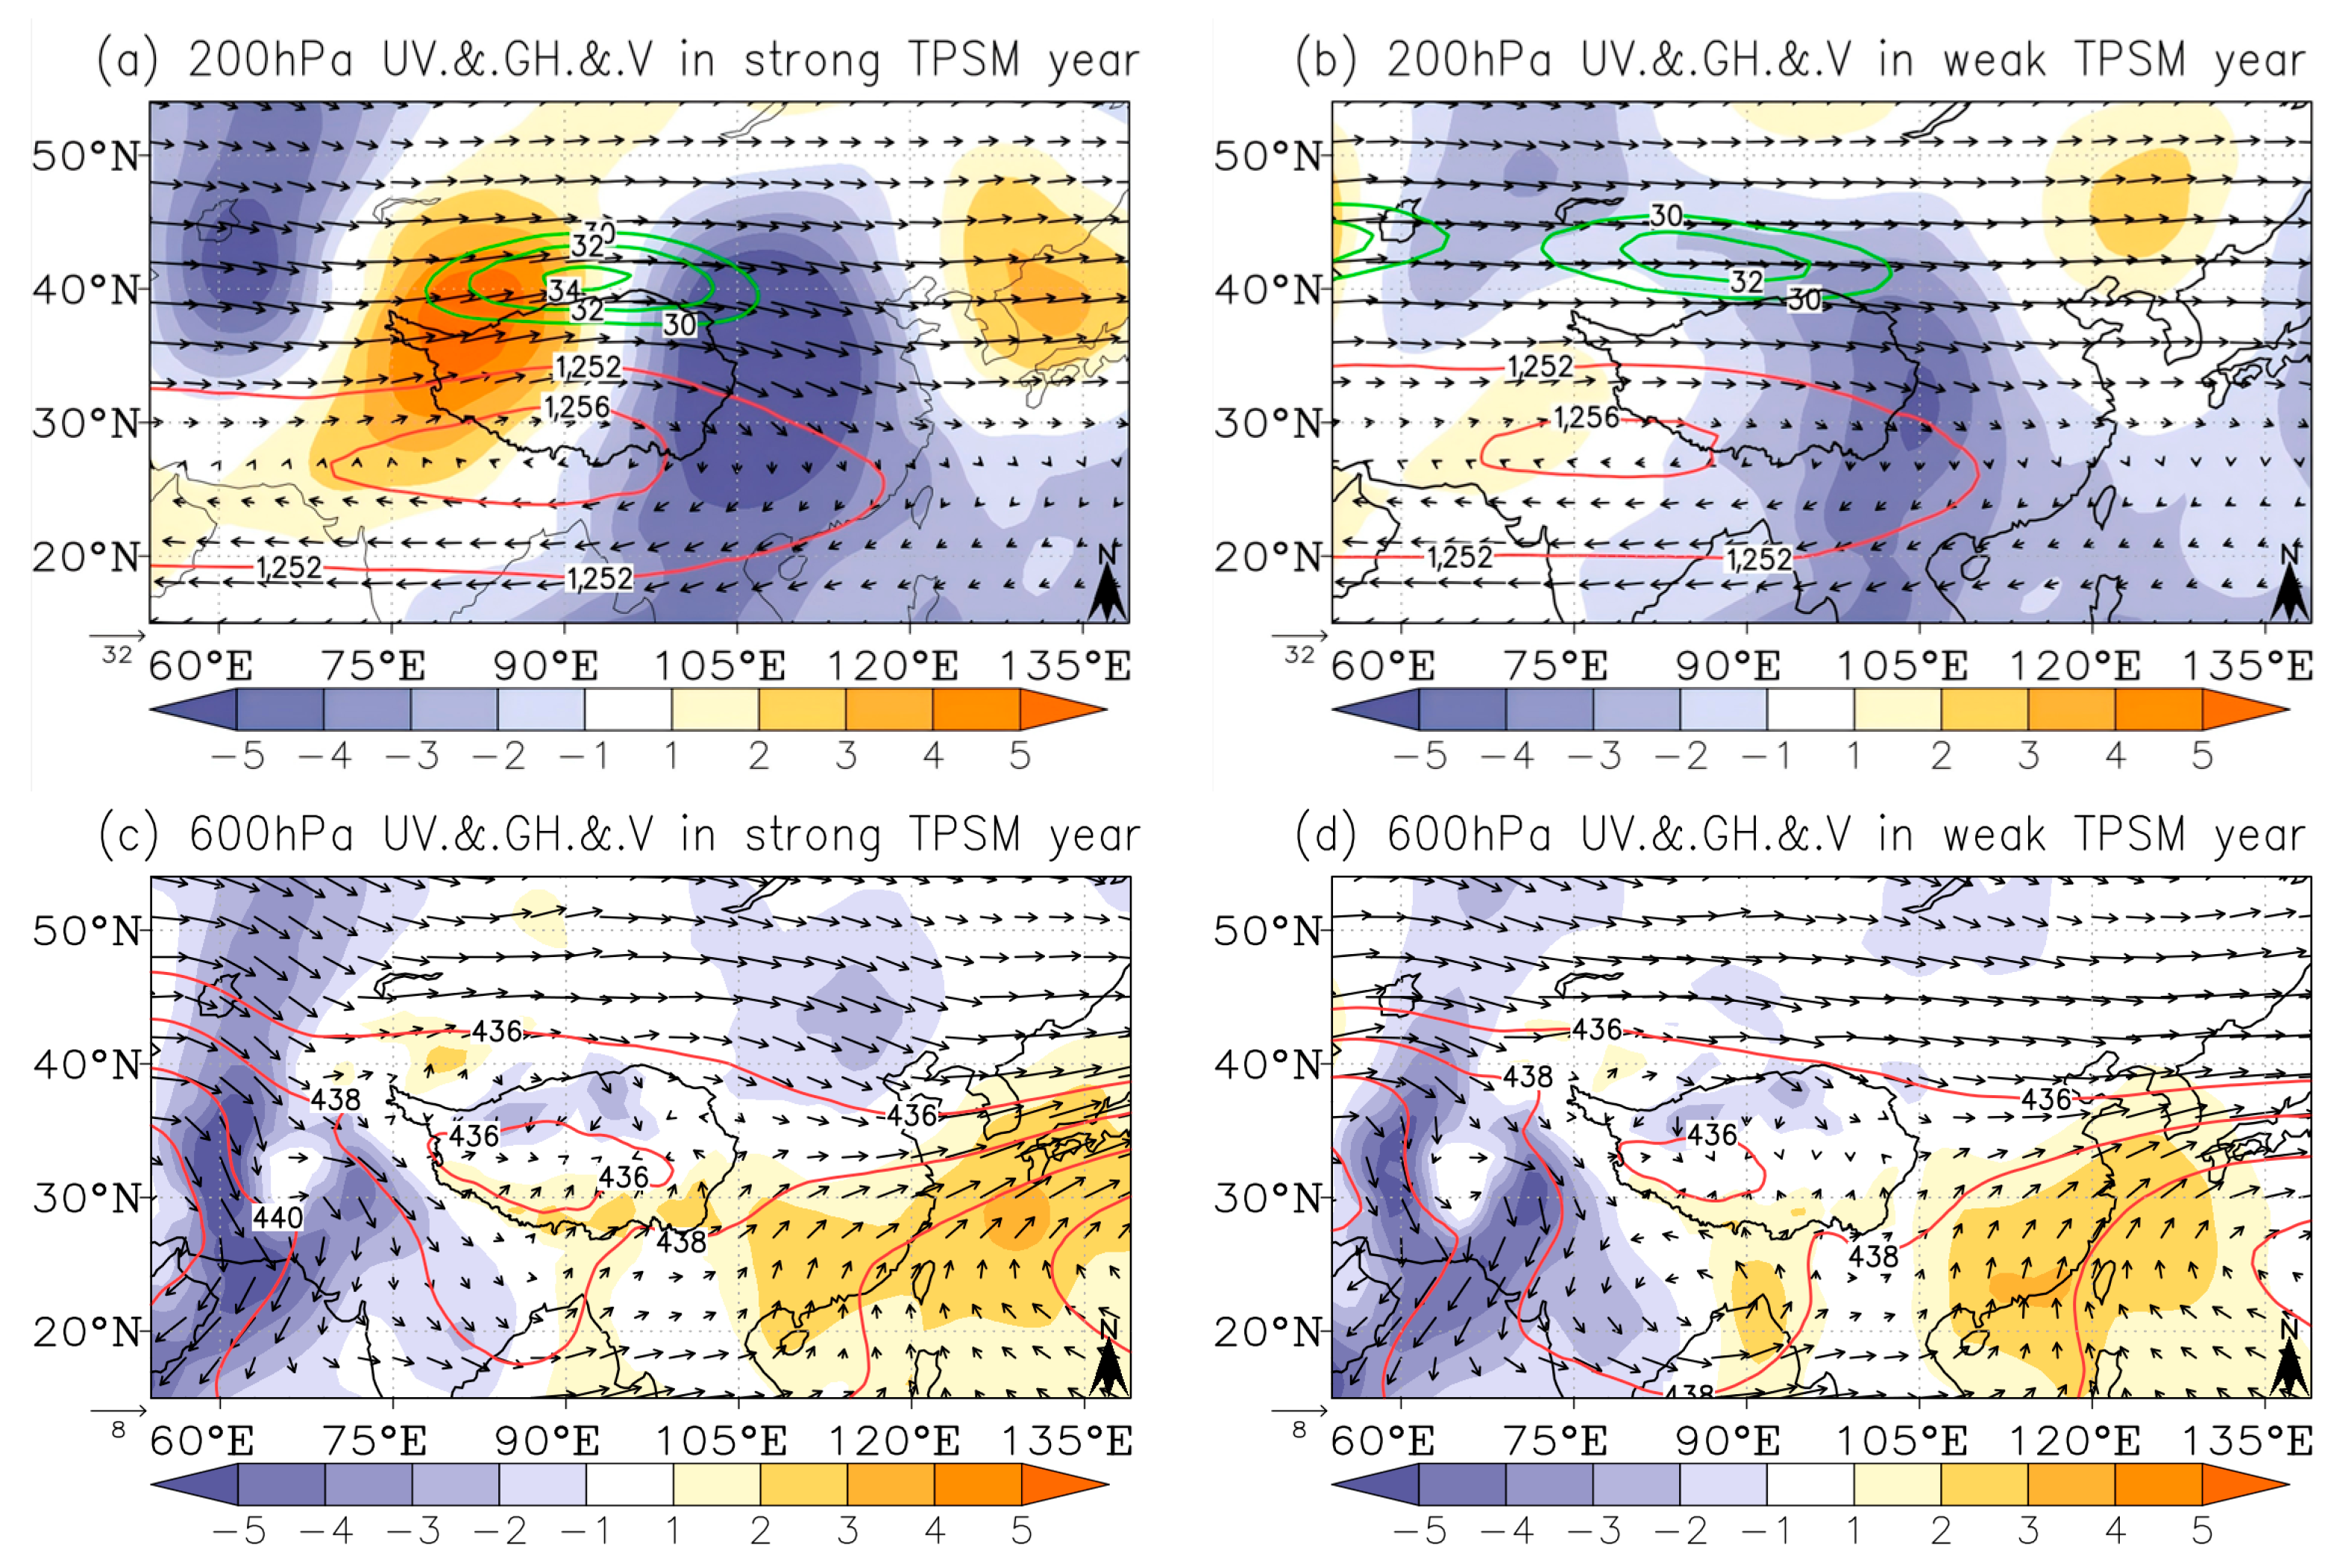
This section, based on the TaPMI, analyzes the underlying mechanisms linking the TPSM and precipitation (Figure 4). It further investigates the impact of the TPSM on precipitation and assesses the TaPMI’s capability in modeling the TPSM. Figure 7 displays composite atmospheric circulation fields for strong and weak TPSM years. During strong years, the 200 hPa South Asian high-pressure system (SAH) was centered over the TP, with its core stabilized near (28° N, 88° E) (Figure 7a). North of the TP, a subtropical upper-level jet stream exhibiting distinct meridional characteristics is evident, with its core (41° N, 90° E) exceeding 34 m/s. A clear wave-like structure (wave train) is apparent in the spatial distribution of meridional winds across the Eurasian continent, extending from Western Europe to Japan. The centers of this wave train, from west to east, are located at (42° N, 62° E), (38° N, 82° E), (36° N, 107° E), and (39° N, 134° E), respectively. This wave train appears to propagate along the subtropical upper-level jet stream over Eurasia. The spatial pattern at 200 hPa during weak TPSM years (Figure 7b) bears a strong resemblance to that during strong years (Figure 7a). However, the SAH core weakened and shifted westward by nearly 10° along 28° N. Additionally, the core of the subtropical upper-level jet stream weakened and shifted northwestwards, resulting in a less distinct wave train. This circulation pattern favors upper-level divergence and provides favorable dynamic conditions for the ascent of lower-level air. This feature is more pronounced during strong TPSM years. Over the TP boundary layer (Figure 7c,d), the westerlies are obstructed by the massive plateau topography, splitting into northern and southern branches along its western edge. These branches then propagate eastwards along the northern and southern flanks of the TP and eventually converge over the middle and lower reaches of the Yangtze River basin. Meanwhile, the western Pacific subtropical high (WPSH) and the monsoon trough to the south of the TP remain quasi-stationary. Due to thermal forcing by the TP, a thermal low forms in the near-surface layer, driving northerly flow from the northern plateau and southerly flow from the southern plateau. This results in significant convergence over the central plateau. Comparing near-surface circulation patterns in strong (Figure 7c) and weak TPSM years (Figure 7d) reveals that, in strong years, the WPSH is displaced markedly westward, the monsoon trough to the south of the TP narrows and intensifies, and near-surface convergence over the TP increases. This suggests that the convergence-forced lifting in the near-surface layer is enhanced during strong TPSM years, establishing conditions more conducive to the development of ascent.
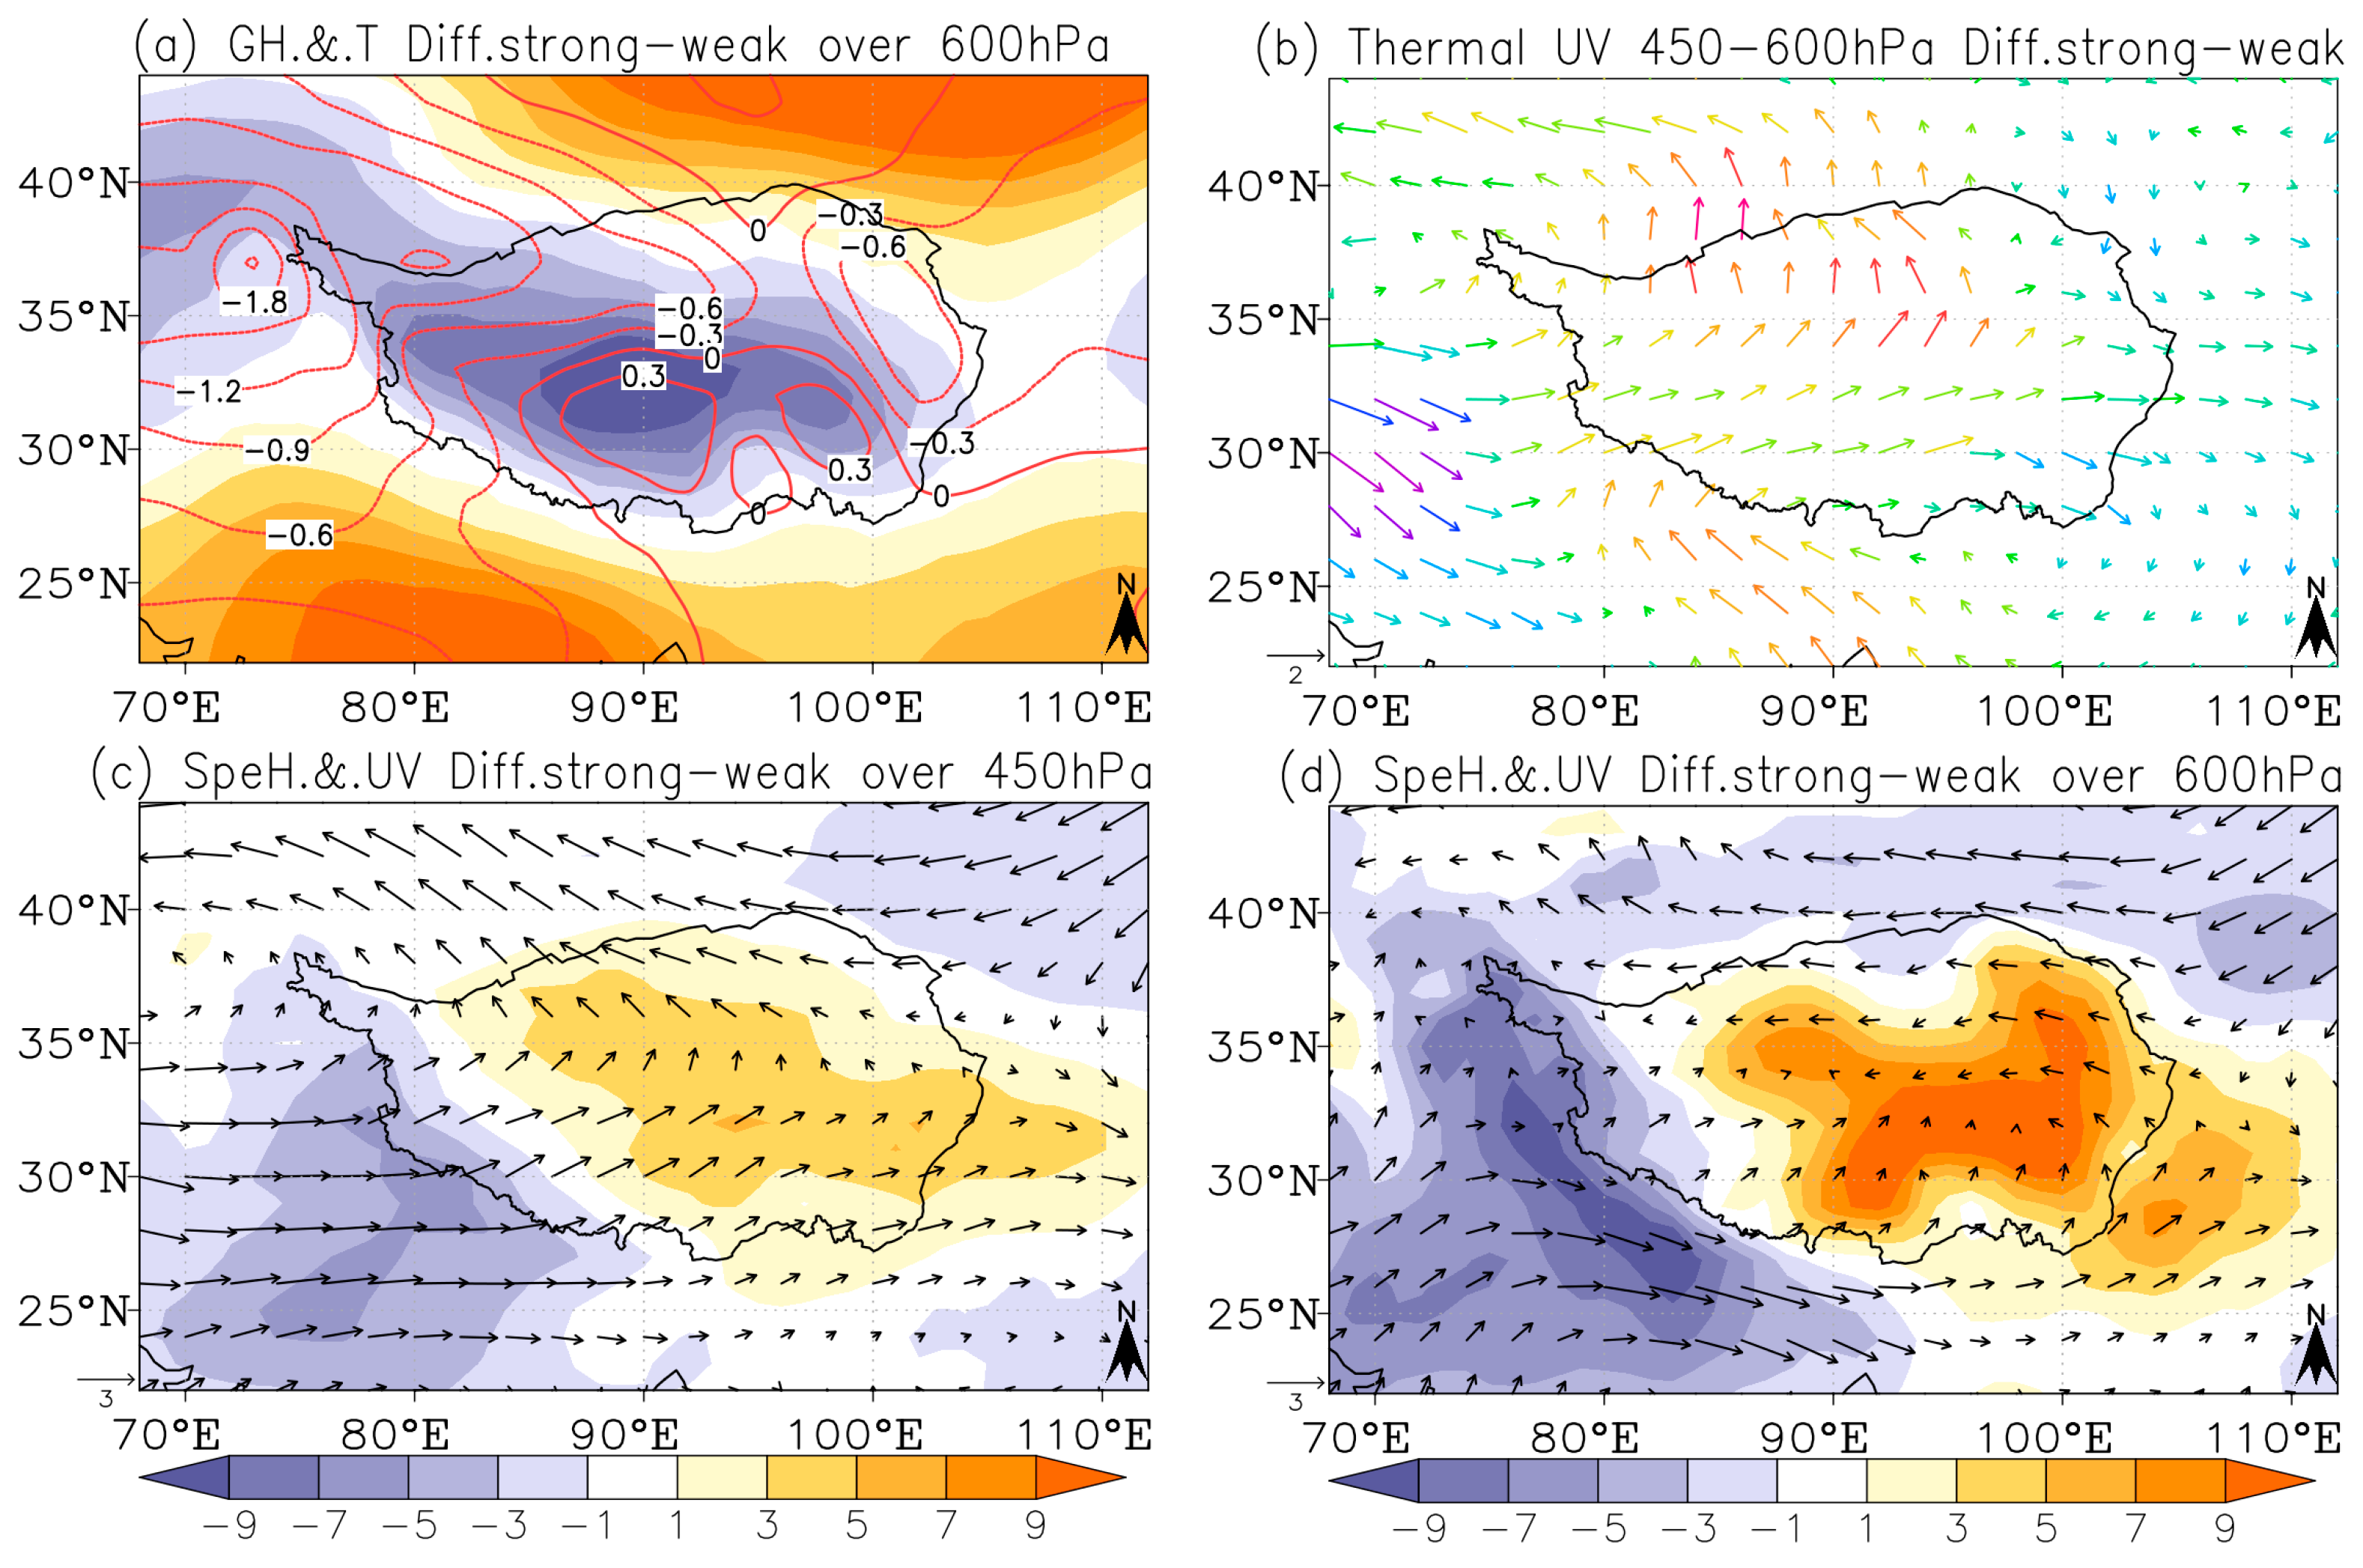
The above analysis demonstrates that uplift conditions for precipitation formation are significantly more favorable during strong TPSM years than during weak years throughout both the near-surface layer and the upper troposphere. Further comparison of key elements (Figure 8) reveals that during strong TPSM years, the near-surface thermal low (Figure 8a), the cold–warm air mass configuration (Figure 8b), wind field convergence and moisture supply (Figure 8c,d) over the TP collectively favor precipitation generation more effectively than in weak years.
In summary, the TaPMI calculation scheme developed in this study, which is based on thermal advection, robustly captures the evolution of TPM in a manner consistent with existing indices and precisely characterizes its impact on atmospheric circulation systems. This demonstrates the validity of the proposed scheme.

4.4. Association of the TPSM with TT

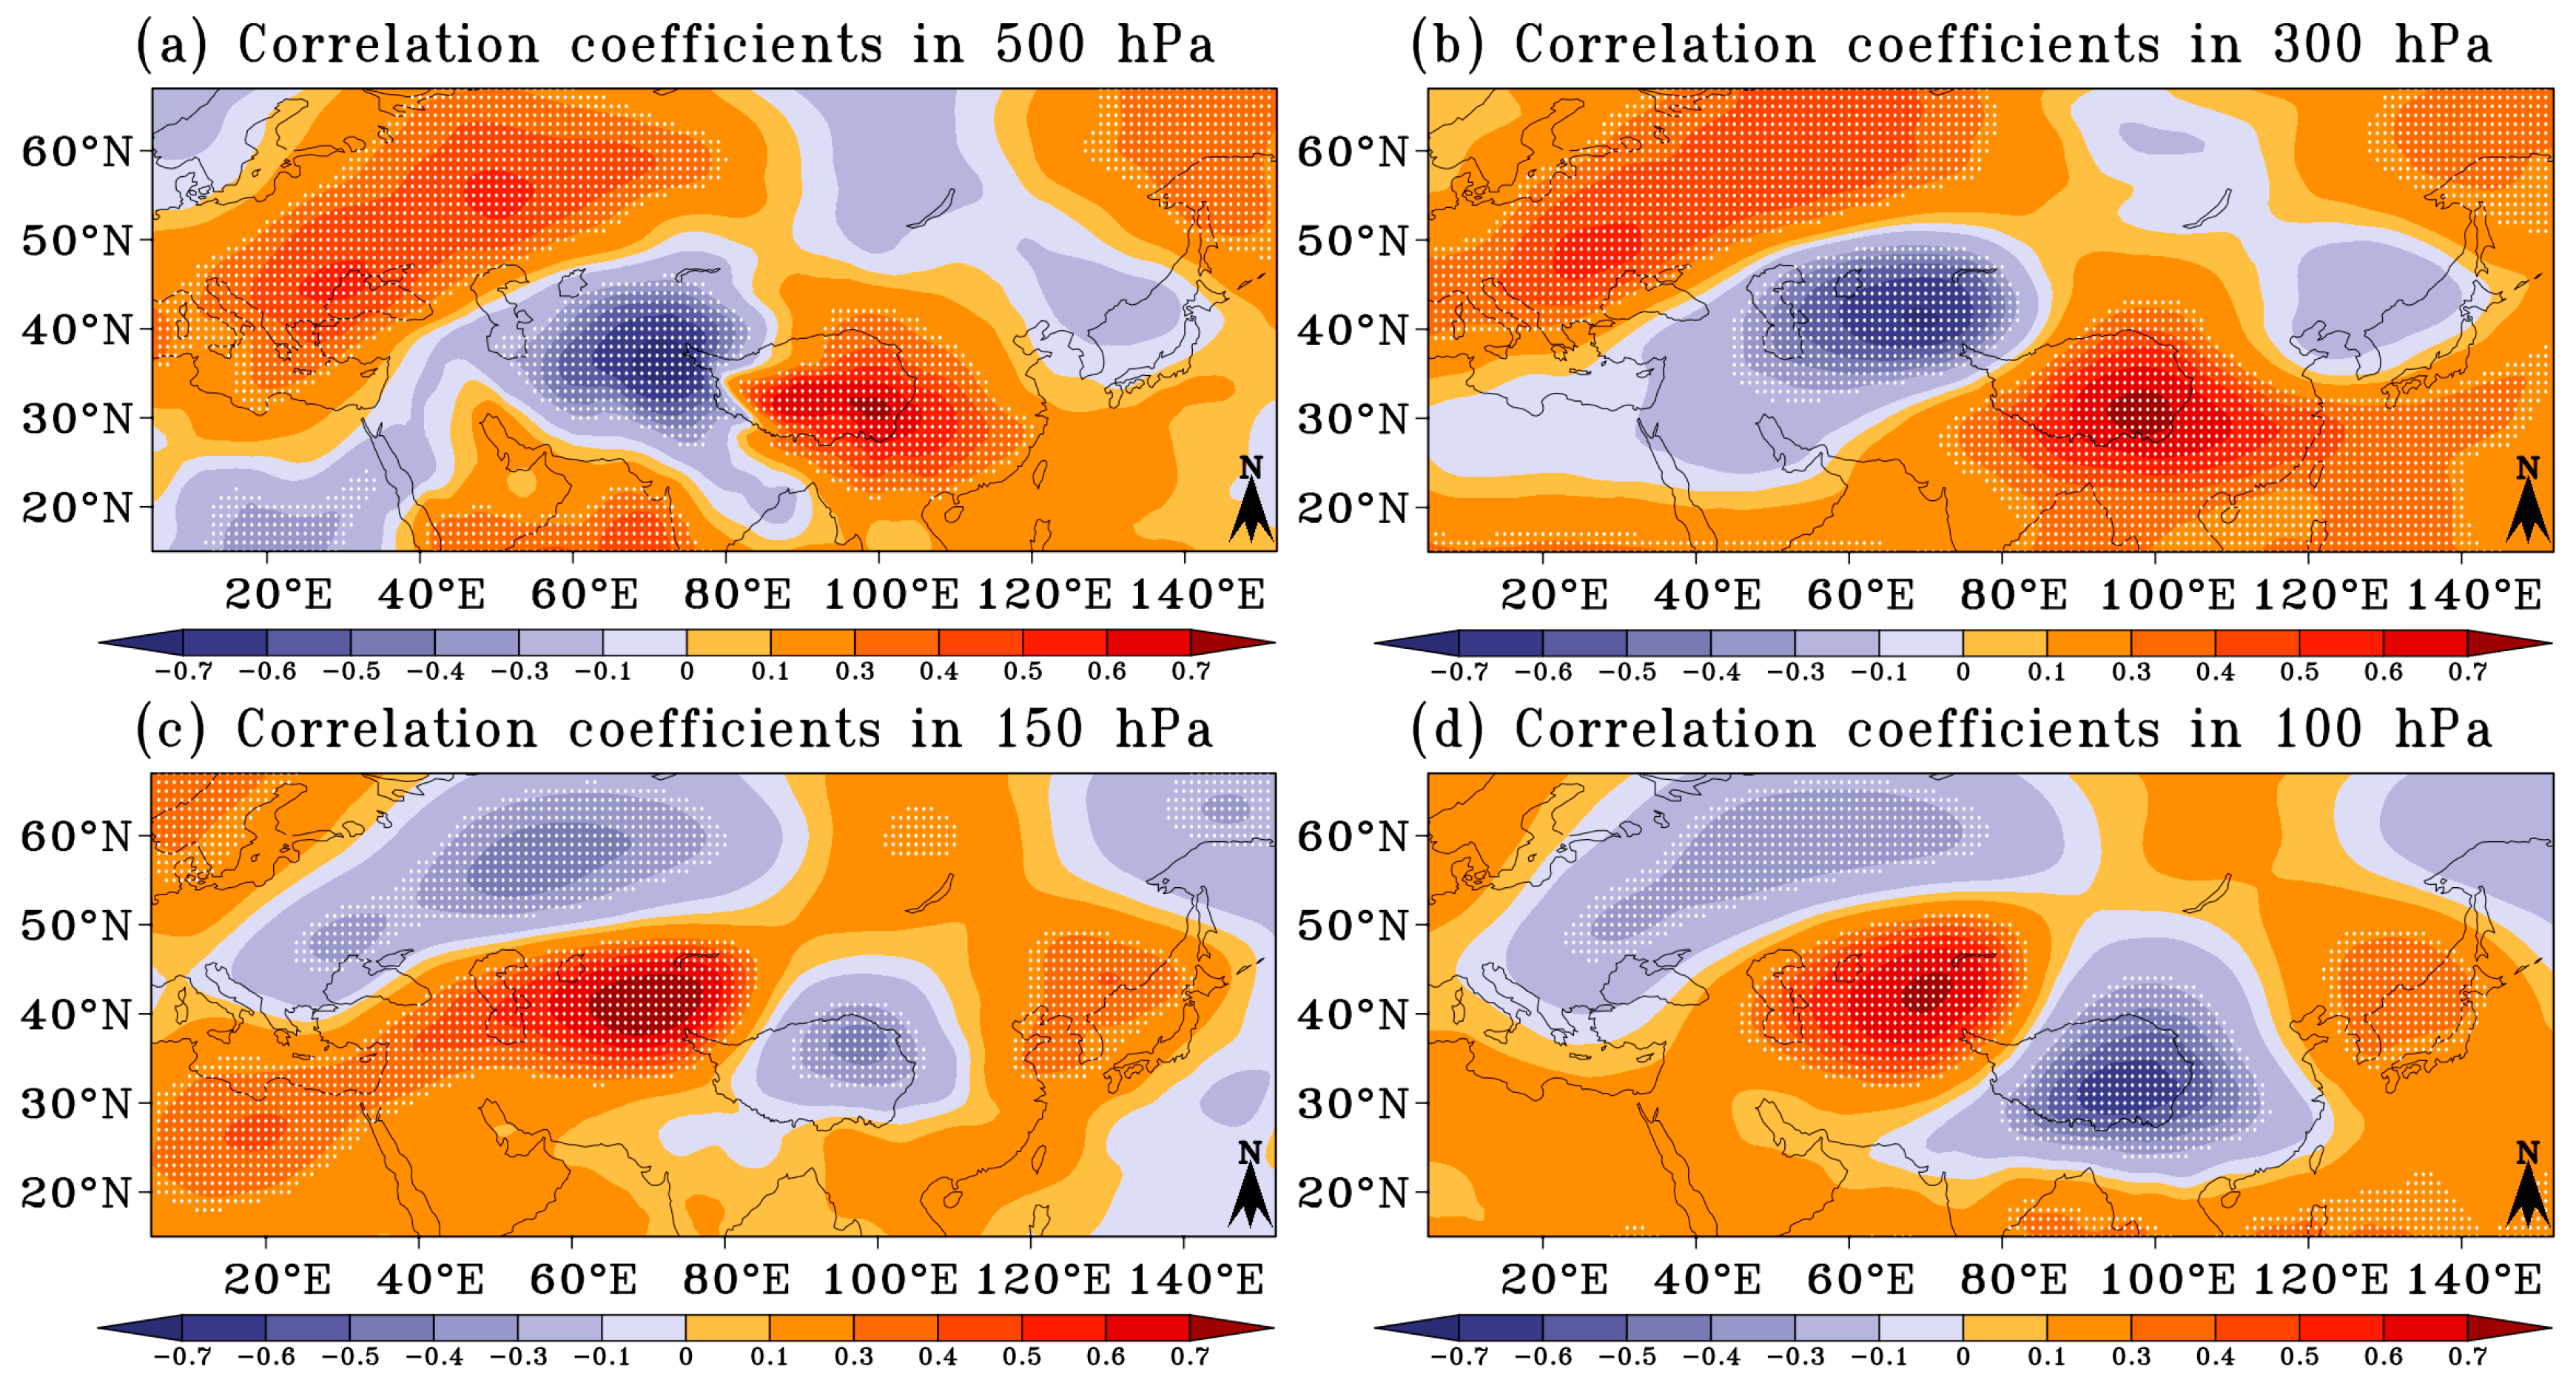
To understand TaPMI and demonstrate its application to TT, it is useful to establish the relationship between TaPMI and TT (Figure 9). Figure 9a shows the correlations between TaPMI and TT over 500 hPa. It can be seen that the correlation in the areal distribution is mainly characterized by a significant positive value in the Eastern European and Western Siberian plains, Southwest China, and the seas east of Japan and an apparent negative value in the Turan Plain, the Iranian Plateau, the central Arabian Peninsula and the northern Sahara. That is, in strong plateau summer monsoon years, the temperature over the eastern European and western Siberian plains, Southwest China, and the seas east of Japan is warmer than normal, and over the Turan Plain, Iranian Plateau, central Arabian Peninsula, and northern Sahara it is cooler than normal, and vice versa in weak plateau summer monsoon years. The correlations of the plateau summer monsoon with the 300 hPa temperature field (Figure 9b) show a similar structure to that of Figure 7a, but the significantly positive value occurs with wider coverage. The distribution of correlation coefficients between TaPMI and temperature above 150 hPa (Figure 9c) and 100 hPa (Figure 9d) shows a similar structure, in opposite phase to that shown in Figure 9a. The correlation in the areal distribution is mainly characterized by a significant negative value in the Eastern European and Western Siberian plains, southwestern China, and the seas east of Japan, and an apparent positive value in the Turan Plain, the Iranian Plateau, the central Arabian Peninsula and the northern Sahara (Figure 9c,d). These correlations show that a strong TaPMI indicates a strong plateau summer monsoon, which favors the dominance of warmer air over the region of the Turan Plain, the Iranian Plateau, the central Arabian Peninsula and the northern Sahara, and colder air over these regions of the Eastern European and Western Siberian plains, Southwest China and the eastern seas.
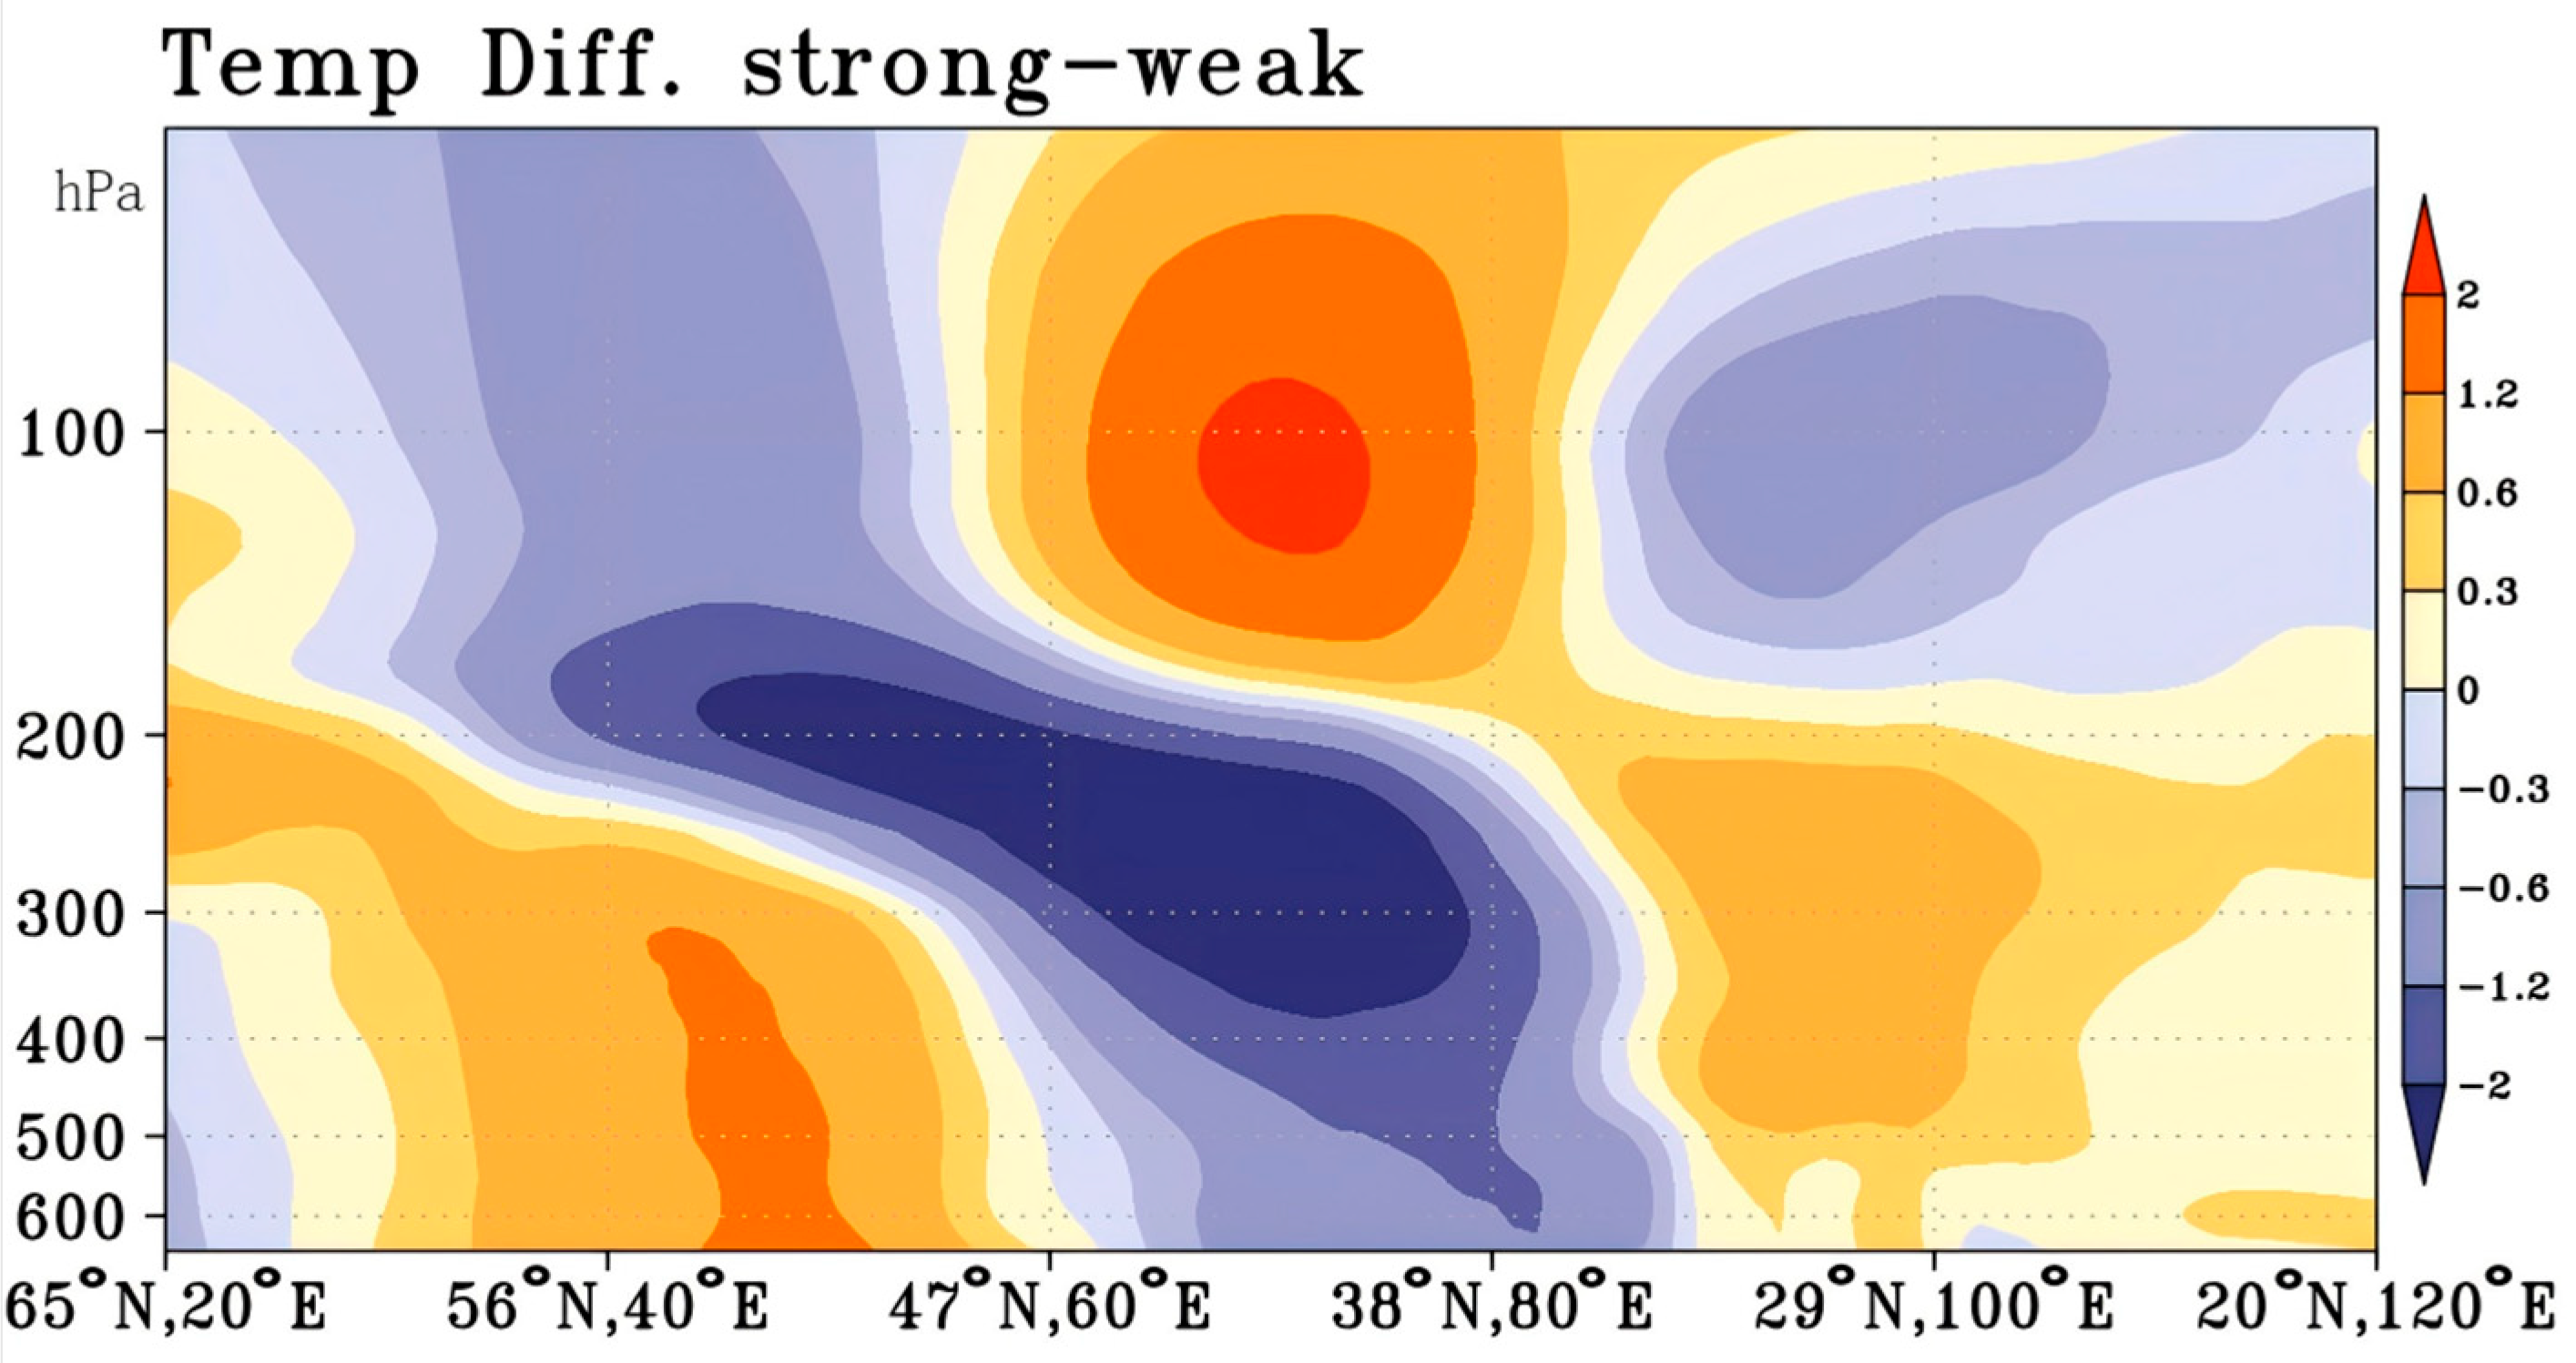
In particular, within the region of (20–50° N, 50–110° E), the region changes more significantly from significant negative (Figure 9a,b) to positive (Figure 9c,d) correlation coefficients in the northwest and from positive (Figure 9a,b) to negative (Figure 9c,d) in the southeast with increasing altitude. Some studies have shown the dipole oscillation feature in this region [53,54]. To further show the TT changes with altitude, the vertical change in temperature difference between strong and weak plateau summer monsoon years is drawn in Figure 10. It is clear that in this region, the dipolar pattern is not only distributed in the horizontal direction but also in the vertical direction. A negative anomalous low-temperature center at 300 hPa and a positive anomalous high-temperature center at 100 hPa are located at 70° E, while a positive anomalous low-temperature center at 300 hPa and a negative anomalous high-temperature center at 100 hPa are located at 95° E. In addition, similar characteristics to the plateau area are observed in the Eastern European and Western Siberian plains. Obviously, the notable anomaly centers are located at (54° N, 42° E), (43° N, 70° E) and (30° N, 96° E), which form a relatively stable structure from northwest to southeast.
Combining Figure 7, Figure 8, Figure 9 and Figure 10 reveals that tropospheric thermal anomalies over the Tibetan Plateau (TP) modulate large-scale atmospheric circulation patterns. This influence extends beyond the East and South Asian monsoons to broader hemispheric-scale regions. As an intense elevated heat source, anomalous plateau heating intensifies the eastern TP thermal low, enhancing low-level warm–moist advection toward East Asia. Concurrently, this heating strengthens deep convective activity south of the TP, reinforcing the monsoon updraft branch and amplifying monsoon rainfall over northern India. The resultant thermal forcing generates atmospheric Rossby wave trains that propagate both upstream and downstream, significantly displacing the subtropical westerly jet core and altering its intensity. These waves establish intercontinental teleconnections for climate variability.

5. Conclusions and Discussion

Based on monthly ERA-Interim reanalysis data and GPCP monthly mean precipitation data, we develop a new plateau monsoon index (TaPMI) that takes into account the dynamic and thermal effects. A contrast analysis between TaPMI and other existing plateau monsoon indices, the response of the atmospheric circulation system to plateau monsoon anomalies, and the correlation between TaPMI and TT are discussed. The conclusions of this study are as follows:
(1)
During the summer, the main body of the plateau is controlled by a strong warm low-pressure system; the geopotential height field spatio-temporal evolution pattern is almost equal to the temperature field over time. The warm center never completely overlaps with the low center, which will cause the redistribution of temperature and pressure fields, leading to temperature advection and affecting the plateau summer monsoon. When the plateau monsoon region is dominated by warm advection, the plateau summer monsoon strengthens, and when cold advection dominates, the plateau summer monsoon weakens.
(2)
Not only is the interannual variability of the plateau monsoon indices very consistent and follows a significant fluctuating upward trend, but also the abrupt change time and the significant enhancement time of the plateau summer monsoon are relatively concentrated. TaPMI has the best correlation with TPMI, next between TaPMI and QPMI, and lower between TaPMI and DPMI. There are some differences in the fluctuation amplitude over time. During the summer, the main body of the plateau is controlled by a strong warm low-pressure system; the geopotential height field spatio-temporal evolution pattern is almost equal to the temperature field over time. The warm center never completely overlaps with the low center, which will cause the redistribution of temperature and pressure fields, leading to temperature advection and affecting the plateau summer monsoon. When the plateau monsoon region is dominated by warm advection, the plateau summer monsoon strengthens, and when cold advection dominates, the plateau summer monsoon weakens.
(3)
The TaPMI effectively reflected meteorological elements and accurately represented climate variability. In strong plateau summer monsoon years, the warm low over the plateau is warmer and deeper, and the southern part of the plateau is dominated by enhanced southerlies associated with the cyclonic flow anomaly, which is shared by the water vapor flux convergence and leads to more precipitation in the main body of the plateau. In weak plateau summer monsoon years, the warm low over the plateau is colder and weaker, and the southern part of the plateau is dominated by enhanced northerlies associated with the anti-cyclonic flow anomaly, which is shared by the water vapor flux divergence and leads to less precipitation in the main body of the plateau.
(4)
There is a wave-like stable structure that appears over the Eurasian continent from the East European Plain to the plateau, and the correlation coefficients show a significant phase shift between the higher and lower levels in the vertical direction. In strong plateau summer monsoon years, the temperature over the Eastern European and Western Siberian plains, Southwest China and the seas east of Japan is warmer, and over the Turan Plain, Iranian plateau, central Arabian Peninsula and northern Sahara it is cooler than normal below 200 hPa and the opposite above 200 hPa. The distribution in weak plateau summer monsoon years is opposite to that in strong plateau summer monsoon years. In particular, within the plateau and western region, the dipolar pattern is distributed not only horizontally but also vertically.
The above results show that the TaPMI is similar to other calculation methods; not only can it quantitatively reflect the spatio-temporal evolution of the plateau monsoon, but it can also be used to discuss the correlations between the atmospheric circulation and the plateau monsoon. This study systematically investigated the interannual variability of the TPMI, but its predictability on sub-seasonal timescales remains to be explored. Future research should focus on integrating high-resolution boundary layer data from the TP 3D Observational Network to quantitatively analyze the regulatory mechanism of thermal adaptation hysteresis on monsoon onset. It should also aim to develop a dynamic coupling module between the TaPMI and Earth system models to improve representation of cross-scale interactions. The TaPMI diagnostic framework can be used to provide a quantitative indication of plateau thermal forcing. Integrating it into regional climate models could significantly enhance the accuracy of simulations of the East Asian monsoon system. A TaPMI-based drought/flood risk assessment model could provide scientific support for early warning systems and inform the construction of ecological security barriers on the TP by offering threshold references for climate adaptation measures, such as vegetation restoration.

Author Contributions

Conceptualization, X.X., Z.H. (Zeyong Hu) and M.Z.; data curation, X.X. and F.Z.; formal analysis, X.X. and R.L.; funding acquisition, X.X. and Z.H. (Zeyong Hu); methodology, X.X., Z.H. (Zeyong Hu), F.Z. and M.Z.; project administration, X.X. and Z.H. (Zeyong Hu); resources, X.X., Z.H. (Zeyong Hu) and Z.H. (Zhongqiang Han); writing—original draft, X.X., Z.H. (Zeyong Hu) and Z.H. (Zhongqiang Han); writing—review and editing, X.X. and Z.H. (Zeyong Hu). All authors have read and agreed to the published version of the manuscript.

Funding

This work was funded by the National Natural Science Foundation of China (42365003 and 42330609), the Science and Technology Projects of Xizang Autonomous Region, China (XZ202501JD0022) and the Natural Science Foundation of the Inner Mongolia Autonomous Region (2020MS04008).

Institutional Review Board Statement

Not applicable.

Informed Consent Statement

Not applicable.

Data Availability Statement

The data presented in this study are openly available in ERA-Interim at https://www.ecmwf.int/.

Acknowledgments

The authors would like to thank the editor and anonymous reviewers for their help.

Conflicts of Interest

The authors declare no conflicts of interest.

References

  1. Qiu, J. Tibetan plateau gets wired up for monsoon prediction. Nature 2014, 514, 16. [Google Scholar] [CrossRef]
  2. Liu, X.; Dong, B. Influence of the Tibetan Plateau uplift on the Asian monsoon-arid environment evolution. Chin. Sci. Bulletin. 2013, 58, 4277–4291. [Google Scholar] [CrossRef]
  3. Liu, X.; Guo, Q.; Guo, Z.; Yin, Z.; Dong, B.; Smith, R. Where were the monsoon regions and arid zones in Asia prior to the Tibetan Plateau uplift? Natl. Sci. Rev. 2015, 2, 403–416. [Google Scholar] [CrossRef]
  4. Li, J.; Sun, Z.; Liu, Y.; You, Q.; Chen, G.; Bao, Q. Top-of-atmosphere radiation budget and cloud radiative effects over the Tibetan plateau and adjacent monsoon regions from CMIP6 simulations. J. Geophys. Res. Atmos. 2021, 126, e2020JD034345. [Google Scholar] [CrossRef]
  5. Luo, H.; Wang, Z.; He, C.; Chen, D.; Yang, S. Future changes in South Asian summer monsoon circulation under global warming: Role of the Tibetan Plateau latent heating. Npj Clim. Atmos. Sci. 2024, 7, 103. [Google Scholar] [CrossRef]
  6. Ye, D.Z.; Luo, S.W.; Zhu, B.Z. The wind structure and heat balance in the lower troposphere over Tibetan Plateau and its surrounding. J. Meteorol. Res. 1957, 28, 108–121. [Google Scholar] [CrossRef]
  7. Xu, S.Y.; Gao, Y.X. The monsoon phenomenon in Tibetan Plateau. Acta Geogr. Sin. 1962, 28, 111–123. [Google Scholar] [CrossRef]
  8. Tang, M.C.; Shen, Z.B.; Chen, Y.Y. On climatic characteristics of the Xizang Plateau monsoon. Acta Geogr. Sin. 1979, 34, 33–42. [Google Scholar] [CrossRef]
  9. Tang, M.C.; Liang, J.; Shao, M.J.; Shi, G. Preliminary analysis on inter-annual variation of Plateau monsoon. Plateau Meteorol. 1984, 3, 76–82. (In Chinese) [Google Scholar]
  10. Tang, M. Some advances on the research of plateau monsoon (a reiview). Plateau Meteorol. 1993, 12, 95–101. [Google Scholar]
  11. Tang, M. Discussion on inter-decade oscillation of plateau monsoon and its causes. Sci. Meteorol. Sin. 1995, 15, 64–68. [Google Scholar]
  12. Qi, D.M.; Li, Y.Q.; Bai, Y.Y.; De, D. The definition of plateau summer monsoon index and analysis on its characteristics. Plateau Mt. Meteorol. Res. 2009, 29, 1–9. [Google Scholar]
  13. Tian, J.; Ma, Z.F.; Fan, G.Z.; Chen, X.T. Relationship between a new plateau monsoon index and summer precipitation in Sichuan basin. Sci. Meteorol. Sinica. 2010, 30, 308–315. [Google Scholar]
  14. Xun, X.; Hu, Z.; Ma, Y. The dynamic plateau monsoon index and its association with general circulation anomalies. Adv. Atmos. Sci. 2012, 29, 1249–1263. [Google Scholar] [CrossRef]
  15. Wang, Y.; Li, D.; Wang, H.; Zheng, R. New Variation Characteristics of Winter Monsoon over Qinghai-Xizang Plateau and Its Influences on Temperature over Southwest China. Plateau Meteorol. 2015, 34, 11–20. [Google Scholar] [CrossRef]
  16. Zhou, Y.; Fan, G.Z.; Hua, W.; Wang, B.Y.; Zhu, L.H.; Zhou, D.W. Distribution Characteristics of Plateau Monsoon and a Contrastive Analysis of Plateau Monsoon Index. Plateau Meteorol. 2015, 34, 1517–1530. [Google Scholar] [CrossRef]
  17. Zhang, S.; Lv, S.; Ao, Y.; Ma, D. A New Plateau Monsoon Index Based on Wind Dynamicl Normalized Seasonality and Its Application. Plateau Meteorol. 2015, 34, 881–889. [Google Scholar] [CrossRef]
  18. Zhou, J.; Wen, J.; Wang, X.; Jia, D.; Chen, J. Analysis of the Qinghai-Xizang Plateau monsoon evolution and its linkages with soil moisture. Remote Sens. 2016, 8, 493. [Google Scholar] [CrossRef]
  19. Pang, Y.S.; Ma, Z.F.; Yan, S.Q. Discussion of Plateau monsoon index and its impact on precipitation in Sichuan Basin in midsummer. Plateau Meteror. 2017, 36, 886–899. [Google Scholar]
  20. Zhang, S.; Lü, S.; Zhao, Y.; Yang, X. An improvement of the Plateau monsoon index based on seasonal variation of wind and its comparison with other indexes. Aeta Meteorol. Sin. 2019, 77, 315–326. [Google Scholar] [CrossRef]
  21. Xu, L.; Li, D.L.; Hu, Z. Relationship between the Snow Cover Day and Monsoon Index in Tibetan Plateau. Plateau Meteorol. 2010, 29, 1093–1101. [Google Scholar]
  22. Zhao, H.; Moore, G. On the relationship between Tibetan snow cover, the Tibetan plateau monsoon and the Indian summer monsoon. Geophys. Res. Lett. 2004, 31, L14204. [Google Scholar] [CrossRef]
  23. Duan, A.; Hu, J.; Xiao, Z. The Tibetan Plateau Summer Monsoon in the CMIP5 Simulations. J. Clim. 2013, 26, 7747–7766. [Google Scholar] [CrossRef]
  24. Vaid, B.H.; Kripalani, R.H. Monsoon 2020: An interaction of upper tropospheric thermodynamics and dynamics over the Tibetan Plateau and the Western Pacific. Pure Appl. Geophys. 2021, 178, 3645–3654. [Google Scholar] [CrossRef]
  25. Xu, L.; Li, Z. Impacts of the Wave Train along the Asian Jet on the South China Sea Summer Monsoon Onset. Atmosphere 2021, 12, 1227. [Google Scholar] [CrossRef]
  26. Fan, W.; Hu, Z.; Ma, W.; Ma, Y.; Yang, Y.; Yu, H.; Han, X. Impacts of mid-high latitude atmospheric teleconnection patterns on interannual variation of the Tibetan Plateau summer monsoon. Atmos. Res. 2022, 275, 106219. [Google Scholar] [CrossRef]
  27. Wei, H.; Fan, G.; Wang, B. Variation of Tibetan Plateau summer monsoon and its effect on precipitation in East China. Chin. J. Atmos. Sci. 2012, 36, 784–794. [Google Scholar] [CrossRef]
  28. Cen, S.; Gong, Y.; Lai, X.; Qi, D. The relationship of the thermal contrast between the eastern Tibetan Plateau and itsnorthern side with the plateau monsoon and the precipitation in the Yangtze river basin in summer. Acia Meteorol. Sin. 2014, 72, 256–265. [Google Scholar]
  29. Ge, F.; Sielmann, F.; Zhu, X.; Fraedrich, K.; Zhi, X.; Peng, T.; Wang, L. The link between Tibetan Plateau monsoon and Indian summer precipitation: A linear diagnostic perspective. Clim. Dyn. 2017, 49, 4201–4215. [Google Scholar] [CrossRef]
  30. Zhang, S.; Meng, L.; Zhao, Y.; Yang, X.; Huang, A. The influence of the Tibetan Plateau monsoon on summer precipitation in Central Asia. Front. Earth Sci. 2022, 10, 771104. [Google Scholar] [CrossRef]
  31. Wang, G.; Hu, Z.; Yu, H.; Sun, G.; Fan, W.; Niu, R.; Zhang, B. Tibetan Plateau Vortex Activity Its Relationship with the Tibetan Plateau Summer Monsoon Precipitation. Int. J. Climatol. 2024, 45, e8713. [Google Scholar] [CrossRef]
  32. Qi, D.; Li, Y. The major progress of the plateau monsoon study and its significant. Arid. Meteorol. 2007, 25, 74–79. [Google Scholar]
  33. Li, Y. The observational basis of the 3rd Tibetan plateau atmospheric scientific experiment. Plateau Mt. Meteor. Res. 2011, 31, 77–82. [Google Scholar]
  34. Hersbach, H.; Bell, B.; Berrisford, P.; Hirahara, S.; Horányi, A.; Muñoz-Sabater, J.; Nicolas, J.; Peubey, C.; Radu, R.; Schepers, D. The ERA5 global reanalysis. Q. J. R. Meteorol. Soc. 2020, 146, 1999–2049. [Google Scholar] [CrossRef]
  35. Dee, D.P.; Uppala, S.; Simmons, A.J.; Berrisford, P.; Poli, P.; Kobayashi, S.; Andrae, U.; Balmaseda, M.A.; Balsamo, G.; Bauer, D.P. The ERA-Interim reanalysis: Configuration and performance of the data assimilation system. Q. J. R. Meteorol. Soc. 2011, 137, 553–597. [Google Scholar] [CrossRef]
  36. Liu, L.; Gu, H.; Xie, J.; Xu, Y.P. How well do the ERA-Interim, ERA-5, GLDAS-2.1 and NCEP-R2 reanalysis datasets represent daily air temperature over the Tibetan Plateau? Int. J. Climatol. 2020, 41, 1484–1505. [Google Scholar] [CrossRef]
  37. Liu, Z.; Liu, Y.; Wang, S.; Yang, X.; Wang, L.; Muhammad, H.A.B.; Chi, W.; Wang, Z. Evaluation of spatial and temporal performances of ERA-Interim precipitation and temperature in mainland China. J. Clim. 2018, 31, 4347–4365. [Google Scholar] [CrossRef]
  38. Simmons, A.J.; Berrisford, P.; Dee, D.P.; Hersbach, H.; Hirahara, S.; Thépaut, J.N. A reassessment of temperature variations and trends from global reanalyses and monthly surface climatological datasets. Q. J. R. Meteorol. Soc. 2017, 143, 101–119. [Google Scholar] [CrossRef]
  39. Bell, B.; Hersbach, H.; Simmons, A.; Berrisford, P.; Dahlgren, P.; Horányi, A.; Muñoz-Sabater, J.; Nicolas, J.; Radu, R.; Schepers, D.; et al. The ERA5 global reanalysis: Preliminary extension to 1950. Q. J. R. Meteorol. Soc. 2021, 147, 4186–4227. [Google Scholar] [CrossRef]
  40. Tarek, M.; Brissette, F.P.; Arsenault, R. Evaluation of the ERA5 reanalysis as a potential reference dataset for hydrological modelling over North America. Hydrol. Earth Syst. Sci. 2020, 24, 2527–2544. [Google Scholar] [CrossRef]
  41. Albergel, C.; Dutra, E.; Munier, S.; Calvet, J.C.; Munoz-Sabater, J.; de Rosnay, P.; Balsamo, G. ERA-5 and ERA-Interim driven ISBA land surface model simulations: Which one performs better? Hydrol. Earth Syst. Sci. 2018, 22, 3515–3532. [Google Scholar] [CrossRef]
  42. Robert, A.; Mathew, S.; George, H.; Wang, J.J.; Gu, G.; David, B.; Long, C.; Udo, S.; Andreas, B.; Eric, N. The Global Precipitation Climatology Project (GPCP) Monthly Analysis (New Version 2.3) and a Review of 2017 Global Precipitation. Atmosphere 2018, 9, 138. [Google Scholar] [CrossRef]
  43. Zhao, Y.; Xu, X.D.; Zhao, T.L.; Xu, H.X.; Mao, F.; Sun, H.; Wang, Y.H. Extreme precipitation events in East China and associated moisture transport pathways. Sci. China Earth Sci. 2016, 59, 1854–1872. [Google Scholar] [CrossRef]
  44. Wei, F.Y. Technology of Statistical Diagnosis and Prediction of Modern Climate; China Meteorological Press: Beijing, China, 1999. [Google Scholar]
  45. Smadi, M.M.; Ahmed, Z. A Sudden Change in Rainfall Characteristics in Amman, Jordan During the Mid 1950s. Am. J. Environ. Sci. 2006, 2, 84–91. [Google Scholar] [CrossRef]
  46. Chen, Q.S.; Bromwich, D.H. An Equivalent Isobaric Geopotential Height and Its Application to Synoptic Analysis and a Generalized ω Equation in σ Coordinates. Mon. Weather Rev. 2010, 127, 145–172. [Google Scholar] [CrossRef]
  47. Zhang, B.; Linz, M.; Chen, G. Interpreting Observed Temperature Probability Distributions Using a Relationship between Temperature and Temperature Advection. J. Clim. 2022, 35, 20. [Google Scholar] [CrossRef]
  48. Martineau, P.; Behera, S.K.; Nonaka, M.; Nakamura, H.; Kosaka, Y. Seasonally dependent increases in subweekly temperature variability over Southern Hemisphere landmasses detected in multiple reanalyses. Weather Clim. Dyn. 2024, 5, 1–15. [Google Scholar] [CrossRef]
  49. Garfinkel, C.I.; Rostkier Edelstein, D.; Morin, E.; Hochman, A.; Schwartz, C.; Nirel, R. Precursors of summer heat waves in the Eastern Mediterranean. Q. J. R. Meteorol. Soc. 2024, 150, 3757–3773. [Google Scholar] [CrossRef]
  50. Liang, G.; Li, D. Objective Identifying and Activity Characteristics of Qinghai-Tibetan Plateau Vortex. Plateau Meteorol. 2019, 1, 55–65. [Google Scholar] [CrossRef]
  51. Liu, J.; Wang, S.; Yu, S.; Yang, D.; Zhang, L. Climate warming and growth of high-elevation inland lakes on the Tibetan Plateau. Glob. Planet. Change 2009, 67, 209–217. [Google Scholar] [CrossRef]
  52. Li, J. A unified monsoon index. Geophys. Res. Lett. 2002, 29, 111–115. [Google Scholar] [CrossRef]
  53. Vaid, B.H.; Liang San, X. The changing relationship between the convection over the western Tibetan Plateau and the sea surface temperature in the northern Bay of Bengal. Tellus A Dyn. Meteorol. Oceanogr. 2018, 70, 1440869. [Google Scholar] [CrossRef]
  54. Vaid, B.H.; Liang San, X. Influence of tropospheric temperature gradient on the boreal wintertime precipitation over East Asia. Terr. Atmos. Ocean. Sci. 2019, 30, 161–170. [Google Scholar] [CrossRef]
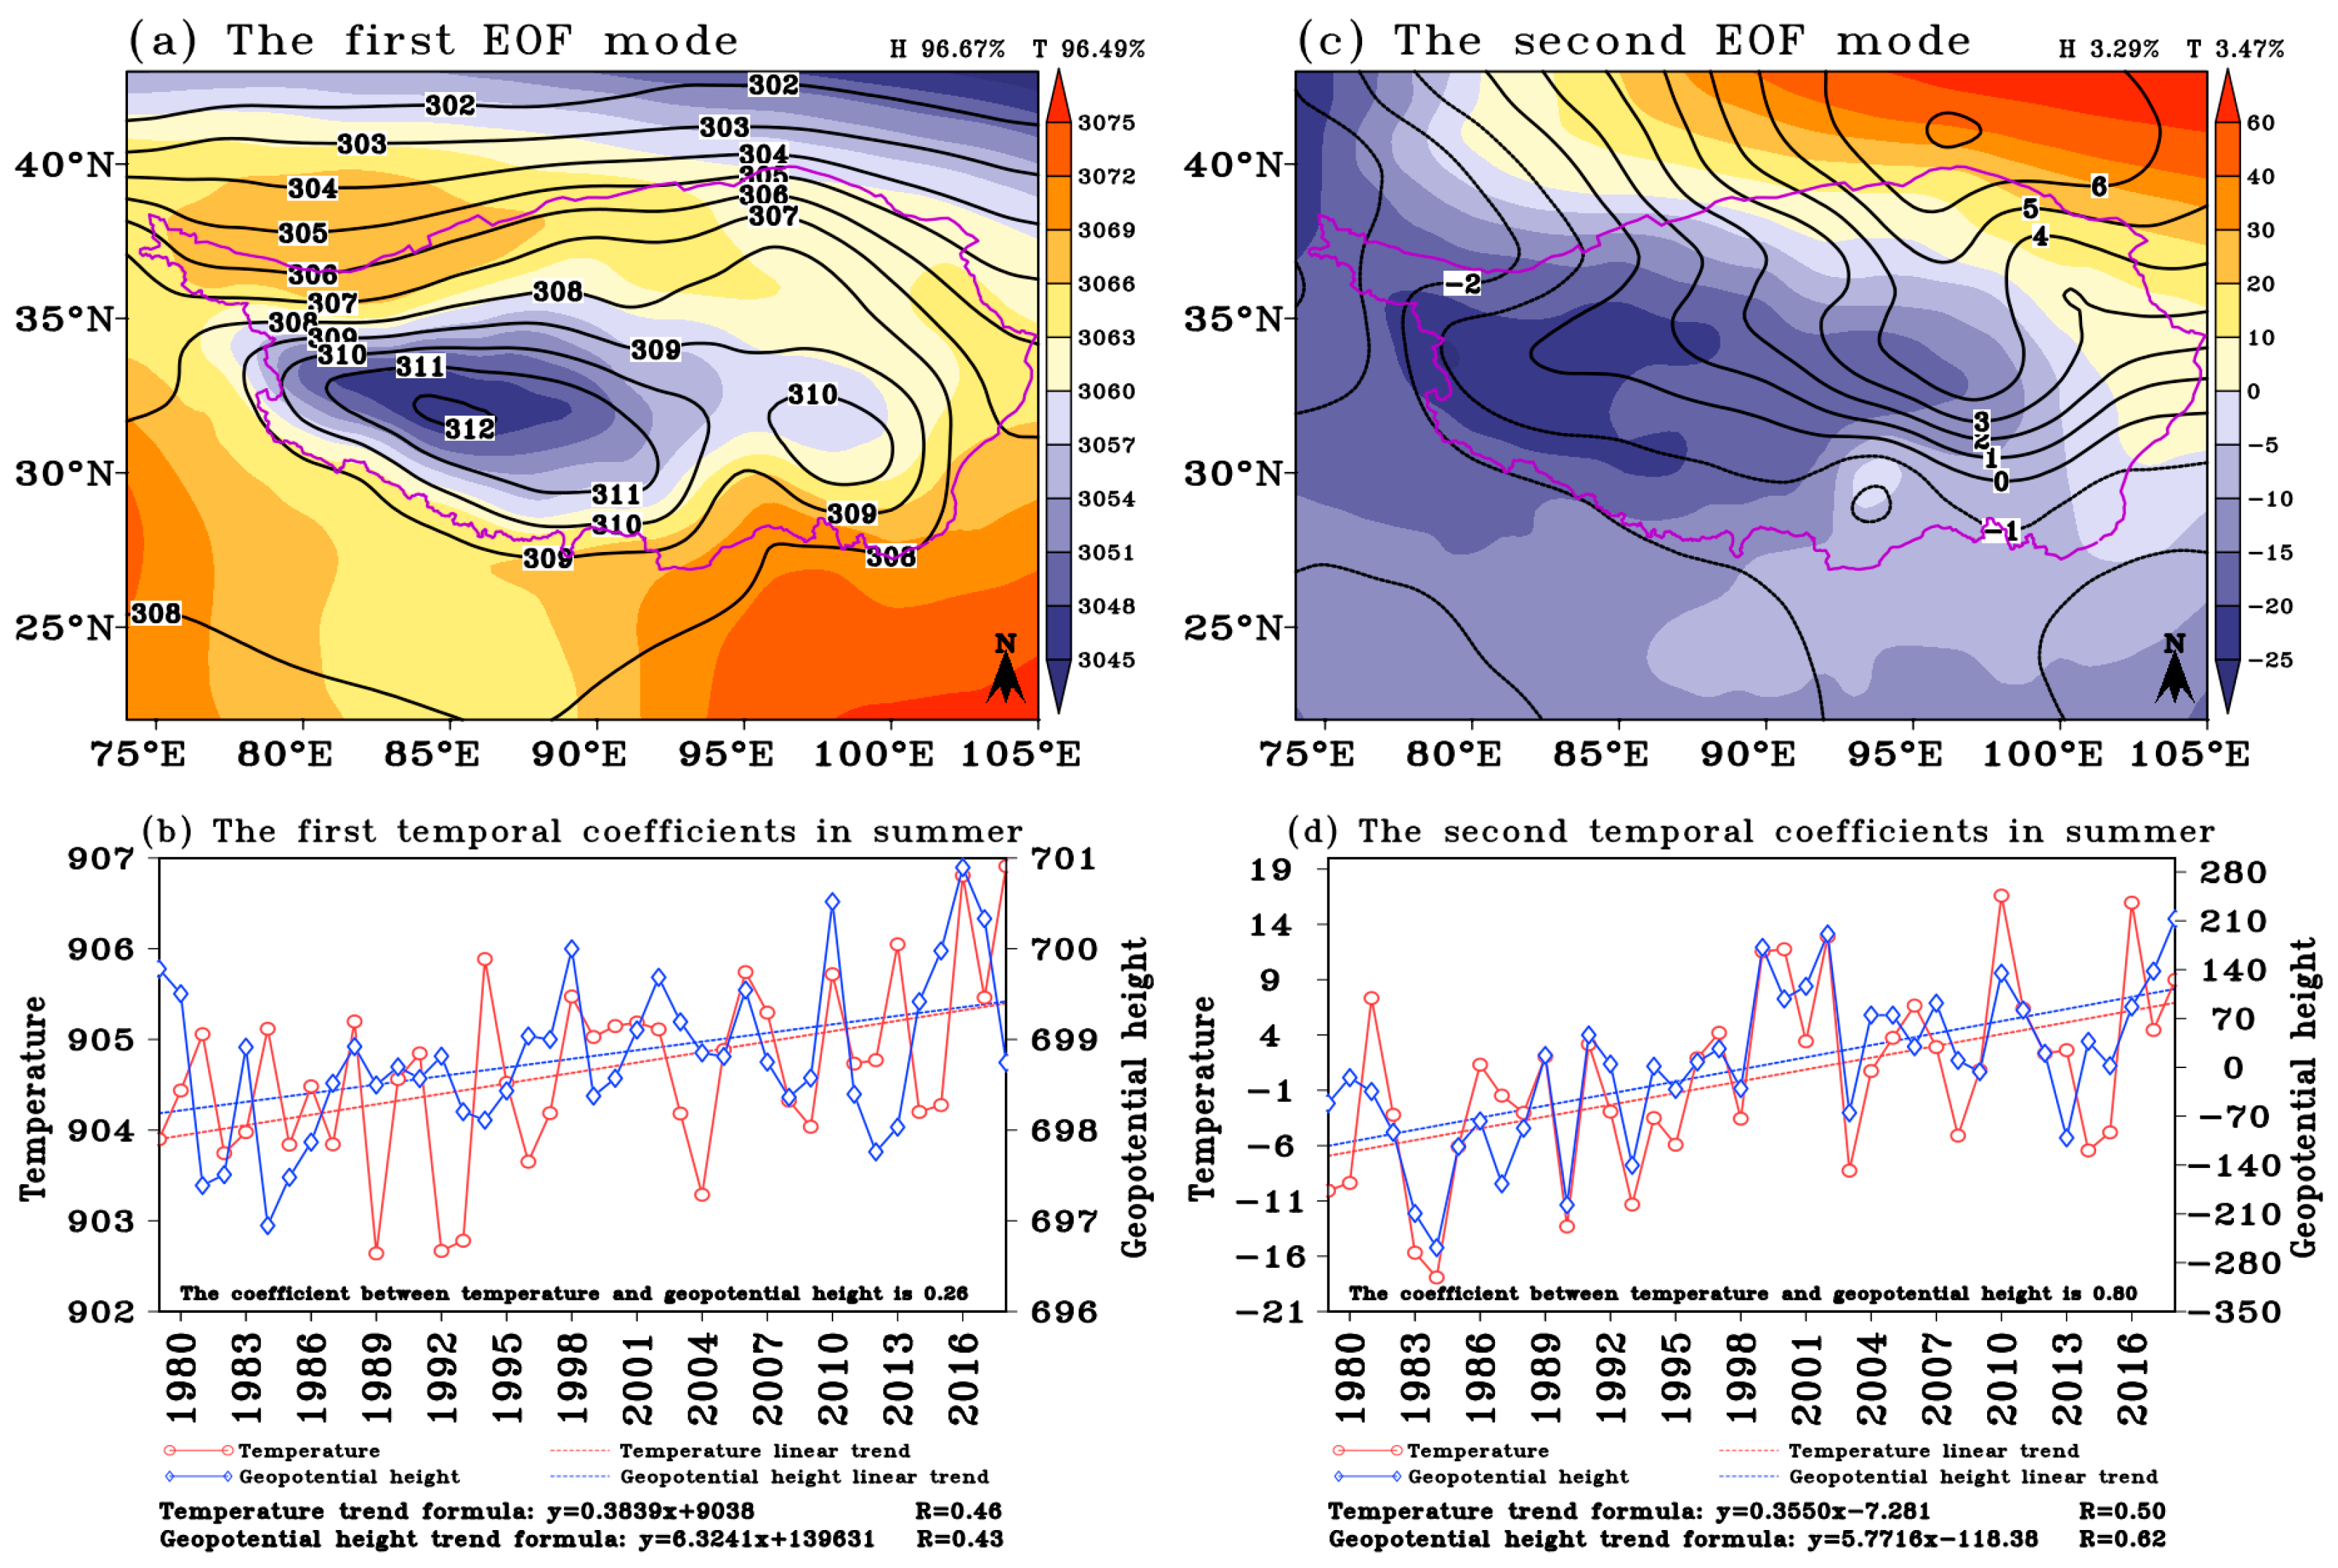
Figure 1. The structure of (a) the first and (b) the second mode of geopotential height (shaded) and temperature (solid lines) at 600 hPa, and (c) the first and (d) the second temporal coefficients in summer.
Atmosphere 16 00973 g001
Figure 2. Interannual variation in (a) standardized plateau summer monsoon indices and (b) their standard deviations for the period from 1979 to 2018.
Atmosphere 16 00973 g002
Figure 3. Interannual variation and MK test of the plateau summer monsoon indices for the period from 1979 to 2018: (a) TPMI, (b) DPMI, (c) QPMI, (d) ZyPMI, (e) ZjPMI and (f) TaPMI. The blue dotted line is the zero line, and the orange dashed line represents the 95% significance level.
Atmosphere 16 00973 g003
Figure 4. Correlation between the plateau summer monsoon indices and precipitation over the plateau for the period from 1979 to 2018: (a) TPMI, (b) DPMI, (c) QPMI, (d) ZyPMI, (e) ZjPMI and (f) TaPMI. Shading illustrates statistical significance at the 90% confidence level.
Atmosphere 16 00973 g004
Figure 5. The temperature (shaded, unit: °C) and geopotential height (contour, unit: dgpm) difference between strong and weak plateau summer monsoon years: (a) TPMI, (b) DPMI, (c) QPMI, (d) ZyPMI, (e) ZjPMI and (f) TaPMI. These white dots indicate statistical significance at the 95% confidence level.
Atmosphere 16 00973 g005
Figure 6. The water vapor flux divergence (shaded, unit: g/(kg∙s)) and horizontal wind (arrows, unit: m/s) difference between strong and weak plateau summer monsoon years: (a) TPMI, (b) DPMI, (c) QPMI, (d) ZyPMI, (e) ZjPMI and (f) TaPMI.
Atmosphere 16 00973 g006
Figure 7. The meridional wind (shaded, unit: m/s), geopotential height (red contour, unit: dgpm), wind speed (green contour, unit: m/s) and horizontal wind (arrows, unit: m/s) over (a,b) 200 hPa and (c,d) 600 hPa in (a,c) strong TPSM years and (b,d) weak TPSM years.
Atmosphere 16 00973 g007
Figure 8. The (a) geopotential height (shaded, unit: gpm) and temperature (arrows, unit: °C), (b) thermal wind and (c,d) special humidity (shaded, unit: 10 g/kg) and horizontal wind (arrows, unit: m/s) difference between strong and weak plateau summer monsoon years.
Atmosphere 16 00973 g008
Figure 9. Correlation coefficients between TaPMI and TT in (a) 500 hPa, (b) 300 hPa, (c) 150 hPa and (d) 100 hPa. These white dots indicate statistical significance at the 90% confidence level.
Atmosphere 16 00973 g009
Figure 10. Vertical variation in temperature difference between strong and weak plateau summer monsoon years along (65° N, 20° E) to (20° N, 120° E).
Atmosphere 16 00973 g010
Table 1. Statistics of correlation coefficients between interannual variations in different summer plateau monsoon indices for the period from 1979 to 2018.
TPMIDPMIQPMIZyPMIZjPMITaPMI
TPMI1
DPMI0.78 ***1
QPMI0.89 ***0.69 ***1
ZyPMI0.85 ***0.72 ***0.74 ***1
ZjPMI0.81 ***0.62 ***0.86 ***0.79 ***1
TaPMI0.93 ***0.67 ***0.82 ***0.78 ***0.73 ***1
Note: *** significant at the 0.001 level.
Table 2. Classified abnormal years of each plateau summer monsoon index.
IndiesStrong Plateau Summer Monsoon YearsWeak Plateau Summer Monsoon Years
TPMI2018 (1.07), 2010 (1.18), 1987 (1.35), 2014 (1.36)
2005 (1.36), 2012 (1.37), 2004 (1.42), 2009 (1.91)
1984 (−2.05), 1994 (−1.90), 1990 (−1.55)
1997 (−1.40), 2013 (−1.36), 1980 (−1.09)
DPMI2010 (1.00), 1999 (1.09), 1993 (1.17)
2012 (1.27), 1987 (1.73), 2009 (2.28)
1997 (−2.16), 1990 (−1.71), 1994 (−1.68), 1984 (−1.68)
2008 (−1.26), 1980 (−1.25), 2015 (−1.03)
QPMI2018 (1.03), 2009 (1.03), 2012 (1.21), 2004 (1.27)
1999 (1.33), 2005 (1.42), 2002 (1.48), 2010 (1.65)
1984 (−2.45), 1994 (−1.91), 2013 (−1.88), 1990 (−1.48)
1986 (−1.06), 1997 (−1.06), 1983 (−1.05)
ZyPMI2006 (1.02), 2004 (1.14), 2014 (1.40)
2009 (1.42), 2012 (2.11), 2005 (2.14)
1997 (−2.52), 1994 (−1.91), 1986 (−1.38)
2015 (−1.08), 1990 (−1.03), 1984 (−1.00)
ZjPMI2006 (1.00), 2012 (1.07), 2017 (1.16), 2014 (1.25)
2004 (1.34), 2005 (1.39), 1999 (1.46), 2018 (1.92)
1990 (−2.02), 1994 (−1.83), 1986 (−1.74), 1983 (−1.53)
1984 (−1.39), 2015 (−1.28), 1982 (−1.09)
TaPMI1987 (1.00), 2002 (1.03), 2010 (1.18), 2014 (1.20)
2012 (1.31), 2005 (1.60), 2004 (1.75), 2009 (1.76)
1984 (−2.01), 1994 (−1.96), 2013 (−1.62)
1990 (−1.49), 1997 (−1.36), 2016 (−1.20)
Note: the values in brackets are PMIs, and the values in bold are the years selected for synthetic analysis.
Disclaimer/Publisher’s Note: The statements, opinions and data contained in all publications are solely those of the individual author(s) and contributor(s) and not of MDPI and/or the editor(s). MDPI and/or the editor(s) disclaim responsibility for any injury to people or property resulting from any ideas, methods, instructions or products referred to in the content.