Article

Vertical Evolution of Volatile Organic Compounds from Unmanned Aerial Vehicle Measurements in the Pearl River Delta, China

Key Laboratory for Urban Habitat Environmental Science and Technology, Peking University Shenzhen Graduate School, Shenzhen 518055, China
*
Author to whom correspondence should be addressed.
Atmosphere 2025, 16(8), 955; https://doi.org/10.3390/atmos16080955
Submission received: 28 June 2025 / Revised: 25 July 2025 / Accepted: 8 August 2025 / Published: 10 August 2025
(This article belongs to the Special Issue Biogenic Volatile Organic Compound: Measurement and Emissions)

Abstract

The vertical distribution of volatile organic compounds (VOCs) within the planetary boundary layer (PBL) is critical for understanding ozone (O3) formation, yet knowledge remains limited in complex urban environments. In this study, vertical measurements of 117 VOC species were conducted using an unmanned aerial vehicle (UAV) equipped with a VOC multi-channel sampling system, up to a height of 500 m in Shenzhen, China. Results showed that total VOC (TVOC) concentrations decreased with altitude in the morning, reflecting the influence of surface-level local emissions, but increased with height at midday, likely driven by regional transport and potentially stronger photochemical processes. Source apportionment revealed substantial industrial emissions across all altitudes, vehicular emissions concentrated near the surface, and biomass burning primarily impacting higher layers. Clear evidence of enhanced secondary formation of oxygenated VOCs (OVOCs) was observed along the vertical gradient, particularly at midday, indicating intensified photochemical processes at higher altitudes. These findings underscore the importance of considering vertical heterogeneity in VOC distributions when modeling O3 formation or developing measures to reduce emissions at different altitudes, and also demonstrate the potential of UAV platforms to provide high-resolution atmospheric chemical data in complex urban environments.

1. Introduction

Ground-level ozone (O3) pollution has emerged as one of the most pressing air quality challenges in rapidly urbanizing regions of China, particularly in the Pearl River Delta (PRD), where emissions are complex and photochemical activity is intense [1]. Volatile organic compounds (VOCs), as key precursors of O3, play a critical role in driving photochemical reactions within the planetary boundary layer (PBL). Although extensive ground-based VOC measurements have been conducted across China [2,3,4], the vertical distribution patterns of VOCs within the PBL remain relatively underexplored. Exploring the vertical variation of pollutants is crucial, as meteorological parameters, such as temperature, humidity, wind speed, and solar radiation, vary with altitude and directly influence chemical reaction rates [5]. VOCs emitted near the surface can undergo rapid dilution, transport, or chemical transformation as they disperse vertically, resulting in the heterogeneity in their contribution to O3 formation across different altitudes within the PBL [6,7]. Additionally, the secondary production of oxygenated VOCs (OVOCs), driven by strong photochemical processes, further complicates the vertical chemical environment [4]. Therefore, a comprehensive understanding of the vertical distribution of VOCs within the PBL is essential for the effective mitigation of O3 pollution.
Current vertical observations of VOCs primarily rely on tall towers/buildings, tethered balloons, aircraft, and unmanned aerial vehicles (UAVs). Multi-height VOC measurements have been implemented based on towers, such as in Guangzhou and Beijing, revealing significant vertical variations among different VOC species. For example, NMHCs and biogenic VOCs generally decreased with height [8,9,10]. However, tower-based sampling is limited by fixed and relatively low altitudes, limiting its ability to capture the vertical variability of VOCs. Tethered balloons, which can reach altitudes up to 1600 m [11], have been employed to investigate the influence of mesoscale meteorological conditions on the vertical distribution of VOCs. Studies in such regions as the Beijing–Tianjin–Hebei area and industrial zones in Europe have shown that local emissions are a dominant factor shaping the vertical profiles of VOCs within the boundary layer [12,13]. Aircraft-based platforms further extend the observation range to higher altitudes (up to 5500 m) [14], and are widely used to explore the relationships between large-scale atmospheric convection and VOCs distribution, highlighting the significant impact of Asian monsoon outflows and sea-breeze circulations on VOCs’ vertical structures [15,16]. Nevertheless, both tethered balloons and aircraft face challenges related to stability, operational complexity, and limited temporal resolution, particularly in urban settings. Overall, the above VOC vertical observation techniques face trade-offs between altitude range, spatial and temporal resolution, operational flexibility, and cost-effectiveness. In contrast, UAVs have recently gained increasing application in VOCs vertical profiling due to their high maneuverability, fine spatial resolution, and operational flexibility [17,18,19,20], making them well-suited for capturing urban-scale emission features and filling critical observational gaps in mesoscale boundary layer research.
The vertical distribution of VOCs exhibits strong regional and seasonal variability. In the North China Plain, observations showed a sharp decline in alkanes, alkenes, aromatics, and halocarbons within the 0–400 m layer. Between 500 and 1000 m, alkanes and halocarbons remained relatively stable, and aromatics increased slightly. These results highlight that although VOC concentrations typically decrease with altitude, certain species may exhibit opposite trends [21]. Previous in situ vertical measurement of VOCs conducted in Nanjing during summer and autumn revealed that the concentrations of nearly all VOC species declined with height, however, the relative contribution of non-reactive species (e.g., acetylene) and secondary VOCs (e.g., ketones and aldehydes) increased with altitude, suggesting enhanced photochemical aging aloft [22]. VOC concentrations were reported to generally decrease from 8 m to 140 m but increased sharply at 280 m during haze episodes in Beijing [23]. Liu et al. (2023) found minimal vertical gradients in VOC concentrations and compositions during summer in urban Beijing, possibly due to effective emission controls and a reduced vertical contrast in sources [24]. Overall, VOCs are mostly concentrated on the surface due to the multiple effects of surface emissions, vertical diffusion, and chemical attenuation [25]; however, in some cases, VOCs also show an increase or uniform distribution with increasing altitude.
This study conducted comprehensive vertical measurements of VOCs using a UAV-based multi-channel sampling system across multiple height layers during the morning and noon periods. The objective was to characterize the vertical distribution of VOCs within the PBL, identify their dominant sources, and diagnose the evolution of photochemical aging processes with altitude.

2. Methods

2.1. Sampling Time, Location, and Strategy

Vertical UAV-based measurements were conducted in Shenzhen during the summer of 2023 (detailed periods are listed in Table S1). Two time periods were selected to represent distinct boundary layer development stages, including the morning phase of initial boundary layer growth (08:00–09:00) and the midday phase of vigorous mixing (12:00–13:00). Instantaneous air sampling was performed at seven vertical levels (0, 65, 140, 240, 340, 415, and 480 m), with 2-minute collection durations at each altitude. Meteorological conditions remained generally stable throughout the sampling periods. The observation site was located at Shiyan Reservoir in western Shenzhen (113°54′ E, 22°42′ N) (Figure S1). The surrounding area is characterized by dense vegetation, adjacent industrial parks, and a major expressway with heavy traffic, including frequent passage of freight trucks. For each time period, two UAV flights were conducted. During each flight, the UAV ascended to 480 m and then descended stepwise, hovering at intervals of 80 m. At each altitude, the UAV hovered for 2 min to allow sufficient air sampling for subsequent analysis.

2.2. UAV-Based Vertical Measurements of VOCs and Sample Analysis

Vertical measurements of VOCs were conducted using a six-rotor UAV platform (Huanyu Blue Sky Aviation Technology Co., Ltd., Tianjin, China) equipped with a multi-channel whole air sampling system (Figure S2). The sampling system consisted of a light-absorbing sponge frame, six electromechanically controlled sampling canisters, and a sixteen-port solenoid valve, enabling automated and flexible sampling control. This automation solves the limitation of sampling height and significantly improves sampling efficiency compared to manual trigger methods. Each canister (Restek Corporation, Bellefonte, PA, USA) was made of high-purity polished quartz with a total volume of approximately 1.1 L and equipped with airtight stainless steel valves. The inner surface was specially treated to minimize wall adsorption (<3%), effectively preserving the integrity of a wide range of VOCs during sampling and storage. Performance tests showed negligible adsorption losses for target compounds [19,26].
Collected samples were analyzed approximately two hours after collection using a gas chromatograph–mass spectrometer/flame ionization detector (GC–MS/FID) system (Agilent Technologies Inc., Santa Clara, CA, USA). In total, 117 VOC species were quantitatively determined, including 29 alkanes, 12 alkenes, 16 aromatics, 35 halocarbons, and 22 oxygenated VOCs (OVOCs), as well as acetylene, acetonitrile, and selected organosulfur compounds. Total VOCs (TVOCs) in this study refer to the sum of these 117 quantified species, while total ozone formation potential (TOFP) denotes the combined ozone reactivity of the detected compounds. The calibration was performed using PAMS gas standards (Linde, Danbury, CT, USA), with R2 values of standard curves exceeding 0.98 for all target compounds (Figure S3).

2.3. Source Apportionment of VOCs

Given the relatively stable VOC emission sources in Shenzhen [27], a chemical mass balance (CMB) receptor model (EPA-CMB8.2) was applied to apportion VOC sources, based on the assumption that the chemical composition of VOCs at the receptor site is a linear combination of the source profiles, with no chemical transformation occurring during atmospheric transport [28,29]. This approach allows the ambient VOC concentrations to be attributed to specific emission sources, and the contributions of different sources to both VOC concentrations and their associated ozone formation potential (OFP) to be quantified. In this study, concentrations and uncertainties of 36 VOC species with high ambient concentrations and strong source specificity were selected for the model input, including 23 alkanes, 3 alkenes, 6 aromatics, 1 halocarbon, 1 nitrogen-containing compound, 1 OVOC, and acetylene.

3. Results and Discussion

3.1. Vertical Characteristics of VOCs and OFP

Figure 1 illustrates the vertical characteristics of average VOC concentrations and OFP during the observation period, along with VOC vertical profiles during the morning and noon periods. TVOCs increased with height from the ground to 140 m, and then decreased above 140 m. Across all altitudes, OVOCs were the dominant species, accounting for 46.6–58.1% of TVOCs, and their relative contribution increased with height. Such a vertical enhancement of OVOCs is consistent with previous findings in Chengdu [19], reflecting the influence of stronger regional transport and photochemical aging aloft. Other VOC species exhibited relatively small variations with height, possibly due to weaker local emissions and the limited vertical dilution in Shenzhen in summer [30]. OVOCs also dominated the OFP contributions across all height levels (28.3–51.9%). At the surface, however, the OFP contribution of alkenes exceeded that of OVOCs, primarily due to the presence of highly reactive species, such as isoprene and trans-2-butene, with elevated surface concentrations. The vertical variation patterns of VOCs differed substantially between the morning and noon periods. In the morning, TVOC concentrations generally decreased with altitude (a reduction of 29% from the surface to 480 m), indicating the presence of surface-level local sources with reduced emissions at higher altitudes. In contrast, TVOCs at noon increased with height (an increase of 45% from the surface to 480 m), with primary species, such as alkanes and halocarbons, peaking above 415 m. Their enhanced concentrations suggest the influence of regional transport. OVOCs also increased with height at noon, highlighting the role of enhanced photochemical activity during midday hours.
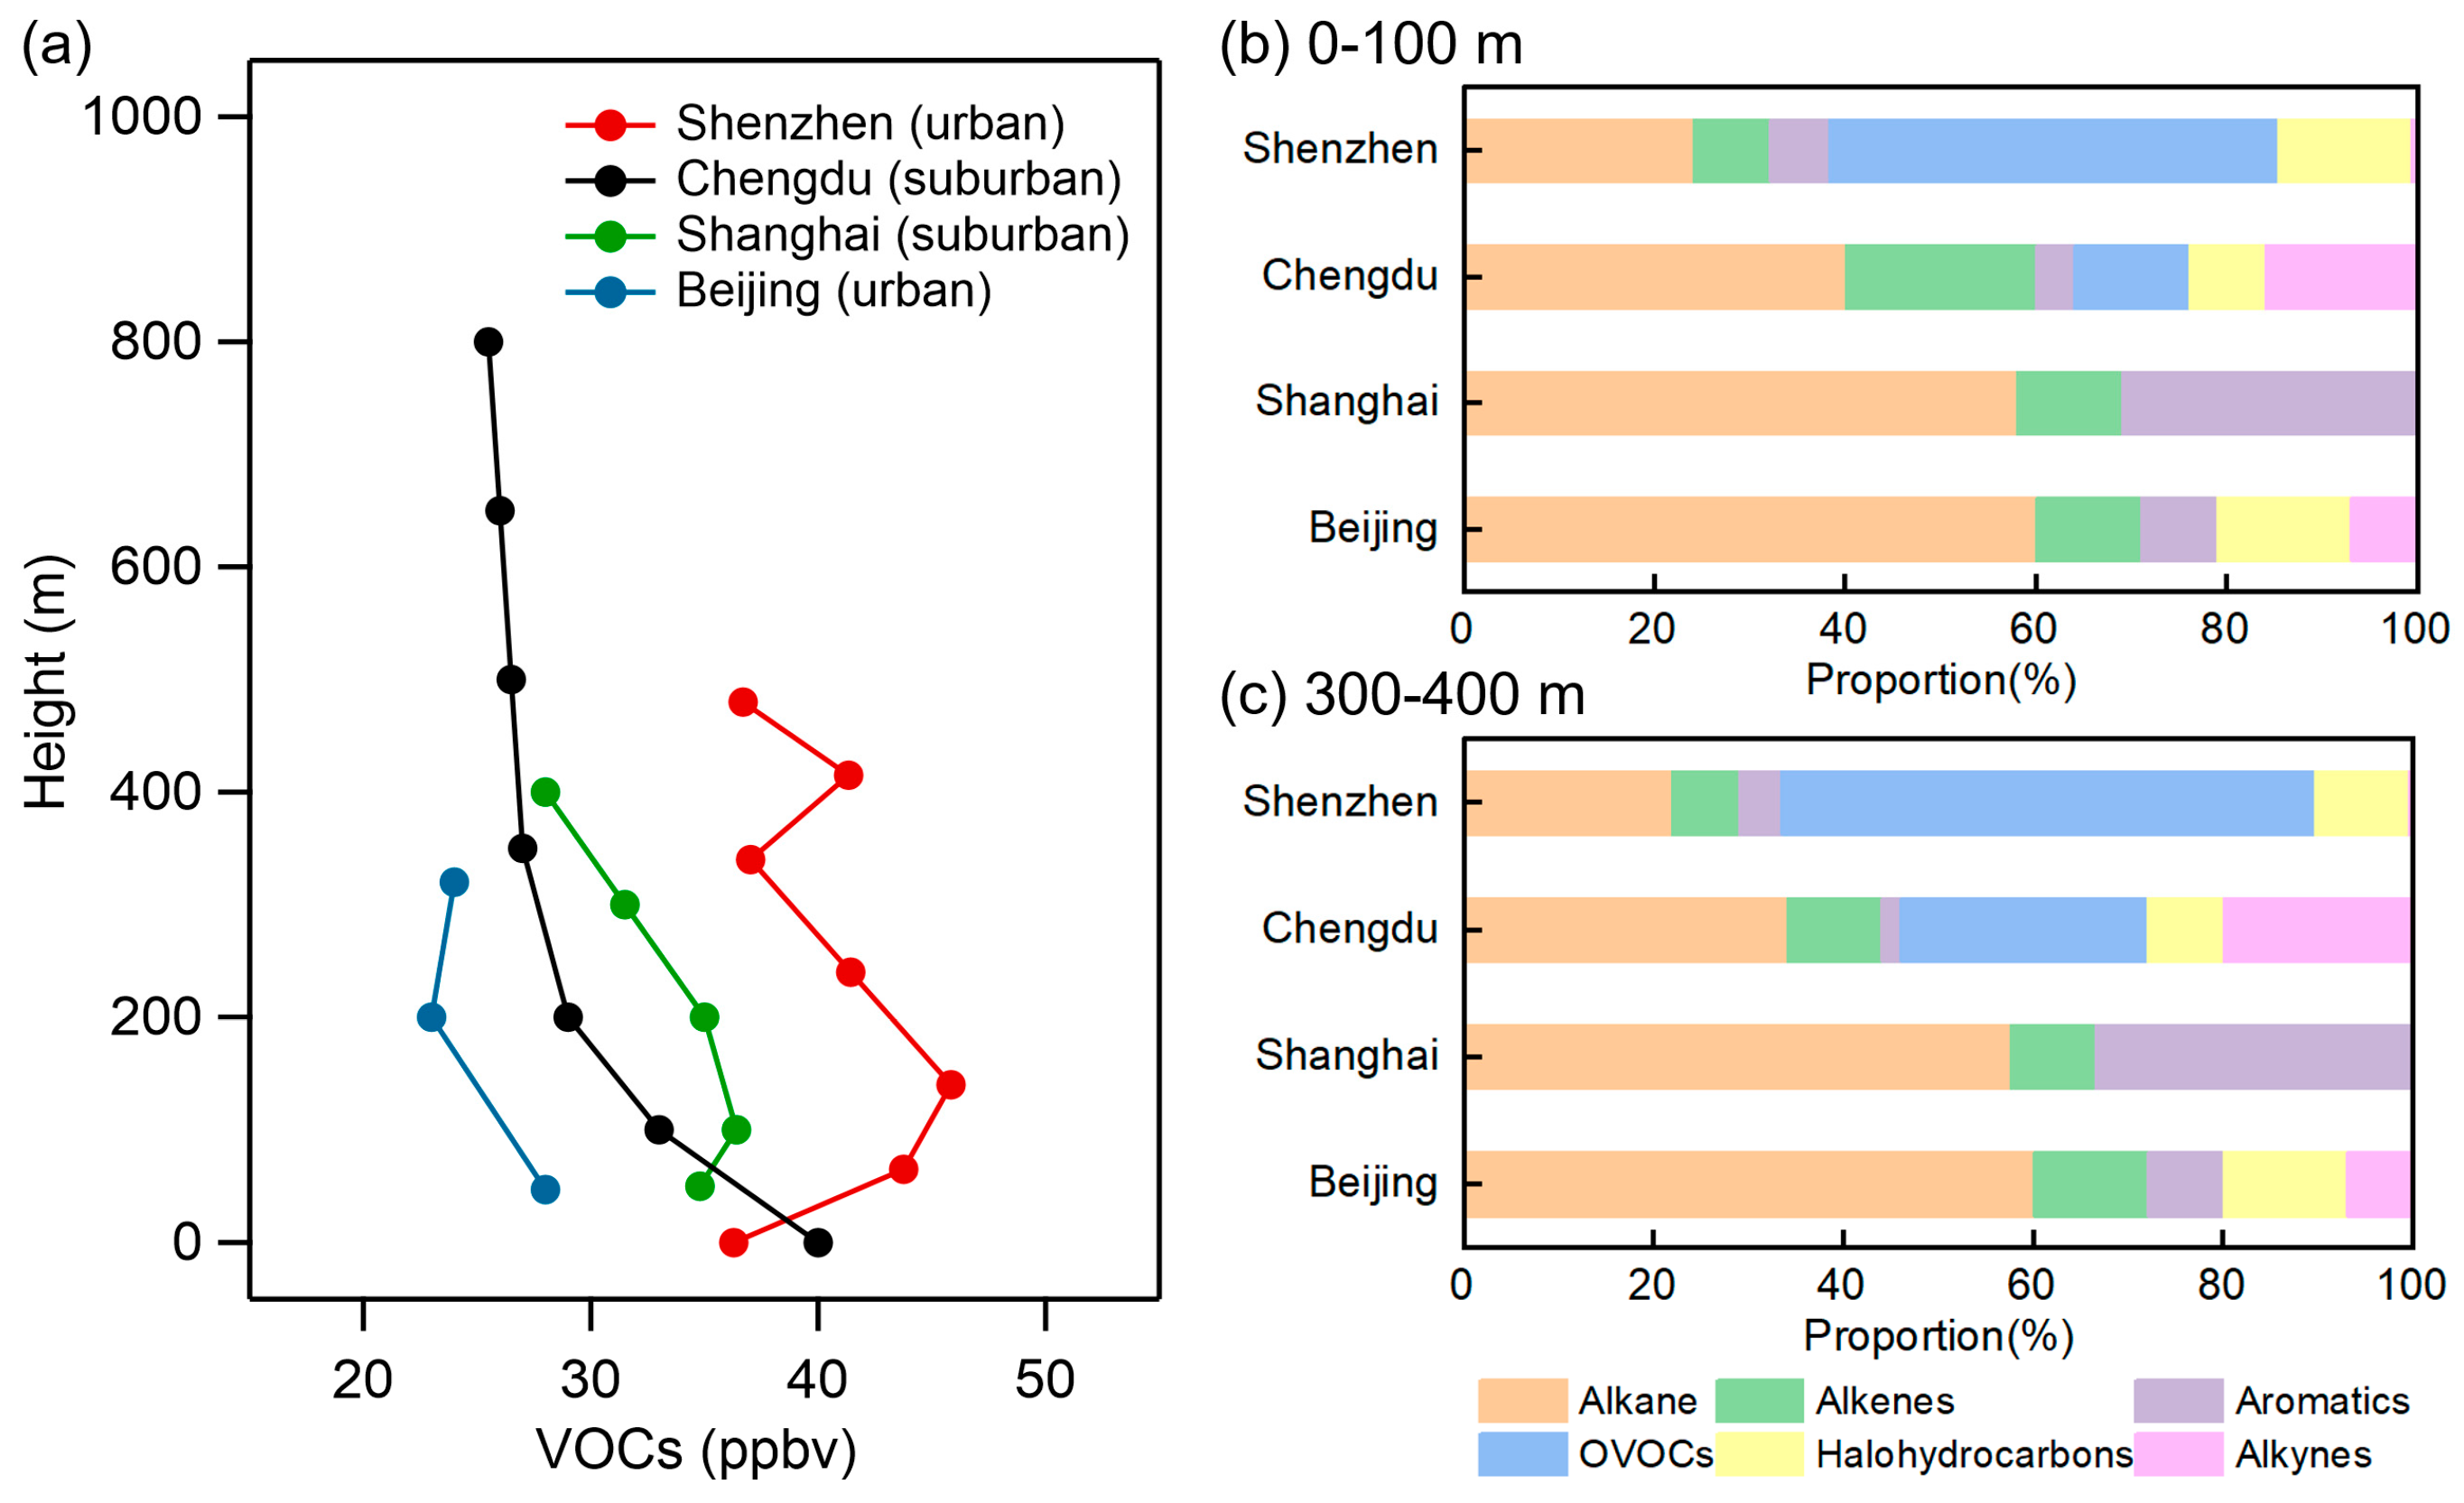
Figure 2 presents a comparison of VOC vertical profiles in Shenzhen with those measured in suburban Chengdu (winter), suburban Shanghai (autumn), and Beijing (summer, tower-based) [18,19,24]. A similar pattern of increasing then decreasing with height as in Shenzhen was observed in Shanghai, though with smaller vertical variation. The slight enhancement around 200 m in Shanghai may be related to the presence of a temperature inversion [18]. In Chengdu, TVOC concentrations decreased steadily with altitude, reflecting strong surface emissions and significant vertical dilution. Beijing exhibited generally low concentrations with relatively uniform vertical distribution. At different heights, VOC composition across the four cities was consistently dominated by alkanes (excluding OVOCs, which were not presented in studies conducted in Shanghai and Beijing). The contribution of alkanes tended to decrease with height in Shenzhen, Chengdu, and Shanghai, while VOC composition in Beijing remained relatively uniform. Interestingly, OVOCs contributed a higher fraction in Shenzhen than in Chengdu, possibly indicating more advanced oxidative processing in Shenzhen and more dominant primary emissions in Chengdu. The elevated fraction of aromatics in Shanghai is likely associated with vehicular and solvent-related emissions [18]. Overall, the four cities exhibited a general trend of decreasing VOC concentrations with increasing altitude. However, the vertical gradients varied across locations, indicating differences in local emission structures. These findings underscore the importance of acquiring city-specific vertical profiles of VOCs to support effective O3 pollution control strategies.

3.2. Vertical Variation of the VOC Source Contributions

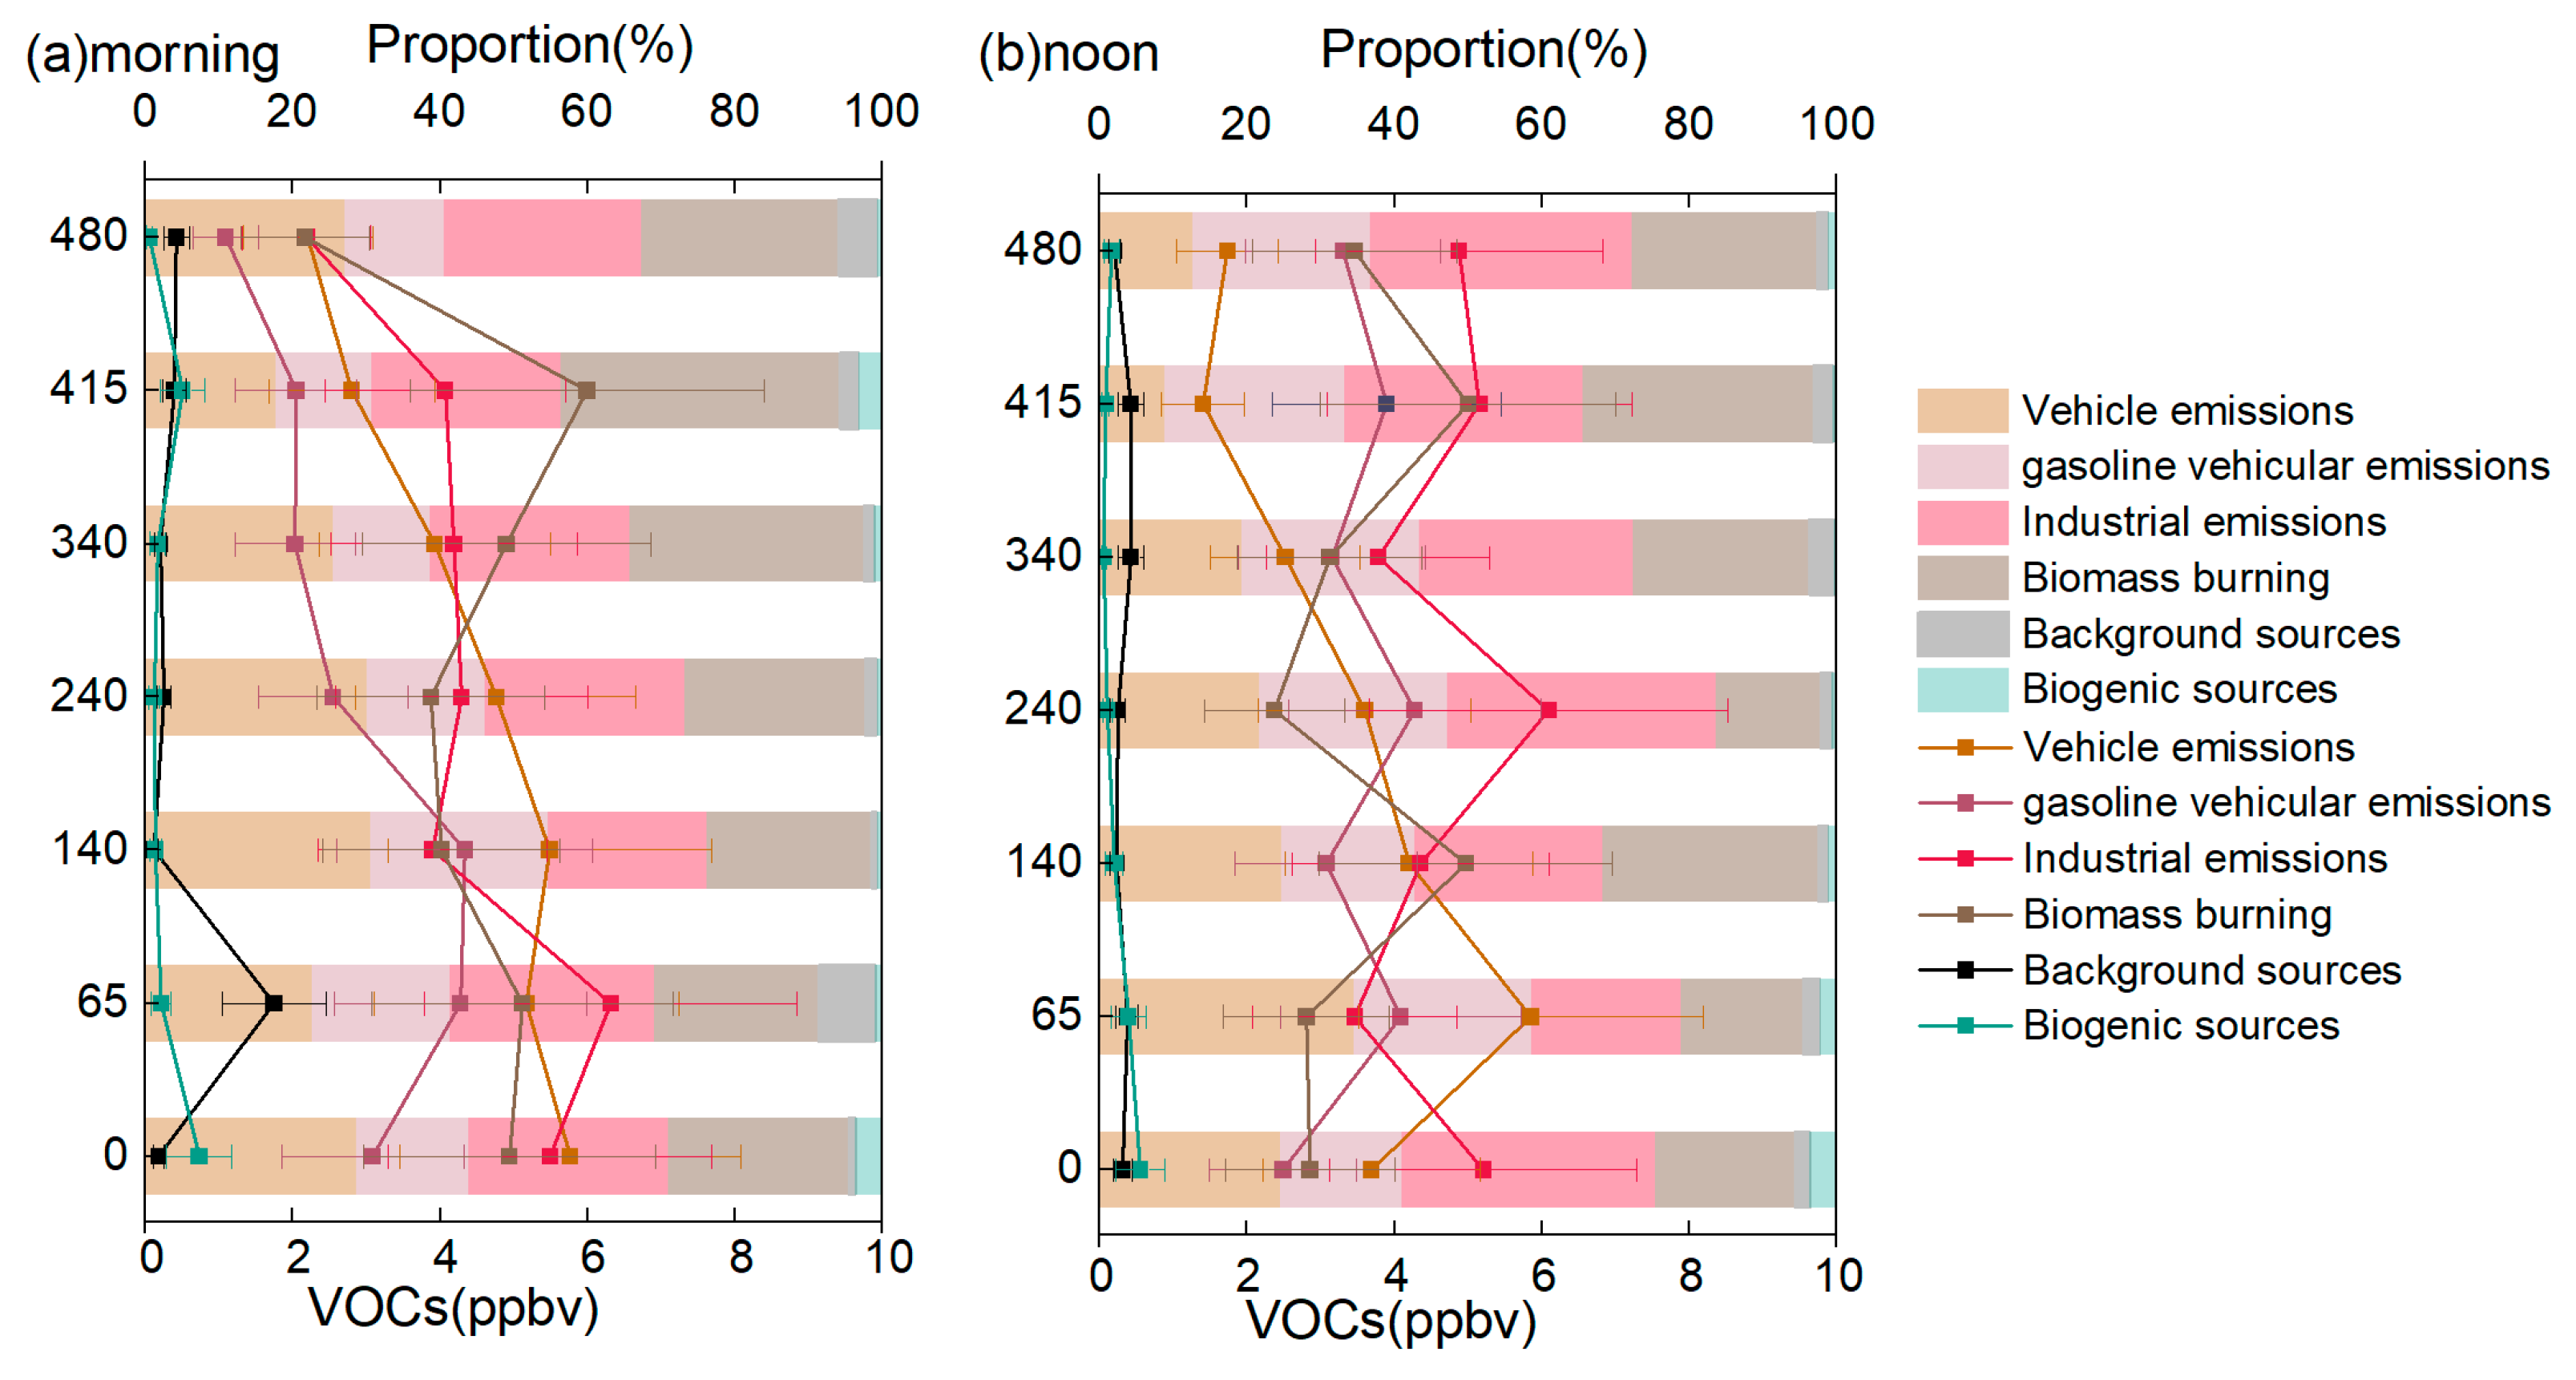
Figure 3 shows the CMB source apportionment results based on VOC concentration, revealing six main factors, including vehicle emissions, gasoline evaporations, industrial solvent, biomass burning, regional background, and biogenic emissions. Overall, the vertical variation in source contributions to both VOC concentrations and OFP was relatively minor (Figure S4). Industrial emissions were the dominant source at all height levels, followed by vehicle emissions. Figure 3 presents the source apportionment results for VOC concentrations during the morning and noon periods. Compared to the noon period, higher contributions from vehicle exhaust and gasoline evaporation existed during the morning periods, particularly within the 0–140 m altitude, indicating the influence of the morning traffic peak. In contrast, vehicle emissions decreased significantly at noon, especially near the surface, reflecting reduced traffic emissions. Industrial sources made a larger contribution during the noon period across all altitudes, which may be attributed to enhanced daytime emissions or secondary formation processes. Biomass burning made a more substantial contribution in the morning, especially above 340 m, suggesting regional transport influences, consistent with previous findings on regional biomass burning impacts in Shenzhen [31]. Biogenic emissions were more pronounced in the near-surface layer (0–140 m) at noon compared to the morning and decreased with altitude, indicating enhanced plant emissions driven by increased solar radiation, consistent with known biogenic emission patterns. The background source is characterized by low-reactivity species associated with regional transport (ethane, acetylene, and acetonitrile). Previous studies have shown that this factor exhibits a spatially uniform distribution across Shenzhen, suggesting that it represents the background level of air masses transported from upwind regions [32]. Background source showed little variation with altitude, indicating a relatively stable influence from regional transport within the middle PBL.
In addition, the characteristic species ratio method was conducted to support the source apportionment. Figure S5 shows the vertical profiles of selected VOC ratio indicators during the observation period, including both morning and noon. The toluene/benzene (T/B) ratio is widely used to distinguish solvent usage and vehicular emissions [33]. In this study, T/B ranged from 5 to 23, indicating a strong influence from industrial sources. An increasing trend of T/B with altitude was observed at noon, which may be due to faster photochemical degradation of toluene relative to benzene near the surface, or possible horizontal transport of non-traffic-related emissions aloft. The m,p-xylene/ethylbenzene (X/E) is commonly used as an indicator of photochemical age, reflecting the influence of local emissions versus aged air masses [34]. The X/E ratios at noon were lower than in the morning, with values below 2.5 at all altitudes, suggesting greater influence from aged air masses during daytime, whereas the morning was more affected by fresh local emissions.

3.3. Vertical Evolution of Secondary Formation of OVOCs

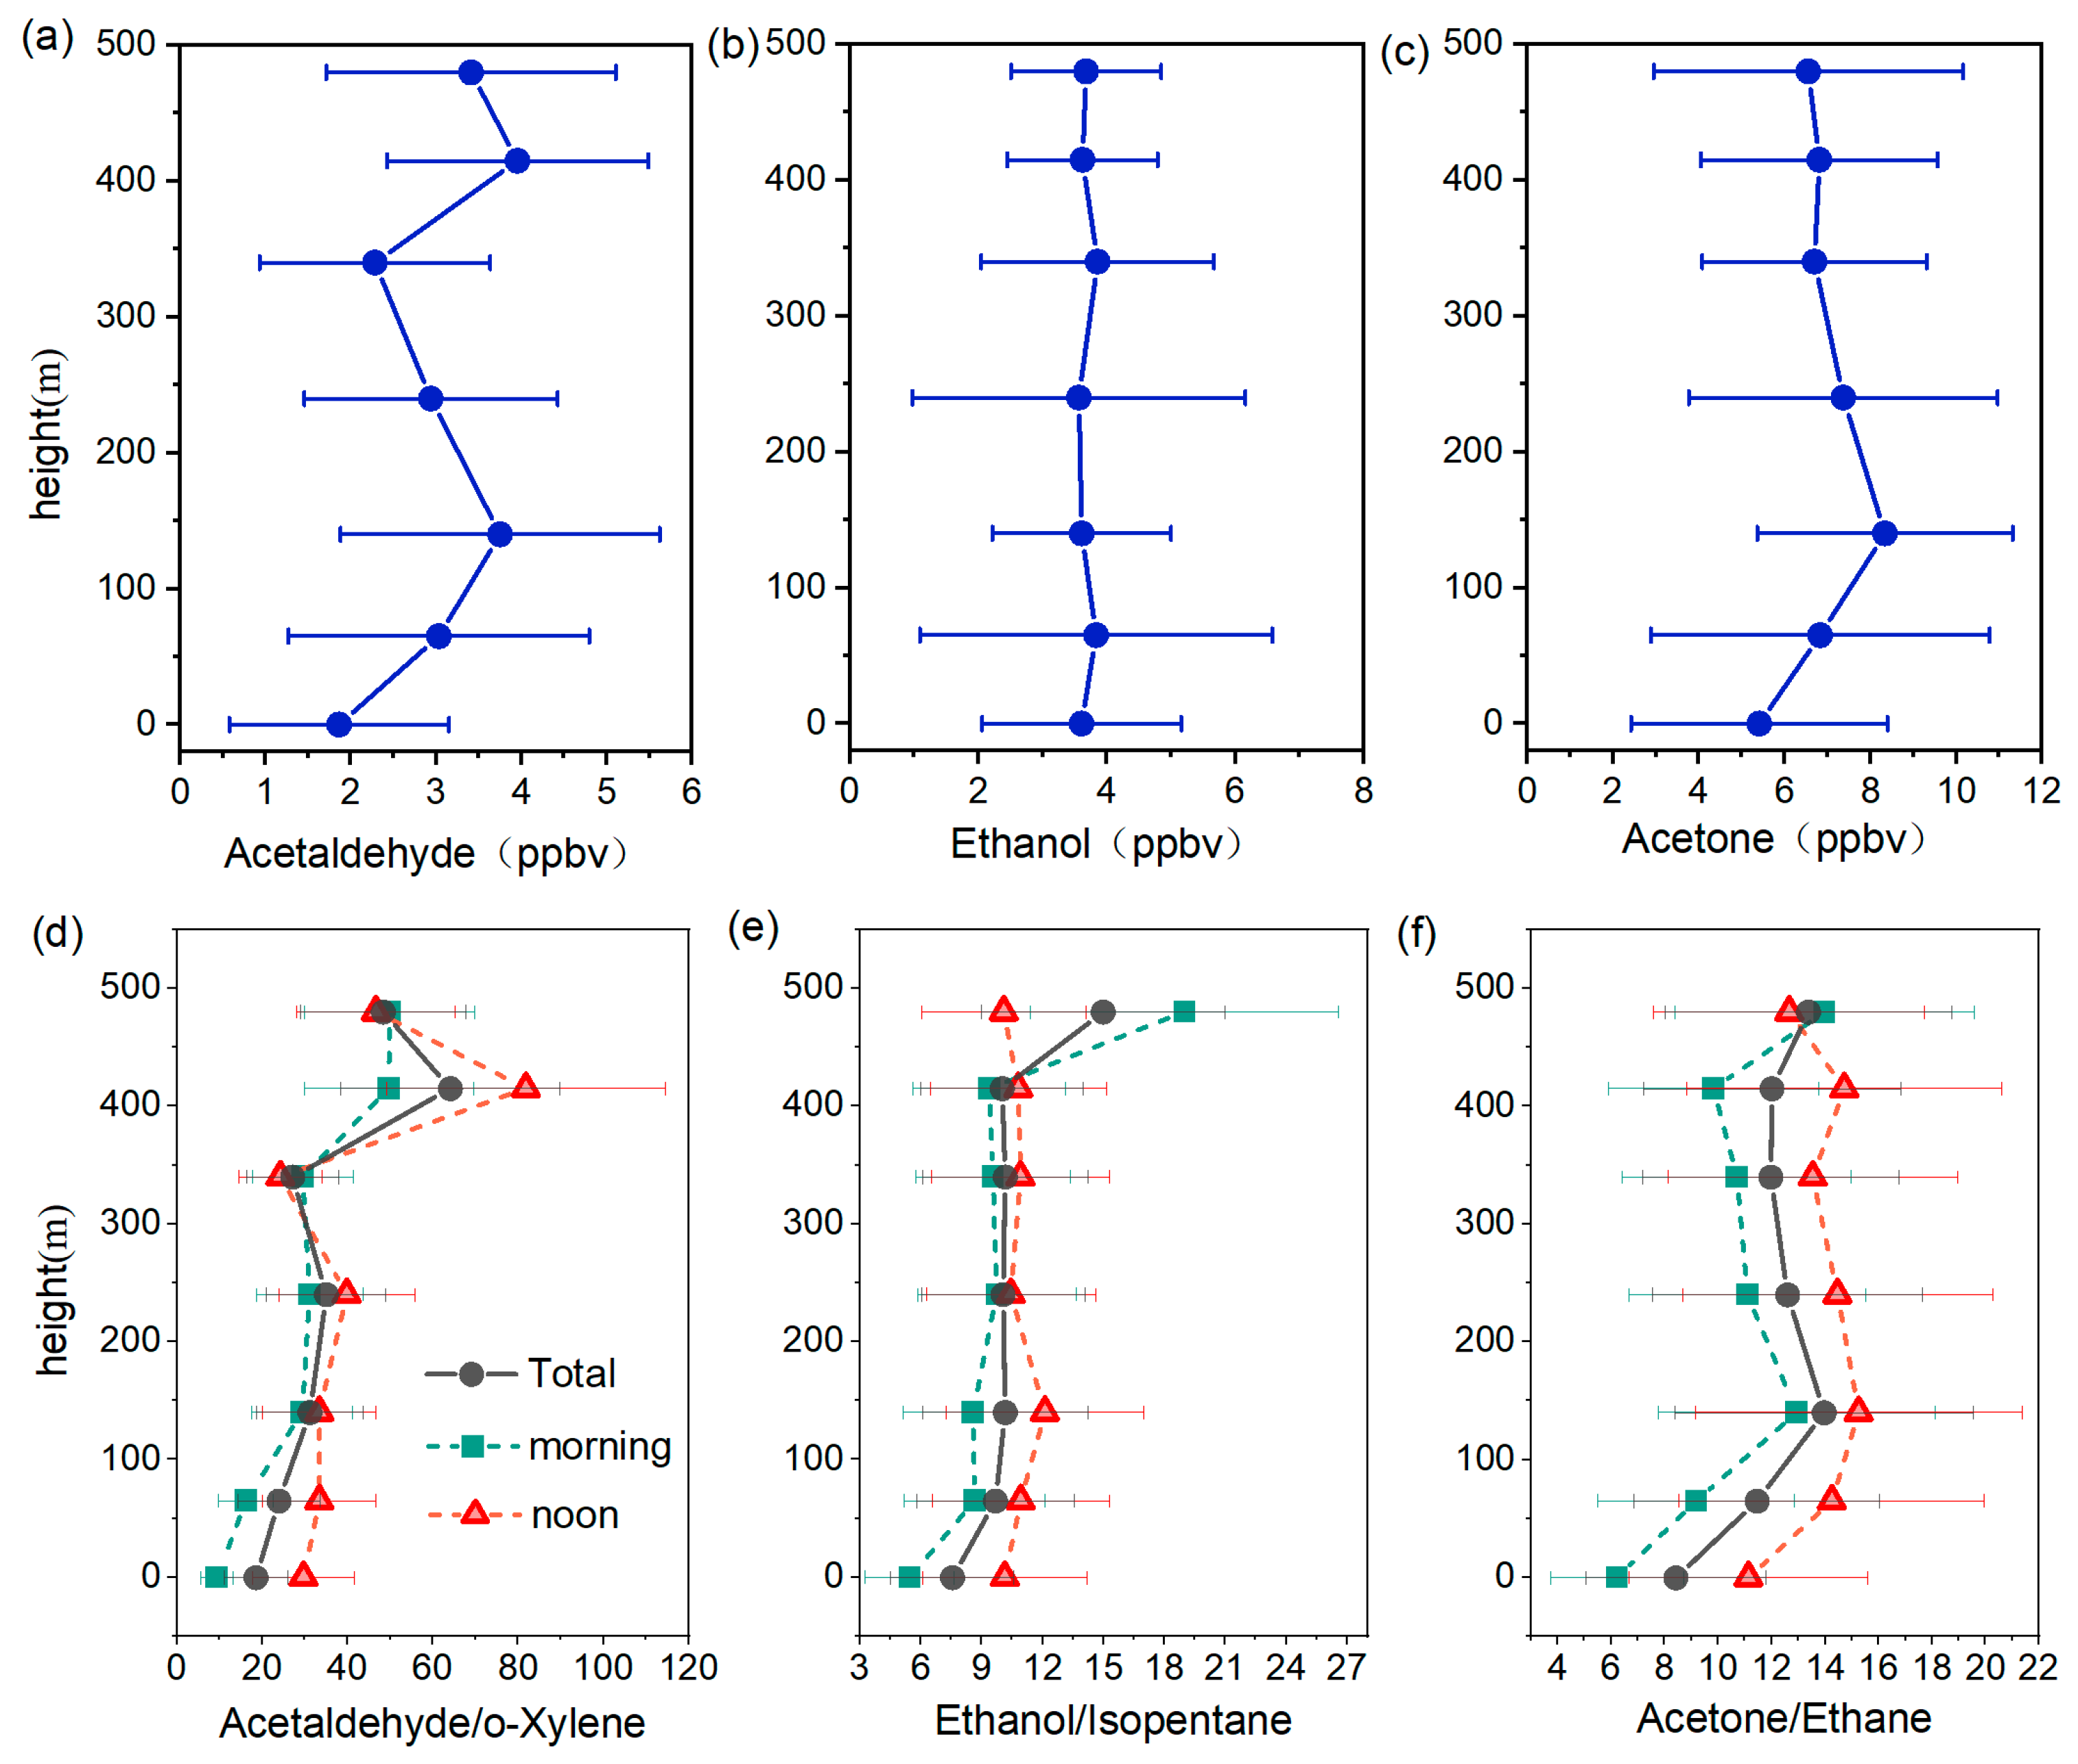
To evaluate the photochemical reactivity of VOCs within the PBL, this study quantitatively estimates the photochemical consumption at different heights based on OH exposure (details in Text S1 and Figure S6). Figure S7 presents the observed concentrations and estimated photochemical consumptions of VOCs at different heights. With increasing altitude, the photochemical consumptions of most VOCs generally showed a rising trend. The total photochemical consumptions increased from 3.8 ppbv at 65 m to 9.2 ppbv at 480 m, corresponding to an overall depletion of 28.4% for TVOCs. Alkenes, as highly reactive species, exhibited the greatest degree of depletion (69.1%), followed by aromatics (34.3%). In contrast, OVOCs displayed a net increase with altitude, resulting in negative total loss values from the surface to upper layers. This vertical enhancement suggests a strong upward trend in OVOC concentrations, likely driven by secondary production and regional-scale horizontal transport. Figure 4a–c shows the average vertical profiles of representative OVOC species. Acetaldehyde, hexanal, and acetone exhibited an increasing trend with height. This was consistent with observations from offline SUMMA canister sampling at the Canton Tower in Guangzhou, where OVOC species increased with height [8]. These results indicate enhanced photochemical activity aloft and suggest that secondary formation plays a major role in shaping the vertical profile of OVOCs. The height-dependent peak concentrations observed for different species may be attributed to variations in their secondary production potential [35,36].
Assuming that anthropogenic non-methane-hydrocarbon (NMHC) emissions are proportional to OVOC emissions, the OVOCs/NMHCs ratio can serve as a more reliable indicator of the secondary formation strength of OVOCs, minimizing the influence of meteorological conditions and direct emissions [37]. To further mitigate the impact of OH-initiated reactions, NMHC species with similar OH reaction rate constants (kOH) to the target OVOCs were selected to construct diagnostic ratios. The selected diagnostic pairs included acetone/ethane (kOH = 2.0 × 10⁻¹¹ vs. 2.6 × 10⁻¹¹ cm3 molecule−1 s−1), ethanol/isopentane (kOH = 3.2 × 10⁻¹² vs. 3.6 × 10⁻¹²), and acetaldehyde/o-xylene (kOH = 1.5 × 10⁻¹¹ vs. 1.4 × 10⁻¹¹). In Figure 4d–f, the secondary formation of OVOCs was generally stronger during the noon period compared to the morning across all heights, likely due to enhanced solar radiation and increased photochemical activity. In addition, all ratios increased with altitude, indicating that secondary formation processes were more intense aloft than near the surface, which is consistent with the findings in the previous study [19], who reported enhanced photochemical production at upper layers. Among the three ratio pairs, acetone/ethane showed a sharp increase near the surface but leveled off at higher altitudes, a pattern opposite to that of the other two pairs. This divergence may result from differences in vertical radiation intensity and species-specific reactivity, which influence secondary formation dynamics [38]. Overall, the enhanced secondary formation of OVOCs at higher altitudes may further elevate photochemical activity aloft, potentially forming a positive feedback mechanism. These findings offer important implications of vertical observations for ozone control in megacities, like Shenzhen, highlighting the need to account for regional transport and secondary VOC formation aloft when designing effective mitigation strategies.

4. Conclusions

In summary, comprehensive UAV-based vertical observations in a megacity in the PRD, China revealed substantial vertical heterogeneity in VOC concentrations, sources, and photochemical reactivity within the PBL. In the morning, TVOC concentrations decreased with increasing altitude, indicating dominant influence from local emissions near the surface. At noon, primary NMHC components, such as alkanes and halocarbons, as well as OVOCs, increased with height, suggesting the influence of regional transport and potentially stronger photochemical processes aloft. OVOCs were the dominant species across all altitudes, accounting for 46.6% to 58.1% of total VOCs. Source apportionment demonstrated the dominance of industrial emissions within the PBL, with vehicular sources concentrated near the surface and biomass burning exerting greater influence at higher altitudes. Secondary formation indicators of OVOCs, namely OVOCs/NMHCs ratios, were higher at noon than in the morning, with notably greater values at higher altitudes compared to the surface, supporting the enhanced oxidation of OVOCs in upper layers of the PBL during the midday period. This finding provides new evidence that photochemical aging is not limited to the near-surface layer but is also active aloft, suggesting a vertically distributed oxidation environment, highlighting the need to account for elevated layers when assessing O3 formation potential. Therefore, strategies based solely on ground-level VOC observations may lead to an incomplete understanding of photochemical processes occurring within the whole PBL. Accurate understanding and mitigation of O3 pollution require vertically resolved measurements and multi-height assessments of precursors of O3. UAV platforms offer a promising pathway for acquiring such high-resolution vertical data to support more effective and vertically integrated O3 control strategies in complex urban environments. In the future, it will be necessary to expand the spatiotemporal coverage of UAV-based VOC observations and combine them with chemical transport models to improve vertical processes, and to systematically study the effect of the vertical structure of VOCs on O3 formation.

Supplementary Materials

The following supporting information can be downloaded at: https://www.mdpi.com/article/10.3390/atmos16080955/s1, Text S1: The description of OH consumption calculation method; Figure S1: Sampling site and surrounding environment; Figure S2: Unmanned aerial vehicle used for VOC sampling; Figure S3: Calibration working curves for some VOC species; Figure S4: Vertical evolution of the average source contributions to VOC concentrations and OFP; Figure S5: The vertical profiles of toluene/benzene (T/B) and m,p-xylene/ethylbenzene (X/E); Figure S6: Average OH radical exposure at each altitude calculated based on different species; Figure S7: Measured concentrations and photochemical consumptions of VOCs at each altitude; Table S1: Date and time of UAV measurements and corresponding execution times. References [39,40] are cited in the supplementary materials.

Author Contributions

Conceptualization, X.-F.H.; methodology, M.-X.T.; experiments, B.-X.W. and Y.C.; data analysis, M.-X.T. and B.-X.W.; writing—original draft preparation, M.-X.T.; writing—review and editing, X.-F.H. and H.Z. All authors have read and agreed to the published version of the manuscript.

Funding

This research was funded by National Natural Science Foundation of China (42407145) and the Science and Technology Plan of Shenzhen Municipality (JCYJ20220818100812028).

Institutional Review Board Statement

Not applicable.

Informed Consent Statement

Not applicable.

Data Availability Statement

The data used to support the findings of this study are available from the corresponding author upon request.

Conflicts of Interest

The authors declare no conflicts of interest.

References

  1. Cao, T.; Wang, H.; Li, L.; Lu, X.; Liu, Y.; Fan, S. Fast spreading of surface ozone in both temporal and spatial scale in Pearl River Delta. J. Environ. Sci. 2024, 137, 540–552. [Google Scholar] [CrossRef] [PubMed]
  2. Liu, B.; Liang, D.; Yang, J.; Dai, Q.; Bi, X.; Feng, Y.; Yuan, J.; Xiao, Z.; Zhang, Y.; Xu, H. Characterization and source apportionment of volatile organic compounds based on 1-year of observational data in Tianjin, China. Environ. Pollut. 2016, 218, 757–769. [Google Scholar] [CrossRef] [PubMed]
  3. Li, B.; Ho, S.S.H.; Li, X.; Guo, L.; Feng, R.; Fang, X. Pioneering observation of atmospheric volatile organic compounds in Hangzhou in eastern China and implications for upcoming 2022 Asian Games. J. Environ. Sci. 2023, 124, 723–734. [Google Scholar] [CrossRef] [PubMed]
  4. Mo, Z.; Shao, M.; Lu, S.; Niu, H.; Zhou, M.; Sun, J. Characterization of non-methane hydrocarbons and their sources in an industrialized coastal city, Yangtze River Delta, China. Sci. Total Environ. 2017, 593–594, 641–653. [Google Scholar] [CrossRef]
  5. Li, Q.; Zhang, H.; Cai, X.; Song, Y.; Zhu, T. The impacts of the atmospheric boundary layer on regional haze in North China. npj Clim. Atmos. Sci. 2021, 4, 9. [Google Scholar] [CrossRef]
  6. Guo, H.; Ling, Z.H.; Cheng, H.R.; Simpson, I.J.; Lyu, X.P.; Wang, X.M.; Shao, M.; Lu, H.X.; Ayoko, G.; Zhang, Y.L.; et al. Tropospheric volatile organic compounds in China. Sci. Total Environ. 2017, 574, 1021–1043. [Google Scholar] [CrossRef]
  7. Wu, S.; Tang, G.; Wang, Y.; Yang, Y.; Yao, D.; Zhao, W.; Gao, W.; Sun, J.; Wang, Y. Vertically decreased VOC concentration and reactivity in the planetary boundary layer in winter over the North China Plain. Atmos. Res. 2020, 240, 104930. [Google Scholar] [CrossRef]
  8. Mo, Z.; Huang, S.; Yuan, B.; Pei, C.; Song, Q.; Qi, J.; Wang, M.; Wang, B.; Wang, C.; Shao, M. Tower-based measurements of NMHCs and OVOCs in the Pearl River Delta: Vertical distribution, source analysis and chemical reactivity. Environ. Pollut. 2022, 292, 118454. [Google Scholar] [CrossRef]
  9. Zhang, H.; Zhang, Y.; Huang, Z.; Acton, W.J.F.; Wang, Z.; Nemitz, E.; Langford, B.; Mullinger, N.; Davison, B.; Shi, Z.; et al. Vertical profiles of biogenic volatile organic compounds as observed online at a tower in Beijing. J. Environ. Sci. 2020, 95, 33–42. [Google Scholar] [CrossRef]
  10. Li, X.B.; Yuan, B.; Wang, S.; Wang, C.; Lan, J.; Liu, Z.; Song, Y.; He, X.; Huangfu, Y.; Pei, C.; et al. Variations and sources of volatile organic compounds (VOCs) in urban region: Insights from measurements on a tall tower. Atmos. Chem. Phys. 2022, 22, 10567–10587. [Google Scholar] [CrossRef]
  11. Vierling, L.A.; Fersdahl, M.; Chen, X.; Li, Z.; Zimmerman, P. The Short Wave Aerostat-Mounted Imager (SWAMI): A novel platform for acquiring remotely sensed data from a tethered balloon. Remote Sens. Environ. 2006, 103, 255–264. [Google Scholar] [CrossRef]
  12. Geng, C.; Wang, J.; Yin, B.; Zhao, R.; Li, P.; Yang, W.; Xiao, Z.; Li, S.; Li, K.; Bai, Z. Vertical distribution of volatile organic compounds conducted by tethered balloon in the Beijing-Tianjin-Hebei region of China. J. Environ. Sci. 2020, 95, 121–129. [Google Scholar] [CrossRef]
  13. Díez-Palet, I.; Jaén, C.; Marco, E.; Van Drooge, B.L.; Fernández, P.; Grimalt, J.O. Measurement of volatile organic compounds using tethered balloons in a polluted industrial site in Catalonia (Spain). Environ. Sci. Pollut. Res. 2024. [Google Scholar] [CrossRef] [PubMed]
  14. Xue, L.; Wang, T.; Simpson, I.J.; Ding, A.; Gao, J.; Blake, D.R.; Wang, X.; Wang, W.; Lei, H.; Jin, D. Vertical distributions of non-methane hydrocarbons and halocarbons in the lower troposphere over northeast China. Atmos. Environ. 2011, 45, 6501–6509. [Google Scholar] [CrossRef]
  15. Baker, A.K.; Schuck, T.J.; Slemr, F.; van Velthoven, P.; Zahn, A.; Brenninkmeijer, C.A.M. Characterization of non-methane hydrocarbons in Asian summer monsoon outflow observed by the CARIBIC aircraft. Atmos. Chem. Phys. 2011, 11, 503–518. [Google Scholar] [CrossRef]
  16. Flocas, H.A.; Assimakopoulos, V.D.; Helmis, C.G.; Güsten, H. VOC and O3 Distributions over the Densely Populated Area of Greater Athens, Greece. J. Appl. Meteorol. 2003, 42, 1799–1810. [Google Scholar] [CrossRef]
  17. Li, Y.; Liu, B.; Ye, J.; Jia, T.; Khuzestani, R.B.; Sun, J.Y.; Cheng, X.; Zheng, Y.; Li, X.; Wu, C.; et al. Unmanned Aerial Vehicle Measurements of Volatile Organic Compounds over a Subtropical Forest in China and Implications for Emission Heterogeneity. ACS Earth Space Chem. 2021, 5, 247–256. [Google Scholar] [CrossRef]
  18. Liu, Y.; Wang, H.; Jing, S.; Zhou, M.; Lou, S.; Qu, K.; Qiu, W.; Wang, Q.; Li, S.; Gao, Y.; et al. Vertical Profiles of Volatile Organic Compounds in Suburban Shanghai. Adv. Atmos. Sci. 2021, 38, 1177–1187. [Google Scholar] [CrossRef]
  19. Li, X.; Wang, W.; Yang, S.; Cheng, Y.; Zeng, L.; Yu, X.; Lu, S.; Liu, Y.; Hu, M.; Xie, S.; et al. Ozone sensitivity regimes vary at different heights in the planetary boundary layer. Sci. Total Environ. 2024, 944, 173712. [Google Scholar] [CrossRef]
  20. Pang, X.; Chen, L.; Shi, K.; Wu, F.; Chen, J.; Fang, S.; Wang, J.; Xu, M. A lightweight low-cost and multipollutant sensor package for aerial observations of air pollutants in atmospheric boundary layer. Sci. Total Environ. 2021, 764, 142828. [Google Scholar] [CrossRef]
  21. Sun, J.; Wang, Y.; Wu, F.; Tang, G.; Wang, L.; Wang, Y.; Yang, Y. Vertical characteristics of VOCs in the lower troposphere over the North China Plain during pollution periods. Environ. Pollut. 2018, 236, 907–915. [Google Scholar] [CrossRef]
  22. Yang, S.; Zhu, B.; Shi, S.; Jiang, Z.; Hou, X.; An, J.; Xia, L. Vertical Features of Volatile Organic Compounds and Their Potential Photochemical Reactivities in Boundary Layer Revealed by In-Situ Observations and Satellite Retrieval. Remote Sens. 2024, 16, 1403. [Google Scholar] [CrossRef]
  23. Ting, M.; Yue-si, W.; Jie, J.; Fang-kun, W.; Mingxing, W. The vertical distributions of VOCs in the atmosphere of Beijing in autumn. Sci. Total Environ. 2008, 390, 97–108. [Google Scholar] [CrossRef]
  24. Liu, Z.; Zha, F.; Wang, Y.; Yuan, B.; Liu, B.; Tang, G. Vertical evolution of the concentrations and sources of volatile organic compounds in the lower boundary layer in urban Beijing in summer. Chemosphere 2023, 332, 138767. [Google Scholar] [CrossRef] [PubMed]
  25. Sangiorgi, G.; Ferrero, L.; Perrone, M.G.; Bolzacchini, E.; Duane, M.; Larsen, B.R. Vertical distribution of hydrocarbons in the low troposphere below and above the mixing height: Tethered balloon measurements in Milan, Italy. Environ. Pollut. 2011, 159, 3545–3552. [Google Scholar] [CrossRef]
  26. Yang, S.; Li, X.; Zeng, L.; Yu, X.; Liu, Y.; Lu, S.; Huang, X.; Zhang, D.; Xu, H.; Lin, S.; et al. Development of multi-channel whole-air sampling equipment onboard an unmanned aerial vehicle for investigating volatile organic compounds’ vertical distribution in the planetary boundary layer. Atmos. Meas. Tech. 2023, 16, 501–512. [Google Scholar] [CrossRef]
  27. Xia, S.Y.; Wang, C.; Zhu, B.; Chen, X.; Feng, N.; Yu, G.H.; Huang, X.F. Long-term observations of oxygenated volatile organic compounds (OVOCs) in an urban atmosphere in southern China, 2014–2019. Environ. Pollut. 2021, 270, 116301. [Google Scholar] [CrossRef]
  28. Watson, J.G.; Chow, J.C.; Fujita, E.M. Review of volatile organic compound source apportionment by chemical mass balance. Atmos. Environ. 2001, 35, 1567–1584. [Google Scholar] [CrossRef]
  29. Demir, S.; Saral, A. A New Modification to the Chemical Mass Balance Receptor Model for Volatile Organic Compound Source Apportionment. CLEAN—Soil Air Water 2011, 39, 891–899. [Google Scholar] [CrossRef]
  30. Huang, X.-F.; Zou, B.-B.; He, L.-Y.; Hu, M.; Prévôt, A.S.H.; Zhang, Y.-H. Exploration of PM2.5 sources on the regional scale in the Pearl River Delta based on ME-2 modeling. Atmos. Chem. Phys. 2018, 18, 11563–11580. [Google Scholar] [CrossRef]
  31. Zhu, B.; Huang, X.F.; Xia, S.Y.; Lin, L.L.; Cheng, Y.; He, L.Y. Biomass-burning emissions could significantly enhance the atmospheric oxidizing capacity in continental air pollution. Environ. Pollut. 2021, 285, 117523. [Google Scholar] [CrossRef]
  32. Zhu, B.; Cao, L.-M.; Xia, S.-Y.; Niu, Y.-B.; Man, H.-Y.; Du, K.; Yu, K.; Huang, X.-F. Identifying the airport as a key urban VOC source in the Pearl River Delta, China. Atmos. Environ. 2023, 301, 119721. [Google Scholar] [CrossRef]
  33. Kumar, A.; Singh, D.; Kumar, K.; Singh, B.B.; Jain, V.K. Distribution of VOCs in urban and rural atmospheres of subtropical India: Temporal variation, source attribution, ratios, OFP and risk assessment. Sci. Total Environ. 2018, 613–614, 492–501. [Google Scholar] [CrossRef] [PubMed]
  34. Huang, C.; Wang, H.L.; Li, L.; Wang, Q.; Lu, Q.; de Gouw, J.A.; Zhou, M.; Jing, S.A.; Lu, J.; Chen, C.H. VOC species and emission inventory from vehicles and their SOA formation potentials estimation in Shanghai, China. Atmos. Chem. Phys. 2015, 15, 11081–11096. [Google Scholar] [CrossRef]
  35. Li, X.B.; Yuan, B.; Huangfu, Y.; Yang, S.; Song, X.; Qi, J.; He, X.; Wang, S.; Chen, Y.; Yang, Q.; et al. Vertical changes in volatile organic compounds (VOCs) and impacts on photochemical ozone formation. EGUsphere 2024, 25, 2459–2472. [Google Scholar] [CrossRef]
  36. Lyu, X.; Li, H.; Lee, S.-C.; Xiong, E.; Guo, H.; Wang, T.; de Gouw, J. Significant Biogenic Source of Oxygenated Volatile Organic Compounds and the Impacts on Photochemistry at a Regional Background Site in South China. Environ. Sci. Technol. 2024, 58, 20081–20090. [Google Scholar] [CrossRef]
  37. Chen, W.T.; Shao, M.; Lu, S.H.; Wang, M.; Zeng, L.M.; Yuan, B.; Liu, Y. Understanding primary and secondary sources of ambient carbonyl compounds in Beijing using the PMF model. Atmos. Chem. Phys. 2014, 14, 3047–3062. [Google Scholar] [CrossRef]
  38. de Gouw, J.A.; Middlebrook, A.M.; Warneke, C.; Goldan, P.D.; Kuster, W.C.; Roberts, J.M.; Fehsenfeld, F.C.; Worsnop, D.R.; Canagaratna, M.R.; Pszenny, A.A.P.; et al. Budget of organic carbon in a polluted atmosphere: Results from the New England Air Quality Study in 2002. J. Geophys. Res. Atmos. 2005, 110. [Google Scholar] [CrossRef]
  39. McKeen, S.A.; Liu, S.C.; Hsie, E.-Y.; Lin, X.; Bradshaw, J.D.; Smyth, S.; Gregory, G.L.; Blake, D.R. Hydrocarbon ratios during PEM-WEST A: A model perspective. J. Geophys. Res. Atmos. 1996, 101, 2087–2109. [Google Scholar] [CrossRef]
  40. Kleinman, L.I.; Daum, P.H.; Lee, Y.-N.; Nunnermacker, L.J.; Springston, S.R.; Weinstein-Lloyd, J.; Hyde, P.; Doskey, P.; Rudolph, J.; Fast, J.; et al. Photochemical age determinations in the Phoenix metropolitan area. J. Geophys. Res. Atmos. 2003, 108. [Google Scholar] [CrossRef]
Figure 1. (a) The vertical profiles of average VOC concentrations from all samples collected during the observation period and (b) OFP of VOCs; (c) the vertical profiles of VOC concentrations during the morning period and (d) during the noon period.
Atmosphere 16 00955 g001
Figure 2. (a) The vertical profiles of VOC concentrations in different Chinese cities including Shenzhen (this study), Chengdu [19], Shanghai [18], and Beijing [24]. The Beijing data were obtained from tower-based observations, while data for the other cities were derived from UAV measurements; (b) proportions of VOC components at 0–100 m in different cities; (c) proportions of VOC components at 300–400 m in different cities.
Atmosphere 16 00955 g002
Figure 3. The vertical variations of different source contributions to VOC concentrations during the (a) morning and (b) noon periods.
Atmosphere 16 00955 g003
Figure 4. The average vertical profiles of (a) acetaldehyde, (b) hexanal, and (c) acetone concentrations. The vertical profiles of (d) acetone/ethane, (e) ethanol/isopentane, and (f) acetaldehyde/o-xylene during the entire observation period (average), morning, and noon, respectively.
Atmosphere 16 00955 g004
Disclaimer/Publisher’s Note: The statements, opinions and data contained in all publications are solely those of the individual author(s) and contributor(s) and not of MDPI and/or the editor(s). MDPI and/or the editor(s) disclaim responsibility for any injury to people or property resulting from any ideas, methods, instructions or products referred to in the content.