Article

Source Apportionment of PM2.5 in a Chinese Megacity During Special Periods: Unveiling Impacts of COVID-19 and Spring Festival

1
Key Laboratory for Urban Habitat Environmental Science and Technology, School of Environment and Energy, Peking University Shenzhen Graduate School, Shenzhen 518055, China
2
Chinese Society for Environmental Sciences, Beijing 100082, China
3
Shenzhen Academy of Metrology and Quality Inspection, Shenzhen 518107, China
*
Author to whom correspondence should be addressed.
Atmosphere 2025, 16(8), 908; https://doi.org/10.3390/atmos16080908
Submission received: 25 June 2025 / Revised: 22 July 2025 / Accepted: 24 July 2025 / Published: 26 July 2025
(This article belongs to the Special Issue New Insights in Air Quality Assessment: Forecasting and Monitoring)

Abstract

Long-term source apportionment of PM2.5 during high-pollution periods is essential for achieving sustained reductions in both PM2.5 levels and their health impacts. This study conducted PM2.5 sampling in Shenzhen from January to March over the years 2021–2024 to investigate the long-term impact of coronavirus disease 2019 and the short-term impact of the Spring Festival on PM2.5 levels. The measured average PM2.5 concentration during the research period was 22.5 μg/m3, with organic matter (OM) being the dominant component. Vehicle emissions, secondary sulfate, secondary nitrate, and secondary organic aerosol were identified by receptor model as the primary sources of PM2.5 during the observational periods. The pandemic led to a decrease of between 30% and 50% in the contributions of most anthropogenic sources in 2022 compared to 2021, followed by a rebound. PM2.5 levels in January–March 2024 dropped by 1.4 μg/m3 compared to 2021, mainly due to reduced vehicle emissions, secondary sulfate, fugitive dust, biomass burning, and industrial emissions, reflecting Shenzhen’s and nearby cities’ effective control measures. However, secondary nitrate and fireworks-related emissions rose significantly. During the Spring Festival, PM2.5 concentrations were 23% lower than before the festival, but the contributions of fireworks burning exhibited a marked increase in both 2023 and 2024. Specifically, during intense peak events, fireworks burning triggered sharp, short-term spikes in characteristic metal concentrations, accounting for over 50% of PM2.5 on those peak days. In the future, strict control over vehicle emissions and enhanced management of fireworks burning during special periods like the Spring Festival are necessary to reduce PM2.5 concentration and improve air quality.

1. Introduction

Fine particulate matter (PM2.5) is a major air pollutant that severely degrades air quality and poses substantial health threats. Exposure to PM2.5 is linked to worsened respiratory conditions (such as asthma), heightened cardiovascular risks (including heart attacks and strokes), and an increased likelihood of lung cancer and premature death [1,2]. Since 2013, with the implementation of a series of stringent control measures, such as the “Action Plan on Air Pollution Prevention and Control”, China has achieved a remarkable reduction in PM2.5 levels [3]. In 2024, the annual average concentration of PM2.5 in China was 29 μg/m3, representing a 60% decrease compared to 2013. However, this concentration level is still much higher than China’s primary air quality standard (15 μg/m3) and the World Health Organization’s (WHO) guideline value (5 μg/m3). Therefore, it is still necessary to continuously conduct source apportionment of PM2.5 and implement sustained control measures on corresponding sources to further reduce PM2.5 levels [4]. As the concentration level of PM2.5 has significantly decreased, its emission reduction potential is also markedly diminishing [5]. Autumn and winter are typically high-pollution seasons in China, characterized by PM2.5 concentrations significantly exceeding the annual average. This phenomenon is partly attributable to unfavorable meteorological conditions prevailing during these periods. Specifically, lower temperatures suppress atmospheric convection and evaporation, while diminished precipitation reduces the wet deposition of pollutants [6]. Consequently, these meteorological factors collectively promote elevated PM2.5 levels in autumn and winter [7]. This suggests greater potential for emission reduction during these seasons. Furthermore, high-pollution episodes critically exacerbate the health risks associated with PM2.5 exposure [8]. Conducting long-term PM2.5 source apportionment during high-pollution periods is crucial for achieving a continuous reduction in PM2.5 concentrations and mitigating its detrimental health impacts.
Both long-term and short-term special events, such as the coronavirus disease 2019 (COVID-19) pandemic [9,10] and China’s Spring Festival celebrations [11,12,13], have significant impacts on air quality. During the strict containment phase of the pandemic, the government implemented a series of robust measures, including lockdowns, reductions in industrial activities, restrictions on transportation [9], and alterations in population mobility patterns. These measures not only altered the pollutant emissions significantly but also potentially had profound effects on chemical transformation processes [14,15]. As pandemic-related restrictions were eased, urban daily life gradually resumed, and economic activities and population mobility experienced a noticeable rebound, which in turn influenced the trends in air quality. Currently, most studies focus on the short-term impacts of the COVID-19 pandemic on air quality, such as changes in air quality during the strict lockdown phase (when people stayed at home and all types of public activities were suspended) [16]. However, the COVID-19 pandemic, which lasted for nearly three years, has seen less attention paid to its long-term impacts, and its long-term repercussions on air quality remain unclear. The Spring Festival is the most significant traditional festival in China, marked by particularly notable shifts in production and lifestyle patterns, like the return of urban populations to their hometowns and the suspension of factory operations [17,18]. This can lead to air pollutants exhibiting a distinct shift in emission sources during the Spring Festival, characterized by declining emissions from regular sources and a sharp increase in emissions from fireworks and other episodic sources [19]. For example, several studies conducted in East China, Southwest China, as well as the Beijing-Tianjin-Hebei region have analyzed the short-term jump in PM2.5 concentrations caused by setting off fireworks during the Spring Festival, with results indicating that the contribution of firework sources ranged from 30% to 50% [20,21,22]. Additionally, a study combined online bulk and single-particle measurements data to conduct in-depth research on the sources of fireworks [23]. PM2.5 generated from fireworks poses significant health risks. For instance, a firework episode in Honolulu resulted in a 113% increase in emergency room visits among individuals with chronic respiratory disease [24]. Moreover, the elevated PM concentrations from fireworks are often accompanied by increased PM oxidative potential [25]. Collectively, short-term exposure to this pollution can trigger numerous respiratory ailments, elevate cancer risks, and lead to increased hospital admissions [26,27,28]. Given the unclear impact of long-term special events like the COVID-19 pandemic on air quality and considering that the changes in PM2.5 pollution sources during the Spring Festival are relatively complex, it is of great significance to investigate the impacts of both long-term and short-term special events on air quality. This will help yield profound insights into how human activities affect air quality patterns and provide scientific support for refining PM2.5 control measures. Though receptor models are widely used to study fireworks’ impact on PM during the Spring Festival and PM sources’ changes in pandemic control, most related studies are short-term, focusing only on the Spring Festival’s effect or the pandemic’s single impact. For example, some target specific years’ Spring Festival (involving merely one or two cases) [23], while others investigate PM sources during short lockdowns [29]. This work, based on long-term observations, comprehensively assesses these effects on PM2.5 composition and sources.
Shenzhen, as the first megacity in China to achieve the WHO Interim Target 2 standard (25 μg/m3) for PM2.5, recorded an annual average PM2.5 concentration of 17 μg/m3 in 2024. This indicates that Shenzhen still faces enormous challenges in further reducing PM2.5 source emissions. Thus, it is imperative to conduct PM2.5 source apportionment targeting high-pollution seasons to continuously decrease PM2.5 concentrations and meet the national first-level air quality standard. Affected by adverse meteorological conditions such as the transport of polluted air masses from the inland northern regions [7], scarce rainfall during the dry season, and active photochemical reactions [30], Shenzhen experiences relatively high PM2.5 concentrations from January to March. This study focuses on the high-pollution periods of PM2.5 in Shenzhen, conducting PM2.5 observations from January to March each year from 2021 to 2024 and identifying their sources by employing a receptor model. It investigates the impact of the Spring Festival on PM2.5 in Shenzhen and quantitatively assesses the contribution of fireworks to PM2.5. Moreover, the observational period from 2021 to 2024, encompassing both the pandemic period and the full reopening period, provides an opportunity to gain insight into the long-term impact of the pandemic on air quality. The findings of this study will support Shenzhen in further improving air quality and driving a continuous decline in PM2.5 concentrations while also providing valuable experience and references for air quality management during future public health events and the optimization of daily air quality.

2. Materials and Methods

2.1. PM2.5 Sampling

PM2.5 sampling was conducted every other day for 24 h durations from January to March during the years 2021 to 2024 at an urban site in Shenzhen. The sampling site was located on the rooftop of a building on the campus of Peking University Shenzhen Graduate School (22.60° N, 113.97° E, Figure S1). This sampling site, located in western Shenzhen and surrounded by residential and commercial areas with a major arterial road to the north, has no obvious pollution sources around it. It represents a typical urban site, effectively reflecting the average air quality levels and temporal variations in Shenzhen. The region lies within a subtropical monsoon climate zone, predominantly influenced by north and northeast winds from January to March. A total of 175 PM2.5 samples were collected using four-channel particulate samplers (TH-16A, Wuhan Tianhong Ltd., Wuhan, China) operating at an airflow rate of 16.7 L/min. For each sampler, two channels were employed with 47 mm Teflon filters, while the remaining channels were equipped with 47 mm Quartz filters (47 mm QMA, Whatman, Maidstone, UK). The PM2.5 concentrations were determined by weighing the Teflon membranes before and after sampling. Each filter was weighed three times, and the error of these three weighings was within 0.02 mg. Strict Quality Assurance/Quality Control measures (QA/QC) were implemented throughout the entire analytical process, with details provided in the Supplementary Information (Text S1). We also measured meteorological parameters at an hourly time resolution during the research period using a meteorological instrument (WXT536, Vaisala, Vantaa, Finland) to monitor meteorological variations in Shenzhen.

2.2. Chemical Analysis

A Teflon filter was extracted using ultrasonic agitation with ultrapure water, and following the filtration of the extract, an ion chromatograph (ICS-6000; Thermo Scientific Dionex, Sunnyvale, CA, USA) was utilized to determine the water-soluble ions. A total of nine ions were detected: Na+, NH4+, K+, Mg2+, Ca2+, F, Cl, SO42−, and NO3. Another Teflon filter underwent microwave digestion and was subsequently analyzed for 26 elements using an Inductively Coupled Plasma Mass Spectrometer (ICP-MS, Bruker AuroraM90, Bremen, Germany). The quartz filter was analyzed for organic carbon (OC) and elemental carbon (EC) using a Thermal/Optical Carbon Analyzer (DRI 2015, Desert Research Institute, Reno, NV, USA) following the IMPROVE protocol with its specified heating procedure. The mass of organic matter (OM) was calculated by multiplying the obtained OC by 1.8 according to our previous studies [7]. The details about the chemical analysis and QA/QC of the analysis process can be found in Text S1 and our previous works [7,31].

2.3. Positive Matrix Factorization (PMF) Model

This study employs the PMF model, a mathematically based receptor model proposed by Paatero [32], for PM2.5 source apportionment. The PMF model decomposes a time-series matrix X(n×m) of chemical component concentrations into two non-negative constant matrices using the least squares method: a factor concentration contribution matrix G(n×p) and a factor profile matrix F(p×m). The decomposition can be represented as follows:
X n × m = G n × p · F p × m + E n × m
E(n×m) is the residual matrix, which represents the difference between the measured and the modeled values. The letters n, m, and p denote the numbers of samples, chemical species, and sources, respectively. The objective function (Q) is minimized when the PMF model determines the G(n×p) and F(p×m) matrices, as follows:
Q = i = 1 n j = 1 m ( e i j / u i j ) 2
where uij and eij are the estimated uncertainty and residual, respectively. The uij is calculated as follows:
u i j = Error   fraction × x i j
where xij is the observed concentration of the chemical component, an element of X(n×m). The error fractions are ascertained through a trial-and-error process to obtain the optimal PMF results. The error fractions for all species are set within the range of 15% to 30% [7], with the exception of Mg, which is set at 36%. For concentrations of each species that fall below the method detection limit (MDLj), a value equal to 0.5 times the MDLj is substituted. In cases where data points are missing, they are replaced with the variable-specific mean values, and the associated uncertainties are estimated as four times these mean values [7]. We carefully chose the chemical species for input into the PMF model by taking into account the inter-component correlations, data quality (as reflected by availability rates), concentration levels of each species, and their respective indicative significance in characterizing source profiles [33]. In this study, a total of 20 chemical compositions (OM, EC, Cl, NO3, SO42−, NH4+, Ca, V, Ni, Zn, Cd, Pb, Na, Mg, Al, K, Fe, Ba, Sr, and Cu) from 175 samples were input into the PMF model (EPA PMF 5.0) to apportion PM2.5 sources. After testing models with 3 to 12 factors, 11 factors were determined to be the optimal solution (Qtrue/Qexp = 1.6). The bootstrap (BS) and displacement (DISP) error estimations indicated that the matching degrees of almost all sources exceeded 80% with only a few factor swaps (Table S1); moreover, each factor was relatively independent and exhibited a distinct source profile, which demonstrates that the analytical results of PMF are reasonable and stable.

3. Results and Discussion

3.1. Overview of PM2.5 and Its Components

The measured average PM2.5 concentration during the research period was 22.5 μg/m3. As shown in Figure 1, OM constituted the dominant component, with an average concentration of 8.9 μg/m3, accounting for 39.4% of the total mass. The average fractions of other PM2.5 species are in order of SO42− > NO3 > NH4+ > EC > mineral elements (the sum of Al, Ca, Ti, and Fe) > K > Na > Cl >Mg, constituting 19.0%, 12.2%, 8.9%, 6.1%, 2.7%, 1.6%, 0.9%, 0.8%, and 0.3% of the PM2.5 mass, respectively. In addition, trace elements constituted less than 1%, but their substantial content of toxic metals renders non-negligible toxicological effects [34]. Furthermore, there are other components (7.3%) attributed to undetected species (e.g., SiO2, trace moisture, and oxidized metal compounds) and measurement uncertainties inherent to analytical methods. From the perspective of meteorology variations (Table S2), annual changes in temperature, relative humidity, and wind speed over the four-year period were relatively small (coefficient of variation < 5%). The prevailing winds were predominantly northerly and northeasterly. However, precipitation was significantly lower in 2024. This reduction in rainfall implies fewer wet deposition processes, such as precipitation scavenging, which to some extent hindered the reduction in PM2.5 concentrations.
PM2.5 concentrations in January to March exhibited interannual variability, ranging from 7.5 to 57.0 μg/m3 (2021), 3.0 to 50.8 μg/m3 (2022), 8.9 to 44.1 μg/m3 (2023), and 7.2 to 56.5 μg/m3 (2024). The average concentrations of PM2.5 for each year initially decreased then increased, reaching their lowest point in 2022 (19.6 μg/m3). Compared to 2021 (24.4 μg/m3), the PM2.5 concentration in 2022 showed an abnormal decrease of 4.8 μg/m3, primarily due to the significant restrictions on human activities and the consequent substantial reduction in pollutant emissions during the critical period of COVID-19 prevention and control in Shenzhen from January to March 2022. Notably, given the severity of the COVID-19 outbreak, Shenzhen imposed a citywide lockdown (“slow-paced life” mode) from 14–20 March, which included stringent community confinement measures and the adoption of remote work arrangements. This initiative led to a sharp decline in anthropogenic emissions from sectors such as transportation, construction, and industry in the short term. Although 2021 was also during the pandemic period, there were only a limited number of COVID-19 cases, and strict epidemic control measures were not implemented. Consequently, relatively high PM2.5 concentrations are observed in 2021. The PM2.5 concentration rebounded to 22.9 μg/m3 in 2023 and remained at 22.9 μg/m3 in 2024, likely associated with the optimization of pandemic control policies, particularly the reclassification of COVID-19 from a Class A to a Class B infectious disease, which prompted adjustments in control measures. Following the end of widespread lockdowns, the resumption of regular societal production and activities led to increased emissions from pollution sources.
In contrast to the trend of PM2.5, OM concentrations reached their peak in 2021 (10.8 μg/m3) and subsequently decreased continuously to 8.0 μg/m3 in 2024. The sources of OM were complex, including primary emissions (fossil fuel and biomass burning) and secondary formation through VOC (volatile organic compound) oxidation [35]. Despite the declining trend in recent years, OM remained the primary contributor to PM2.5. SO42− concentrations were relatively similar in 2021, 2022, and 2024 (3.9–4.1 μg/m3, but were significantly higher in 2023 (5.1 μg/m3, p < 0.05). Given our previous findings that secondary sulfate in Shenzhen shows minimal spatial variability and has a broad potential source region (Figure S2), this suggests that regional transport is its primary influence [33,36]. The concentrations of NO3 exhibited a decreasing trend from 2021 to 2023, followed by a notable increase to 3.5 μg/m3 in 2024, with the proportion of NO3 in PM2.5 increasing to 15.4%, which reflects the complexity of the formation mechanism of nitrate. NH4+ concentrations remained relatively stable across the period (1.9–2.1 μg/m3). EC, K, and mineral elements exhibited a similar trend with PM2.5, first decreasing and then increasing. Their concentrations reached the lowest levels in January to March 2022, reflecting the impact of pandemic prevention measures on emissions from anthropogenic sources such as vehicle emissions, dust, biomass burning, industrial emissions, etc.
Following the end of the epidemic, the resumption of production and life activities increased pollutant emissions, leading to a rebound in PM2.5 levels. However, the PM2.5 concentration from January to March 2024 still decreased by 1.4 μg/m3 compared to that in 2021. Specifically, there were varying degrees of decline in OM, sulfate, EC, mineral elements, and trace elements, indicating the effectiveness of ongoing PM2.5 control measures.

3.2. PMF Source Apportionment

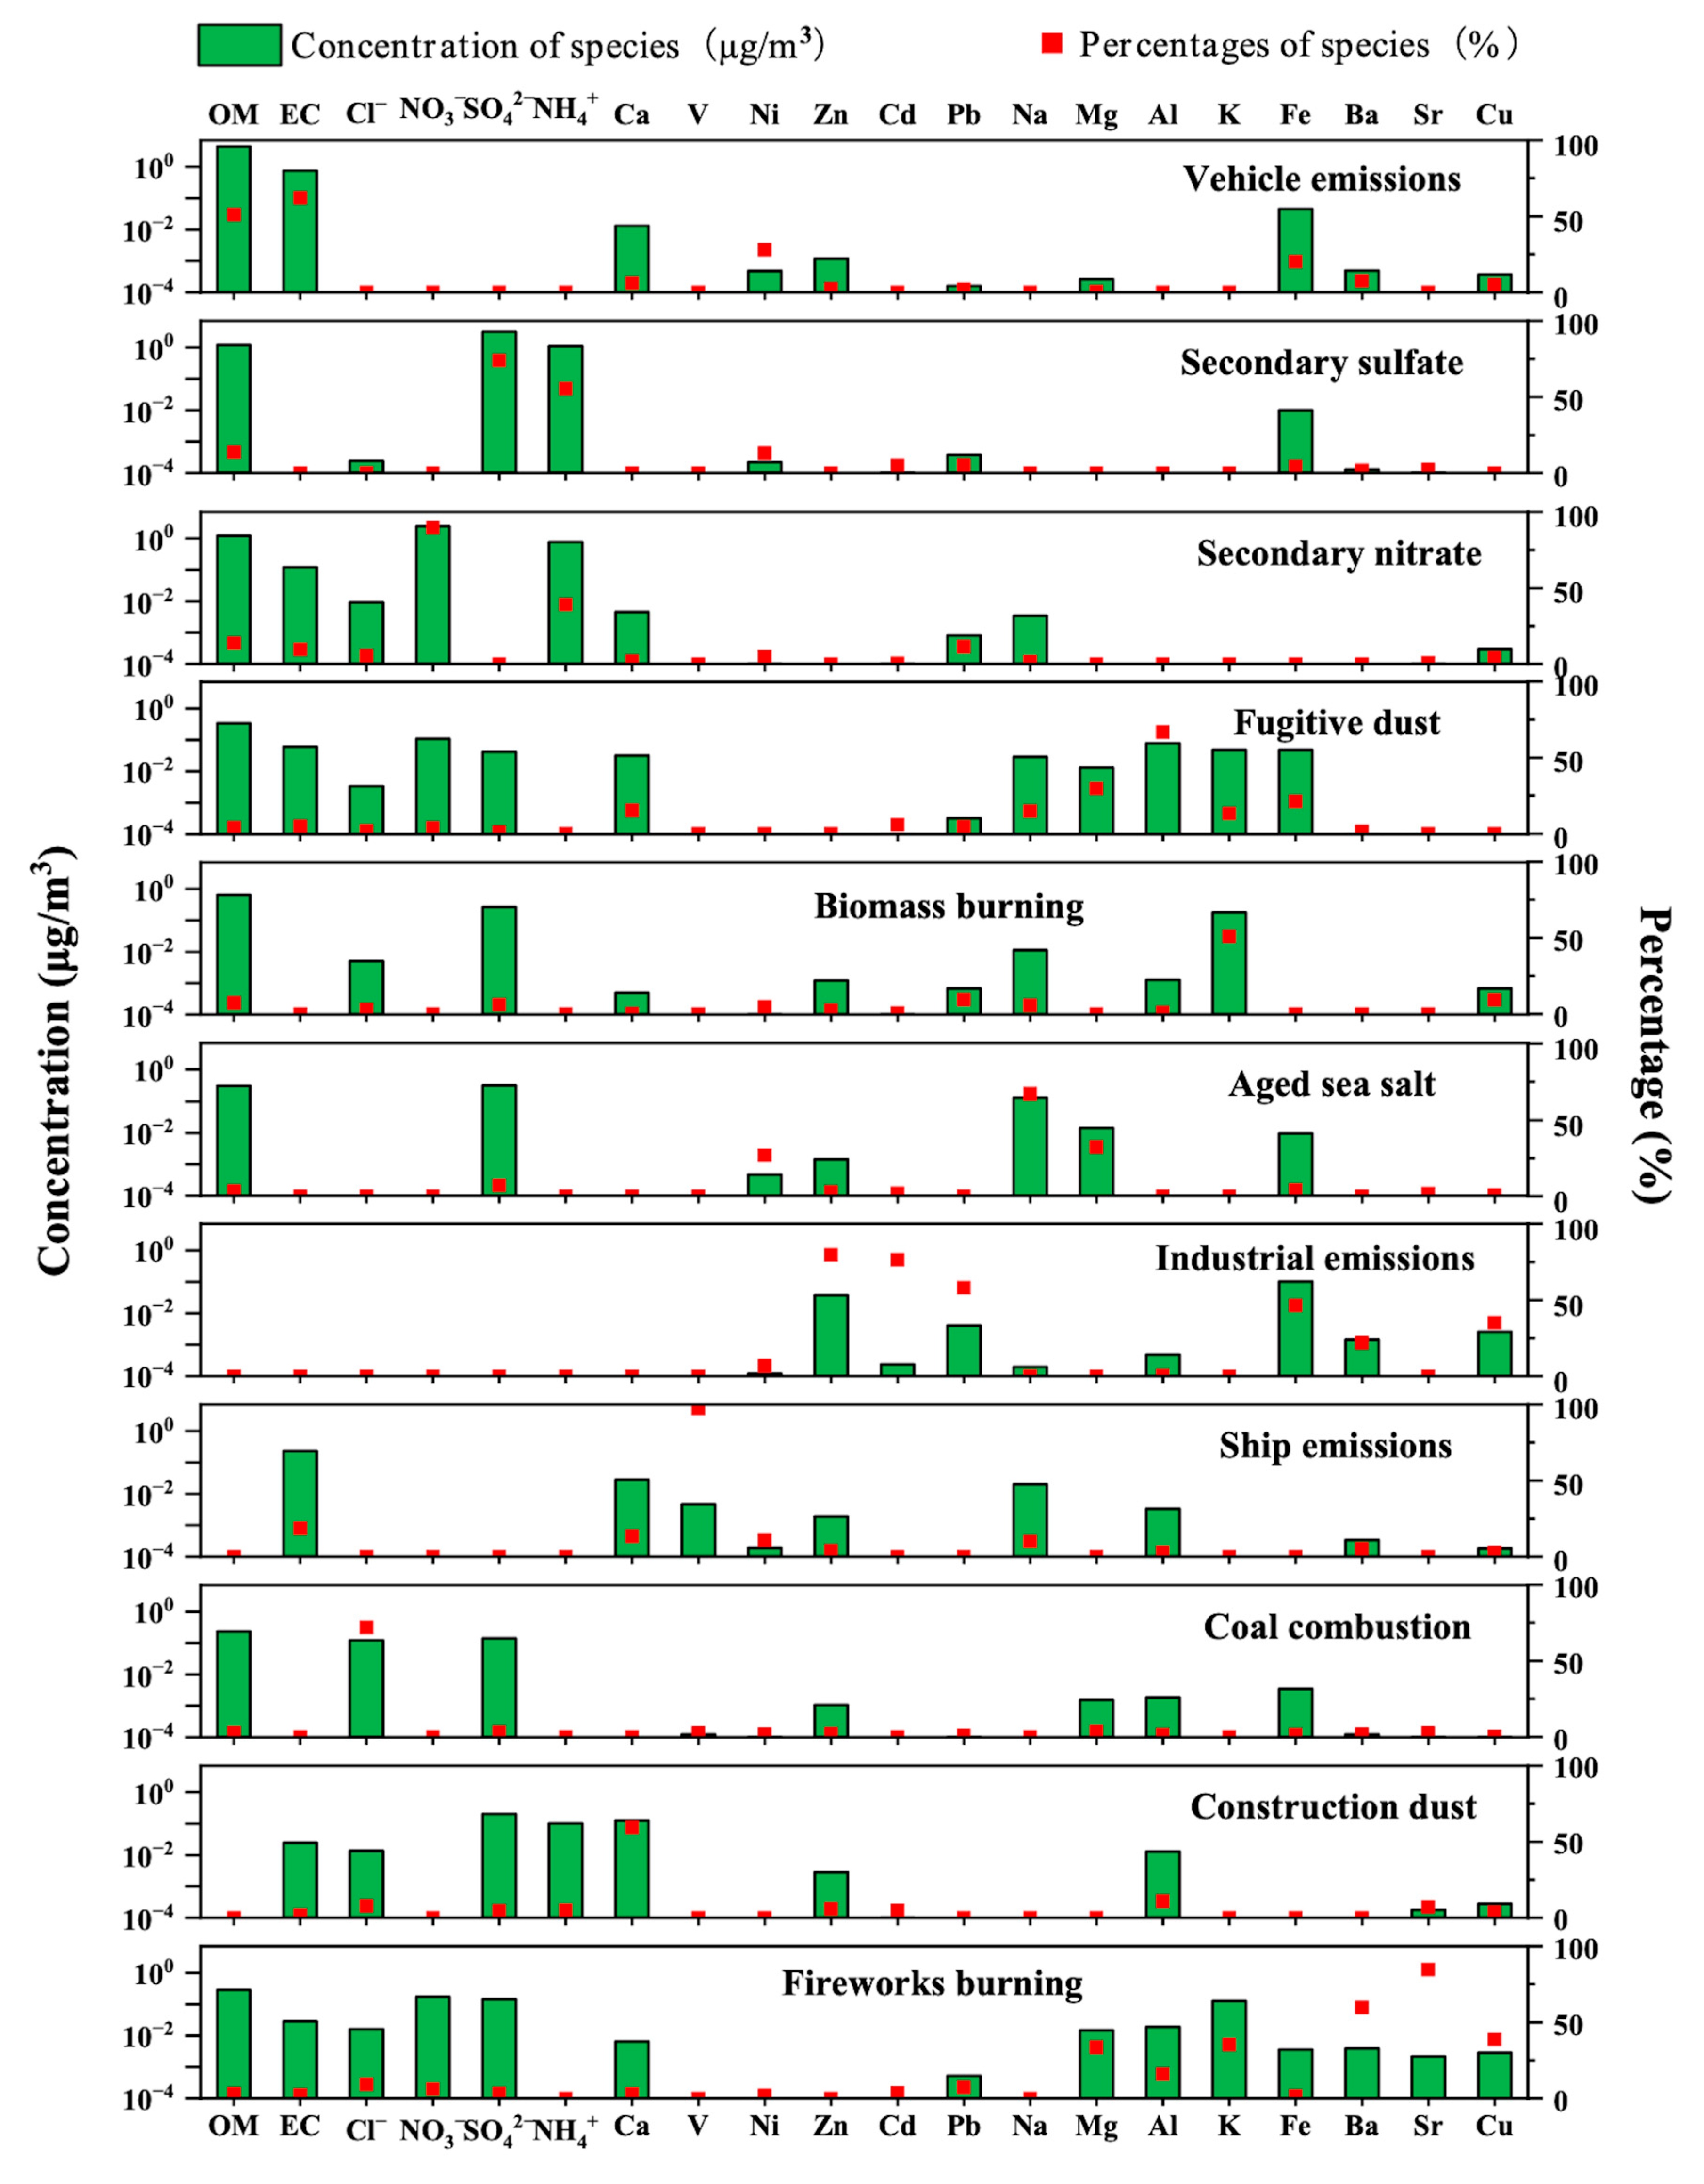
3.2.1. Identification of the PM2.5 Sources

The source apportionment results obtained by the PMF model are shown in Figure 2. Vehicle emissions are characterized by high loadings of OM (51.0%) and EC (62.1%), indicative of fuel combustion, alongside Zn and Fe, associated with tire and brake wear [37,38]. Secondary sulfate is dominated by SO42− (74.2%) and NH4+ (55.6%), with OM (14.0%) originating from organic matter formed via co-oxidation of VOCs [39,40]. Secondary nitrate is characterized by NO3 (89.9%) and NH4+ (39.3%) [41], with OM also contributing significantly (14.1%) [42], similar to secondary sulfate. Fugitive dust is marked by elevated levels of Al (66.9%), compensating for the unmeasured mass of Si and O, as inferred from the O/Al and Si/Al ratios in dust particles. Biomass burning is identified by elevated K and substantial OM [43]. Aged sea salt is marked by significant Na and Mg, and fresh sea salt primarily comprises NaCl, though chloride depletion occurs during aging and long-range transport [38]. Given this factor’s main potential sources in eastern coasts and Na’s weak link to other anthropogenic sources/components (R2 < 0.15), it was confirmed as aged sea salt. Aged sea salt has negligible Cl due to Cl consumption and potential uncertainties in PMF model’s assessment of non-key components, as seen in other PMF-based studies [44,45,46]. Industrial emissions exhibit highly enriched Pb, Cd, and Zn, linked to anthropogenic activities like metallurgical processes releasing metals such as Zn and Cd [47,48]. Ship emissions have high loadings of V and Ni, alongside EC. V and Ni serve as tracers for residual fuel oil combustion [49], consistent with emissions in coastal port cities like Shenzhen with extensive maritime trade [50]. Coal combustion is dominated by Cl because our previous research revealed a spatial distribution similarity between Cl and coal fired power plants in the Pearl River Delta, with Cl likely deriving from NH4Cl formed from coal-derived HCl and NH3 [7]. Construction dust shows a high apportionment for Ca, reflecting its prevalence in cement and lime building materials [51,52]. Due to the research period overlapping with the Chinese Spring Festival, a special source, fireworks burning, was found. It is distinguished by dominant tracers Sr (84.8%) and Ba (59.8%), accompanied by elevated K and Mg, elements commonly used in pyrotechnics [53,54]. Additionally, secondary organic aerosol (SOA) is estimated from the OM in both secondary nitrate and secondary sulfate [55], which are classified as semi-volatile oxygenated organic aerosol (SV-OOA) and low-volatility oxygenated organic aerosol (LV-OOA), respectively.

3.2.2. Trends of PM2.5 Sources

As shown in Figure 3, vehicle emissions constituted the largest share at 23.3% during the whole observational period, underscoring its prominent impact on urban air quality. Secondary inorganic aerosols, represented by secondary sulfate (19.2%) and secondary nitrate (15.0%), were major contributors, while SOA accounted for a further 10.8%. These four sources dominated the PM2.5 burden, contributing nearly 70% of the total mass. Other notable sources include fugitive dust (6.8%), biomass burning (4.9%), fireworks burning (3.7%), and aged sea salt (3.4%). Coal combustion, construction dust, ship emissions, and industrial emissions had relatively minor impacts (0.7–2.3%). There was a portion of 6.6% that refers to “others”, encompassing model residuals and potential sources not fully resolved.
Contributions of vehicle emissions decreased significantly from 6.4 μg/m3 in 2021 to 4.6 μg/m3 in 2024, primarily because of promoting the use of new energy vehicles and the upgrading of vehicle emission standards as well as fuel quality standards. SOA concentrations remained relatively stable (2.3–2.5 μg/m3), suggesting no significant change in secondary organic formation. The contributions of fugitive dust and industrial emissions declined by 0.8 μg/m3 and 0.1 μg/m3 from 2021 to 2024, respectively. The fugitive dust reduction is attributed to the “Shenzhen Blue” Sustainable Action Plan and enhanced dust control policies, while the decline in industrial emissions reflects long-term emission reduction strategies and industrial transformation. Conversely, concentrations of aged sea salt, construction dust, coal combustion, and fireworks burning increased by 0.8 μg/m3, 0.2 μg/m3, 0.2 μg/m3, and 1.0 μg/m3, respectively. Aged sea salt, a natural source, might relate to transport and meteorological conditions, while the increase in construction dust might be linked to nearby construction activities. Fireworks burning peaked at 1.4 μg/m3 in 2023, coinciding with the pent-up celebratory demand following the easing of COVID-19 restrictions, and remained high at 1.2 μg/m3 in 2024. Notably, primary sources including fugitive dust, biomass burning, ship emissions, and construction dust had significantly lower concentrations in 2022, linked to strict pandemic control measures. Secondary sulfate and coal combustion concentrations were significantly higher in 2023 (5.4 μg/m3), corresponding to concurrent increases in SO42− and Cl. Given Shenzhen’s minimal local coal consumption and the strong association of secondary sulfate with regional transport, these elevated levels indicate the increased influence of regional transport in 2023. Overall, the reduction in PM2.5 concentration in January to March from 2021 to 2024 was primarily driven by decreases in vehicle emissions, secondary sulfate, fugitive dust, biomass burning, and industrial emissions (decreasing by 0.1~1.8 μg/m3), reflecting the effectiveness of Shenzhen’s and surrounding cities’ emission controls. However, increases in secondary nitrate and fireworks burning contributions (rising by 0.8 μg/m3 and 1.0 μg/m3, respectively) highlight the future need to strengthen controls on secondary nitrate and manage fireworks from special events like the Spring Festival.

3.3. The Impact of the Spring Festival on PM2.5

To investigate the effect of the Spring Festival on PM2.5, the Lunar New Year’s Day was taken as the reference day, and the period from January to March was divided into three periods based on the Chinese lunar calendar: before the Spring Festival (from 1 January to the day before Lunar New Year’s Eve, BSF), Spring Festival (from the Lunar New Year’s Eve to the Lantern Festival, SF), and after the Spring Festival (from the day after the Lantern Festival to 31 March, ASF).

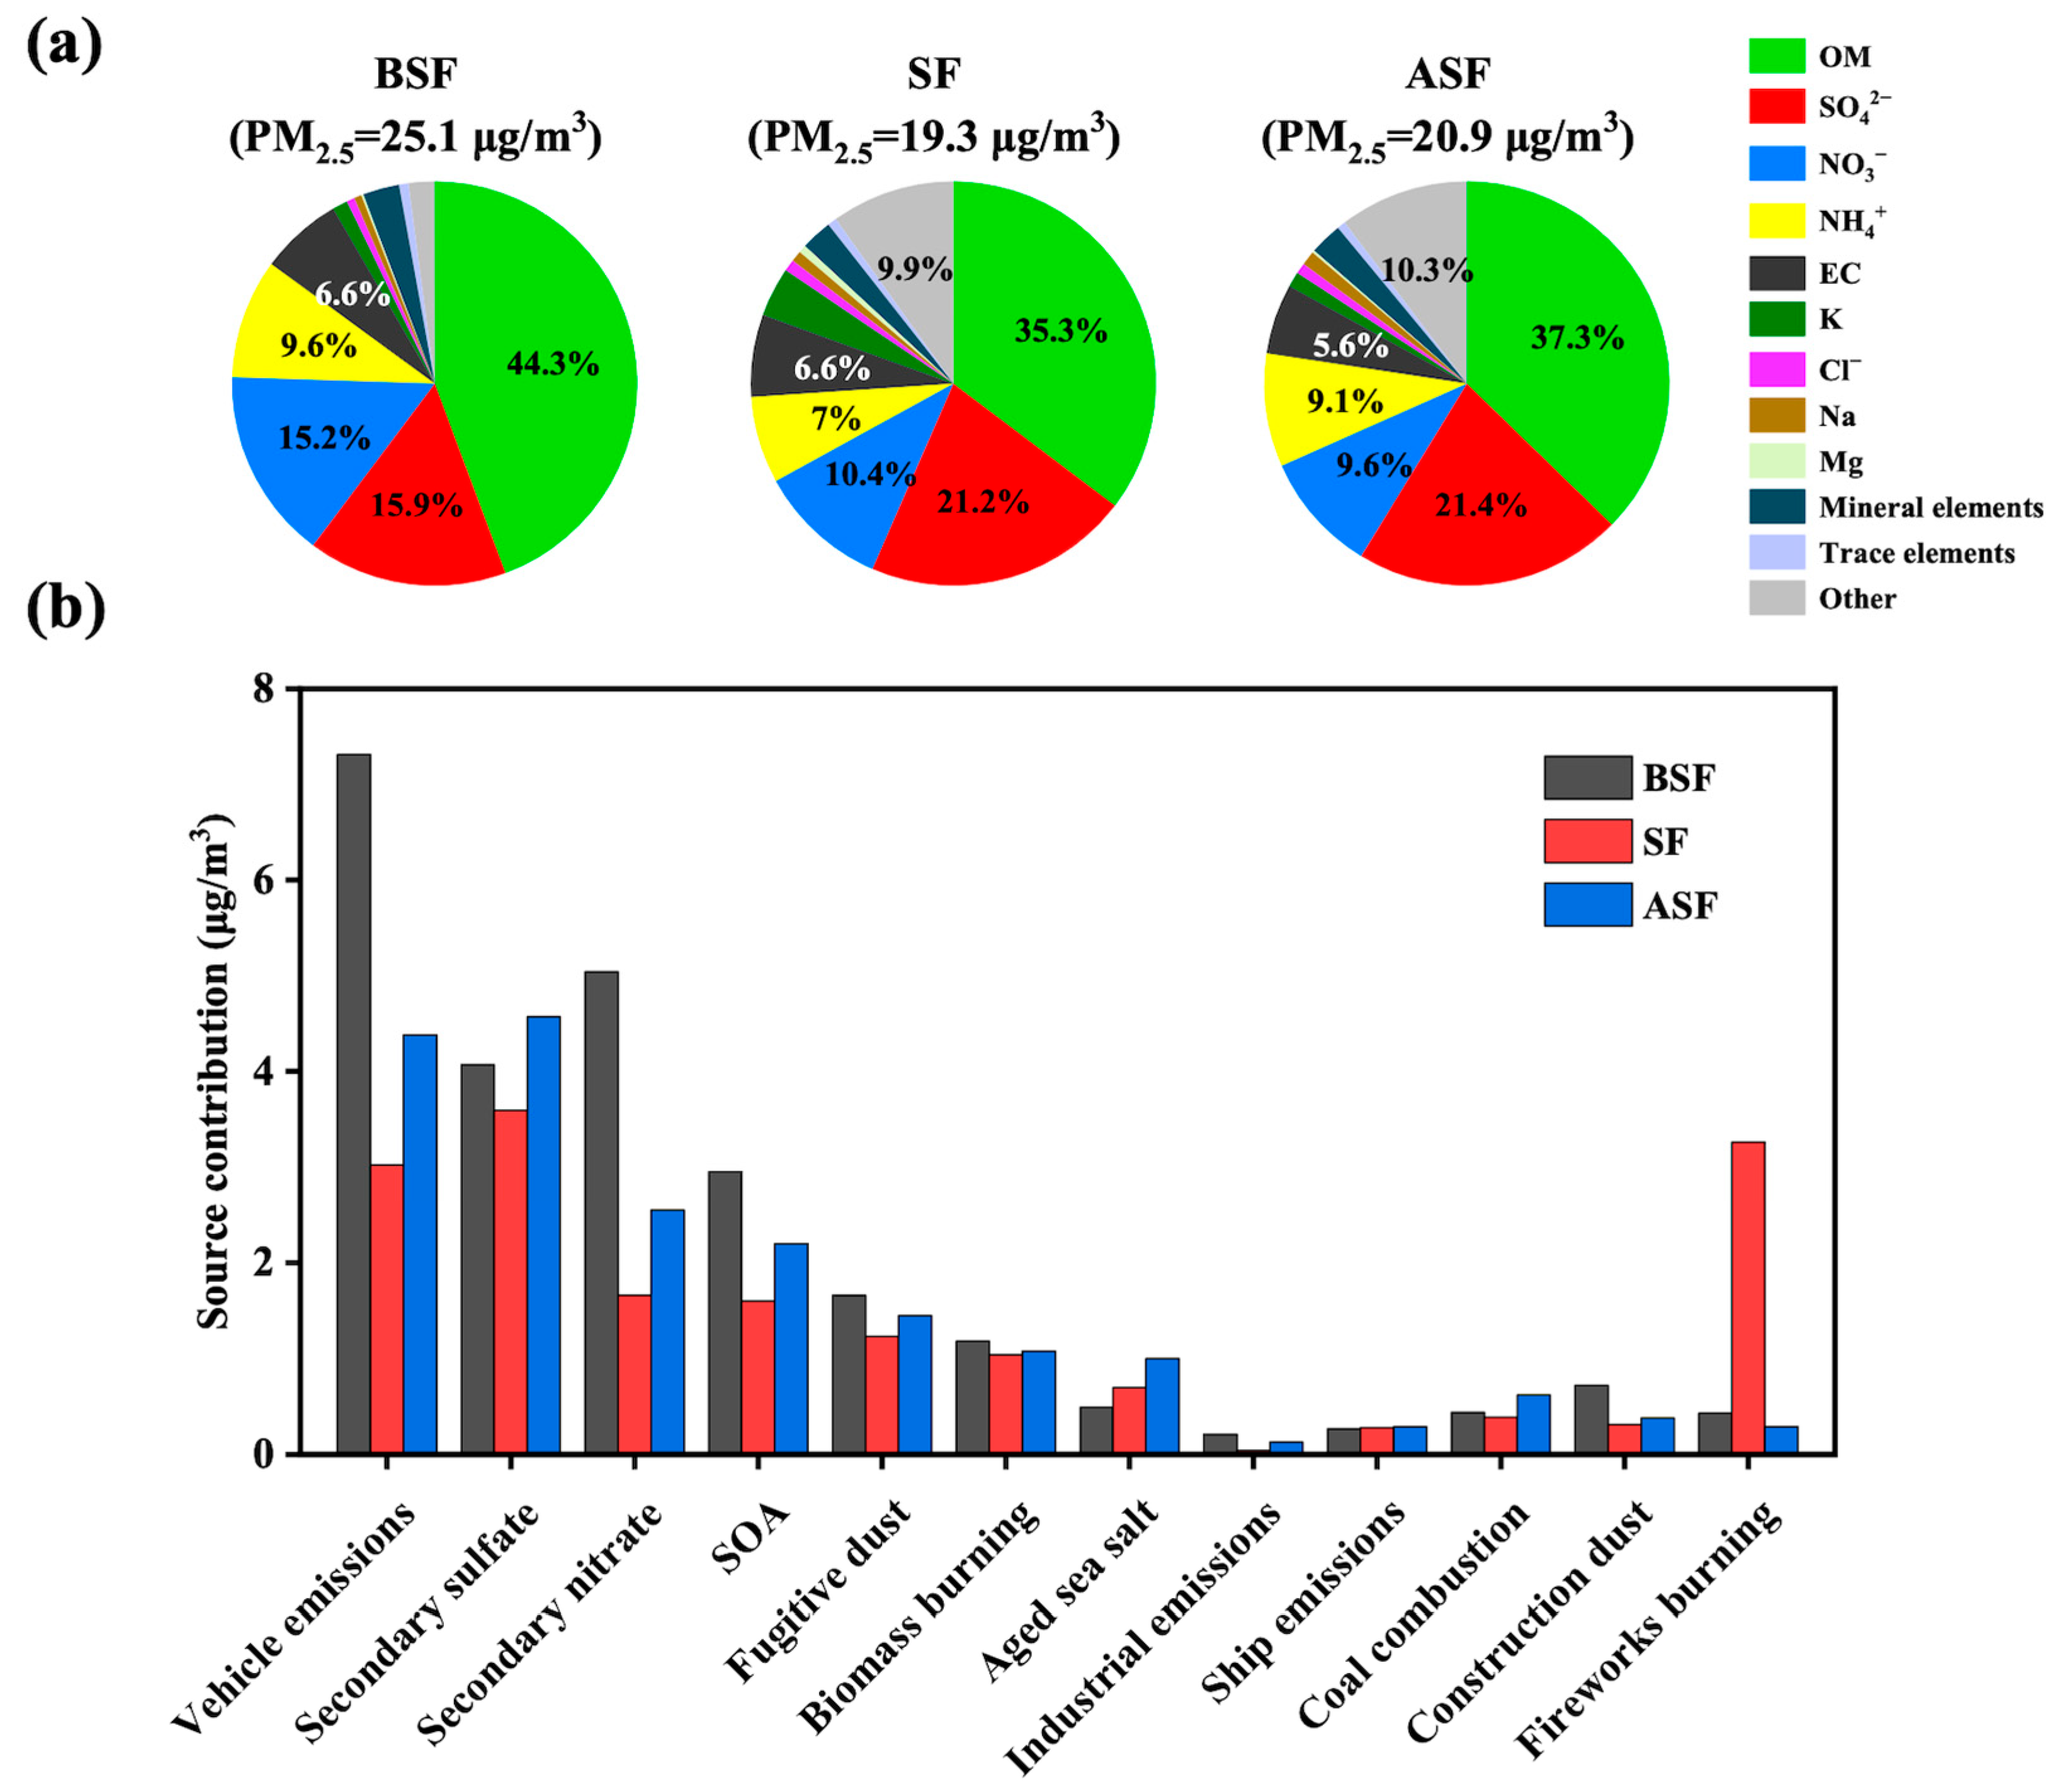
3.3.1. Changes in PM2.5 Compositions and Source Structure

PM2.5 concentrations during the SF period were 23.1% lower than the BSF period in the observed years, primarily attributed to reduced emissions from industrial shutdowns and diminished human activities [12]. PM2.5 concentrations during the SF period in 2023 exhibited high levels driven predominantly by the higher sulfate (SO42−), indicating enhanced regional transport influences. Compared to the SF period, PM2.5 concentrations generally rebounded by 8.2% in the ASF period but remained below the BSF period’s baselines.
Figure 4a depicts the PM2.5 components during the three periods, with detailed interannual variations provided in Figure S3. The proportions of OM and NO3 decreased compared to the BSF period, from 44.3% and 15.2% to 35.3% and 10.4%, respectively. This is mainly due to the significant “Empty-City Effect” in Shenzhen during the SF period, where a large number of migrant workers returned to their hometowns, and internal activities (industry, transportation, and commerce) were extremely weakened, leading to sharp declines in local emissions (VOCs, NOx, and primary OM). Following the resumption of normal activities in the ASF period, the proportion of OM rebounded to 37.3%, while NO3 remained low at 9.6%. This nitrate depletion can be attributed to its temperature-sensitive semi-volatile characteristics. The NH4NO3 volatilization increased, and particle-phase retention decreased when the temperature rebounded in March. In contrast, the proportion of SO42− in PM2.5 rose during the SF period, as sulfate concentration was similar to BSF levels, while other components declined, increasing its share in PM2.5.
During the SF period in 2021–2024, secondary sulfate (17.5–20.0%), vehicle emissions (12.0–23.1%), and secondary nitrate (5.8–13.8%) were primary contributors to PM2.5 (Figure S4). Compared to the BSF period, the concentrations of vehicle emissions, secondary nitrate, SOA, industrial emissions, and construction dust showed significant reductions (Table S3, p < 0.05) during the SF period in 2021–2024 (Figure 4b), attributable to decreased primary emissions from limited mobility and factory closures. Reduced gaseous precursors emissions also suppressed secondary formation, explaining the SOA and secondary nitrate reductions. Notably, fireworks burning contributed substantially to PM2.5 during the SF period in 2023 (23.3%) and 2024 (25.5%), correlating with celebratory activities on Lunar New Year’s Eve and Lantern Festival [54]. Aged sea salt and ship emissions slightly increased, with the rise in sea salt attributed to its natural origin (less anthropogenic influence), while the increase in ship emissions stems from dependence on international trade rather than domestic holiday activities. Biomass burning and coal combustion remained stable during the SF period, as these sources are mainly influenced by regional transport, and the decrease in local emissions has little impact on them. During the ASF period, the pollution patterns gradually reverted to normal, the concentration and proportion of vehicle emissions, secondary nitrate, SOA, fugitive dust, industrial emissions and construction dust increased but were still lower than in the BSF period, reflecting gradual socioeconomic recovery. Compared to the BSF period, the proportion of secondary sulfate increased in the ASF period, responding to the increase in the contribution of regional transport to PM2.5 in Shenzhen after the Spring Festival.

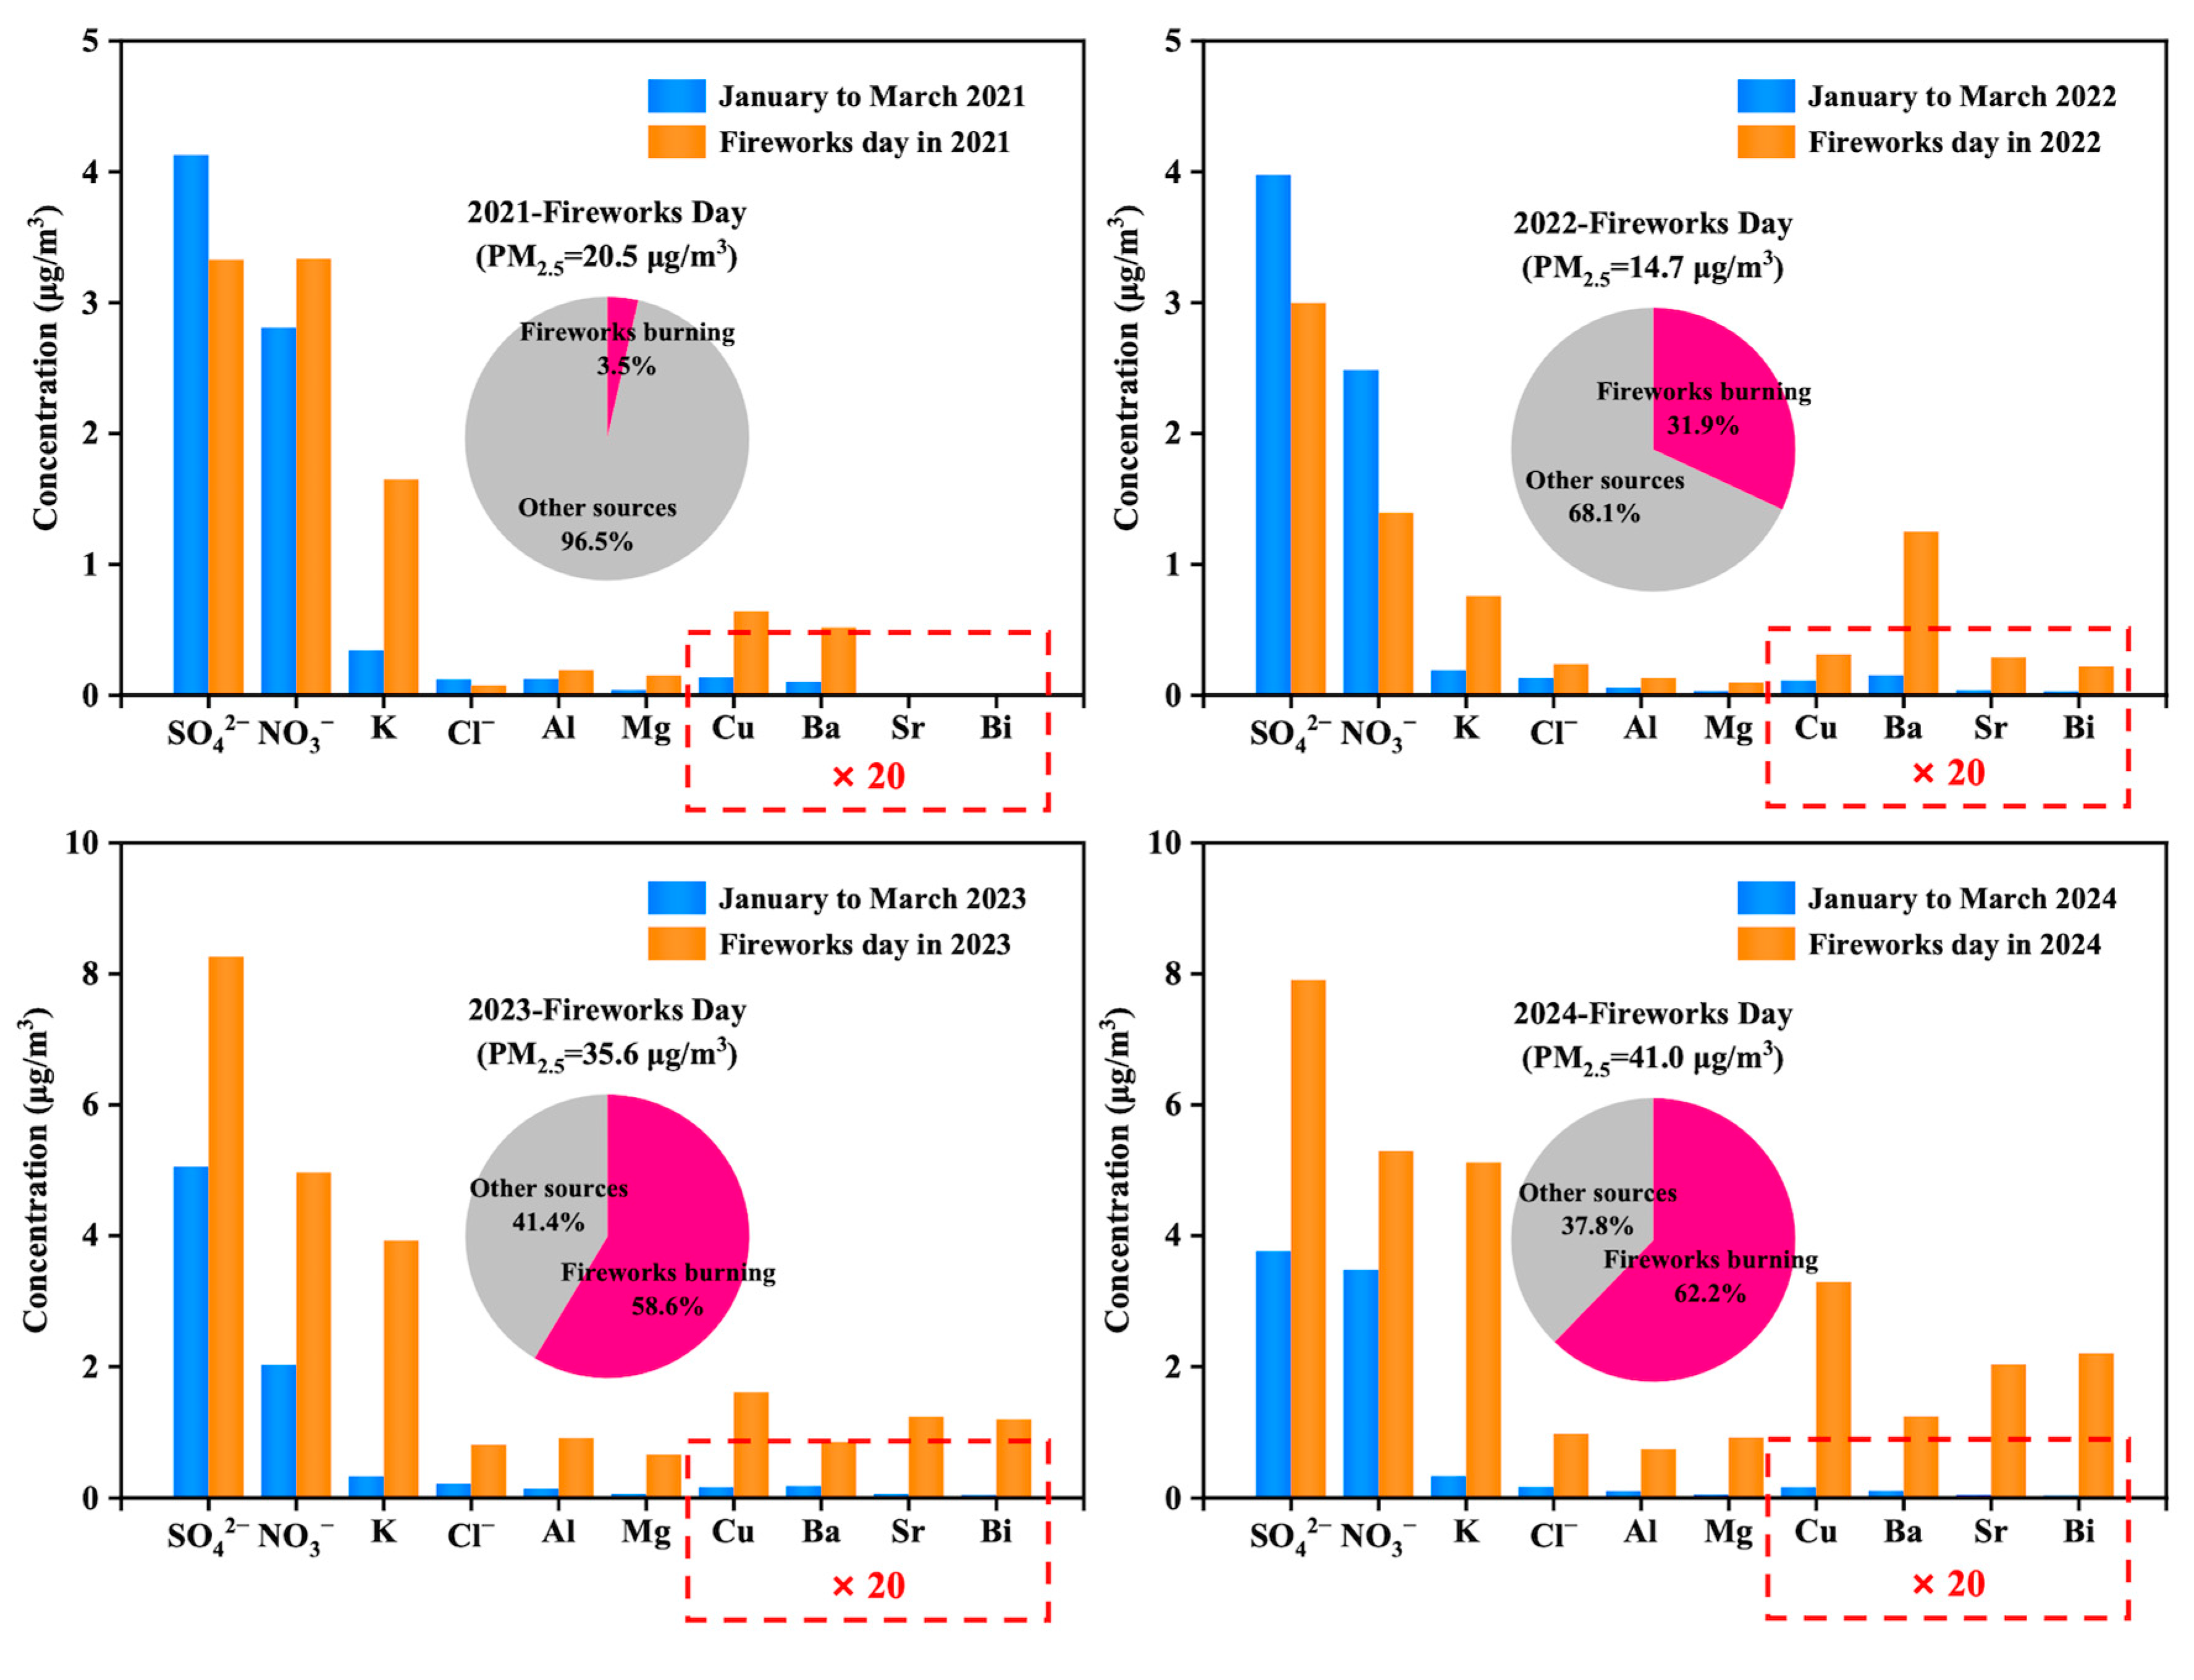
3.3.2. Significant Impact of Fireworks Burning

Air pollution caused by fireworks burning during the Spring Festival presents short-duration, high-intensity characteristics [56,57]. PM2.5 concentrations typically peak between the Lunar New Year’s Eve and the second day of the lunar year, and this specific day is defined as Fireworks Day. This phenomenon was particularly pronounced in 2023 and 2024, with the PM2.5 concentrations on Fireworks Day reaching 35.6 μg/m3 and 41.0 μg/m3, respectively, which are 1.4 and 2.1 times the average concentration during the SF period. Similar to the PM2.5 trends, interannual differences in Fireworks Day stem from changes in epidemic prevention policies. In 2021, the policy advocated “staying at home for the Spring Festival” and strictly controlled gatherings, while in 2022, Shenzhen was in the outbreak period of the epidemic, and people’s mobility was restricted. After the end of COVID-19 pandemic in December 2022, the concentrated fireworks burning increased during the SF period in 2023 and 2024, leading to prominent peaks in PM2.5. Comparing the component concentrations of Fireworks Day with the average concentrations of the same year in January to March (excluding Fireworks Day), the concentrations of elements related to fireworks burning (K, Al, Mg, Cu, Ba, Sr, and Bi) [58] showed a significant increase (Figure 5). The concentrations of these elements were 4.0–15.1 times (K), 1.6–6.9 times (Al), 3.1–17.1 times (Mg), 2.8–19.6 times (Cu), 5.0–11.3 times (Ba), 7.9–39.9 times (Sr), and 7.3–56.6 times (Bi) the average concentration in January to March. The key chemical components in fireworks burning serve distinct functions: oxidizers (e.g., KNO3) provide propulsion; elements like Al and Mg generate bright light; and metallic powders (e.g., Cu for blue, Ba for green, and Sr for red) produce specific colors [59,60,61]. Additionally, concentrations of SO42− and NO3 on Fireworks Day in 2023 and 2024 were higher than the average concentration from January to March, which is attributable to the sharp increase in atmospheric SO2 and NO2 resulting from fireworks burning [25]. The source apportionment results indicate that the fireworks burning contributions reached 58.6% and 62.2% on Fireworks Day in 2023 and 2024, respectively. Notably, fireworks burning still has large contributions during subsequent days of the SF period, particularly on the sixth day of the Lunar New Year and the Lantern Festival, with contributions remaining above 15%. These findings further confirm that the abrupt spike in PM2.5 concentrations at the beginning of the Spring Festival is primarily attributable to fireworks burning, underscoring that stricter regulation of fireworks burning could effectively reduce PM2.5 concentrations during the celebrations.

4. Conclusions

This study investigated the long-term variation of PM2.5 during high-pollution periods by conducting PM2.5 sampling annually from January to March during 2021–2024. It specifically examined the impact of COVID-19 and the Spring Festival on PM2.5 in Shenzhen and quantitatively assessed the contribution of fireworks to PM2.5.
The measured average PM2.5 concentration in Shenzhen during the research periods was 22.5 μg/m3, with OM being the dominant component, accounting for 39.4% of the PM2.5 mass, followed by SO42−, NO3, NH4+, and EC. PM2.5 concentrations bottomed out in 2022 and subsequently rebounded, a trend driven by pandemic control measures implemented from 2021 to 2022 (notably, the stringent lockdowns in 2022, which effectively reduced PM2.5 concentrations) The relaxation of pandemic restrictions in late 2022 facilitated the resumption of societal activities in 2023–2024. Most of the components exhibited similar variation trends to PM2.5, with concentrations reaching their lowest point in 2022 and then rebounding. However, the complexity of the sources and formation mechanisms of OM and nitrate leads to some discrepancies in their variation trends compared to PM2.5.
Vehicle emissions (23.3%), secondary sulfate (19.2%), secondary nitrate (15.0%), and SOA (10.8%) were identified by the PMF model as the primary sources of PM2.5 during the observational periods. The pandemic led to a significant decrease in the contributions of most anthropogenic sources (such as vehicle emissions, dust, biomass burning, industrial emissions, and shipping emissions) to PM2.5 in 2022, followed by a subsequent rebound. A notable increase in the contribution of secondary sulfate in 2023 suggests that the PM2.5 rebound is also associated with enhanced regional transport influence. Despite post-epidemic resumption of activities leading to more pollutant emissions and a rebound in PM2.5 levels, the PM2.5 concentration in January–March 2024 was 1.4 μg/m3 lower than in 2021, primarily due to the declining trend in concentrations from vehicle emissions, secondary sulfate, fugitive dust, biomass burning, and industrial emissions over the four-year period, which reflects the effectiveness of Shenzhen’s and surrounding cities’ control measures targeting these emission sources. Conversely, concentrations of secondary nitrate and fireworks burning increased markedly, highlighting the future need for NOx pollution control and management of special festive pollution sources like fireworks burning.
The composition and source structure of PM2.5 underwent significant changes during the SF period. PM2.5 concentrations during the SF period were 23% lower than the BSF period due to the sharp drop in holiday human activities, reducing contributions from primary anthropogenic sources like vehicle emissions, industrial emissions, and construction dust and also suppressing secondary aerosol formation and lowering their concentrations. However, the contribution of fireworks burning surged dramatically. Influenced by pandemic controls, fireworks burning contributed less than 15% to PM2.5 during the 2021 and 2022 Spring Festivals, but its contribution surged to 23.3% and 23.5%, respectively, in the 2023 and 2024 Festivals after strict controls ended. Specifically, from New Year’s Eve to the second day of the lunar new year, fireworks burning not only triggered sharp, short-term spikes in characteristic metal (K, Al, Mg, Cu, Ba, Sr, and Bi) concentrations, with potential health risks demanding heightened attention, but it also accounted for over 50% of PM2.5 during peak events, becoming the dominant source. PM2.5 levels are affected by both source emissions and meteorological factors. Limited by data completeness, this work only quantified source emissions’ impact on PM2.5 without quantitatively evaluating the influence of meteorological factors, thus having limitations. Future research should use high-resolution particulate and meteorological data to quantitatively probe meteorology’s role and assess source emission changes more accurately. This study highlights the long-term impact of the pandemic on PM2.5 and the short-term effect triggered by activities during the Spring Festival. Strict control over vehicle emissions and enhanced management of fireworks burning during special periods like the Spring Festival are necessary in the future to reduce PM2.5 concentration and improve air quality.

Supplementary Materials

The following supporting information can be downloaded at https://www.mdpi.com/article/10.3390/atmos16080908/s1. Text S1: Detailed description of chemical analysis and quality assurance/quality control (QA/QC). Figure S1: Location of the sampling site. Figure S2: The Potential Source Contribution Function (PSCF) results of secondary sulfate (left) and aged sea salt (right). Figure S3: The proportion of PM2.5 components during the BSF, SF and ASF periods from 2021 to 2024 in Shenzhen. Figure S4: PM2.5 source contributions during the BSF, SF, and ASF periods from 2021 to 2024 in Shenzhen. Figure S5: Data quality assessment: (a) Comparison between gravimetric PM2.5 concentrations and reconstructed component concentrations; (b) Comparison of input and output mass of PM2.5 concentrations in the PMF model. Table S1: Error estimation summary results for the 11 solutions. Table S2: Mean values of major meteorological parameters, January to March 2021–2024. Table S3: Comparison of PM2.5 Sources: BSF vs. SF (Independent Samples t-tests).

Author Contributions

Funding acquisition, X.P.; investigation, K.T., Y.L., S.L. and S.T.; methodology, K.T.; supervision, X.P.; writing—original draft, K.T. and X.P.; writing—review and editing, X.P., J.W., S.W., T.X. and T.Y. All authors have read and agreed to the published version of the manuscript.

Funding

This research was funded by the National Natural Science Foundation of China (42407132).

Institutional Review Board Statement

Not applicable.

Informed Consent Statement

Not applicable.

Data Availability Statement

The original contributions presented in this study are included in the article/Supplementary Materials. Further inquiries can be directed to the corresponding author(s).

Acknowledgments

Thanks to all the authors for their efforts, and special thanks to the editors and reviewers.

Conflicts of Interest

Author Shaoxia Wang has involved as employee in Chinese Society for Environmental Sciences.

References

  1. An, Z.S.; Huang, R.J.; Zhang, R.Y.; Tie, X.X.; Li, G.H.; Cao, J.J.; Zhou, W.J.; Shi, Z.G.; Han, Y.M.; Gu, Z.L.; et al. Severe haze in northern China: A synergy of anthropogenic emissions and atmospheric processes. Proc. Natl. Acad. Sci. USA 2019, 116, 8657–8666. [Google Scholar] [CrossRef]
  2. Yu, W.H.; Xu, R.B.; Ye, T.T.; Abramson, M.J.; Morawska, L.; Jalaludin, B.; Johnston, F.H.; Henderson, S.B.; Knibbs, L.D.; Morgan, G.G.; et al. Estimates of global mortality burden associated with short-term exposure to fine particulate matter (PM2.5). Lancet Planet. Health 2024, 8, e146–e155. [Google Scholar] [CrossRef]
  3. Geng, G.N.; Liu, Y.X.; Liu, Y.; Liu, S.G.; Cheng, J.; Yan, L.; Wu, N.N.; Hu, H.W.; Tong, D.; Zheng, B.; et al. Efficacy of China’s clean air actions to tackle PM2.5 pollution between 2013 and 2020. Nat. Geosci. 2024, 17, 987–994. [Google Scholar] [CrossRef]
  4. Sun, H.T.; Shin, Y.M.; Xia, M.; Ke, S.; Wan, M.; Yuan, L.; Guo, Y.; Archibald, A.T. Spatial resolved surface ozone with urban and rural differentiation during 1990-2019: A Space-Time bayesian neural network downscaler. Environ. Sci. Technol. 2022, 56, 7337–7349. [Google Scholar] [CrossRef]
  5. Zhong, Q.R.; Tao, S.; Ma, J.M.; Liu, J.; Shen, H.Z.; Shen, G.F.; Guan, D.B.; Yun, X.; Meng, W.J.; Yu, X.Y.; et al. PM2.5 reductions in Chinese cities from 2013 to 2019 remain significant despite the inflating effects of meteorological conditions. One Earth 2021, 4, 448–458. [Google Scholar] [CrossRef]
  6. Chen, Z.Y.; Chen, D.L.; Zhao, C.F.; Kwan, M.P.; Cai, J.; Zhuang, Y.; Zhao, B.; Wang, X.Y.; Chen, B.; Yang, J.; et al. Influence of meteorological conditions on PM2.5 concentrations across China: A review of methodology and mechanism. Environ. Int. 2020, 139, 105558. [Google Scholar] [CrossRef] [PubMed]
  7. Huang, X.F.; Zou, B.B.; He, L.Y.; Hu, M.; Prévôt, A.S.; Zhang, Y.H. Exploration of PM2.5 sources on the regional scale in the Pearl River Delta based on ME-2 modeling. Atmos. Chem. Phys. 2018, 18, 11563–11580. [Google Scholar] [CrossRef]
  8. Yang, S.; Duan, F.K.; Ma, Y.L.; Li, H.; Ma, T.; Zhu, L.D.; Huang, T.; Kimoto, T.; He, K.B. Mixed and intensive haze pollution during the transition period between autumn and winter in Beijing, China. Sci. Total Environ. 2020, 711, 134745. [Google Scholar] [CrossRef] [PubMed]
  9. Hammer, M.S.; Van Donkelaar, A.; Martin, R.V.; Mcduffie, E.E.; Lyapustin, A.; Sayer, A.M.; Hsu, N.C.; Levy, R.C.; Garay, M.J.; Kalashnikova, O.V.; et al. Effects of COVID-19 lockdowns on fine particulate matter concentrations. Sci. Adv. 2021, 7, 7670. [Google Scholar] [CrossRef] [PubMed]
  10. Zheng, B.; Geng, G.N.; Ciais, P.; Davis, S.J.; Martin, R.V.; Meng, J.; Wu, N.N.; Chevallier, F.; Broquet, G.; Boersma, F.; et al. Satellite-based estimates of decline and rebound in China’s CO2 emissions during COVID-19 pandemic. Sci. Adv. 2020, 6, 4998. [Google Scholar] [CrossRef]
  11. Jiang, Q.; Sun, Y.L.; Wang, Z.; Yin, Y. Aerosol composition and sources during the Chinese Spring Festival: Fireworks, secondary aerosol, and holiday effects. Atmos. Chem. Phys. 2015, 15, 6023–6034. [Google Scholar] [CrossRef]
  12. Wang, C.; Huang, X.F.; Zhu, Q.; Cao, L.M.; Zhang, B.; He, L.Y. Differentiating local and regional sources of Chinese urban air pollution based on the effect of the Spring Festival. Atmos. Chem. Phys. 2017, 17, 9103–9114. [Google Scholar] [CrossRef]
  13. Tian, M.; Liu, Y.; Yang, F.M.; Zhang, L.M.; Peng, C.; Chen, Y.; Shi, G.M.; Wang, H.B.; Luo, B.; Jiang, C.T.; et al. Increasing importance of nitrate formation for heavy aerosol pollution in two megacities in Sichuan Basin, southwest China. Environ. Pollut. 2019, 250, 898–905. [Google Scholar] [CrossRef]
  14. Kroll, J.H.; Heald, C.L.; Cappa, C.D.; Farmer, D.K.; Fry, J.L.; Murphy, J.G.; Steiner, A.L. The complex chemical effects of COVID-19 shutdowns on air quality. Nat. Chem. 2020, 12, 777–779. [Google Scholar] [CrossRef]
  15. Silver, B.; He, X.Y.; Arnold, S.R.; Spracklen, D.V. The impact of COVID-19 control measures on air quality in China. Environ. Res. Lett. 2020, 15, 084021. [Google Scholar] [CrossRef]
  16. Baldasano, J.M. COVID-19 lockdown effects on air quality by NO2 in the cities of Barcelona and Madrid (Spain). Sci. Total Environ. 2020, 741, 140353. [Google Scholar] [CrossRef] [PubMed]
  17. Shi, G.L.; Liu, G.R.; Tian, Y.Z.; Zhou, X.Y.; Peng, X.; Feng, Y.C. Chemical characteristic and toxicity assessment of particle associated PAHs for the short-term anthropogenic activity event: During the Chinese New Year’s Festival in 2013. Sci. Total Environ. 2014, 482, 8–14. [Google Scholar] [CrossRef]
  18. Feng, J.; Sun, P.; Hu, X.; Zhao, W.; Wu, M.; Fu, J. The chemical composition and sources of PM2.5 during the 2009 Chinese New Year’s holiday in Shanghai. Atmos. Res. 2012, 118, 435–444. [Google Scholar] [CrossRef]
  19. Kumar, M.; Singh, R.K.; Murari, V.; Singh, A.K.; Singh, R.S.; Banerjee, T. Fireworks induced particle pollution: A spatio-temporal analysis. Atmos. Res. 2016, 180, 78–91. [Google Scholar] [CrossRef]
  20. Huang, K.; Zhuang, G.; Lin, Y.; Wang, Q.; Fu, J.; Zhang, R.; Li, J.; Deng, C.; Fu, Q. Impact of anthropogenic emission on air quality over a megacity − revealed from an intensive atmospheric campaign during the Chinese Spring Festival. Atmos. Chem. Phys. 2012, 12, 11631–11645. [Google Scholar] [CrossRef]
  21. Shi, J.W.; Deng, L.; Du, W.; Han, X.Y.; Zhong, Y.Q.; Rao, W.J.; Xie, H.T.; Xiang, F.; Ning, P.; Tian, S.L. Chemical characteristics, sources, and formation mechanisms of PM2.5 before, during, and after the Spring Festival in a plateau city of Southwest China. Atmos. Environ. 2024, 338, 120788. [Google Scholar] [CrossRef]
  22. Song, L.L.; Dai, Q.L.; Feng, Y.C.; Hopke, P.K. Estimating uncertainties of source contributions to PM2.5 using moving window evolving dispersion normalized PMF. Environ. Pollut. 2021, 286, 117576. [Google Scholar] [CrossRef]
  23. Zhang, Y.J.; Li, W.S.; Li, L.; Li, M.; Zhou, Z.; Yu, J.Z.; Zhou, Y. Source apportionment of PM2.5 using PMF combined online bulk and single-particle measurements: Contribution of fireworks and biomass burning. J. Environ. Sci. 2024, 136, 325–336. [Google Scholar] [CrossRef]
  24. Bach, W.; Dickinson, L.; Weiner, B.; Costello, G. Some adverse health effects due to air pollution from fireworks. Hawaii Med. J. 1972, 31, 459–465. [Google Scholar]
  25. Godri, K.J.; Green, D.C.; Fuller, G.W.; Dall’osto, M.; Beddows, D.C.; Kelly, F.J.; Harrison, R.M.; Mudway, I.S. Particulate oxidative burden associated with firework activity. Environ. Sci. Technol. 2010, 44, 8295–8301. [Google Scholar] [CrossRef]
  26. Kong, S.F.; Li, X.; Li, L.; Yin, Y.; Chen, K.; Yuan, L.; Zhang, Y.J.; Shan, Y.P.; Ji, Y.Q. Variation of polycyclic aromatic hydrocarbons in atmospheric PM2.5 during winter haze period around 2014 Chinese Spring Festival at Nanjing: Insights of source changes, air mass direction and firework particle injection. Sci. Total Environ. 2015, 520, 59–72. [Google Scholar] [CrossRef]
  27. Pang, N.N.; Jiang, B.Y.; Zheng, Y.H. The impact of fireworks burning on air quality and their health effects in China during Spring Festivals of 2015–2022. Atmos. Pollut. Res. 2023, 14, 101888. [Google Scholar] [CrossRef]
  28. Lai, Y.H.; Brimblecombe, P. Changes in air pollution and attitude to fireworks in Beijing. Atmos. Environ. 2020, 231, 117549. [Google Scholar] [CrossRef]
  29. Zheng, H.; Kong, S.F.; Chen, N.; Yan, Y.Y.; Liu, D.T.; Zhu, B.; Xu, K.; Cao, W.X.; Ding, Q.Q.; Lan, B.; et al. Significant changes in the chemical compositions and sources of PM2.5 Wuhan since the city lockdown as COVID-19. Sci. Total Environ. 2020, 739, 140000. [Google Scholar] [CrossRef] [PubMed]
  30. Tang, M.X.; Huang, X.F.; Sun, T.L.; Cheng, Y.; Luo, Y.; Chen, Z.; Lin, X.Y.; Cao, L.M.; Zhai, Y.H.; He, L.Y. Decisive role of ozone formation control in winter PM2.5 mitigation in Shenzhen, China. Environ. Pollut. 2022, 301, 119027. [Google Scholar] [CrossRef] [PubMed]
  31. Peng, X.; Xie, T.T.; Tang, M.X.; Cheng, Y.; Peng, Y.; Wei, F.H.; Cao, L.M.; Yu, K.Y.; Du, K.; He, L.Y.; et al. Critical Role of Secondary Organic Aerosol in Urban Atmospheric Visibility Improvement Identified by Machine Learning. Environ. Sci. Technol. Lett. 2023, 10, 976–982. [Google Scholar] [CrossRef]
  32. Paatero, P.; Tapper, U. Positive matrix factorization: A nonnegative factor model with optimal utilization of error-estimates of data values. Environmetrics 1994, 5, 111–126. [Google Scholar] [CrossRef]
  33. Su, C.P.; Peng, X.; Huang, X.F.; Zeng, L.W.; Cao, L.M.; Tang, M.X.; Chen, Y.; Zhu, B.; Wang, Y.S.; He, L.Y. Development and application of a mass closure PM2.5 composition online monitoring system. Atmos. Meas. Tech. 2020, 13, 5407–5422. [Google Scholar] [CrossRef]
  34. Zheng, L.X.; Wu, D.; Chen, X.; Li, Y.; Cheng, A.U.; Yi, J.U.; Li, Q. Chemical profiles of particulate matter emitted from anthropogenic sources in selected regions of China. Sci. Data 2024, 11, 1206. [Google Scholar] [CrossRef] [PubMed]
  35. Du, B.H.; Huang, X.F.; He, L.Y.; Hu, M.; Wang, C.; Ren, Y.C.; Ying, H.M.; Zhou, J.; Wang, W.F.; Xu, D.D. Seasonal and spatial variations of carbon fractions in PM2.5 in Ningbo and the estimation of secondary organic carbon. Environ. Sci. 2015, 36, 3128–3134. [Google Scholar]
  36. Sun, T.L.; Zou, B.B.; Huang, X.F.; Shen, H.Y.; Dai, J.; He, L.Y. Source apportionment of PM2.5 pollution in Shenzhen. China Environ. Sci. 2019, 39, 13–20. [Google Scholar]
  37. Van Bohemen, H.D.; Van De Laak, W.H.J. The influence of road infrastructure and traffic on soil, water, and air quality. Environ. Manag. 2003, 31, 50–68. [Google Scholar] [CrossRef] [PubMed]
  38. Yuan, Z.B.; Lau, A.; Zhang, H.Y.; Yu, J.; Louie, P.; Fung, J. Identification and spatiotemporal variations of dominant PM10 sources over Hong Kong. Atmos. Environ. 2006, 40, 1803–1815. [Google Scholar] [CrossRef]
  39. He, L.Y.; Huang, X.F.; Xue, L.; Hu, M.; Lin, Y.; Zheng, J.; Zhang, R.Y.; Zhang, Y.H. Submicron aerosol analysis and organic source apportionment in an urban atmosphere in Pearl River Delta of China using high-resolution aerosol mass spectrometry. J. Geophys. Res.-Atmos. 2011, 116, D12304. [Google Scholar] [CrossRef]
  40. Jimenez, J.L.; Canagaratna, M.R.; Donahue, N.M.; Prevot, A.S.H.; Zhang, Q.; Kroll, J.H.; Decarlo, P.F.; Allan, J.D.; Coe, H.; Ng, N.L.; et al. Evolution of organic aerosols in the atmosphere. Science 2009, 326, 1525–1529. [Google Scholar] [CrossRef]
  41. Link, M.F.; Kim, J.; Park, G.; Lee, T.; Park, T.; Babar, Z.B.; Sung, K.; Kim, P.; Kang, S.; Kim, J.S.; et al. Elevated production of NH4NO3 from the photochemical processing of vehicle exhaust: Implications for air quality in the Seoul Metropolitan Region. Atmos. Environ. 2017, 156, 95–101. [Google Scholar] [CrossRef]
  42. Ge, X.L.; Li, L.; Chen, Y.F.; Chen, H.; Wu, D.; Wang, J.F.; Xie, X.C.; Ge, S.; Ye, Z.L.; Xu, J.Z.; et al. Aerosol characteristics and sources in Yangzhou, China resolved by offline aerosol mass spectrometry and other techniques. Environ. Pollut. 2017, 225, 74–85. [Google Scholar] [CrossRef]
  43. Yamasoe, M.A.; Artaxo, P.; Miguel, A.H.; Allen, A.G. Chemical composition of aerosol particles from direct emissions of vegetation fires in the Amazon Basin: Water-soluble species and trace elements. Atmos. Environ. 2000, 34, 1641–1653. [Google Scholar] [CrossRef]
  44. Hasheminassab, S.; Daher, N.; Saffari, A.; Wang, D.; Ostro, B.D.; Sioutas, C. Spatial and temporal variability of sources of ambient fine particulate matter (PM2.5) in California. Atmos. Chem. Phys. 2014, 14, 12085–12097. [Google Scholar] [CrossRef]
  45. Stanimirova, I.; Rich, D.Q.; Russell, A.G.; Hopke, P.K. Common and distinct pollution sources identified from ambient PM2.5 concentrations in two sites of Los Angeles Basin from 2005 to 2019. Environ. Pollut. 2024, 340, 122817. [Google Scholar] [CrossRef]
  46. Zhu, Q.; Liu, Y.; Hasheminassab, S. Long-term source apportionment of PM2.5 across the contiguous United States (2000-2019) using a multilinear engine model. J. Hazard. Mater. 2024, 472, 134550. [Google Scholar] [CrossRef]
  47. Yassine, M.M.; Dabek-Zlotorzynska, E.; Celo, V.; Sofowote, U.M.; Mooibroek, D.; Hopke, P.K. Effect of industrialization on the differences in sources and composition of ambient PM2.5 in two Southern Ontario locations. Environ. Pollut. 2024, 341, 123007. [Google Scholar] [CrossRef]
  48. Jain, S.; Sharma, S.K.; Vijayan, N.; Mandal, T.K. Seasonal characteristics of aerosols (PM2.5 and PM10) and their source apportionment using PMF: A four year study over Delhi, India. Environ. Pollut. 2020, 262, 114337. [Google Scholar] [CrossRef] [PubMed]
  49. Chow, J.C.; Watson, J.G. Review of PM2.5 and PM10 apportionment for fossil fuel combustion and other sources by the chemical mass balance receptor model. Energy Fuels 2002, 16, 222–260. [Google Scholar] [CrossRef]
  50. Lan, Z.J.; Jiang, J.H.; Lin, L.L.; Huang, X.F.; He, L.Y. Source analysis of PM2.5 in the typical mixed functional zone of Shenzhen. China Environ. Sci. 2021, 41, 4001–4008. [Google Scholar]
  51. Zhang, G.Q.; Ding, C.; Jiang, X.J.; Pan, G.; Wei, X.F.; Sun, Y.M. Chemical compositions and sources contribution of atmospheric particles at a typical steel industrial urban site. Sci. Rep. 2020, 10, 7654. [Google Scholar] [CrossRef]
  52. Shen, Z.X.; Sun, J.; Cao, J.J.; Zhang, L.M.; Zhang, Q.; Lei, Y.L.; Gao, J.J.; Huang, R.J.; Liu, S.X.; Huang, Y.; et al. Chemical profiles of urban fugitive dust PM2.5 samples in Northern Chinese cities. Sci. Total Environ. 2016, 569, 619–626. [Google Scholar] [CrossRef]
  53. Wang, W.H.; Zhou, H.; Gao, Y.T.; Shao, L.Y.; Zhou, X.Y.; Li, X.; Wei, D.Q.; Xing, J.P.; Lyu, R.H. Chemical composition and morphology of PM2.5 in a rural valley during Chinese New Year’s Eve: Impact of firework/firecracker display. Atmos. Environ. 2024, 318, 120225. [Google Scholar] [CrossRef]
  54. Wang, S.S.; Yu, R.L.; Shen, H.Z.; Wang, S.; Hu, Q.C.; Cui, J.Y.; Yan, Y.; Huang, H.B.; Hu, G.R. Chemical characteristics, sources, and formation mechanisms of PM2.5 before and during the Spring Festival in a coastal city in Southeast China. Environ. Pollut. 2019, 251, 442–452. [Google Scholar] [CrossRef]
  55. Lanz, V.A.; Alfarra, M.R.; Baltensperger, U.; Buchmann, B.; Hueglin, C.; Prevot, A.S.H. Source apportionment of submicron organic aerosols at an urban site by factor analytical modelling of aerosol mass spectra. Atmos. Chem. Phys. 2007, 7, 1503–1522. [Google Scholar] [CrossRef]
  56. Wu, K.Y.; Duan, M.; Liu, H.F.; Zhou, Z.H.; Deng, Y.; Song, D.L.; Tan, Q. Characterizing the composition and evolution of firework-related components in air aerosols during the Spring Festival. Environ. Geochem. Health 2018, 40, 2761–2771. [Google Scholar] [CrossRef] [PubMed]
  57. Lv, W.L.; Zhang, K.; Cao, Q.; Zhu, S.; Chen, J.H.; Zhi, M.K.; Li, D. Impacts of fireworks burning on atmospheric pollutants and water-soluble inorganic ions in PM2.5. China Environ. Sci. 2020, 40, 3303–3311. [Google Scholar]
  58. Tsai, H.H.; Chien, L.H.; Yuan, C.S.; Lin, Y.C.; Jen, Y.H.; Ie, I.R. Influences of fireworks on chemical characteristics of atmospheric fine and coarse particles during Taiwan’s Lantern Festival. Atmos. Environ. 2012, 62, 256–264. [Google Scholar] [CrossRef]
  59. Keller, F.; Schragen, C. Determination of particulate matter emission factors of common pyrotechnic articles. Propellants Explos. Pyrotech. 2021, 46, 825–842. [Google Scholar] [CrossRef]
  60. Khedr, M.; Liu, X.; Hadiatullah, H.; Orasche, J.; Zhang, X.; Cyrys, J.; Michalke, B.; Zimmermann, R.; Schnelle-Kreis, J. Influence of New Year’s fireworks on air quality − A case study from 2010 to 2021 in Augsburg, Germany. Atmos. Pollut. Res. 2022, 13, 101341. [Google Scholar] [CrossRef]
  61. Srinivasan, K. Eco-friendly fireworks for atom bomb (Local name of cracker bomb). J. Adv. Appl. Sci. Res. 2017, 1. [Google Scholar] [CrossRef]
Figure 1. Variations of main chemical compositions of PM2.5 in January to March from 2021 to 2024 in Shenzhen.
Atmosphere 16 00908 g001
Figure 2. Source profiles identified by the PMF model.
Atmosphere 16 00908 g002
Figure 3. Changes of source concentrations of PM2.5 in January to March from 2021 to 2024 in Shenzhen.
Atmosphere 16 00908 g003
Figure 4. The component proportions (a) and source contributions (b) of PM2.5 during the BSF, SF, and ASF period from 2021 to 2024 in Shenzhen.
Atmosphere 16 00908 g004
Figure 5. Comparison of January to March average values and Fireworks day values of PM2.5 key components from 2021 to 2024 in Shenzhen. (The elements Sr and Bi were not measured for the samples in 2021. Additionally, concentrations of Cu, Ba, Sr, and Bi are extremely low and are presented at 20 times their actual concentrations for visual clarity in this figure.).
Atmosphere 16 00908 g005
Disclaimer/Publisher’s Note: The statements, opinions and data contained in all publications are solely those of the individual author(s) and contributor(s) and not of MDPI and/or the editor(s). MDPI and/or the editor(s) disclaim responsibility for any injury to people or property resulting from any ideas, methods, instructions or products referred to in the content.

