Article

Carbon Pricing Strategies and Policies for a Unified Global Carbon Market

1
State Key Laboratory of Pollution Control and Resource Reuse, College of Environmental Science and Engineering, Tongji University, Shanghai 200092, China
2
Department of Environmental Protection, Faculty of Environmental Science, Badghis Higher Education Institution, Qala-e-Now 330201, Afghanistan
3
Shanghai Institute of Pollution Control and Ecological Security, Shanghai 200092, China
*
Author to whom correspondence should be addressed.
Atmosphere 2025, 16(7), 836; https://doi.org/10.3390/atmos16070836
Submission received: 16 May 2025 / Revised: 4 July 2025 / Accepted: 5 July 2025 / Published: 10 July 2025
(This article belongs to the Section Air Pollution Control)

Abstract

Driven by the urgent need to mitigate climate change and achieve net-zero emissions, carbon pricing has emerged as a critical policy tool in major economies worldwide. This study compares carbon pricing in the EU, China, Canada, and Singapore, evaluating effectiveness in emission reductions, with the EU ranking first with high carbon prices, road market coverage, and strict penalties, based on carbon price per capita. Conversely, Singapore’s position as fourth in carbon price per capita among these four most mature carbon markets, Singapore has a high GDP per capita and lower carbon prices. Canada’s fragmented provincial policies and China’s limited market coverage, despite being the top global emitter. Our analysis reveals three critical success factors: (1) higher carbon prices per capita are essential for carbon reduction, (2) the necessity of penalties on carbon price per capita from EUR 20–EUR 100, and (3) expanded market coverage maximizes impact. To address global disparities, we propose a Uniform Carbon Pricing Mechanism under the Global Carbon Resilience Framework (GCRF), based on carbon price per capita tiered pricing: EUR 100/t (developed), EUR 30–50 (developing), and EUR 5–15 (least-developed countries). This balanced system supports vulnerable regions while cutting emissions, proving that fair carbon pricing is crucial for climate goals and economic stability.

1. Introduction

Carbon pricing mechanisms (CPMs) have emerged as crucial tools in global efforts to mitigate climate change by incentivizing emission reductions [1,2]. These mechanisms, including carbon taxes and emissions trading systems, have shown effectiveness in curbing emissions and promoting innovation in clean technologies [3,4]. However, their success depends on factors such as pricing levels, regulatory enforcement, and integration with other climate policies [1]. Challenges include addressing equity concerns, competitiveness issues, and ensuring political acceptability [2]. International cooperation is crucial for enhancing the efficacy of carbon pricing and mitigating cross-border carbon leakage [4]. To maximize effectiveness, policymakers should consider flexible, context-specific approaches that balance environmental goals with economic growth and social equity [1,2].
This analysis investigates the carbon pricing strategies of four major global entities: the European Union, China, Canada, and Singapore. These regions were selected to represent diverse economic development levels and environmental priorities. The EU serves as a model for policy adaptation with its pioneering cap-and-trade system. China, as the largest emitter, provides insights into implementing carbon pricing in large economies. Canada’s hybrid carbon pricing system allows for the evaluation of various policy designs in a significant fuel-producing context. Lastly, Singapore’s robust legal framework and commitment to net-zero emissions position it as a key player in the Asian carbon market. By focusing on these four regions, this study aims to deliver a comprehensive comparative analysis of carbon pricing approaches and their effectiveness in reducing emissions, thereby contributing to global climate action. The European Union’s Green Deal aims to establish the EU as a global climate leader, targeting carbon neutrality by 2050 [5,6,7]. Meanwhile, China, as the world’s largest carbon emitter, faces the dual challenge of sustaining economic growth while addressing environmental concerns [8,9]. Canada’s approach reflects its federal-provincial dynamics, combining diverse regulatory frameworks [10,11,12]. Singapore, a compact but economically dynamic city-state, focuses on leveraging innovation and technology to manage its carbon emissions effectively [13,14].
This study compares the policies and market systems of four major economies (the EU, China, Canada, and Singapore) to determine if a single worldwide carbon pricing scheme is feasible. As a new comparative metric, we use the carbon price about GDP per capita to systematically assess both successful implementations and enduring issues in these jurisdictions. Our analysis seeks to create a comprehensive framework that unifies carbon pricing mechanisms, addresses important concerns about fair burden-sharing, and promotes productive international collaboration—all of which are necessary to achieve meaningful emission reductions in the face of stark economic inequality.
The manuscript is structured to provide a comprehensive examination of this complex policy landscape: Section 2 presents a critical review of existing carbon pricing architectures, analyzing their institutional designs, operational frameworks, and implementation barriers across the four case studies. Section 3 details our innovative methodological approach, combining quantitative analysis through the carbon price to GDP per capita metric with qualitative assessment of market coverage and enforcement efficacy. Section 4 synthesizes these findings to propose the Global Carbon Resilience Framework (GCRF), a groundbreaking tiered pricing mechanism designed to balance environmental effectiveness with socioeconomic equity in climate governance. Finally, Section 5 draws substantive policy conclusions, outlining practical mechanisms for equitable implementation and strategic pathways for international collaboration to advance Paris Agreement objectives.

2. Literature Review

2.1. European Union

The EU Emissions Trading System (EU ETS), launched in 2005, is the world’s largest multi-sector greenhouse gas trading scheme and a cornerstone of EU climate policy [15,16]. Energy-intensive industries, including iron and steel, cement, chemicals, and non-ferrous metals, contribute substantially to EU emissions [17]. Despite initial difficulties, the EU transformed from a laggard to a leader in emissions trading, rapidly establishing the system through the interplay of member states, EU institutions, and the international climate regime [18]. From 2005 to 2007, the price of EUR/ton fluctuated moderately, beginning at around EUR 20 in 2005, falling slightly to EUR 18 in 2006, and rebounding to EUR 22 in 2007. This time frame represents rather stable market conditions with modest changes. Prices changed more noticeably from 2008 and 2012, beginning at a higher value of EUR 28 in 2008 and falling dramatically to EUR 13 in 2009. Prices then rose significantly to EUR 15 in 2010 and EUR 17 in 2011 before falling again to EUR 8 in 2012. This period shows a deteriorating tendency with some rebound in between.
From 2013 to 2020, the market remained mostly stable at reduced prices. Prices in 2013 and 2014 were around EUR 5 and 6, respectively. In 2015 and 2016, the fee was EUR 8 and EUR 5, respectively, with a modest increase to EUR 7 in 2017 and a steady increase to EUR 15 in 2018. This rising trend persisted into 2019 and 2020, hitting EUR 25 and 30, respectively, indicating a steady recovery in market dynamics. Between 2021 and 2023, prices skyrocketed. In 2021, the price rose to EUR 55, followed by a considerable increase to EUR 85 in 2022 and a peak of EUR 100 in February 2023. This high surge represents a period of increased market activity and demand, resulting in unprecedented price levels [19].
Carbon dioxide emissions in the European Union significantly changed between 2005 and 2023. In 2005, emissions totaled 3672.3 million metric tons, rising marginally to 3700.6 million metric tons in 2006. In 2007, emissions fell to 3646.4 million metric tons, followed by a further fall to 3573.3 million tons in 2008. By 2009, emissions had reduced dramatically to 3300.4 million metric tons before marginally increasing to 3384.1 million metric tons in 2010. In 2011, emissions declined to 3298.8 million metric tons, followed by another decrease to 3218.2 million metric tons in 2012 and 3147.7 million metric tons in 2013.
Emissions fell further in 2014 to 2981.4 million metric tons but increased slightly in 2015 to 3040.5 million metric tons and 3067.2 million metric tons in 2016. Emissions peaked at 3117 million metric tons in 2017, then fell to 3065.7 million metric tons in 2018 and 2924.9 million metric tons in 2019. In 2020, emissions fell sharply to 2564.2 million metric tons, most likely owing to the COVID-19 pandemic. They rose to 2751.8 million metric tons in 2021 but fell to 2724 million metric tons in 2022 and then to 2517.6 million metric tons in 2023. These data demonstrate a general trend of reducing carbon dioxide emissions in the EU over time [20]. The system allows companies to trade emission allowances, with penalties for non-compliance ranging from EUR 40 to EUR 100 per excess ton of CO2 [21].

2.2. China

China, the world’s largest energy consumer and CO2 emitter, plays a critical role in addressing global climate change [22,23,24]. China initiated carbon emission trading schemes (ETS) in 2013, establishing seven regional pilot markets to curb emissions and combat climate change [25,26,27]. The National Carbon Emission Trading System (ETS) was launched in 2017, initially covering the electricity sector, and has since expanded to include steel, aviation, and other industries [28,29,30]. In 2021, the system covered over 2100 power stations, which represent more than 30% of China’s total GHG emissions [31,32].
China aims for net-zero carbon emissions by 2060, requiring a 90% increase in non-fossil fuel power generation by 2050 [33,34]. In 2021, China’s national ETS regulated over 4.5 billion metric tons of CO2 annually, covering more than 30% of the country’s total greenhouse gas emissions [31]. China’s ETS was initially focused only on the electricity industry, but it has since extended to include steel, aviation, and other industries, with more growth planned [35]. The carbon price in China fluctuated around the opening price of 48 CNY/ton on the first day of trading and stayed within the range of 40 to 60 CNY/ton [36]. According to the IEA Carbon Dioxide Emissions in 2022 report [37], China’s emissions increased in 2022, reaching 11.4 billion metric tons of CO2. This made China the world’s top polluter that year, as reported by the IEA Carbon Dioxide Emissions 2023 report [37]. China’s emissions of carbon dioxide increased by 565 Mt to 12.6 Gt in 2023. According to the 2022 CCPS-Environmental Defense Fund report, a steady increase in the national carbon price is anticipated. The national market is predicted to see average prices of 59 CNY/t in 2022, 87 CNY/t in 2025, and 130 CNY/t by the end of the ten years [38]. According to the Global Report, in 2023, the China Emission Allowance (CEA) saw an average yearly trading price of 68.15 CNY/t [39].

2.3. Canada

The 2030 Emissions Reduction Plan for Canada is Canada’s 2030 emissions reduction plan, which targets 40% below 2005 levels by 2030, along with net-zero momentum by 2050 [40]. CCX is the largest association and market system in the world for trading greenhouse gas emissions and encouraging emission decreases [41]. The second largest global carbon exchange market is the CCX trading system, trading the six main GHGs and the only US-approved Clean Development Mechanism (CDM) [42]. The member-managed trading system of the CCX has set rules voluntarily to limit GHG emissions. Members cut their emissions by 1% per year from 2003 to 2006, with a target of 6% reduction by 2010 [43]. Canada’s target, as part of its internationally determined emissions target, is a 30% decrease in its greenhouse gas emissions below 2005 levels by 2030 [44].
Canada plans to implement a national carbon price beginning in 2018 at CAD 10 per ton, increasing annually to reach CAD 50 by 2022. In 2023, the price was CAD 65, increasing annually by CAD 15 to reach CAD 175 in 2030 [45]. The country’s annual emissions were 730 million/t in 2019, 672 million/t in 2020, 675 million/t in 2021, and 685 million/t in 2022, and 600 million/t in 2023 [46].
The structure of Canada’s carbon market is messy and complex; it includes both federal and provincial efforts. A two-pronged approach to carbon pricing existed in Canada under the GHG Pollution Pricing Act (GGPPA). Fossil fuels, such as gasoline and natural gas, are first subject to a direct price on fuel (currently CAD 65 per ton). In other words, to the point of sale, this increases the cost of emissions directly [47]. It is estimated that this fee will rise to CAD 170/ton by 2030. Canada’s Output-Based Pricing System—a cap-and-trade scheme applying to the largest industrial polluters—currently has established a floor price of CAD 30 per ton, but is gradually rising to CAD 170 by 2030, incentivizing cleaner technology [48].
An output-based pricing system (OBPS) allocates emission credits to businesses based on their emissions intensity compared to the industry average, preventing leakage and encouraging cleaner production [49]. Companies reduce emissions by earning and selling credits to those exceeding quotas. Excess emitters must buy credits or pay a carbon price. Emission limits decrease over time, ensuring ongoing cuts while maintaining CO2 costs. Canada implements similar policies federally and provincially, starting with Alberta’s conservative party [50].

2.4. Singapore

In February 2018, Finance Minister Heng Swee Keat said that establishments producing 25,000 tons or more of greenhouse gases per year will be required to pay a carbon tax starting in 2020 [51]. The tax, initially set at SGD 5 per ton of CO2 equivalent (tCO2e), will increase to SGD 25/tCO2e in 2024 and SGD 45/tCO2e from 2026 to 2027, with projections of SGD 50–80/tCO2e by 2030. In 2018, it was announced that the price of carbon would rise between SGD 10 to SGD 15/tCO2e by 2030 [51,52,53].
Singapore is also advancing green finance through initiatives like the Singapore Exchange (SGX) and the Carbon Impact X (CIX), which promote transparency and high-quality carbon credits [54,55]. Additionally, the Monetary Authority of Singapore supports green finance through programs like the Green Finance System and the Green Bond Grant Scheme [56]. Singapore emitted 43,703 kilotons of carbon dioxide in 2020, which is a decline of 3.23% from 2019, and emitted 45,163.20 kilotons of carbon dioxide in 2019, which was a decline of 0.11% from 2018 [57].
The comparative analysis of carbon pricing mechanisms across the EU, China, Canada, and Singapore reveals distinct regional approaches shaped by economic, political, and institutional contexts. The EU’s mature ETS demonstrates the effectiveness of high carbon prices (EUR 100/t by 2023) coupled with broad sectoral coverage and stringent penalties, driving significant emission reductions. China’s national ETS, while ambitious in scale, faces challenges of limited initial sectoral coverage and low price levels (averaging CNY68.15/t in 2023), highlighting the tension between rapid economic growth and decarbonization goals. Canada’s hybrid system—combining federal carbon taxes with provincial cap-and-trade programs—illustrates both the potential and complexities of multi-level governance, with price trajectories (CAD 65 in 2023) reflecting this fragmentation. Singapore’s fixed carbon tax (SGD 5 in 2023) prioritizes simplicity but lacks the dynamic pricing needed for deeper mitigation.
In order to facilitate cross-jurisdictional comparisons, this review identifies three crucial gaps: (1) the need for standardized metrics (such as price to GDP per capita ratios); (2) the lack of adequate consideration for equity in burden-sharing between developed and developing economies; and (3) the limited integration of carbon pricing with more comprehensive climate policy perspectives. The following parts’ suggested Global Carbon Resilience Framework (GCRF) and our methodology are informed by these shortcomings.

3. Methods

This study employed a mixed-method approach, utilizing both qualitative and quantitative research methods to analyze the relationship between carbon pricing and economic performance and the effect of carbon price on carbon reduction in the European Union, China, Canada, and Singapore. The study calculates the ratios of CO2 price to GDP per capita, and comparison of carbon emissions with carbon prices for these selected regions, and for the qualitative comparison, research focuses on the market coverage.

3.1. Data Collection

  • Quantitative Data:
Carbon Pricing, Economic Performance, and Carbon Emissions Data were collected from governmental and international databases, including Google Scholar, Web of Science, the World Bank, International Energy Agency (IEA), Global Carbon Project, national environmental agencies, and national carbon pricing authorities.
2.
Qualitative Data:
Market Coverage: A review of policy documents, and academic literature, to assess the breadth of market coverage in each region. This included analyzing the sectors included in carbon pricing schemes and the extent of regulatory frameworks.

3.2. Calculation of CO2 Price to GDP per Capita Ratio

The primary metric used in this analysis is the CO2 price to GDP per capita ratio, calculated using the following formula:
CO2 Price to GDP per Capita Ratio = CO2 Price/GDP per Capita
This ratio allows for an assessment of how carbon pricing relates to the economic capacity of each region and analyzes the effect of carbon pricing on carbon reduction.

3.3. Justification for Indicator Selection

The CO2 price to GDP per capita ratio was selected as our primary metric for three key reasons. First, it effectively measures how carbon pricing integrates with each region’s economic framework, revealing whether pricing levels are feasible or burdensome relative to economic development. Second, this standardized ratio enables meaningful cross-country comparisons despite varying economic scales and population sizes. Third, while we considered alternative indicators like carbon price intensity and low-carbon technology investments, these proved less effective at capturing the nuanced relationship between economic capacity and carbon pricing effectiveness. The GDP-normalized approach provides the most comprehensive assessment of how carbon pricing functions within different economic contexts.

3.4. Data Analysis

Quantitative data will be analyzed using statistical methods to identify correlations between carbon price/GDP per capita and carbon reduction outcomes. Qualitative data will be thematically analyzed to extract insights regarding market coverage and policy effectiveness.
This comprehensive methodological framework aims to elucidate the complex interplay between carbon pricing, economic performance, and carbon reduction across selected regions, contributing valuable insights to the ongoing discourse on climate policy and economic sustainability.

4. Results and Discussion

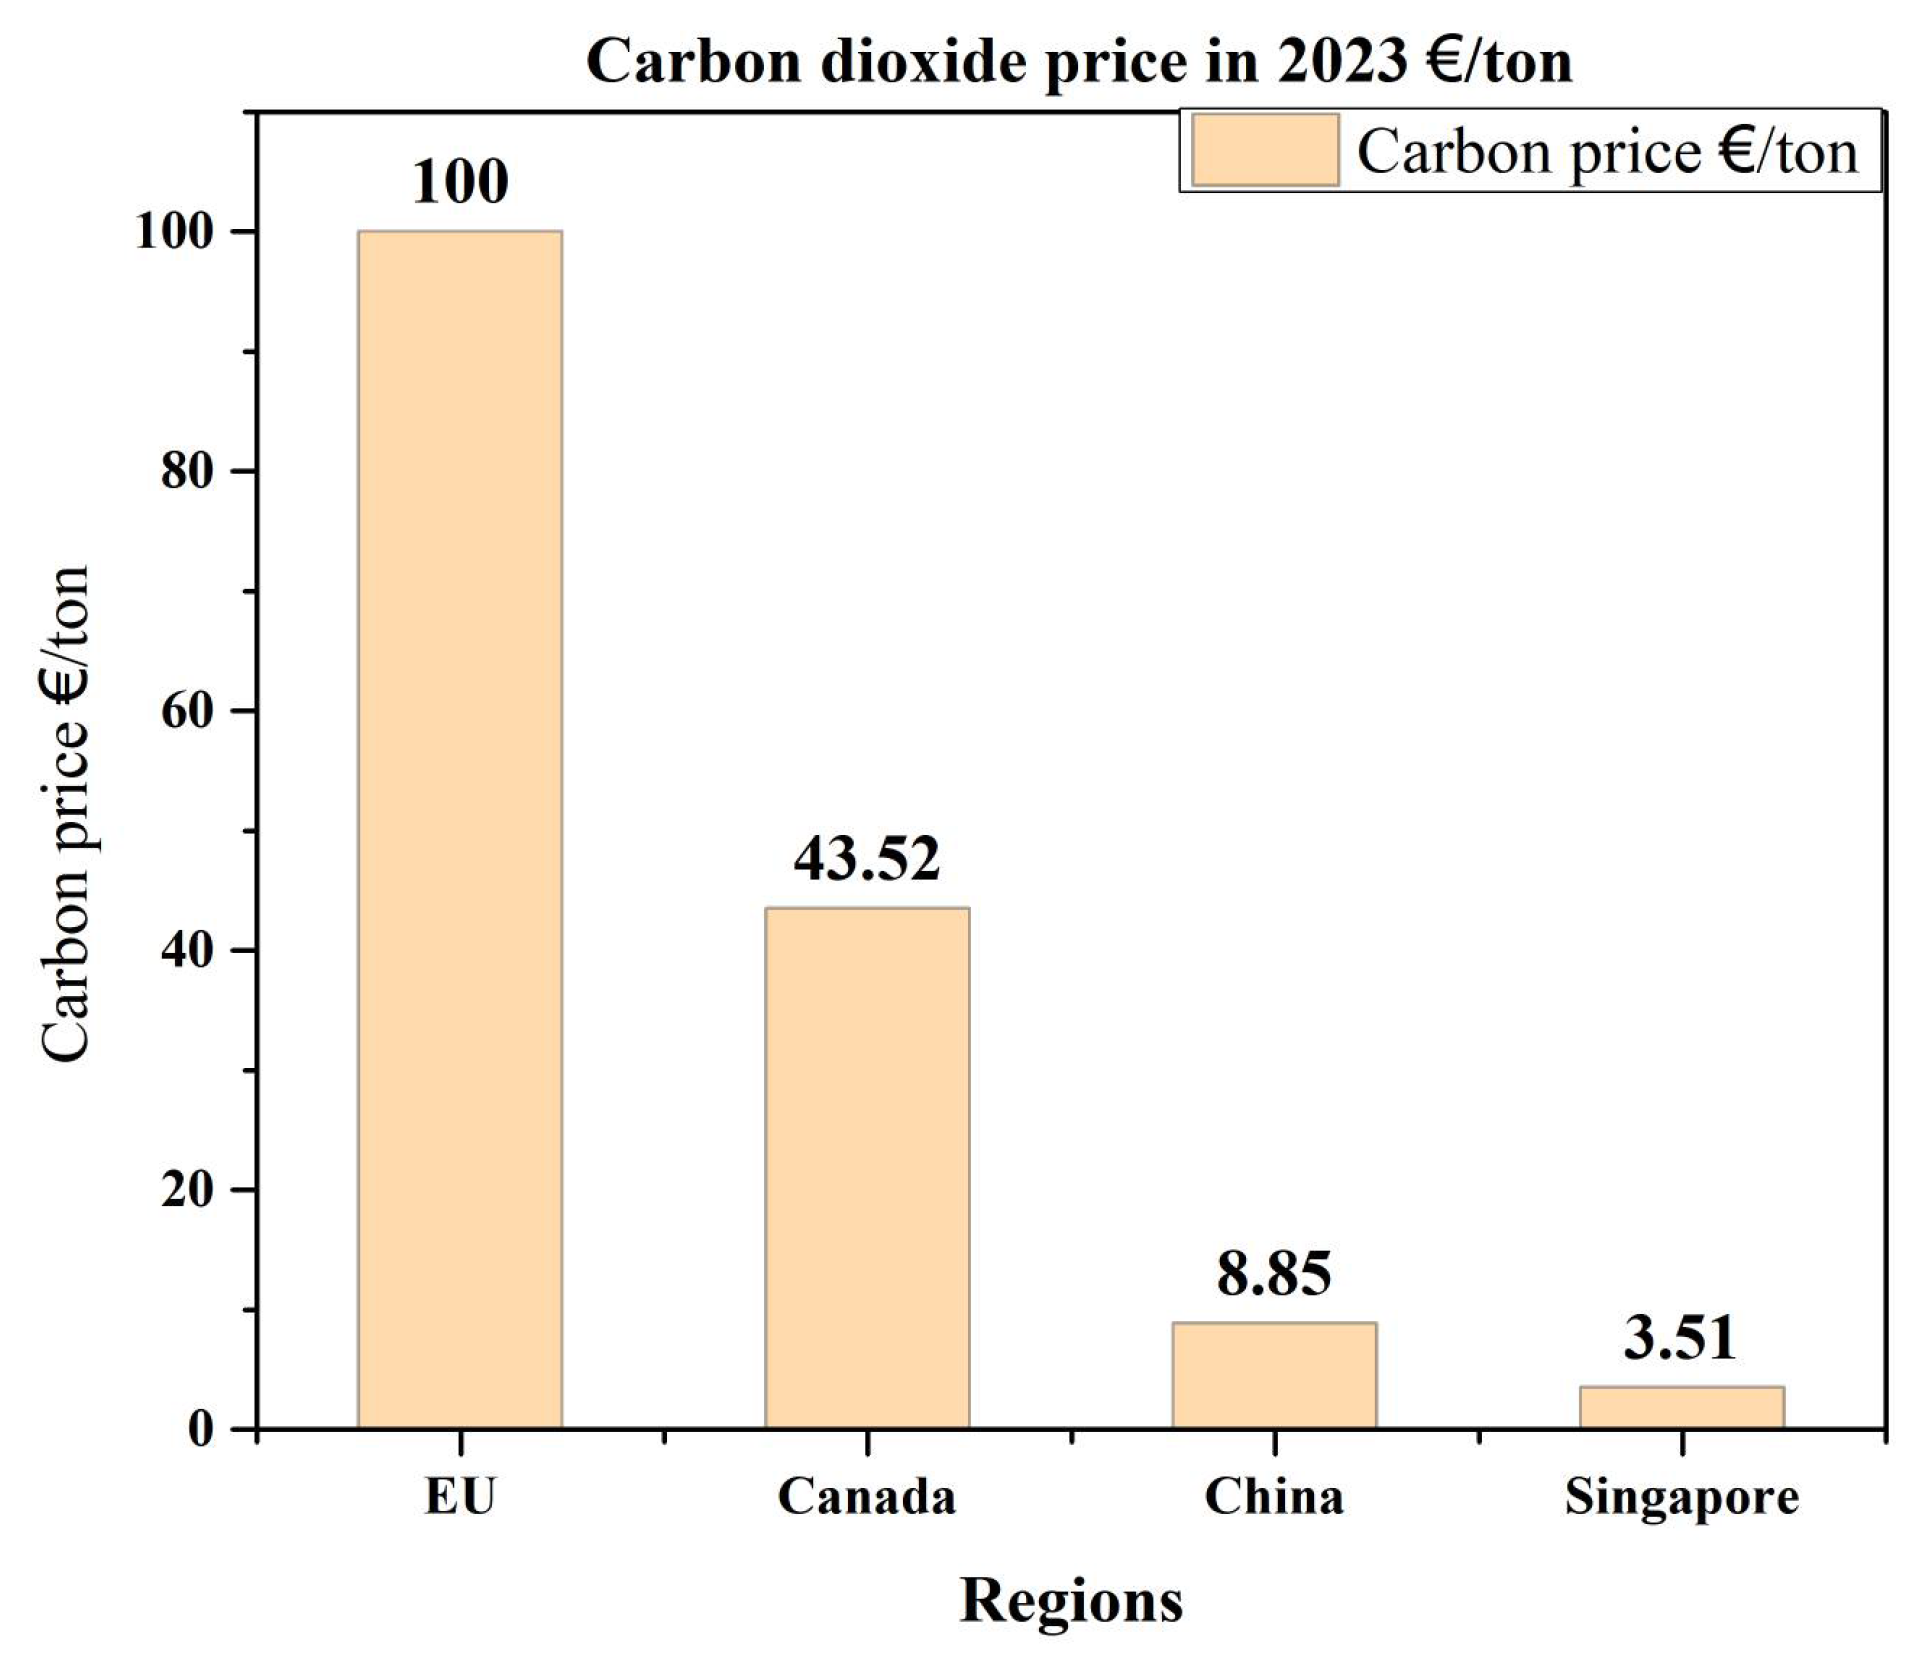
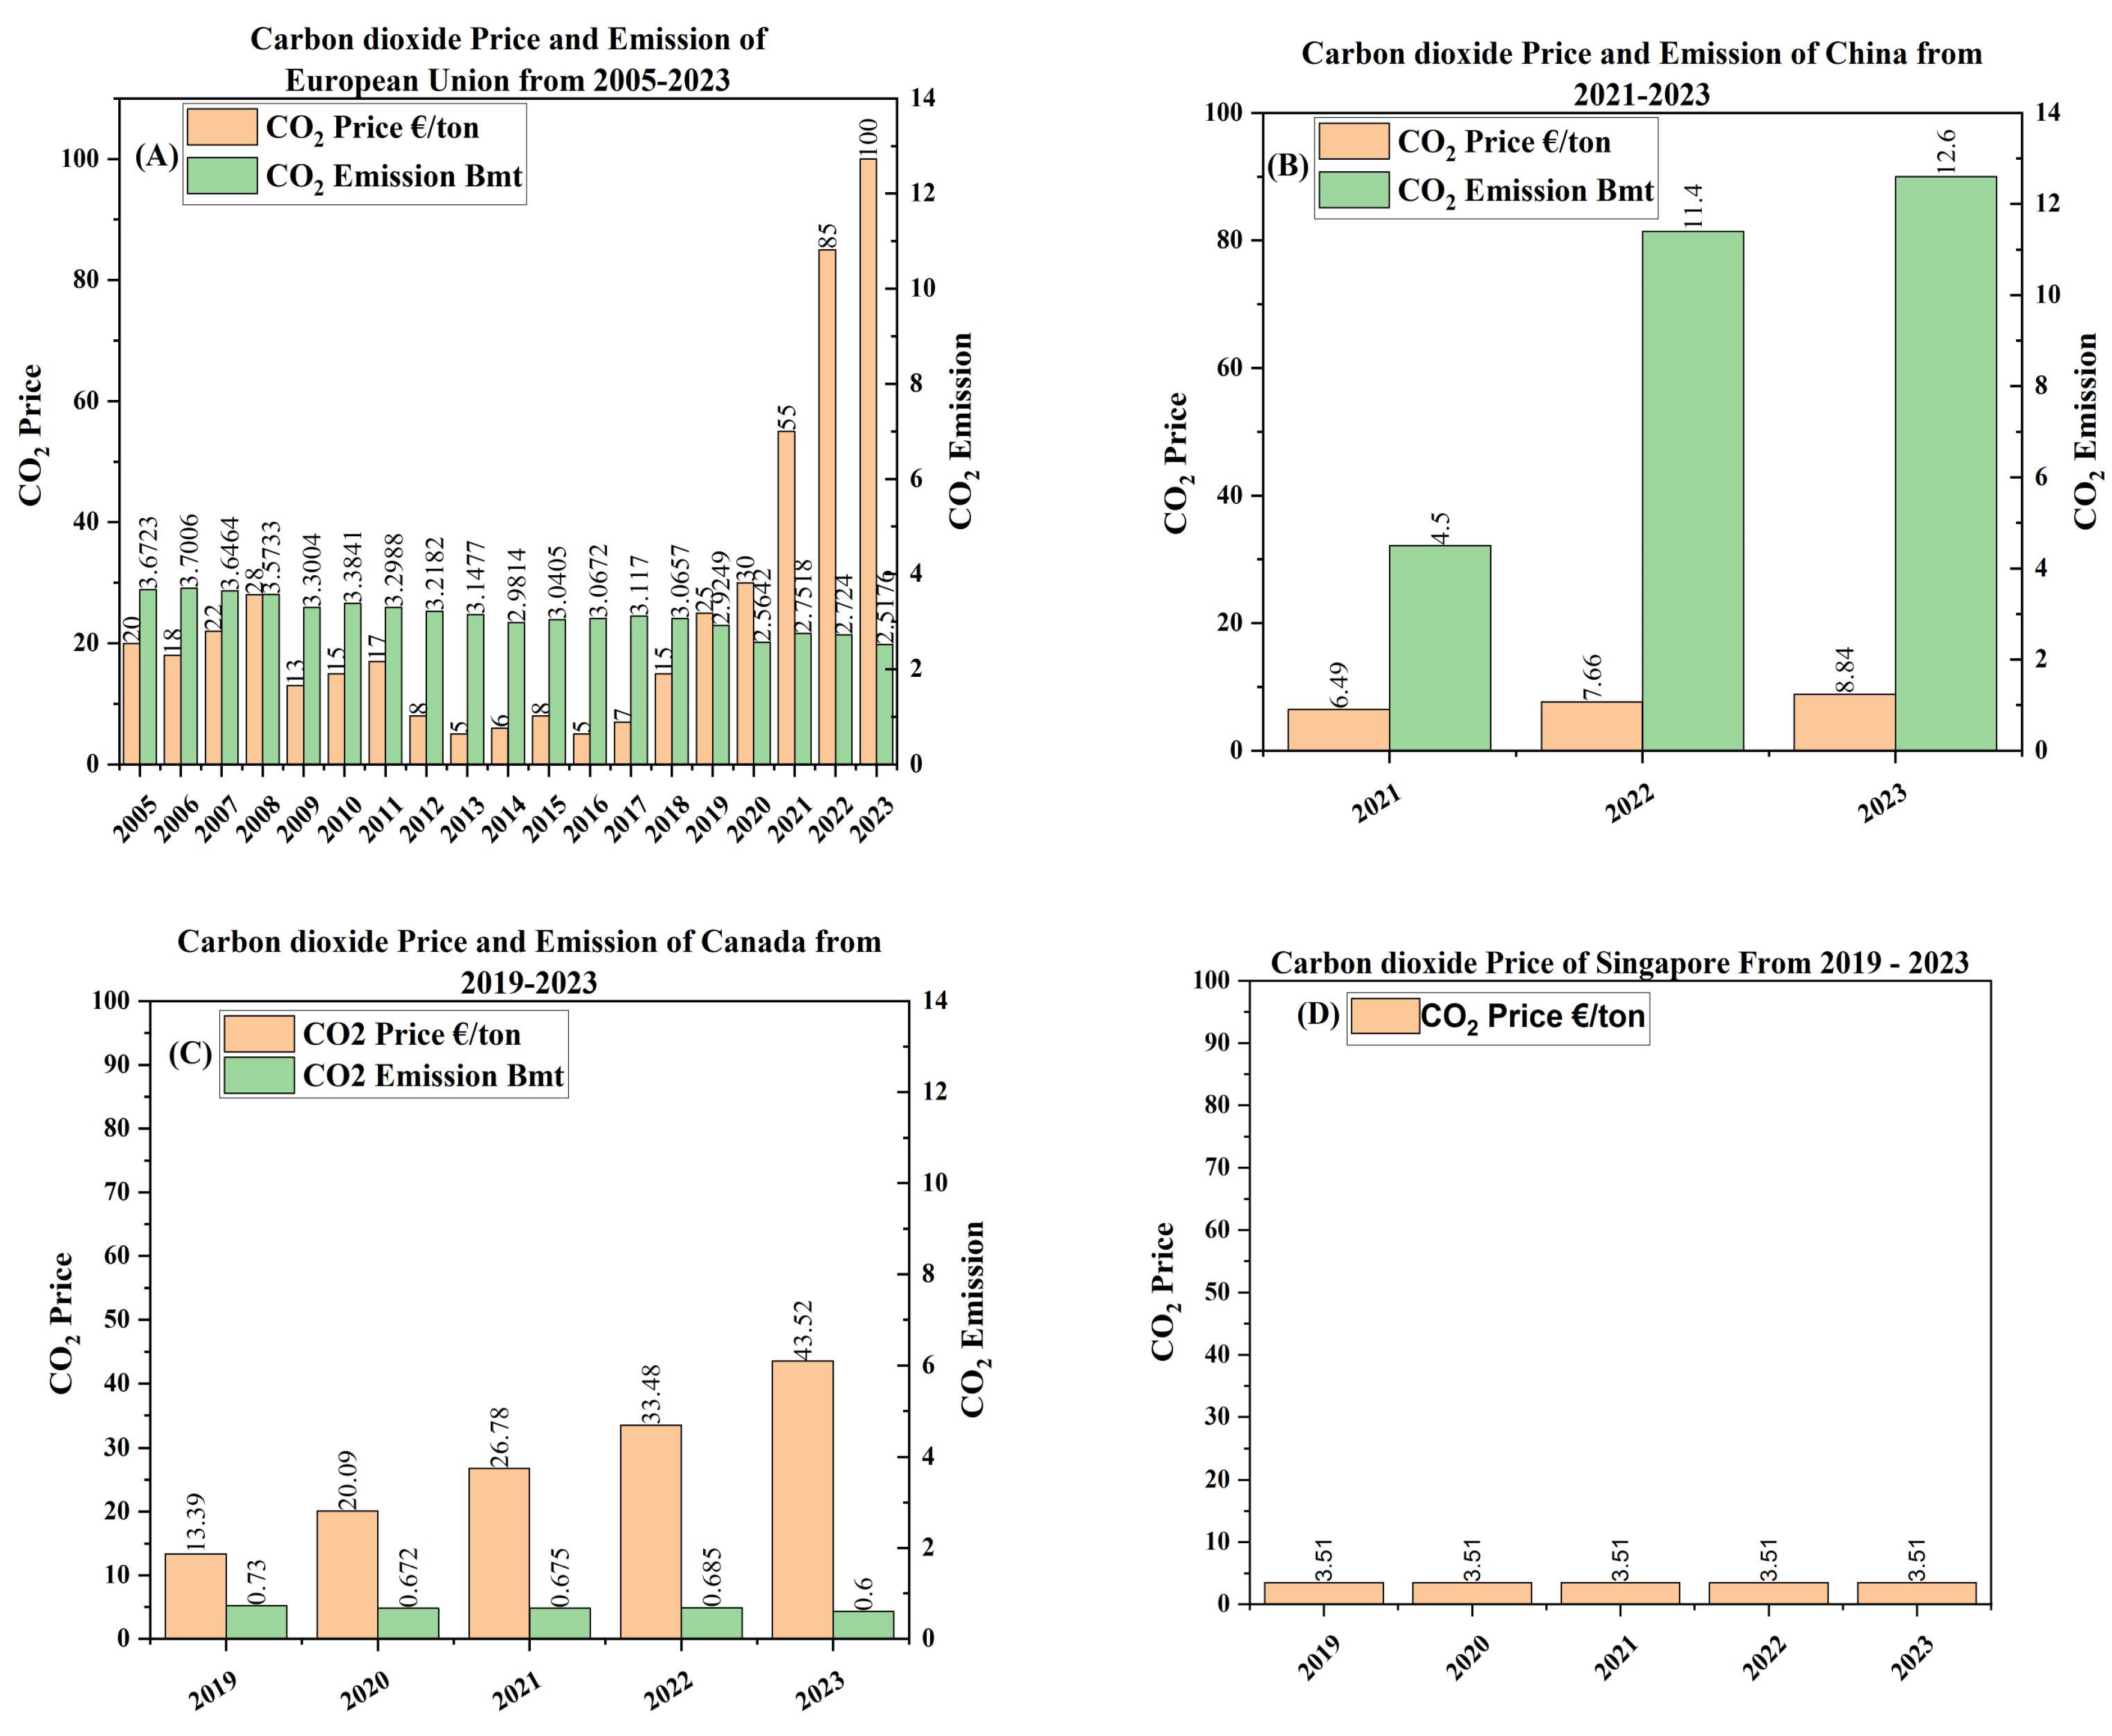
4.1. Carbon Pricing Mechanisms in the EU, China, Canada, and Singapore

The EU, China, Canada, and Singapore have each developed distinct carbon pricing mechanisms tailored to their specific economic and environmental contexts. The EU Emissions Trading System (EU ETS), which covers energy, industry, aviation, cement, steel, and paper, covers about half of the EU’s CO2 emissions and 40% of all greenhouse gas emissions. It operates by setting a gradually declining emissions cap, requiring emitters to obtain permits, with auctions becoming increasingly prevalent. In contrast, China’s carbon market is the world’s largest emitter, but covers only coal-burning industries. Canada employs a hybrid system, combining a carbon tax with an output-based pricing system (OBPS). Singapore, on the other hand, uses a direct carbon tax. This system targets heavy emitters, defined as those emitting over 25,000 tons per year, ensuring simplicity and transparency. Carbon pricing varies significantly across the four regions (Figure 1); the EU’s carbon price is about twice Canada’s, ten times China’s, and 25 times Singapore’s. Each system reflects its unique economic and regulatory context, offering diverse approaches to carbon pricing.
The data highlights a clear relationship between carbon prices and emissions reductions, as illustrated in the figures. In the EU, Figure 2A shows that carbon prices rose significantly from EUR 25 per ton in 2019 to EUR 100 per ton in 2023, leading to substantial declines in CO2 emissions. This demonstrates that higher carbon prices effectively drive emissions reductions by incentivizing polluters to adopt cleaner practices. Similarly, in Canada, Figure 2C reveals that carbon prices increased from EUR 13.39 per ton in 2019 to EUR 43.52 per ton in 2023, resulting in a drop in emissions from 0.73 billion tons to 0.6 billion tons. In contrast, Figure 2B highlights China’s low carbon prices—rising only slightly from EUR 6.49 to EUR 8.84 per ton between 2021 and 2023—which failed to curb emissions, as they grew from 4.5 billion tons to 12.6 billion tons. Singapore has the lowest carbon pricing at EUR 3.51 per ton, reflecting weakness in its market due to fixed pricing from 2019 to 2023 Figure 2D, unlike the free trade systems in the EU, China, and Canada. While other markets saw year-on-year price increases, Singapore plans to raise its carbon price to EUR 35.13–56.21 per ton by 2030 [52], though this target has already been matched or exceeded by the EU and Canada as of 2023. Although data on Singapore’s carbon emissions from 2021 to 2023 is unavailable, figures from 2019 and 2020 suggest a significant increase in emissions in 2020, indicating that low carbon prices may hinder effective emissions reductions.
The application of sanctions is a critical factor for carbon markets, with the EU standing out as the only market with a strong penalty system, ensuring compliance and emissions reduction targets. The EU ETS distinguishes itself as the most effective carbon reduction initiative due to its comprehensive scope, design, pricing, and enforcement mechanisms. In contrast, Singapore faces significant challenges, with low prices and limited coverage hindering meaningful emissions reductions. China and Canada show potential but require improvements in regulatory consistency, public engagement, and market integration to enhance their effectiveness. Overall, while carbon pricing systems are essential tools for reducing emissions, their success varies by region. The EU demonstrates that strong carbon pricing drives reductions, while China, Canada, and Singapore face obstacles such as low prices, limited coverage, and policy fragmentation, highlighting the need for continuous improvement to achieve climate goals.

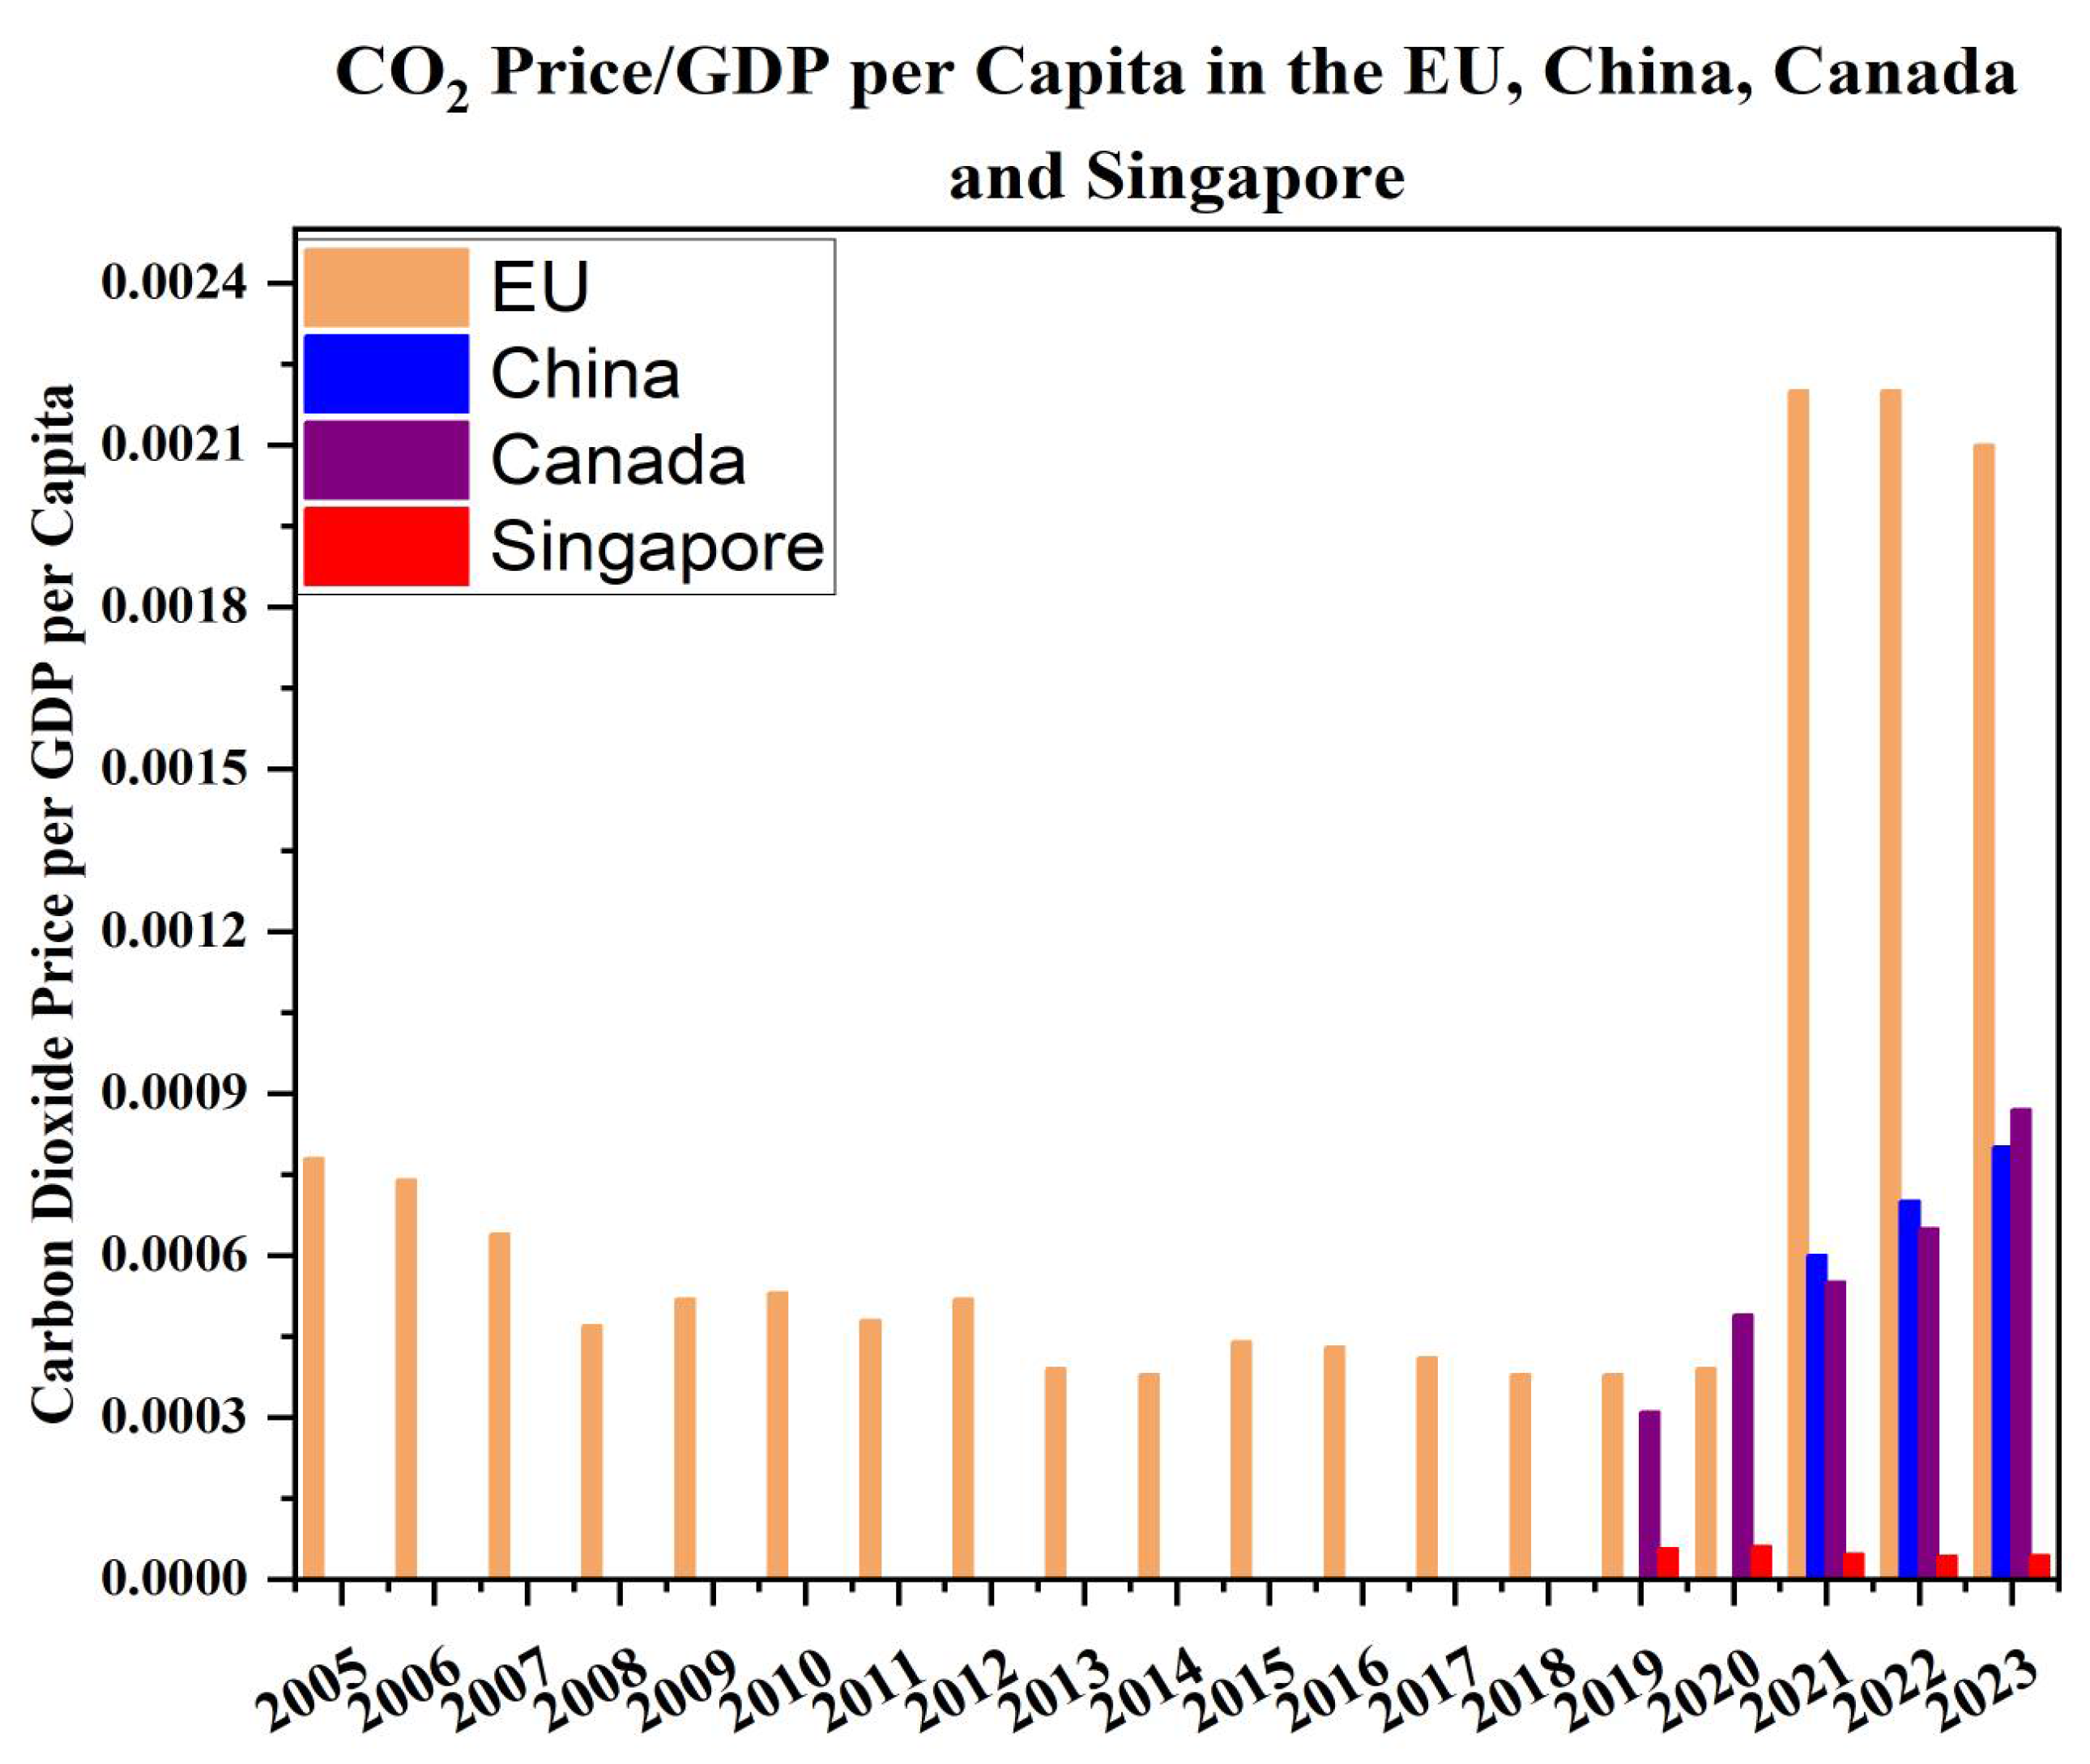
4.2. Carbon Price/GDP per Capita of the EU, China, Canada, and Singapore

This section uses carbon price to GDP per capita ratios to assess pricing equality across four major economies (EU, China, Canada, and Singapore), building on the correlation study between carbon prices and emission reductions in Section 4.1. Through the integration of national economic capacity into the examination of carbon pricing, this statistic offers a more thorough evaluation. By comparing comparable policy burdens, the GDP-per-capita approach makes it possible to determine if carbon costs are commensurate with the economic capacities of various nations. By adding important equity factors, this research enhances our first effectiveness review. It is especially significant for identifying situations in which ostensibly reduced carbon pricing may still result in disproportionate burdens for less wealthy countries.

4.2.1. GDP per Capita of the European Union from 2003 to 2023

The GDP per capita of the European Union has varied greatly. It was USD 27,342 in 2005, an increase of 3.93% over 2004. By 2006, it had risen 6.39% to USD 29,090. The boom carried into 2007, as GDP per capita rose to USD 33,587, a 15.46% increase, and then USD 37,044 in 2008, a 10.29%. In 2009, however, the global financial crisis caused a fall of 9.62%, and GDP per capita fell to USD 33,481.
The EU economy started recovering in 2010, with a GDP per capita of USD 32,966, a microscopic 1.54% decline from 2009. By 2011, GDP per capita rose to USD 35,767, an increase of 8.5%. In 2012, it dropped 7.26% to USD 33,169, but in 2013, it rose 4.21% to USD 34,565. In 2014, the economy’s real GDP per capita was USD 35,313, with a GDP annual growth rate of 2.08%. Another Pace of initial gain rose 13.59% in 2015 to USD 30,488, and then 2.25% in 2016 to USD 31,175.
In 2017, GDP per capita rose 6.15% to USD 33,091 and then rose 8.04% to USD 35,753 in 2018. In 2019, though, it dropped 1.88% to USD 35,081. In 2020, the pandemic decreased GDP per capita by 2.06% to USD 34,357. In 2021, the economy recovered, with per capita GDP increasing 12.7% to USD 38,721. Although 2022 saw a 3.24% contraction to USD 37,467, there was another strong rebound in 2023, with 8.96% growth lifting GDP per capita to USD 40,824. These swings reflect the EU economy’s resilience and long-term problems [58].

4.2.2. GDP per Capita of China from 2021 to 2023

China’s GDP per capita grew significantly by 21.22% in 2021, reaching USD 12,618, driven by post-pandemic recovery, industrial activity, exports, and government support. However, growth slowed sharply in 2022, with GDP per capita rising only 0.36% to USD 12,663 due to global economic uncertainty and domestic adjustments. In 2023, it declined slightly by 0.38% to USD 12,614, reflecting challenges from falling global demand and local economic pressures [59].

4.2.3. GDP per Capita of Canada from 2019 to 2023

Canada’s GDP per capita in 2023 was USD 53,372, down 3.85% from 2022. In 2022, GDP per capita was USD 55,509, up 5.74% from 2021. In 2021, GDP per capita was USD 52,497, a significant 20.58% increase over 2020. GDP per capita in 2020 was USD 43,538, down 6.07% from USD 46,353 in 2019. These data illustrate a period of significant economic expansion from 2020 to 2022, with a leveling off and a modest reduction in 2023 [60].

4.2.4. GDP per Capita of Singapore from 2019 to 2023

Singapore’s GDP per capita has shown notable fluctuations from 2019 to 2023. In 2019, it stood at USD 66,082 but dropped by 6.98% in 2020 to USD 61,467 due to economic contraction. A strong recovery followed in 2021, with a 29.5% increase to USD 79,601. Growth continued in 2022, rising 11.09% to USD 88,429. However, in 2023, GDP per capita declined by 4.18% to USD 84,734, reflecting economic challenges. These changes highlight Singapore’s economic resilience and volatility during this period [61].
As carbon pricing is important to the carbon market and carbon policy, it is the second important factor to depreciate the carbon price, compared to GDP per capita, to which degree they deviate from each other. On a per capita basis, it would be Singapore first, Canada second, the EU third, and China fourth. However, based on carbon prices per capita, the average is in the European Union, which is leading the pack, followed by Canada and China, with Singapore having the lowest carbon price in Figure 3.
According to this study’s carbon price per GDP per capita ranking, the country with the lowest carbon price is Singapore, and the EU, which comes in first and has the highest carbon price. Based on this comparison, it can be concluded that raising carbon pricing in other markets to levels comparable to those in the European Union will make it much easier to achieve the net-zero carbon target and, in turn, reduce the effects of climate change.

4.3. Recommendation

Structure for the Establishment of the Global Carbon Market

The Global Carbon Resilience Framework (GCRF) is a comprehensive strategy to combat climate change by establishing a transparent and efficient global carbon market with standardized pricing to drive emission reductions. It enforces mandatory targets using Certified Emission Reductions (CERs) and strong verification systems while prioritizing equity, a just transition for vulnerable communities, and investments in clean technologies and green infrastructure. The framework emphasizes international collaboration, capacity-building, and knowledge sharing, particularly for developing countries. Structured in five phases (2026-2050), GCRF aims to achieve significant emissions reductions, promote sustainable economic growth, and strengthen global cooperation, ensuring a sustainable and equitable future.
 1. 
Uniform Carbon Pricing Mechanism
The Uniform Carbon Pricing Mechanism establishes a standardized carbon price starting at EUR 100 per ton for industrialized nations, with incremental increases over time to incentivize clean technology investment and reduce emissions. This flexible pricing adapts to market realities and technological advancements, balancing economic stability with the transition to a low-carbon economy.
For developing countries, a tiered carbon price of EUR 30–50 per ton is proposed to encourage emission reductions without hindering economic growth. For least-developed countries (LDCs), a lower range of EUR 5–15 per ton is recommended to avoid excessive financial strain, allowing them to focus on development goals like poverty reduction and education.
Price increases should align with economic growth, technological progress, and global support to minimize disruptions. Developed nations and global organizations must provide financial and technological assistance, including funding for renewable energy, technology transfer, and capacity-building. Revenue from carbon pricing should be reinvested in sustainable projects like renewable infrastructure and climate adaptation. This approach ensures equity and effectiveness, adhering to the principle of “common but differentiated responsibilities and respective capabilities.”
  • Rules for Carbon Price Policy
At the end of each year, each industry and carbon emission source has four statuses: Now, for each industry and status, we suggest specific rules.
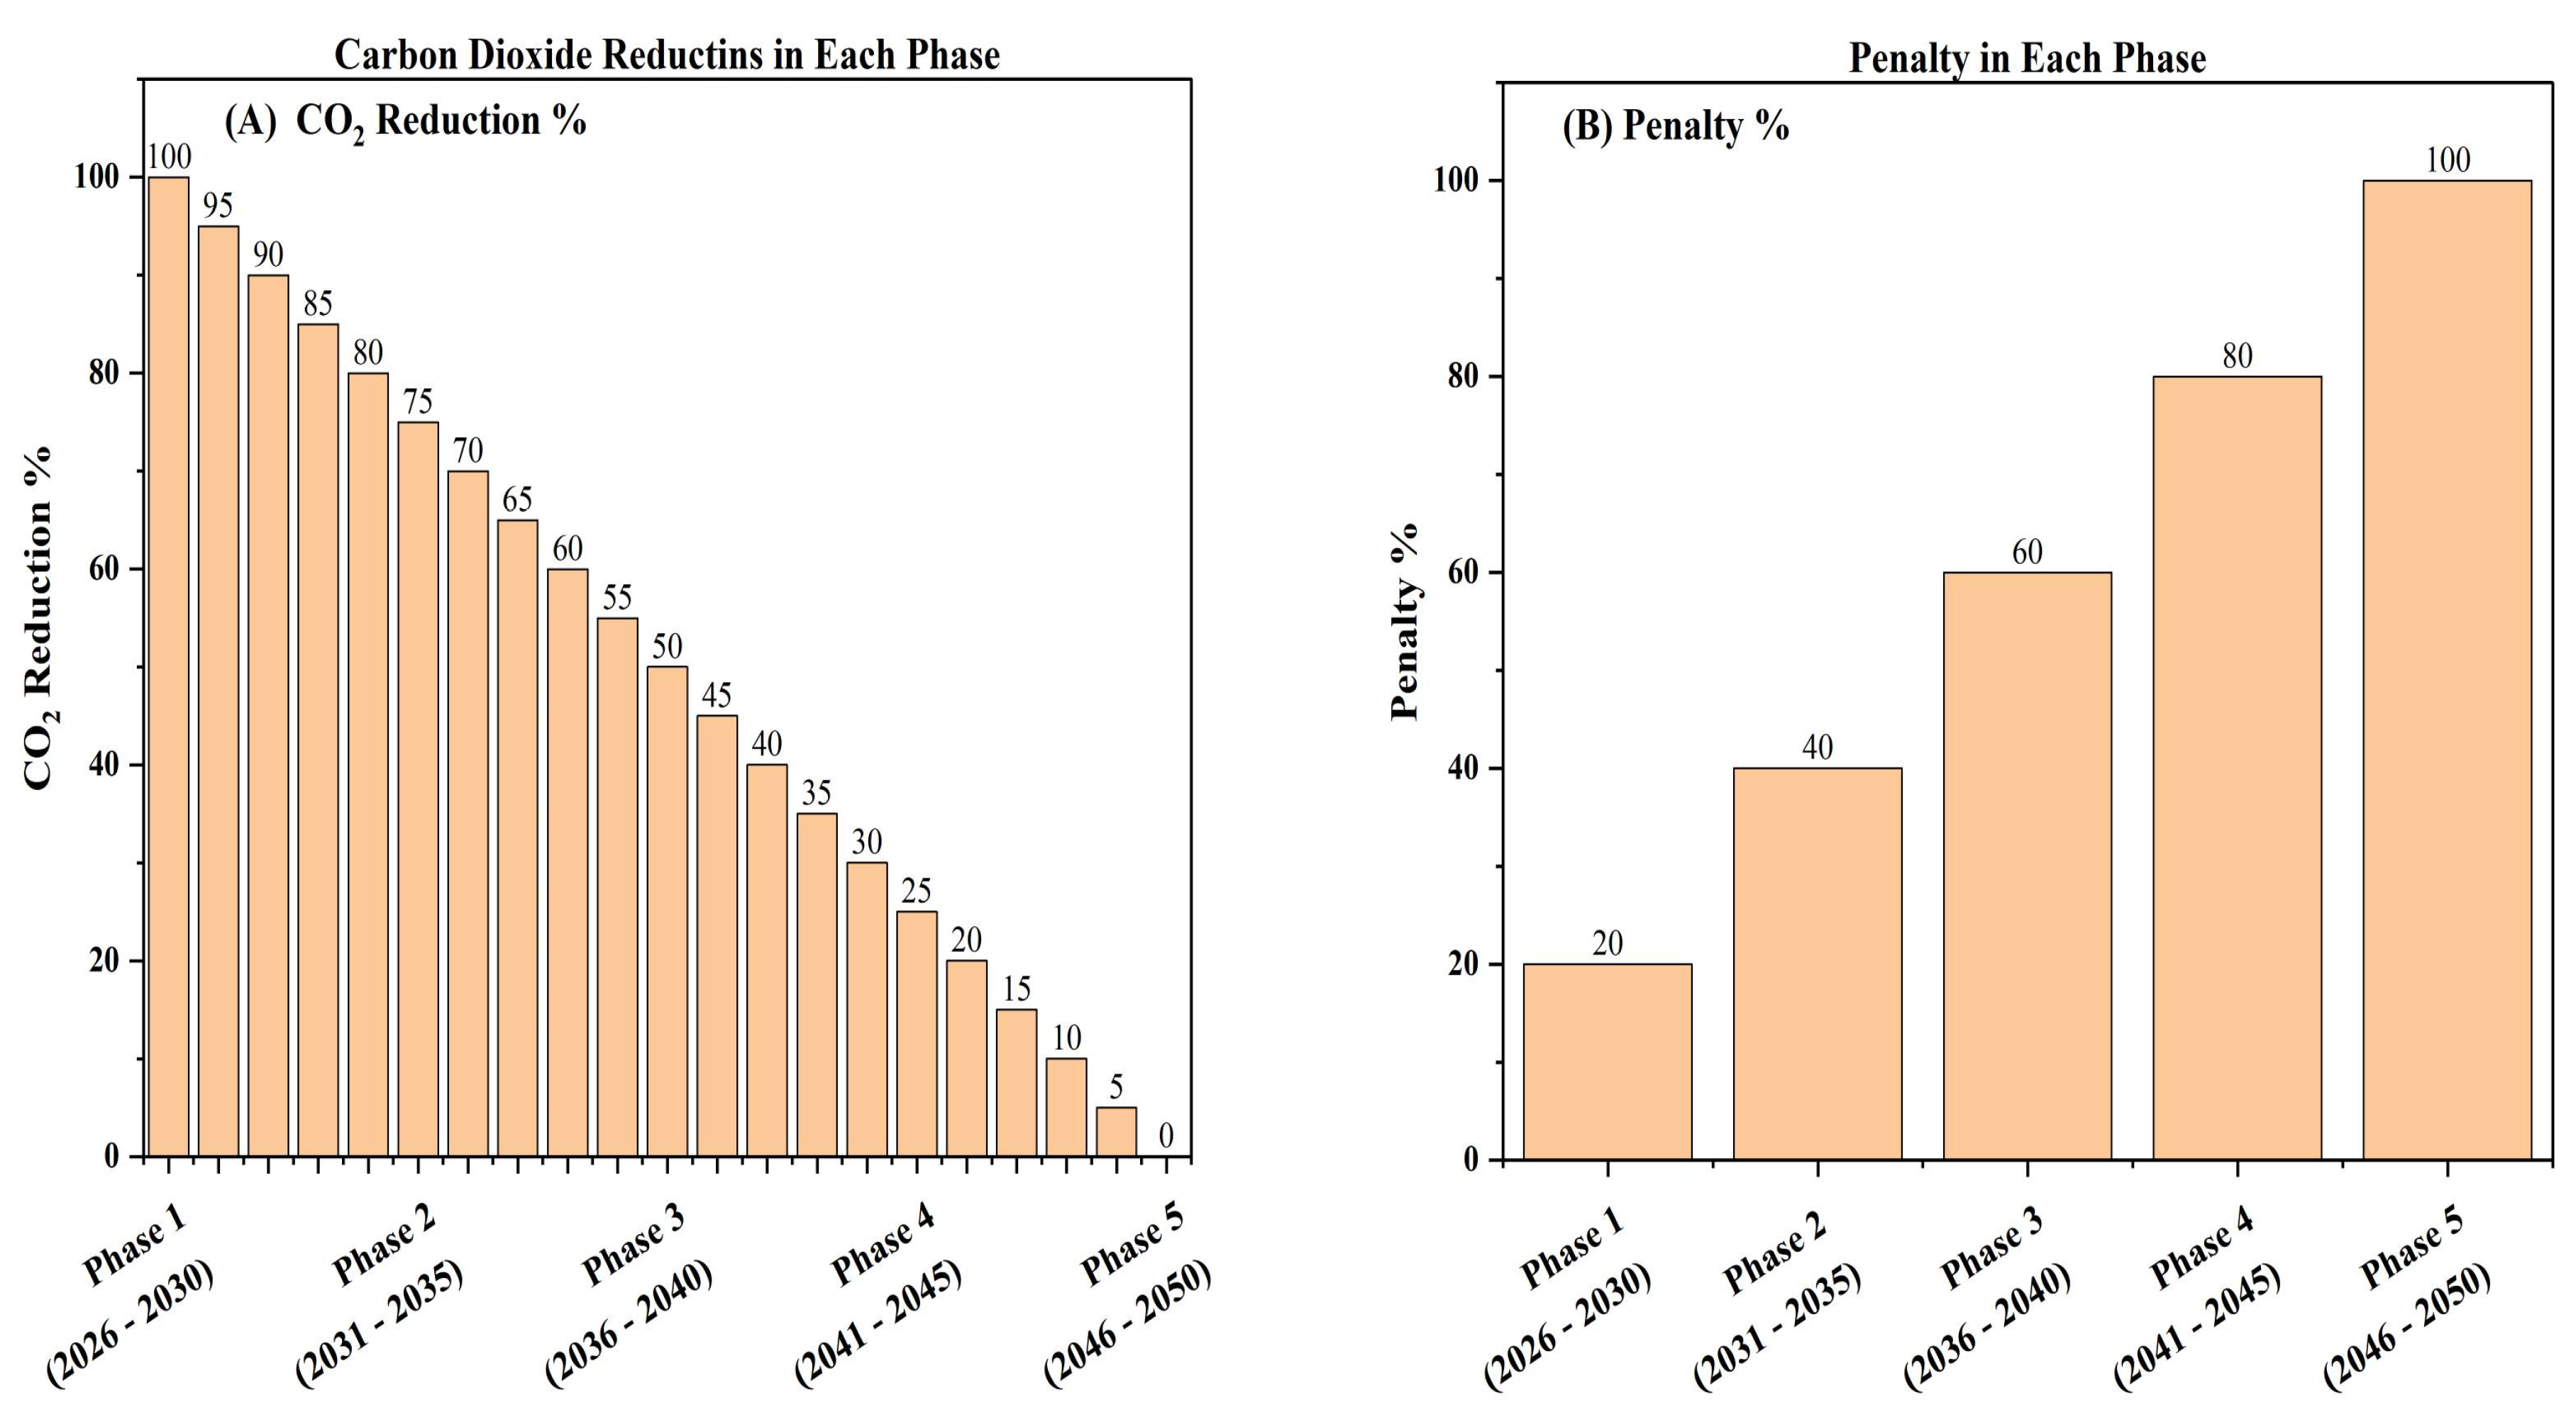
  • Phase 1: (2026–2030)
The carbon pricing system adjusts annually based on changes in carbon emissions compared to the previous year, with the following rules:
  • Increase in Emissions: If emissions rise, the new carbon price = current carbon price + 5% of the current price + percentage increase in emissions.
  • Emissions Equal to Last Year: If emissions remain the same, the new carbon price = current carbon price + 5% of the current price.
  • Emissions Reduced by 5%: If emissions decrease by 5%, the carbon price remains unchanged for the new year.
  • Emissions Reduced by More Than 5%: If emissions decrease by more than 5%, the new carbon price = current carbon price + 5% of the current price − total percentage of reduced emissions.
This system incentivizes emission reductions while ensuring gradual adjustments to carbon prices based on annual performance.
  • Phase 2: (2031–2035)
The carbon pricing system adjusts annually based on changes in carbon emissions compared to the previous year, with the following rules:
  • Increase in Emissions: If emissions rise, the new carbon price = current carbon price + 10% of the current price + percentage increase in emissions.
  • Emissions Equal to Last Year: If emissions remain the same, the new carbon price = current carbon price + 10% of the current price.
  • Emissions Reduced by 5%: If emissions decrease by 5%, the carbon price remains unchanged for the new year.
  • Emissions Reduced by More Than 5%: If emissions decrease by more than 5%, the new carbon price = current carbon price − total reduction percentage + 5% of the current price.
These rules apply to developed, developing, and least-developed countries and are implemented across phases 2 to 5 (2031–2050). This system incentivizes industries to reduce emissions by creating competition and rewarding reductions. Factories that cut emissions by 5% annually can achieve a 25% reduction per phase, helping reach net-zero emissions by 2050 without excessive pressure and allowing gradual adaptation.
 2. 
Mandatory Carbon Emission Reduction (CER) Requirement
All factories must obtain Certified Emission Reductions (CERs) to offset their emissions, ensuring accountability for their carbon footprint. A robust verification process will guarantee accurate and authentic emissions reporting, encouraging cleaner technologies and practices to meet reduction targets.
In this system, emission thresholds for requiring CERs are adjusted progressively across five phases based on monthly carbon dioxide emissions:
  • Phase 1: Over 1600 tons/month
  • Phase 2: Over 1300 tons/month
  • Phase 3: Over 1000 tons/month
  • Phase 4: Over 700 tons/month
  • Phase 5: Over 400 tons/month
Unlike Singapore’s annual emission calculation (where industries emitting over 25,000 tons/year require CERs), this system uses monthly thresholds to prevent excessive emissions in any single month. This approach reduces environmental risks by ensuring consistent emission control throughout the year, rather than allowing high emissions in some months to be offset by lower emissions in others.
 3. 
Penalty System for Non-Compliance
The Non-Compliance and Penalty System imposes penalties on enterprises that exceed emission limits or lack sufficient Certified Emission Reductions (CERs). These penalties are designed to enforce compliance with emissions laws and hold companies accountable for their environmental impact. The revenue from fines will fund sustainability programs, climate change initiatives, and the transition to a low-carbon economy.
Penalties increase progressively across five phases:
  • Phase 1: Original price + 20%
  • Phase 2: Original price + 40%
  • Phase 3: Original price + 60%
  • Phase 4: Original price + 80%
  • Phase 5: Original price + 100%
This escalating penalty structure acts as a deterrent, encouraging companies to comply with emissions regulations and invest in cleaner practices.
Figure 4 illustrates carbon dioxide reduction targets across five-year phases from 2026 to 2050, following a projected peak in emissions in 2030. Corresponding penalty percentages are applied during each phase to incentivize emission reductions. The left panel shows the CO2 reduction percentage, while the right panel displays the associated penalty percentage for each phase.

4.4. Scenarios

4.4.1. Scenario 1: Exponential Carbon Price Increases Amid Stable or Rising Emissions

Under this pessimistic scenario, we project carbon prices assuming annual emissions remain stable or increase, triggering consistent 5% annual price escalations across all countries’ tiers from 2026 to 2030, followed by 10% annual escalations from 2031 to 2050. Starting from the 2026 baseline prices (EUR 100/ton for developed nations, EUR 40/ton for developing countries, and EUR 10/ton for the least-developed countries), the carbon price would rise exponentially to reach EUR 817.79, EUR 327.08, and EUR 81.83 per ton, respectively, by 2050.

4.4.2. Scenario 2: Stable Carbon Pricing with Moderate Emission Reductions

Our proposed carbon pricing framework for developed, developing, and least-developed countries will be implemented from 2026 to 2050. The predicted carbon prices during this period are EUR 100/ton for developed countries, EUR 40/ton for developing countries, and EUR 10/ton for the very least-developed countries. In Scenario 2, if carbon emissions decrease by 5% compared to the previous year, the carbon price will remain unchanged from 2026 to 2050. Under this scenario, we anticipate that the target of achieving net-zero emissions will be reached by 2050.

4.4.3. Scenario 3: Dynamic Carbon Pricing with Enhanced Emission Reductions

In Scenario 3, our proposed carbon pricing framework for developed, developing, and least-developed countries will be implemented from 2026 to 2050. The predicted carbon prices during this period are EUR 100/ton for developed countries, EUR 40/ton for developing countries, and EUR 10/ton for least-developed countries. If carbon emissions decrease by more than 5% compared to the previous year, the carbon price will decrease from the predicted levels. Under this scenario, we anticipate that the target of achieving net-zero emissions will be reached before 2050.
In conclusion, these scenarios illustrate the potential trajectories of carbon pricing and emission reductions over the coming decades. Scenario 1 highlights the challenges of maintaining stable emissions, resulting in significant price increases. Scenario 2 emphasizes the importance of moderate emission reductions, allowing for price stability while still aiming for net-zero emissions by 2050. Finally, Scenario 3 presents a proactive approach, where enhanced emission reductions lead to decreasing carbon prices and an accelerated path to net-zero. Together, these scenarios underscore the critical need for effective policies and strategies to achieve our climate goals.

5. Conclusions

The urgent need to address climate change highlighted the importance of effective carbon pricing mechanisms capable of significantly reducing greenhouse gas emissions. This study compared the carbon pricing approaches of the European Union (EU), China, Canada, and Singapore, revealing both successes and challenges in their implementations. The EU’s Emissions Trading System (ETS) emerged as a leading model, characterized by high carbon prices, broad market coverage, and stringent enforcement measures that effectively reduced CO2 emissions. In contrast, China’s efforts were hampered by limited market coverage and low carbon price levels, despite being the world’s largest emitter. Canada faced challenges due to fragmented provincial policies, while Singapore’s fixed pricing structure limited its effectiveness in reducing emissions.
The analysis identified three critical success factors for effective carbon pricing: the necessity of higher carbon prices per capita, the importance of penalties for compliance, and the need for expanded market coverage. These factors were essential for encouraging industries to adopt cleaner technologies. To address global disparities, the study proposed a Uniform Carbon Pricing Mechanism under the Global Carbon Resilience Framework (GCRF). This mechanism included tiered pricing structures for developed, developing, and least-developed countries, balancing economic growth with the imperative to reduce emissions, while ensuring that vulnerable regions were not disproportionately burdened.
The GCRF aimed to provide an adaptable and equitable pathway for achieving significant emissions reductions by 2050, emphasizing international collaboration, capacity-building, and knowledge sharing, particularly for developing nations. By establishing transparent and enforceable targets alongside a robust verification process, the GCRF promoted accountability and encouraged investment in clean technologies.
Additionally, the proposed penalty system for non-compliance was a crucial component of the GCRF. By escalating penalties for exceeding emissions limits or failing to secure sufficient Certified Emission Reductions (CERs), this system aimed to deter non-compliance and incentivize sustainable practices. Revenue from these penalties could be reinvested into sustainability programs, further facilitating the transition to a low-carbon economy.
In conclusion, as the research underscored, achieving net-zero emissions by 2050 was fraught with challenges, but the establishment of a robust and equitable global carbon pricing framework presented a viable solution. By learning from the successes and shortcomings of existing systems in the EU, China, Canada, and Singapore, a cohesive strategy was developed that balanced environmental integrity with economic growth and social equity. This integrated approach was essential for meeting global climate goals and ensuring a healthier, sustainable future for generations to come.
This study on global carbon pricing has key limitations: (1) national-level data obscures local variations, (2) isolated policy analysis misses complementary measures, (3) static pricing fails to reflect market dynamics, and (4) insufficient examination of equity impacts and political-economic feasibility. Future research should focus on subnational studies, dynamic policy interaction models, equity assessments, and region-specific feasibility analyses incorporating policymaker input. These improvements would strengthen the Global Carbon Resilience Framework by developing more adaptable, context-sensitive carbon pricing systems.

Author Contributions

Resources, X.X.; Data curation, X.D.; Writing—original draft, M.I.A.; Visualization, H.Q.; Supervision, B.X. All authors have read and agreed to the published version of the manuscript.

Funding

This research received no external funding.

Institutional Review Board Statement

Not applicable.

Informed Consent Statement

Not applicable.

Data Availability Statement

The original contributions presented in this study are included in the article. Further inquiries can be directed to the corresponding authors.

Conflicts of Interest

The authors declare no conflict of interest.

References

  1. Okedele, P.O.; Aziza, O.R.; Oduro, P.; Ishola, A.O. Carbon pricing mechanisms and their global efficacy in reducing emissions: Lessons from leading economies. Open Access Res. J. Sci. Technol. 2024, 7, 114–125. [Google Scholar] [CrossRef]
  2. Digitemie, W.N.; Ekemezie, I.O. Assessing the role of carbon pricing in global climate change mitigation strategies. Magna Sci. Adv. Res. Rev. 2024, 10, 022–031. [Google Scholar] [CrossRef]
  3. Emeka-Okoli, S.; Otonnah, C.A.; Nwankwo, T.C.; Nwankwo, E.E. Review of carbon pricing mechanisms: Effectiveness and policy implications. Int. J. Appl. Res. Soc. Sci. 2024, 6, 337–347. [Google Scholar] [CrossRef]
  4. Simpa, P.; Solomon, N.O.; Adenekan, O.A.; Obasi, S.C. Strategic implications of carbon pricing on global environmental sustainability and economic development: A conceptual framework. Int. J. Adv. Econ. 2024, 6, 139–172. [Google Scholar] [CrossRef]
  5. Biresselioğlu, M.E.; Solak, B.; Savaş, Z.F. Framing the Impacts of the European Green Deal: Reflections on the EU as a “Normative Power” and Beyond. Ank. Avrupa Çalışmaları Derg. 2023, 23, 91–134. [Google Scholar] [CrossRef]
  6. Tkachuk, O. The European Union in its pursuit of being a global leader in climate neutrality. Glob. Policy 2024, 15, 69–74. [Google Scholar] [CrossRef]
  7. Wolf, S.; Teitge, J.; Mielke, J.; Schütze, F.; Jaeger, C. The European Green Deal—More than climate neutrality. Intereconomics 2021, 56, 99–107. [Google Scholar] [CrossRef]
  8. Wang, S.; Li, Q.; Fang, C.; Zhou, C. The relationship between economic growth, energy consumption, and CO2 emissions: Empirical evidence from China. Sci. Total Environ. 2016, 542, 360–371. [Google Scholar] [CrossRef]
  9. Byrne, J.; Shen, B.; Li, X. The challenge of sustainability: Balancing China’s energy, economic and environmental goals. Energy Policy 1996, 24, 455–462. [Google Scholar] [CrossRef]
  10. Cook, C.; Prystajecky, N.; Feze, I.N.; Joly, Y.; Dunn, G.; Kirby, E.; Özdemir, V.; Isaac-Renton, J. A comparison of the regulatory frameworks governing microbial testing of drinking water in three Canadian provinces. Can. Water Resour. J. 2013, 38, 185–195. [Google Scholar] [CrossRef]
  11. Watson, T.M.; Hyshka, E.; Bonato, S.; Rueda, S. Early-stage cannabis regulatory policy planning across Canada’s four largest provinces: A descriptive overview. Subst. Use Misuse 2019, 54, 1691–1704. [Google Scholar] [CrossRef] [PubMed]
  12. Doern, G.B.; Johnson, R. Rules, Rules, Rules, Rules: Multilevel Regulatory Governance; University of Toronto Press: Toronto, ON, Canada, 2006; Volume 26. [Google Scholar]
  13. Raihan, A.; Muhtasim, D.A.; Farhana, S.; Hasan, A.U.; Paul, A.; Faruk, O. Toward environmental sustainability: Nexus between tourism, economic growth, energy use and carbon emissions in Singapore. Glob. Sustain. Res. 2022, 1, 53–65. [Google Scholar] [CrossRef]
  14. Lau, H.C.; Ramakrishna, S.; Zhang, K.; Hameed, M.Z.S. A decarbonization roadmap for Singapore and its energy policy implications. Energies 2021, 14, 6455. [Google Scholar] [CrossRef]
  15. Ellerman, A.D.; Marcantonini, C.; Zaklan, A. The European Union emissions trading system: Ten years and counting. Rev. Environ. Econ. Policy 2016, 10, 89–107. [Google Scholar] [CrossRef]
  16. Egenhofer, C.; Alessi, M.; Georgiev, A.; Fujiwara, N. The EU Emissions Trading System and Climate Policy Towards 2050: Real Incentives to Reduce Emissions and Drive Innovation; CEPS Special Reports; Elsevier: Amsterdam, The Netherlands, 2011. [Google Scholar]
  17. Moya, J.A.; Boulamanti, A. Production Costs from Energy-Intensive Industries in the EU and Third Countries; Publications Office of the European Union: Luxembourg, 2016. [Google Scholar]
  18. Skjærseth, J.B.; Wettestad, J. The origin, evolution and consequences of the EU emissions trading system. Glob. Environ. Politics 2009, 9, 101–122. [Google Scholar] [CrossRef]
  19. Portal, T.E.R. European Carbon Price at an All-Time High; BNP Paribas: Paris, France, 2023. [Google Scholar]
  20. Statista, Energy & Environment. Carbon Dioxide Emissions in the European Union from 1965 to 2023 (in Million Metric Tons); Statista: Hamburg, Germany, 2024. [Google Scholar]
  21. Engels, A.; Knoll, L.; Huth, M. Preparing for the ‘real’market: National patterns of institutional learning and company behaviour in the European Emissions Trading Scheme (EU ETS). Eur. Environ. 2008, 18, 276–297. [Google Scholar] [CrossRef]
  22. Liu, J.-Y.; Zhang, Y.-J. Has carbon emissions trading system promoted non-fossil energy development in China? Appl. Energy 2021, 302, 117613. [Google Scholar] [CrossRef]
  23. Wang, C.; Wang, F. China can lead on climate change. Science 2017, 357, 764. [Google Scholar] [CrossRef]
  24. Kopra, S. A Responsible Developing Country: China’s National Image Building and International Negotiations on Climate. Q. J. Chin. Stud. 2013, 1, 121. [Google Scholar]
  25. Ding, G.; Deng, Y.; Lin, S. A study on the classification of China’s provincial carbon emissions trading policy instruments: Taking Fujian province as an example. Energy Rep. 2019, 5, 1543–1550. [Google Scholar] [CrossRef]
  26. Wang, H. Evaluating regional emissions trading pilot schemes in China’s two provinces and five cities. AGI Work. Pap. Ser. 2016, 2016, 1–51. [Google Scholar]
  27. Han, G.; Olsson, M.; Hallding, K.; Lunsford, D. China’s Carbon Emission Trading: An Overview of Current Development; Fores: Stockholm, Sweden, 2012. [Google Scholar]
  28. Lo, A.Y. Carbon emissions trading in China. Nat. Clim. Chang. 2012, 2, 765–766. [Google Scholar] [CrossRef]
  29. Mo, J.-L.; Agnolucci, P.; Jiang, M.-R.; Fan, Y. The impact of Chinese carbon emission trading scheme (ETS) on low carbon energy (LCE) investment. Energy Policy 2016, 89, 271–283. [Google Scholar] [CrossRef]
  30. Ni, L.; Li, J.; Xu, H.; Wang, X.; Zhang, J. Fraud feature boosting mechanism and spiral oversampling balancing technique for credit card fraud detection. IEEE Trans. Comput. Soc. Syst. 2023, 11, 1615–1630. [Google Scholar] [CrossRef]
  31. Yun, P.; Liang, X.; Jia, L.; Jiexin, Y.; Hongwei, L. Status and trend of global carbon pricing mechanism and its impacts on petroleum industry. China Pet. Explor. 2022, 27, 41. [Google Scholar]
  32. Wang, Q.; Wang, L.; Li, R. Trade protectionism jeopardizes carbon neutrality–decoupling and breakpoints roles of trade openness. Sustain. Prod. Consum. 2023, 35, 201–215. [Google Scholar] [CrossRef]
  33. He, J.; Li, Z.; Zhang, X.; Wang, H.; Dong, W.; Chang, S.; Ou, X.; Guo, S.; Tian, Z.; Gu, A.; et al. Comprehensive report on China’s long-term low-carbon development strategies and pathways. Chin. J. Popul. Resour. Environ. 2020, 18, 263. [Google Scholar] [CrossRef]
  34. Wang, K.; Wang, Z.; Xian, Y.; Shi, X.; Yu, J.; Feng, K.; Hubacek, K.; Wei, Y.-M. Optimizing the rolling out plan of China’s carbon market. Iscience 2023, 26, 105823. [Google Scholar] [CrossRef]
  35. Lin, B.; Jia, Z. Does the different sectoral coverage matter? An analysis of China’s carbon trading market. Energy Policy 2020, 137, 111164. [Google Scholar] [CrossRef]
  36. Zhang, Z. China’s carbon market: Development, evaluation, coordination of local and national carbon markets, and common prosperity. J. Clim. Financ. 2022, 1, 100001. [Google Scholar] [CrossRef]
  37. IEA. CO2 Emissions in 2022; IEA: Paris, France, 2023; Available online: https://www.iea.org/reports/co2-emissions-in-2022 (accessed on 15 October 2024).
  38. Slater, H.; Shu, W.; Li, R. China Carbon Pricing Survey; ICF: Beijing, China, 2022. [Google Scholar]
  39. Insights, S.P.G.C. Commodities 2024: China’s Domestic Carbon Market set for Revamp; Article 6 in Limbo. 2024. Available online: https://www.spglobal.com (accessed on 15 October 2024).
  40. Chew, Y.E.; Gan, Z.W.; Heng, H.; Nair, P.N.S.B.; Tan, R.R.; Foo, D.C. Carbon emissions pinch analysis (CEPA) for emissions reduction and energy planning in Canada. Clean Technol. Environ. Policy 2023, 25, 2413–2431. [Google Scholar] [CrossRef]
  41. Gans, W.; Hintermann, B. Market effects of voluntary climate action by firms: Evidence from the Chicago Climate Exchange. Environ. Resour. Econ. 2013, 55, 291–308. [Google Scholar] [CrossRef]
  42. Martinez-Alier, J.; Temper, L.; Del Bene, D.; Scheidel, A. Is there a global environmental justice movement? J. Peasant. Stud. 2016, 43, 731–755. [Google Scholar] [CrossRef]
  43. Sabbaghi, O.; Sabbaghi, N. Carbon financial instruments, thin trading, and volatility: Evidence from the Chicago climate exchange. Q. Rev. Econ. Financ. 2011, 51, 399–407. [Google Scholar] [CrossRef]
  44. Vaillancourt, K.; Bahn, O.; Sigvaldason, O. The Canadian contribution to limiting global warming below 2 °C: An analysis of technological options and regional cooperation. In Limiting Global Warming to Well Below 2 °C: Energy System Modelling and Policy Development; Springer: Cham, Switzerland, 2018; pp. 227–244. [Google Scholar]
  45. Parry, I.W.; Mylonas, V. Canada’s carbon price floor. Natl. Tax J. 2017, 70, 879–900. [Google Scholar] [CrossRef]
  46. Government of Canada. Canada’s Preliminary Greenhouse Gas Emissions (1990–2023). 2025. Available online: https://www.canada.ca/en/environment-climate-change/services/climate-change/greenhouse-gas-emissions/inventory/preliminary-emissions-1990-2023.html (accessed on 15 October 2024).
  47. Zaman, S.; Howlett, M.; Migone, A. Regulating the wild west? Management consulting reform in Canadian government. Can. Public Adm. 2023, 66, 455–477. [Google Scholar] [CrossRef]
  48. Teague, F. Transitions to Belonging: Evaluating the Impacts of a Community-Based Physical Activity Program Through the Lens of Newcomer Youths’ Definitions of Mental Health. Master’s Thesis, Brock University, St. Catharines, ON, Canada, 2023. [Google Scholar]
  49. Böhringer, C.; Bye, B.; Fæhn, T.; Rosendahl, K.E. Output-based rebating of carbon taxes in a neighbour’s backyard: Competitiveness, leakage and welfare. Can. J. Econ. 2017, 50, 426–455. [Google Scholar] [CrossRef]
  50. Safton, R. Modeling Policy Pathways to Carbon Neutrality in Canada. Ph.D. Thesis, Simon Fraser University, Burnaby, BC, Canada, 2021. [Google Scholar]
  51. Pham, H.; Nguyen, V.; Ramiah, V.; Mudalige, P.; Moosa, I. The effects of environmental regulation on the Singapore stock market. J. Risk Financ. Manag. 2019, 12, 175. [Google Scholar] [CrossRef]
  52. NCCS. Carbon Tax. 2019. Available online: https://www.nccs.gov.sg/singapores-climate-action/mitigation-efforts/carbontax/ (accessed on 15 October 2024).
  53. Tseng, S. Appraising Singapore’s Carbon Tax Through the Lens of Sustainability; National University of Singapore: Singapore, 2022. [Google Scholar]
  54. David, D.; Yoshino, M.; Varun, J.P. Developing FinTech ecosystems for voluntary carbon markets through nature-based solutions: Opportunities and barriers in ASEAN. In Green Digital Finance and Sustainable Development Goals; Springer: Singapore, 2022; pp. 111–142. [Google Scholar]
  55. Gupta, P.; Muenkel, H. The Role of Financial Institutions and the Environment. In Peace with Nature: 50 Inspiring Essays on Nature and the Environment; World Scientific: Singapore, 2024; pp. 95–101. [Google Scholar]
  56. Woo, J. Gradations of organizational autonomy in Singapore: A comparison of the Monetary Authority of Singapore, Temasek Holdings, and the Development Bank of Singapore. Glob. Public Policy Gov. 2023, 3, 375–389. [Google Scholar] [CrossRef]
  57. CLIMATE WATCH Historical GHG Emissions. CO2 Emissions (Kt)—Singapore, 1990–2020; World Resources Institute: Washington, DC, USA, 2023; Available online: https://www.climatewatchdata.org/ghg-emissions (accessed on 15 October 2024).
  58. Macrotrends. European Union GDP per Capita 1960–2024. 2024. Available online: https://www.macrotrends.net (accessed on 15 October 2024).
  59. Macrotrends. China GDP per Capita 1960–2024. 2024. Available online: https://www.macrotrends.net (accessed on 15 October 2024).
  60. Macrotrends. Canada GDP per Capita 1960–2024. 2024. Available online: https://www.macrotrends.net (accessed on 15 October 2024).
  61. Macrotrends. Singapore GDP per Capita 1960–2024. 2024. Available online: https://www.macrotrends.net (accessed on 15 October 2024).
Figure 1. Comparison of carbon prices in the European Union (EU), China, Canada, and Singapore in 2023.
Atmosphere 16 00836 g001
Figure 2. Trends in CO2 prices (EUR/ton) and CO2 emissions (billion metric tons) for three markets and carbon price of Singapore without unavailability of emission data: (A) European Union (2005–2023), (B) China (2021–2023), (C) Canada (2019–2023) and (D) Singapore (2019–2023).
Atmosphere 16 00836 g002
Figure 3. Carbon dioxide price normalized by GDP per capita for the EU, China, Canada, and Singapore.
Atmosphere 16 00836 g003
Figure 4. (A) Carbon dioxide reduction targets (%) for each five-year phase (2026–2050) following a projected peak in emissions in 2030. (B) Corresponding penalty percentages are applied during each phase to incentivize emission reductions.
Atmosphere 16 00836 g004
Disclaimer/Publisher’s Note: The statements, opinions and data contained in all publications are solely those of the individual author(s) and contributor(s) and not of MDPI and/or the editor(s). MDPI and/or the editor(s) disclaim responsibility for any injury to people or property resulting from any ideas, methods, instructions or products referred to in the content.

