Article

N2O Production and Reduction in Chinese Paddy Soils: Linking Microbial Functional Genes with Soil Chemical Properties

1
Nanxun Innovation Institute, Zhejiang University of Water Resources and Electric Power, Hangzhou 310018, China
2
Institute of Rural Water Management, Zhejiang University of Water Resources and Electric Power, Hangzhou 310000, China
3
Key Laboratory for Technology in Rural Water Management of Zhejiang Province, Hangzhou 310000, China
4
Zhejiang Key Laboratory of River-Lake Water Network Health Restoration, Hangzhou 310000, China
5
China Institute of Water Resources and Hydropower Research, Beijing 100048, China
*
Author to whom correspondence should be addressed.
Atmosphere 2025, 16(7), 788; https://doi.org/10.3390/atmos16070788
Submission received: 4 June 2025 / Revised: 20 June 2025 / Accepted: 24 June 2025 / Published: 27 June 2025
(This article belongs to the Special Issue Gas Emissions from Soil)

Abstract

Nitrous oxide (N2O) emissions from paddy soils significantly contribute to global warming; however, the regulatory mechanisms of microbial denitrification remain poorly understood. This study investigated the biotic and abiotic drivers of N2O production and reduction across seven paddy soils spanning China’s major rice-growing regions, using integrated qPCR, incubation experiments, and multivariate analyses. Results demonstrated niche partitioning among denitrifying microorganisms. Pearson correlation analysis demonstrated significant positive correlations between potential N2O production rates and the abundances of denitrification genes (nirS, nirK, and fungal nirK), as well as between N2O reduction rates and nosZ gene abundances (both clade I and II). Key soil chemical properties, including pH, total carbon (TC), and NH4+-N content, showed significant relationships with both potential N2O production rates and reduction rates. Furthermore, random forest analysis identified nirS, fungal nirK, TC, and pH as key predictors of N2O production, while nosZ (clade I and II), TC, and pH governed N2O reduction. Structural equation modeling revealed that nirS-type bacteria predominantly drove N2O production, whereas nosZ II-encoded microorganisms primarily mediated N2O reduction. Moreover, TC exhibited direct positive effects on both processes, while pH indirectly influenced N2O production by regulating nirS abundance and affected reduction via nosZ Ⅱ modulation. These findings provide a mechanistic framework for mitigating agricultural denitrification-derived N2O emissions through a targeted management of soil carbon and pH conditions to optimize complete denitrification.

1. Introduction

Nitrous oxide (N2O) is a potent greenhouse gas with a global warming potential 298 times that of CO2 over a 100-year timescale and contributes to stratospheric ozone depletion [1]. Agricultural soils, particularly paddy fields, account for approximately 60% of global anthropogenic N2O emissions [2]. Therefore, understanding and controlling N2O emissions in agricultural soil is crucial for mitigating climate change.
The denitrification pathway involves the stepwise reduction of nitrate (NO3) to dinitrogen (N2) via nitrite (NO2), nitric oxide (NO), and N2O as intermediates. This process is mediated by microorganisms carrying functionally distinct genes [3,4], including those encoding nitrite reductases (nirK and nirS) and nitrous oxide reductase (nosZ) [5]. The reduction of NO2 to NO is catalyzed by either a copper-dependent (nirK-encoded) or a heme-dependent (nirS-encoded) nitrite reductase [6,7]. Although these genes exhibit environmental preferences, current understanding remains contradictory [8,9]. While nirS-type denitrifiers typically dominate in neutral-alkaline soils (pH 6.5–8.0), nirK-types prevail in acidic conditions (pH < 6.0) [6]. However, exceptions frequently occur due to microbial adaptation and local soil heterogeneity [10,11,12]. Carbon and nitrogen availability differentially regulate these communities, with organic matter frequently favoring nirK-types [13], while long-term nitrogen fertilization tends to enrich nirS- and nosZ-harboring populations, altering N2O emissions [14].
The terminal step of denitrification, the reduction of N2O to N2, represents the only known biological sink for N2O in agricultural systems [15]. This critical process is catalyzed by nitrous oxide reductase, encoded by two phylogenetically distinct nosZ clades (nosZ I and nosZ II) [16]. Recent studies reveal that fungi and approximately 30% of denitrifiers lack nosZ genes entirely, while the two clades appear to occupy different ecological niches [17]. Substantial uncertainties remain regarding their environmental regulation, as soil management factors (e.g., pH adjustment, tillage practices, and fertilization) influence nosZ clade abundance and activity, yet reported effects are inconsistent across studies [18,19]. Notably, emerging evidence suggests that nosZ II-harboring microorganisms may play a more significant role in N2O reduction than previously recognized, particularly in acidic soils, challenging the traditional paradigm of nosZ I dominance [18].
These knowledge gaps are particularly pronounced in paddy ecosystems, where the complex interplay between flooding regimes, soil properties, and microbial communities creates unique but poorly understood denitrification dynamics. To address these limitations, we conducted a comprehensive investigation across seven representative paddy soils spanning China’s major rice-growing regions (24–42° N). This study employs an integrated approach combining qPCR, incubation experiments, and multivariate analysis to (1) quantify variations in potential N2O production rates and N2O reduction rates; (2) identify key abiotic and biotic drivers of denitrification partitioning; and (3) evaluate the relative importance of the direct versus indirect effects of environmental factors on denitrification outcomes. The findings will provide a mechanistic framework for developing targeted N2O mitigation strategies tailored to different paddy soil ecosystems.

2. Materials and Methods

2.1. Soil Sampling

During November and December 2023, we collected soil samples from typical paddy fields with a range of 50 × 50 m2 at seven sites across China (24.84° N–41.83° N, 102.86° E–119.23° E, Figure 1). From each site, five subsamples were taken from the top 20 cm of soil, thoroughly mixed, and divided into three replicates. Soils were stored in aseptic plastic bags on ice and immediately transported to the laboratory, sieved through a 2-mm mesh, and stored at 4 °C for physicochemical analysis and incubation or at −80 °C for DNA extraction.

2.2. Soil Chemical Properties Analysis

Soil pH was measured in a 1:5 (w/v) soil-to-water suspension using a calibrated pH meter (Seven Compact S210, Mettler-Toledo, Greifensee, Switzerland). Ammonium (NH4+-N) and nitrate (NO3-N) were extracted with 2 M KCl (1:10 soil-to-solution ratio) and quantified via flow injection analyzer (SAN++, Skalar, Breda, The Netherlands) [20]. Dissolved organic carbon (DOC) and nitrogen (DON) were extracted with 0.5 M K2SO4 and measured using a TOC analyzer (Multi N/C 3100, Analytik Jena, Jena, Germany) [21]. Total carbon (TC) and nitrogen (TN) were determined by high-temperature oxidation methodology using an elemental analyzer (Elementar Analysensysteme GmbH, Langenselbold, Germany) [22]. Available phosphorus (AP) was extracted with 0.5 M NaHCO3 and analyzed via the molybdenum blue method [23].

2.3. DNA Extraction and Quantitative PCR

Total genomic DNA was extracted from 0.5 g of soil using the FastDNA SPIN Kit for Soil (MP Biomedicals, LLC, Solon, OH, USA) [22]. DNA purity and concentration were verified spectrophotometrically (NanoDrop 2000, Thermo Fisher Scientific, Waltham, MA, USA) [22], with A260/A280 ratios maintained between 1.8 and 2.0. Quantitative PCR (qPCR) was performed on a LightCycler® 480II (Roche, Penzberg, Germany) to quantify bacterial (16s rRNA), fungal (ITS), and denitrification-related gene (nirS, nirK, nosZI, nosZII) abundance. Primers and cycling conditions are listed in Table 1. All amplification efficiencies were 94–101%, and R2 values of 0.993–0.999.

2.4. Measurement of Potential N2O Production Rate and N2O Reduction Rate

Prior to analysis, 30 g of air-dried, 2-mm sieved soil for each sample was pre-incubated in 120 mL serum bottles at 25 °C in the dark for 5 days at 50% water-filled pore space (WFPS) to stabilize microbial activity. Following this stabilization period, the potential N2O production rate and denitrification rate were determined using a modified acetylene inhibition technique with some modifications [31]. The N2O reduction rate is the difference between the potential N2O production rate and the denitrification rate.
Six parallel bottles were prepared for each sample. All bottles were sealed and purged by evacuating the air and filling with Ar. Three of them were used to measure the potential N2O production rate. Acetylene (a specific inhibitor of the N2O reductase) was added to the other three bottles to reach 0.1 atm partial pressure to measure the potential denitrification rate. Subsequently, all six bottles for each sample were amended with substrates (0.2 mg N g−1 soil as NaNO3; 2 mg C g−1 soil as glucose), and adjusted moisture to 100% (w/w) [31,32]. Then, bottles were purged with Ar after 20 min shaking (180 rpm, 25 °C).
For potential N2O production rate measurements, three bottles were incubated without acetylene. For denitrification rate determination, parallel triplicate cultures received 10% C2H2 (v/v, 0.1 atm partial pressure) to inhibit N2O reductase [33]. All bottles were incubated for 4 h at 25 °C at 180 rpm. Headspace gas (10 mL) was sampled at 0.5 h, 1 h, 2 h, and 4 h intervals using gas-tight syringes, with N2O concentrations quantified by gas chromatograph (GC-2010 Plus, Shimadzu, Japan) equipped with an electron capture detector. The potential N2O production rate and denitrification rate were calculated by Equation (1)
F = ρ V d C d t 273 273 + T / W
where F is potential N2O production rate or denitrification rate (mg kg−1 h−1), ρ is the density of N2O at standard conditions (mg mL−1), V is the serum bottle volume (mL), W is the soil weight (kg), T is the air temperature (°C), dC/dt is the variation of N2O (ppb h−1).

2.5. Statistical Analysis

One-way analysis of variance (ANOVA) was performed in SPSS (IBM SPSS version 24, SPSS Inc., Chicago, IL, USA) [20] to test the difference in soil chemical properties, microbial abundances, potential N2O production, and reduction rates among different soils by the least significant difference (LSD) test at a 0.05 p-level. Principal component analysis (PCA) visualized the dissimilarities of microbial gene abundances and soil chemical properties using Origin (Origin 2023, OL, USA) [23]. Pearson correlation analysis was performed to correlate soil chemical properties and microbial gene abundances by the “ggcoorplot” package in R (Version 4.0.2). Random forest was performed using the “RandomForest” package in R to identify key predictors of N2O production and reduction among multiple parameters, including soil chemical properties and microbial gene abundances. Structural equation modeling (SEM) was conducted by SPSS Amos (SPSS Amos IBM, version 24.0, USA) [22] to evaluate the direct or indirect effect of factors on denitrification-derived N2O dynamics.

3. Results

3.1. Soil Chemical Properties

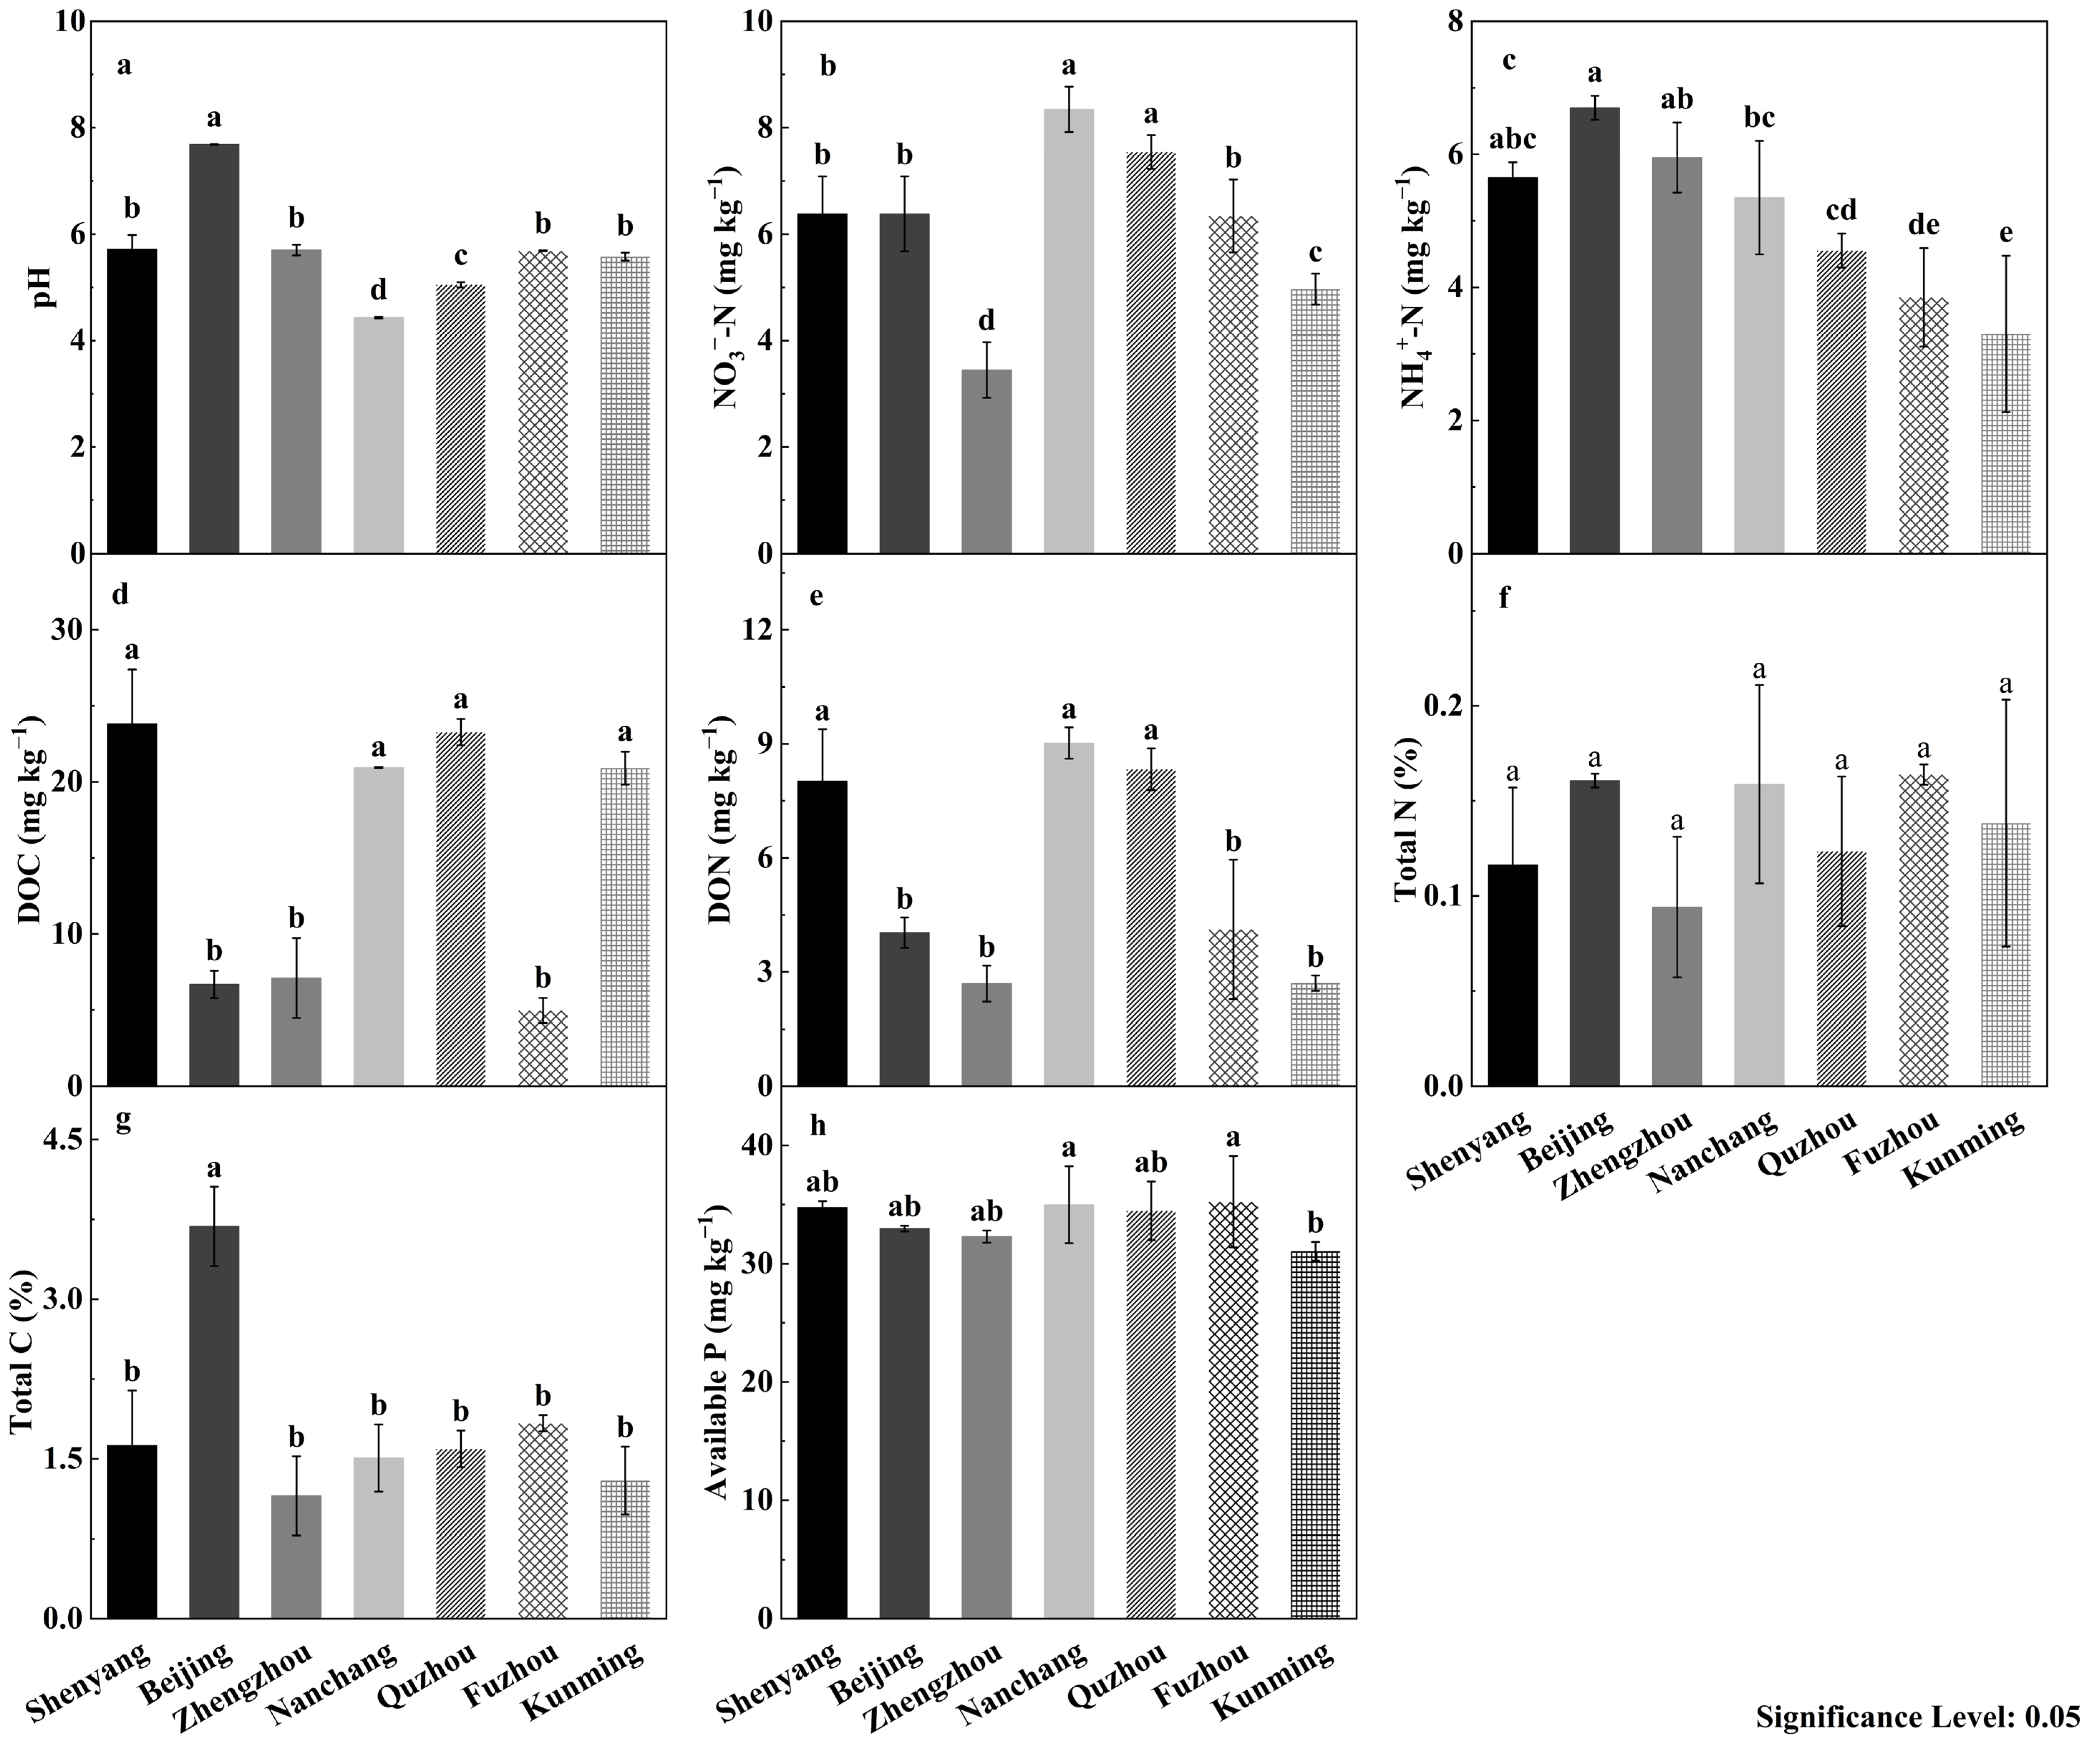
Soil chemical properties exhibited significant variation (Figure 2). pH ranges from 4.4 (Nanchang, lowest) to 7.6 (Beijing, highest). Nitrogen showed distinct patterns; NO3-N content varied between 3.4 mg kg−1 (Zhengzhou) and 8.3 mg kg−1 (Nanchang); NH4+-N levels spanned 3.3 mg kg−1 (Kunming) to 6.7 mg kg−1 (Beijing); Total nitrogen (TN) ranged from 0.09% to 0.16%, with Fuzhou significantly higher than other sites. Dissolved organic nitrogen (DON) varied between 2.6 mg kg−1 (Zhengzhou) and 9.0 mg kg−1 (Nanchang). Dissolved organic carbon (DOC) ranged from 4.9 mg kg−1 (Fuzhou) to 23.8 mg kg−1 (Shenyang). Total carbon (TC) peaked in Beijing (3.6%) and reached its minimum in Zhengzhou (1.1%). Available phosphorus (AP) showed limited spatial variation, maintaining consistent levels across regions (31.0–35.2 mg kg−1).

3.2. Microbial Gene Abundance

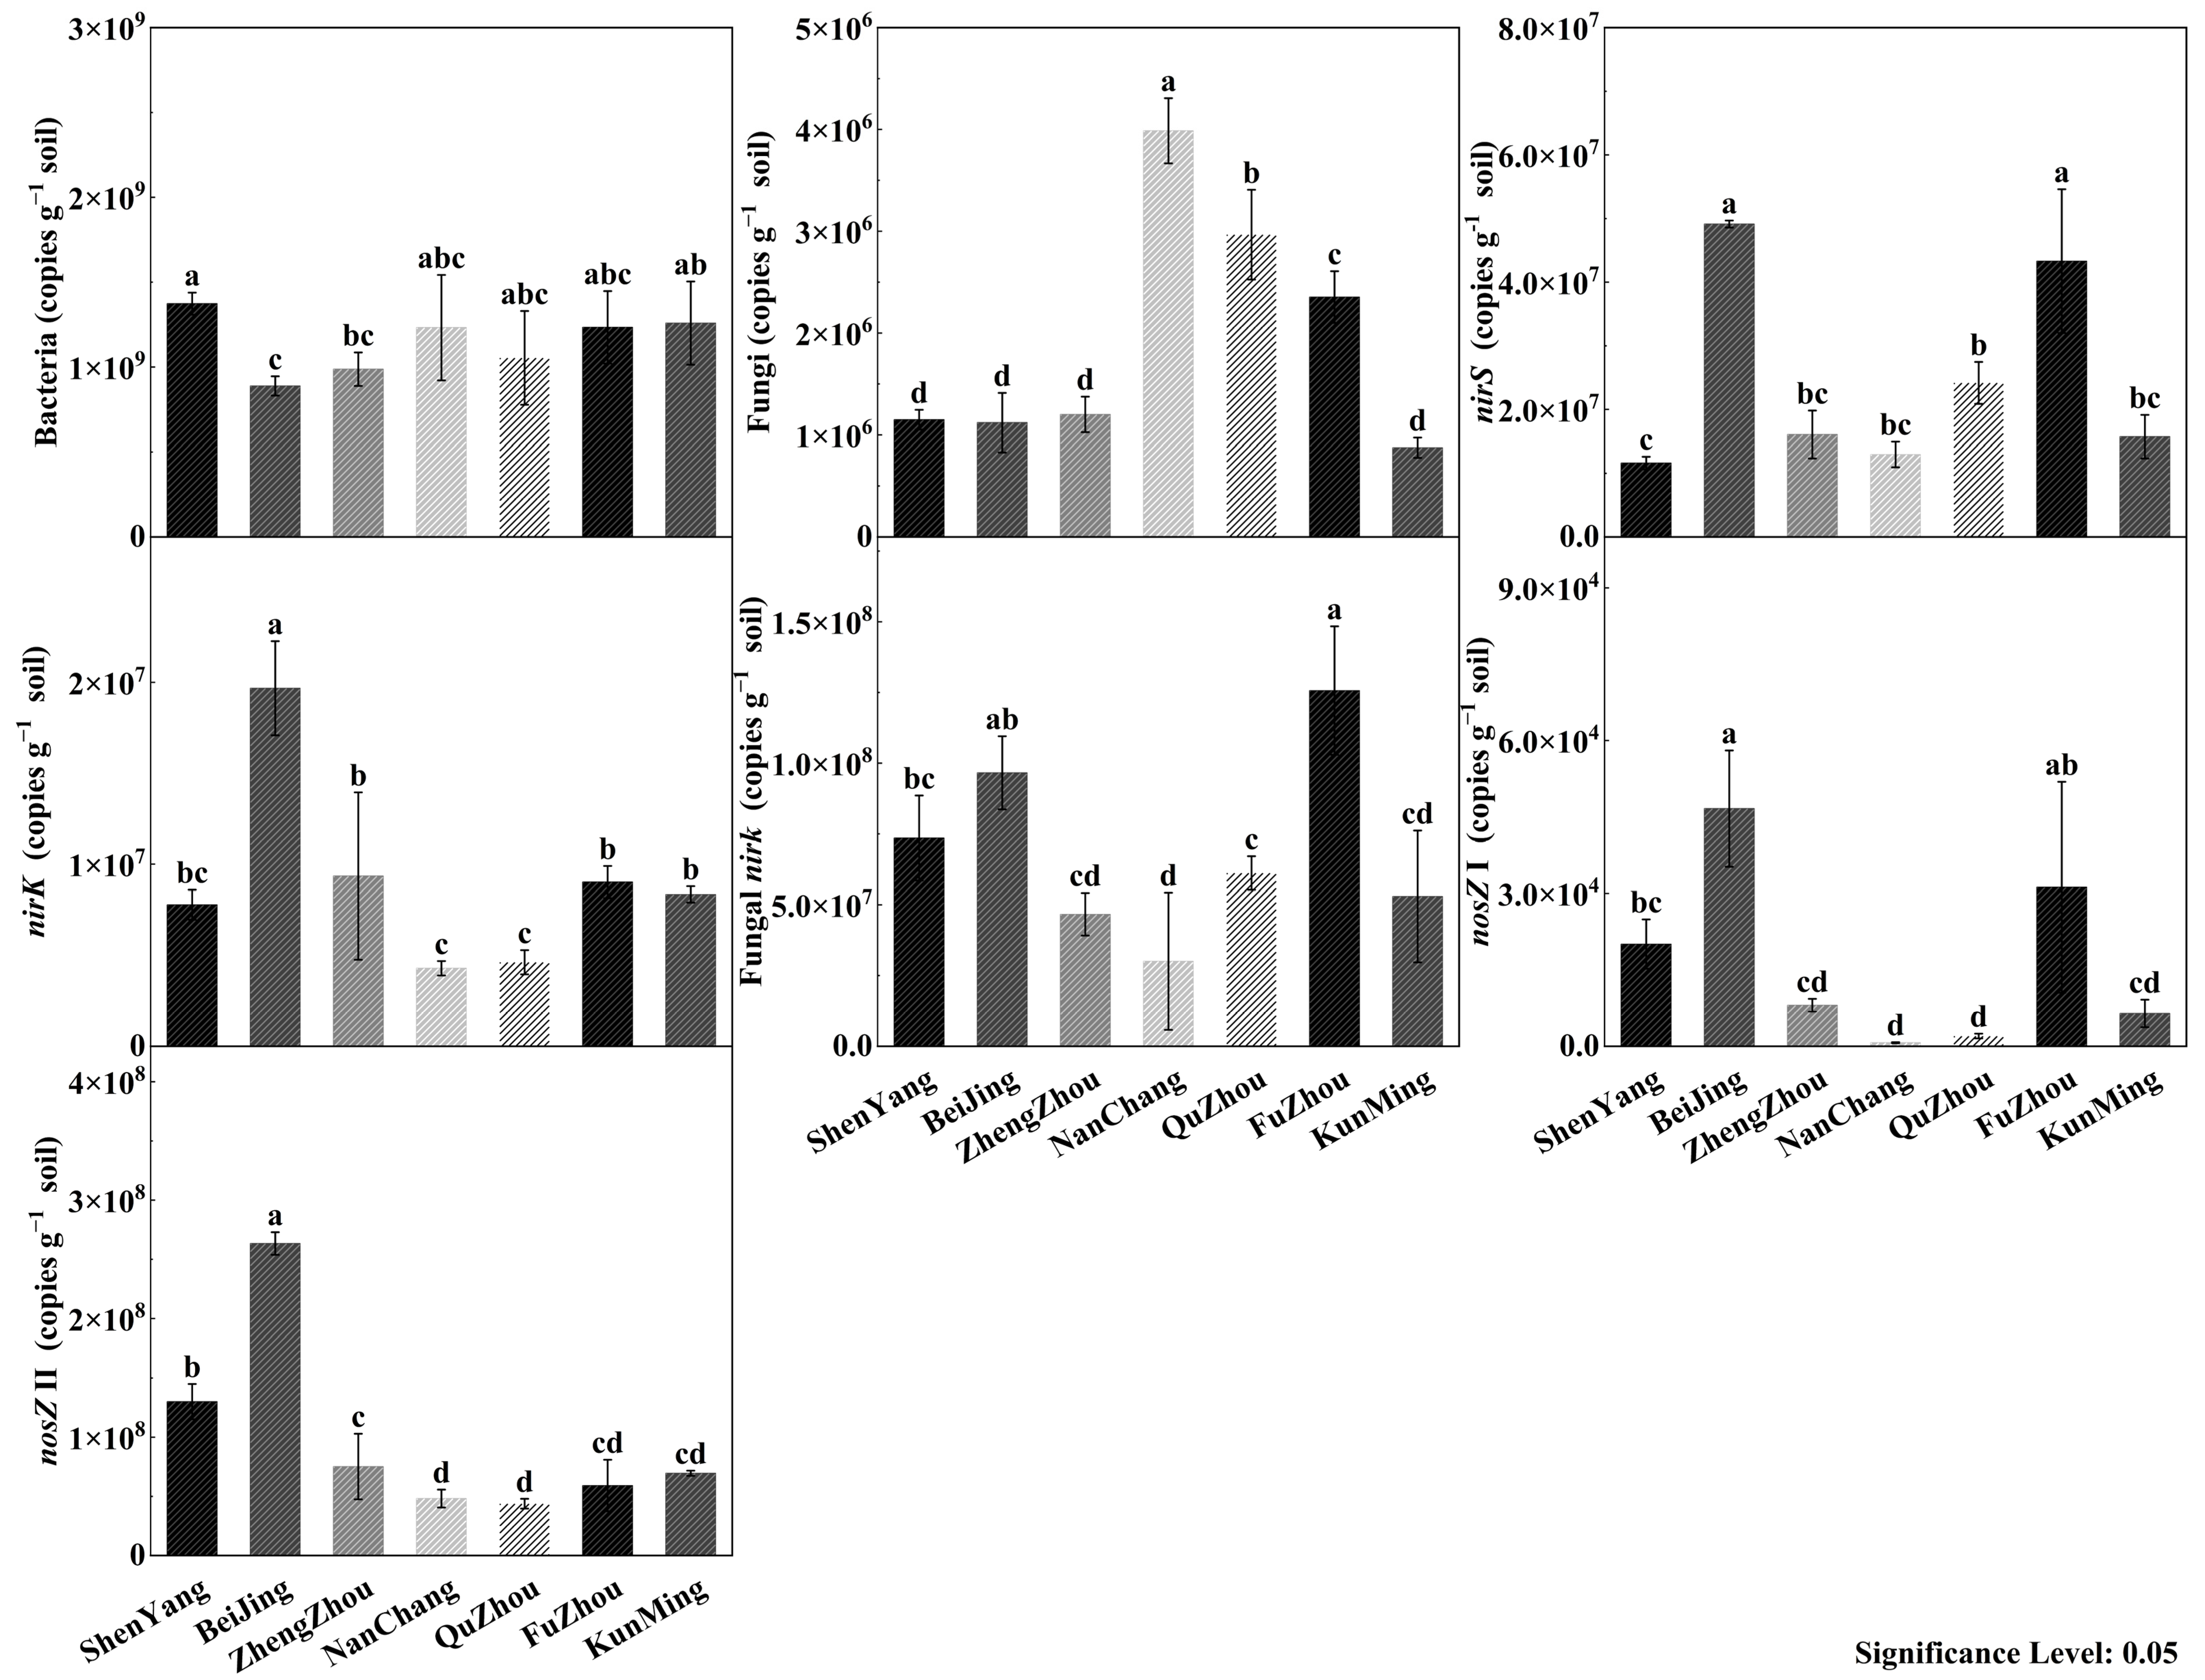
Microbial gene abundance exhibited significant variations across soils (Figure 3). Bacterial abundance (16s rRNA gene copies, Figure 3) ranged from 8.9 × 10⁸ copies g−1 (Beijing) to 1.4 × 10⁹ copies g−1 (Shenyang). Fungal abundance (fungal ITS copies, Figure 3 varied greatly, with Nanchang exhibiting the highest (3.9 × 10⁶ copies g−1) and Kunming the lowest (8.7 × 10⁵ copies g−1). For nitrite reductase genes, Beijing dominated in nirK (1.9 × 10⁷ copies g−1) and fungal nirK (4.6 × 10⁴ copies g−1), while Fuzhou showed preference for nirS (5.7 × 10⁷ copies g−1). Regarding nitrous oxide reductase genes, Fuzhou exhibited peak nosZ I abundance (1.3 × 10⁸ copies g−1) while Nanchang had the lowest (3.0 × 10⁷ copies g−1). Beijing showed the highest nosZ II abundance (2.6 × 10⁸ copies g−1), contrasting with Quzhou, which had the lowest (4.4 × 10⁷ copies g−1).

3.3. Potential N2O Production Rate and N2O Reduction Rate

Beijing demonstrated the highest potential N2O production rate (470 mg kg−1 h−1) and N2O reduction rate (447 mg kg−1 h−1) among the soils (Figure 4). In contrast, Zhengzhou, Nanchang, Quzhou, and Kunming exhibited relatively low potential N2O production rate (57–90 mg kg−1 h−1) and reduction rate (1–7 mg kg−1 h−1). Notably, Fuzhou exhibited both a high potential N2O production rate (191 mg kg−1 h−1) and reduction rate (107 mg kg−1 h−1).

3.4. Principal Component Analysis

Principal Component Analysis (PCA) revealed distinct patterns in microbial gene abundance (Figure 5a) and soil chemical properties (Figure 5b) across the studied soils. The first two principal components explained 55.3% (PC1) and 18.4% (PC2) of the total variance in microbial gene abundance data. Denitrification-related microbial groups, including nirS, nirK, fungal nirK, nosZ I, and nosZ II, exhibited strong loading along PC1, suggesting their dominant role in shaping microbial structure.
For soil chemical properties, PC1 (37.8% variance explained) was strongly associated with variables including TC, pH, and DOC, collectively highlighting gradients in soil nutrient availability and chemical characteristics.

3.5. Correlation and Random Forest Analysis

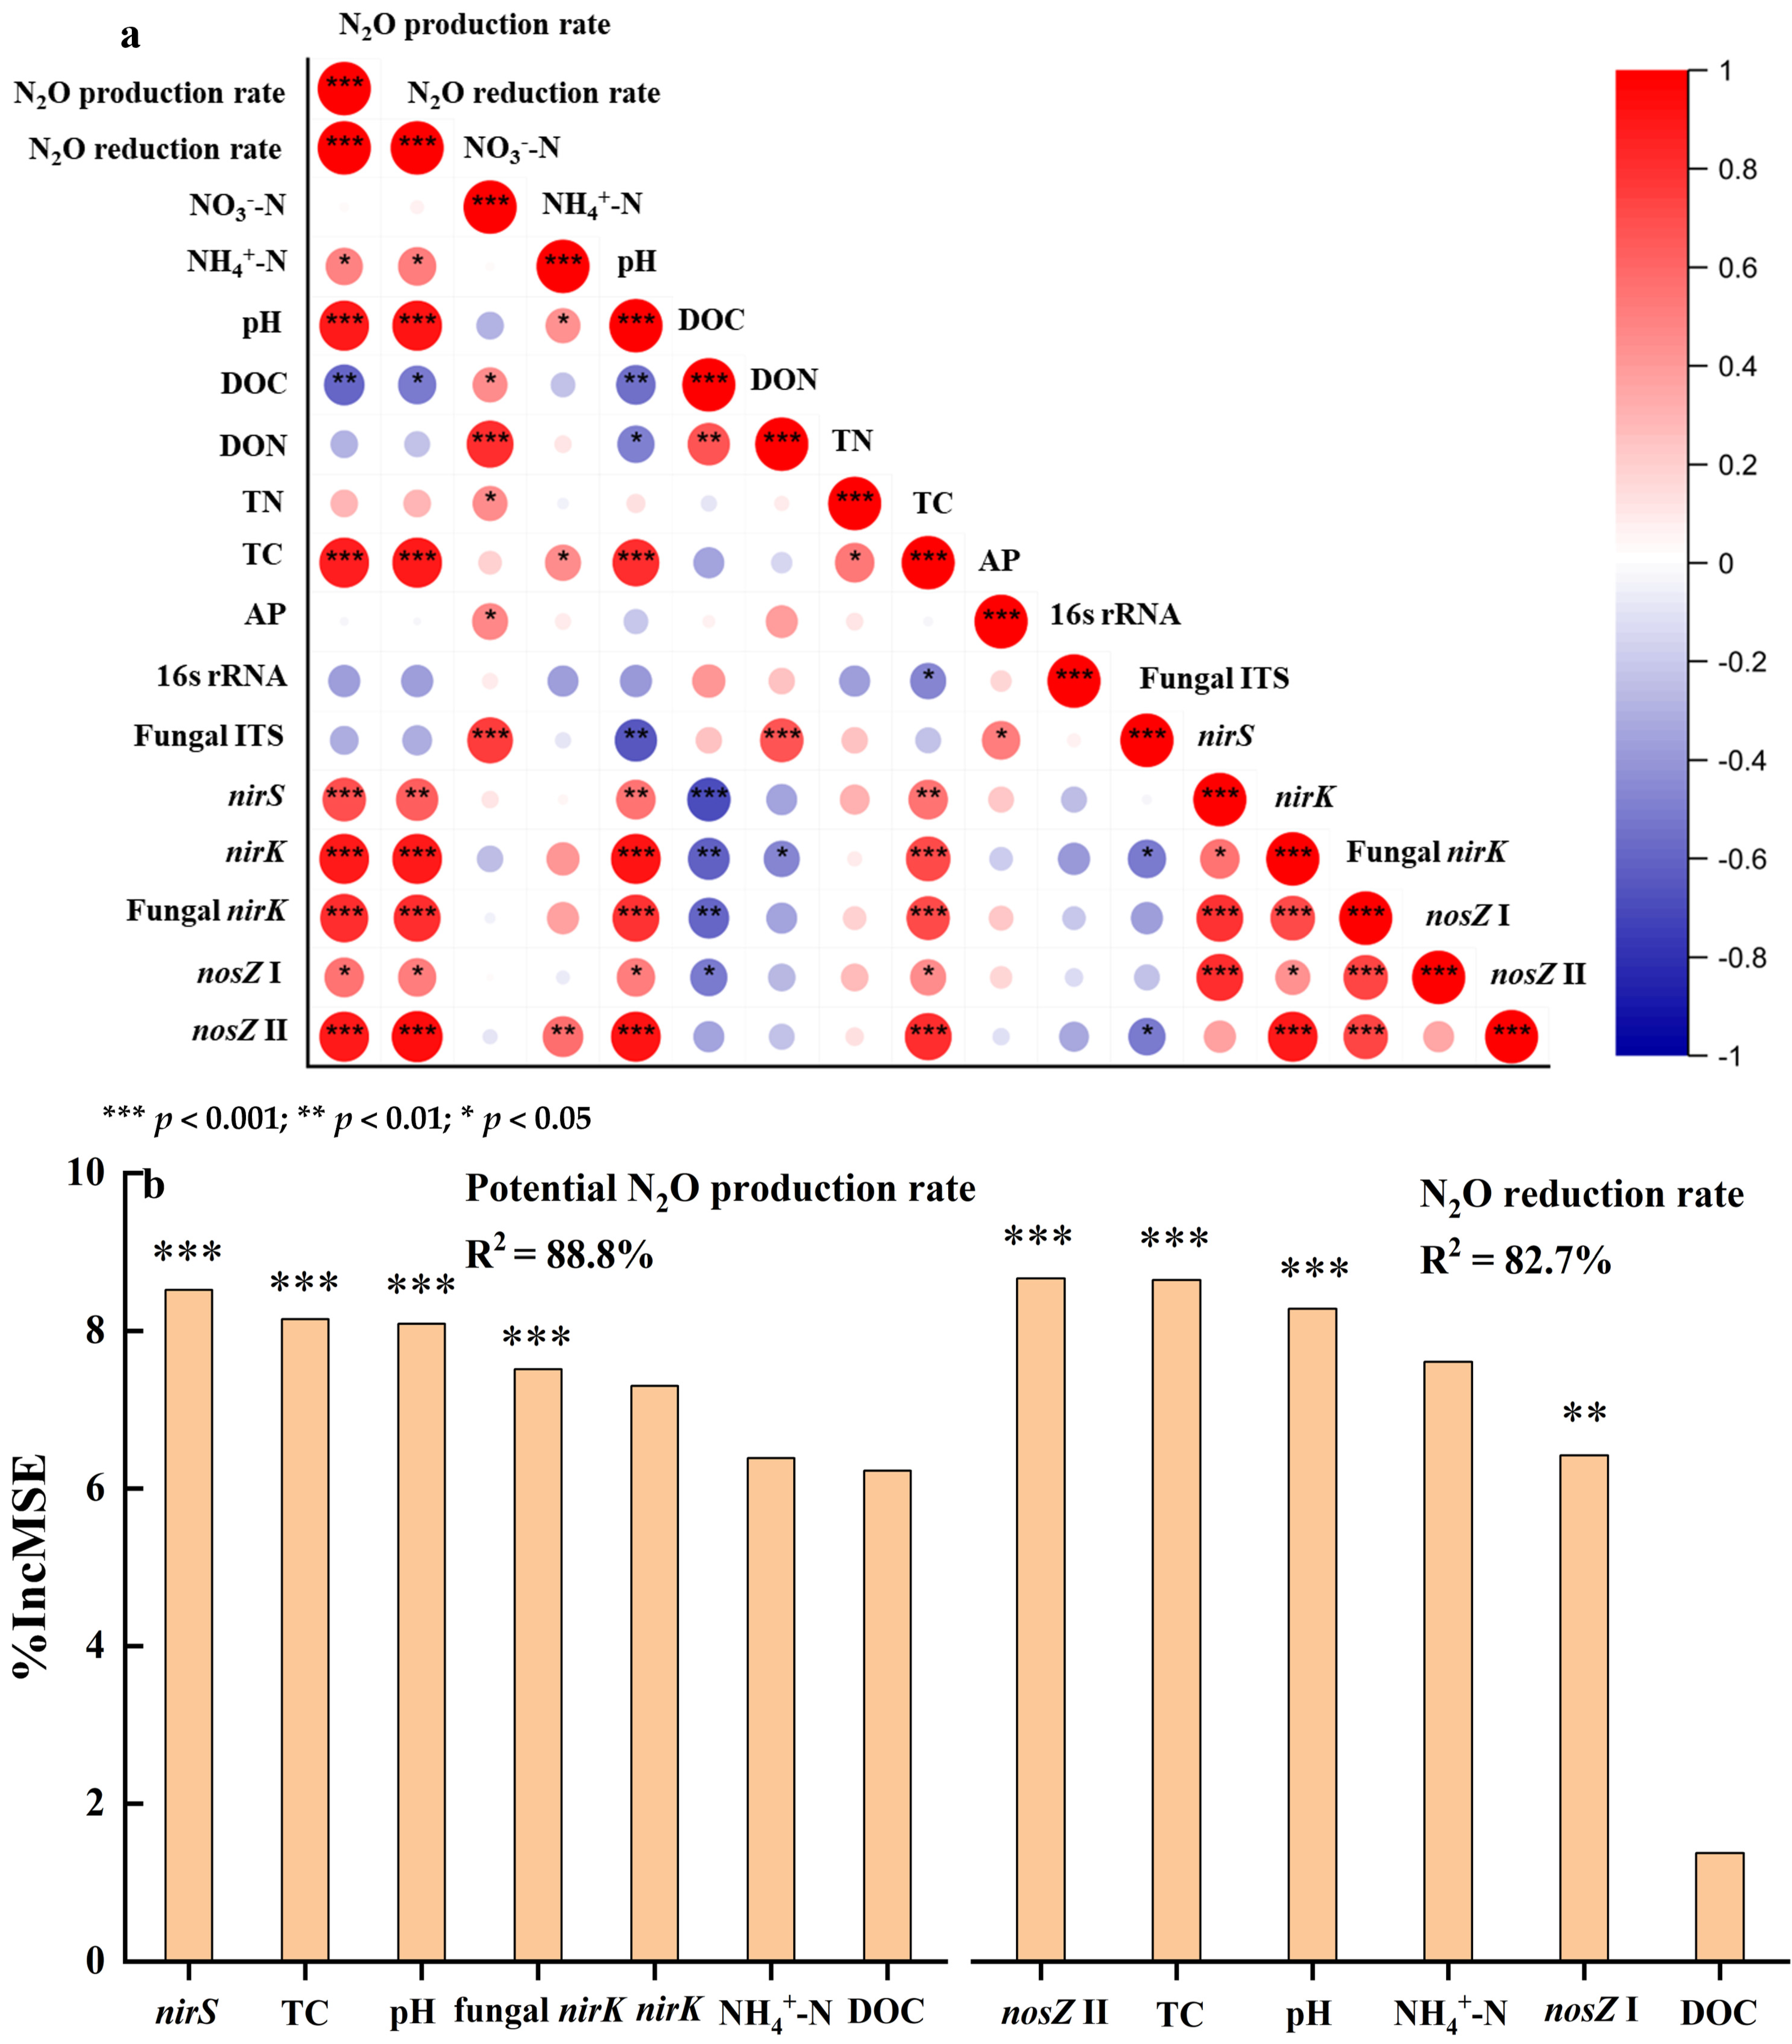
Pearson correlation analysis demonstrated significant (p < 0.001) positive correlations between potential N2O production rates and the abundances of N2O production-related genes, which include nirS, nirK, and fungal nirK (Figure 6a). N2O reduction rates were significantly correlated with nosZ gene abundances (both clade I and II). Significant positive correlations were observed between potential N2O production rates, N2O reduction rates, and specific soil chemical properties, including TC, pH, and NH4+-N. The abundance of N2O production-related genes (nirS, nirK, and fungal nirK) was significantly correlated with TC and pH, whereas nosZ gene abundances were significantly correlated with pH, TC, and NH4+-N.
Random forest analysis confirmed the differential controls on N2O production and reduction (Figure 6b). For N2O production, nirS, fungal nirK, TC, and pH were identified as the most critical predictors. N2O reduction was primarily governed by the nitrous oxide reductase genes nosZ II and nosZ I, as well as TC and pH.

3.6. Structural Equation Modeling

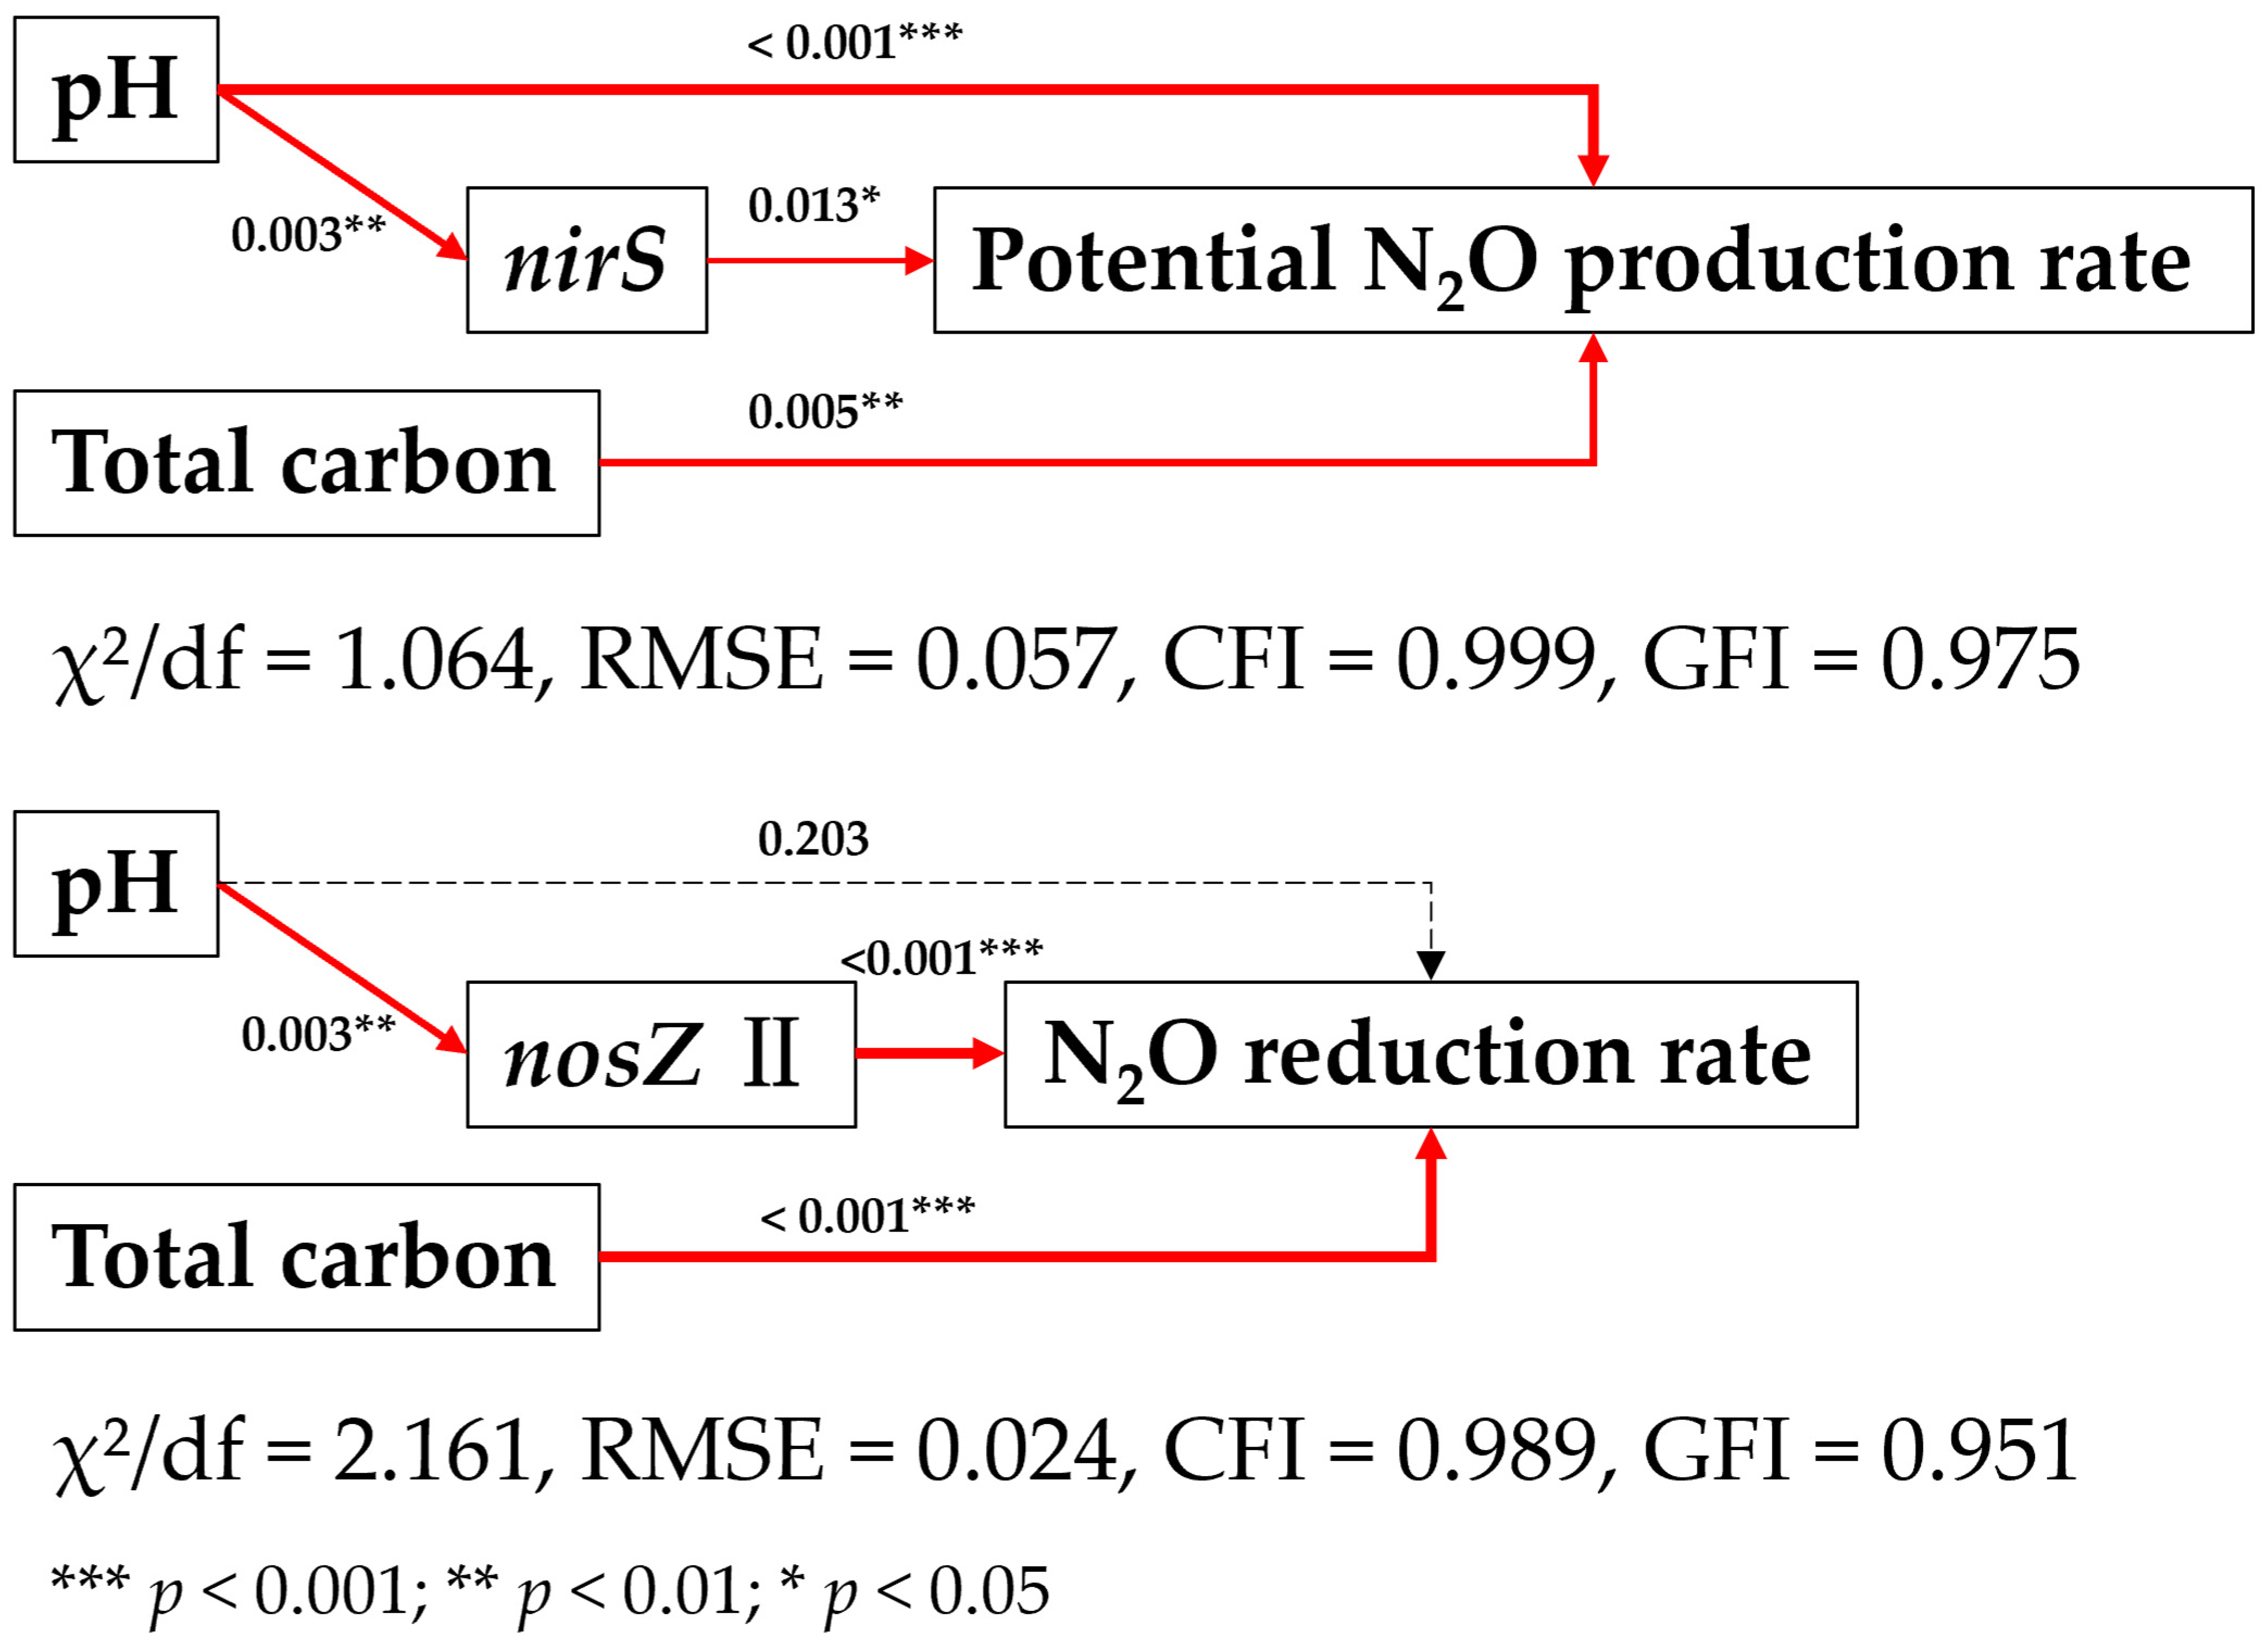
Structural equation modeling (SEM) revealed distinct pathways through which abiotic and biotic factors regulate potential N2O production rate and N2O reduction rate (Figure 7). The model showed excellent fit indices for both potential N2O production rate (χ2/df = 1.064, RMSE = 0.057, CFI = 0.999, GFI = 0.975) and N2O reduction rate (χ2/df = 2.161, RMSE = 0.024, CFI = 0.989, GFI = 0.951).
For the potential N2O production rate, both total carbon (TC, p = 0.005) and pH (p < 0.001) showed significant positive direct effects. Among biotic factors, nirS gene abundance directly promoted N2O production (p = 0.013). pH additionally showed indirect effects on N2O production through its positive influence on nirS abundance.
Total carbon demonstrated a significant positive direct effect on N2O reduction (p < 0.001), while the nosZ II gene abundance also directly promoted N2O reduction (p < 0.001). pH indirectly enhanced N2O reduction by positively influencing nosZ II abundance (p = 0.003).

4. Discussion

4.1. Biotic and Abiotic Factors Influencing Denitrification-Derived N2O Production

Our study reveals intricate interactions between soil chemical properties and microbial functional genes in regulating denitrification-derived N2O production across Chinese paddy soils. Although nirS, nirK, and fungal nirK were all significantly correlated with potential N2O production rates, both random forest analysis and structural equation modeling confirmed the dominant role of nirS in driving N2O production. Notably, sites with higher N2O production (e.g., Beijing and Fuzhou) also exhibit higher nirS abundance, while patterns of nirK were inconsistent. These findings align with previous research suggesting that nirS-type denitrifiers are the primary contributors to N2O production in agricultural soils [34]. For instance, Lee et al. (2017) quantitatively analyzed the spatial distribution of nirK and nirS along environmental gradients and based on gene expression profiles, proposed that nirS-type enzymes generally have a lower Km and stronger substrate affinity, which may lead to increased N2O accumulation [35]. Furthermore, nirS abundance showed a significant correlation with soil pH, consistent with earlier studies. Structural equation modeling demonstrated both direct and indirect pH-mediated effects on potential N2O production. While Song et al. (2020) [36] found that higher soil pH promotes nirS gene abundance and that nirK tends to dominate in acidic conditions, our study observed unexpectedly low nirK abundance in acidic soils from Nanchang and Quzhou (pH 4.4–5.0). This finding contrasts with the conventional view and mirrors observations from Northeast China’s black soil belt, where multiple environmental factors—beyond pH—shape the biogeographical distribution of nirS and nirK denitrifiers [37].
In addition to pH, total carbon (TC) emerged as a key abiotic driver of N2O production. Our findings support the carbon modulation hypothesis, which posits that organic matter availability regulates denitrification enzyme synthesis [38]. This carbon effect operates through direct impacts on denitrification enzyme activity, as demonstrated by studies showing that increased TC content can enhance denitrifying enzyme activity and alter N2O emissions [38,39].
Notably, both correlation and random forest analysis identified fungal nirK as having a significant impact on N2O production, highlighting the underappreciated role of fungal denitrifiers in paddy soil emissions. This is in line with the recent findings by Wei et al. (2024) [40]. However, structural equation modeling revealed that nirS-harboring bacteria exerted the most direct influence on N2O production. This apparent discrepancy suggests that while fungal denitrifiers contribute substantially to overall N2O emissions, bacterial denitrification remains the dominant pathway in these systems.

4.2. Biotic and Abiotic Factors Influencing N2O Reduction

Our study provides new insights into the regulation of N2O reduction in paddy soils by integrating microbial functional gene data with key soil chemical properties. While earlier studies proposed functional redundancy between nosZ clades I and II in agricultural ecosystems [41,42], our analyses (Figure 6 and Figure 7) revealed that nosZ II plays a predominant role in N2O reduction. This aligns with recent spatial-phylogenetic evidence indicating ecological niche partitioning between the two clades [43]. Interestingly, our findings contrast with earlier reports that emphasized stronger correlations between nosZ I and N2O reduction [44], highlighting the importance of local soil conditions in shaping denitrification dynamics.
Among these conditions, pH was found to play a central role in regulating nosZ II. Our findings support observations by Shaaban et al. (2023) [45], who reported similar trends in acidic soils, and further extend these results across a broader pH range (4.4–7.6). Low pH generally inhibits nosZ gene expression and suppresses the activity of nosZ-harboring microbes [46]. Multiple studies have shown that increasing soil pH can reduce N2O emissions by enhancing the nosZ gene abundance and expression [47]. For instance, dolomite application in rice-rapeseed rotation soils (pH 5.44) significantly increased pH and decreased N2O emissions while boosting nosZ transcript levels [47]. Notably, nosZ I appears more sensitive to acidification than nosZ II, which shows greater pH adaptability [46]. Therefore, pH changes may shift the relative abundance of these two clades, thereby altering the balance of N2O reduction pathways.
Total carbon (TC) was also identified as a critical driver of N2O reduction. Structural equation modeling revealed a strong direct effect of TC, supporting the carbon limitation theory proposed by Domeignoz-Horta et al. (2020) [48]. Carbon availability is essential for providing the energy and electrons needed for complete denitrification. When carbon is limited, the process may be hindered, resulting in N2O accumulation rather than complete reduction to N2 [49]. These findings underscore TC’s central role in modulating N2O reduction capacity in paddy soils.

5. Conclusions

This study elucidates the complex regulation of N2O dynamics in Chinese paddy soils through an integrated analysis of microorganisms and soil chemical properties. Results demonstrate that niche partitioning governs denitrification processes, with nirS predominantly driving N2O production while nosZ II mediates N2O reduction. Total carbon content directly modulates both N2O production and reduction, while pH influences N2O production both directly and indirectly through nirS abundance regulation, and indirectly affects N2O reduction via nosZ II modulation. These mechanistic insights enable targeted N2O mitigation strategies through optimized carbon and pH management in rice cultivation systems.

Supplementary Materials

The following supporting information can be downloaded at: https://www.mdpi.com/article/10.3390/atmos16070788/s1, Figure S1: Denitrification rates in soils from Shenyang, Beijing, Zhengzhou, Nanchang, Quzhou, Fuzhou and Kunming. Soils were incubated with 10% (v/v) acetylene to measure denitrification rates. Vertical bars present standard deviations of the mean (n = 3). Different lowercase letters above bars denote significant differences (p < 0.05). Figure S2. Linear correlations between potential N2O production rates and nirS and nirK gene abundances. Significant positive relationships were observed for both nirS (r = 0.89, *** p < 0.001) and nirK (r = 0.82, *** p < 0.001) gene copies per gram dry soil.

Author Contributions

Conceptualization, C.M. and Y.D.; data curation, D.Q.; formal analysis, W.S. and K.Y.; funding acquisition, C.M., K.Y., and W.W.; investigation, Y.Z., R.C., and C.X.; methodology, C.M.; resources, C.X. and Y.D.; software, W.W.; supervision, Y.D.; Validation, C.M., A.J., Y.G., and X.Y.; visualization, C.M.; writing—original draft, C.M.; writing—reviewing and editing, K.Y. All authors have read and agreed to the published version of the manuscript.

Funding

This research was funded by the Scientific Research Fund of Zhejiang Provincial Education Department (Z20240059, Y202250567), Zhejiang Provincial Natural Science Foundation of China (LTGS23E090001), and National Natural Science Foundation of China (52479054).

Institutional Review Board Statement

Not applicable.

Informed Consent Statement

Not applicable.

Data Availability Statement

Data available on request due to restrictions e.g., privacy or ethical. The data presented in this study are available on request from the corresponding author.

Conflicts of Interest

The authors declare no conflicts of interest.

References

  1. IPCC. Climate Change 2021: The Physical Science Basis. Contribution of WorkingGroup I to the Sixth Assessment Report of the Intergovernmental Panel on Climate Change; Masson-Delmotte, V., Zhai, P., Pirani, A., Connors, S.L., Péan, C., Berger, S., Caud, N., Chen, Y., Goldfarb, L., Gomis, M.I., et al., Eds.; WGI: Dayton, OH, USA, 2021. [Google Scholar]
  2. Zhang, Y.; Wang, W.; Yao, H. Urea-based nitrogen fertilization in agriculture: A key source of N2O emissions and recent development in mitigating strategies. Arch. Agron. Soil Sci. 2023, 69, 663–678. [Google Scholar] [CrossRef]
  3. Harter, J.; Krause, H.-M.; Schuettler, S.; Ruser, R.; Fromme, M.; Scholten, T.; Kappler, A.; Behrens, S. Linking N2O emissions from biochar-amended soil to the structure and function of the N-cycling microbial community. ISME J. 2014, 8, 660–674. [Google Scholar] [CrossRef]
  4. Tang, Y.; Minasny, B.; McBratney, A. Partitioning denitrification pathways in N2O emissions from re-flooded dry paddy soils. Biogeochemistry 2024, 167, 1315–1333. [Google Scholar] [CrossRef]
  5. Zhang, Y.; Zhao, J.; Huang, X.; Cheng, Y.; Cai, Z.; Zhang, J.; Müller, C. Microbial pathways account for the pH effect on soil N2O production. Eur. J. Soil Biol. 2021, 106, 103337. [Google Scholar] [CrossRef]
  6. Men, C.; Liu, R.; Wang, Q.; Guo, L.; Shen, Z. The impact of seasonal varied human activity on characteristics and sources of heavy metals in metropolitan road dusts. Sci. Total Environ. 2018, 637, 844–854. [Google Scholar] [CrossRef] [PubMed]
  7. Herold, M.B.; Giles, E.M.; Alexander, C.J.; Baggs, E.M.; Daniell, T.J. Variable response of nirK and nirS containing denitrifier communities to long-term pH manipulation and cultivation. Fems Microbiol. Lett. 2018, 365, fny035. [Google Scholar] [CrossRef]
  8. Wittorf, L.; Jones, C.M.; Bonilla-Rosso, G.; Hallin, S. Expression of nirK and nirS genes in two strains of Pseudomonas stutzeri harbouring both types of NO-forming nitrite reductases. Res. Microbiol. 2018, 169, 343–347. [Google Scholar] [CrossRef]
  9. Ming, Y.Z.; Abdullah, A.M.; Zhang, D.; Zhu, W.; Liu, H.; Cai, L.; Yu, X.; Wu, K.; Niu, M.; Zeng, Q.; et al. Insights into the evolutionary and ecological adaption strategies of nirS- and nirK-type denitrifying communities. Mol. Ecol. 2024, 33, e17507. [Google Scholar] [CrossRef]
  10. Wu, G.; Liang, F.; Wu, Q.; Feng, X.-G.; Shang, W.-D.; Li, H.-W.; Li, X.-X.; Che, Z.; Dong, Z.-R.; Song, H. Soil pH differently affects N2O emissions from soils amended with chemical fertilizer and manure by modifying nitrification and denitrification in wheat-maize rotation system. Biol. Fertil. Soils 2024, 60, 101–113. [Google Scholar] [CrossRef]
  11. Qiang, R.W.; Wang, M.; Li, Q.; Li, Y.; Sun, H.; Liang, W.; Li, C.; Zhang, J.; Liu, H. Response of Soil Nitrogen Components and nirK- and nirS-Type Denitrifying Bacterial Community Structures to Drip Irrigation Systems in the Semi-Arid Area of Northeast China. Agronomy 2024, 14, 577. [Google Scholar] [CrossRef]
  12. Wang, X.Y.; Li, Y.; Ciampitti, I.A.; He, P.; Xu, X.; Qiu, S.; Zhao, S. Response of soil denitrification potential and community composition of denitrifying bacterial to different rates of straw return in north-central China. Appl. Soil Ecol. 2022, 170, 104312. [Google Scholar] [CrossRef]
  13. Luo, X.S.; Zeng, L.; Wang, L.; Qian, H.; Hou, C.; Wen, S.; Wang, B.; Huang, Q.; Chen, W. Abundance for subgroups of denitrifiers in soil aggregates associates with denitrifying enzyme activities under different fertilization regimes. Appl. Soil Ecol. 2021, 166, 103983. [Google Scholar] [CrossRef]
  14. Yang, X.; Tang, S.; Ni, K.; Shi, Y.; Yi, X.; Ma, Q.; Cai, Y.; Ma, L.; Ruan, J. Long-term nitrogen addition increases denitrification potential and functional gene abundance and changes denitrifying communities in acidic tea plantation soil. Environ. Res. 2022, 216, 114679. [Google Scholar] [CrossRef]
  15. Tang, Q.; Moeskjær, S.; Cotton, A.; Dai, W.; Wang, X.; Yan, X.; Daniell, T.J. Organic fertilization reduces nitrous oxide emission by altering nitrogen cycling microbial guilds favouring complete denitrification at soil aggregate scale. Sci. Total Environ. 2024, 946, 174178. [Google Scholar] [CrossRef] [PubMed]
  16. Intrator, N.; Jayakumar, A.; Ward, B.B. Aquatic nitrous oxide reductase gene (nosZ) phylogeny and environmental distribution. Front. Microbiol. 2024, 15, 1407573. [Google Scholar] [CrossRef]
  17. Philippot, L.; Andert, J.; Jones, C.M.; Bru, D.; Hallin, S. Importance of denitrifiers lacking the genes encoding the nitrous oxide reductase for N2O emissions from soil. Glob. Change Biol. 2010, 17, 1497–1504. [Google Scholar] [CrossRef]
  18. Frostegård, Å.; Vick, S.H.W.; Lim, N.Y.N.; Bakken, L.R.; Shapleigh, J.P. Linking meta-omics to the kinetics of denitrification intermediates reveals pH-dependent causes of N2O emissions and nitrite accumulation in soil. ISME J. 2021, 16, 26–37. [Google Scholar] [CrossRef]
  19. Domeignoz-Horta, L.; Putz, M.; Spor, A.; Bru, D.; Breuil, M.; Hallin, S.; Philippot, L. Non-denitrifying nitrous oxide-reducing bacteria-An effective N2O sink in soil. Soil Biol. Biochem. 2016, 103, 376–379. [Google Scholar] [CrossRef]
  20. Meng, C.; Wang, F.; Engel, B.A.; Yang, K.; Zhang, Y. Is Cattle Manure Application with Plastic-Film Mulch a Good Choice for Potato Production? Agronomy 2019, 9, 534. [Google Scholar] [CrossRef]
  21. Qin, C.; Li, S.-L.; Wu, Y.; Bass, A.M.; Luo, W.; Ding, H.; Yue, F.-J.; Zhang, P. High sensitivity of dissolved organic carbon transport during hydrological events in a small subtropical karst catchment. Sci. Total Environ. 2024, 946, 174090. [Google Scholar] [CrossRef]
  22. Zhongyi, C.; He, Y.; Wang, N.; Wu, L.; Xu, J.; Shi, J. Uncovering soil amendment-induced genomic and functional divergence in soybean rhizosphere microbiomes during cadmium-contaminated soil remediation: Novel insights from field multi-omics. Environ. Pollut. 2025, 368, 125787. [Google Scholar]
  23. Abbas, T.; Zhang, Q.; Zou, X.; Tahir, M.; Wu, D.; Jin, S.; Di, H. Soil anammox and denitrification processes connected with N cycling genes co-supporting or contrasting under different water conditions. Environ. Int. 2020, 140, 105757. [Google Scholar] [CrossRef] [PubMed]
  24. Walters, W.; Hyde, E.R.; Berg-Lyons, D.; Ackermann, G.; Humphrey, G.; Parada, A.; Gilbert, J.A.; Jansson, J.K.; Caporaso, J.G.; Fuhrman, J.A.; et al. Improved Bacterial 16S rRNA Gene (V4 and V4-5) and Fungal Internal Transcribed Spacer Marker Gene Primers for Microbial Community Surveys. mSystems 2015, 1, e00009-15. [Google Scholar] [CrossRef]
  25. Chen, H.; Mothapo, N.V.; Shi, W. Fungal and bacterial N2O production regulated by soil amendments of simple and complex substrates. Soil Biol. Biochem. 2015, 84, 116–126. [Google Scholar] [CrossRef]
  26. Throbäck, I.N.; Enwall, K.; Jarvis, A.; Hallin, S. Reassessing PCR primers targeting nirS, nirK and nosZ genes for community surveys of denitrifying bacteria with DGGE. Fems Microbiol. Ecol. 2004, 49, 401–417. [Google Scholar] [CrossRef]
  27. Hallin, S.; Lindgren, P.-E. PCR detection of genes encoding nitrile reductase in denitrifying bacteria. Appl. Environ. Microbiol. 1999, 65, 1652–1657. [Google Scholar] [CrossRef]
  28. Wei, W.; Isobe, K.; Shiratori, Y.; Nishizawa, T.; Ohte, N.; Ise, Y.; Otsuka, S.; Senoo, K. Development of PCR primers targeting fungal nirK to study fungal denitrification in the environment. Soil Biol. Biochem. 2015, 81, 282–286. [Google Scholar] [CrossRef]
  29. Zhang, B.; Penton, C.R.; Yu, Z.; Xue, C.; Chen, Q.; Chen, Z.; Yan, C.; Zhang, Q.; Zhao, M.; Quensen, J.F.; et al. A new primer set for Clade I nosZ that recovers genes from a broader range of taxa. Biol. Fertil. Soils 2021, 57, 523–531. [Google Scholar] [CrossRef]
  30. Jones, C.M.; Graf, D.R.H.; Bru, D.; Philippot, L.; Hallin, S. The unaccounted yet abundant nitrous oxide-reducing microbial community: A potential nitrous oxide sink. ISME J. 2012, 7, 417–426. [Google Scholar] [CrossRef]
  31. Zhao, S.; Wang, Q.; Zhou, J.; Yuan, D.; Zhu, G. Linking abundance and community of microbial N2O-producers and N2O-reducers with enzymatic N2O production potential in a riparian zone. Sci. Total Environ. 2018, 642, 1090–1099. [Google Scholar] [CrossRef]
  32. Machefert, S.E.; Dise, N.B. Hydrological controls on denitrification in riparian ecosystems. Hydrol. Earth Syst. Sci. 2004, 8, 686–694. [Google Scholar] [CrossRef]
  33. Foltz, M.E.; Kent, A.D.; Koloutsou-Vakakis, S.; Zilles, J.L. Influence of rye cover cropping on denitrification potential and year-round field N2O emissions. Sci. Total Environ. 2021, 765, 144295. [Google Scholar] [CrossRef]
  34. Wan, Z.; Wang, L.; Huang, G.; Rasul, F.; Awan, M.I.; Cui, H.; Liu, K.; Yu, X.; Tang, H.; Wang, S.; et al. nirS and nosZII bacterial denitrifiers as well as fungal denitrifiers are coupled with N2O emissions in long-term fertilized soils. Sci. Total Environ. 2023, 897, 165426. [Google Scholar] [CrossRef] [PubMed]
  35. Lee, J.A.; Francis, C.A. Francis, Spatiotemporal Characterization of San Francisco Bay Denitrifying Communities: A Comparison of nirK and nirS Diversity and Abundance. Microb. Ecol. 2017, 73, 271–284. [Google Scholar] [CrossRef]
  36. Song, H.; Che, Z.; Jin, W.; Meng, Y.; Wang, J.; Cao, W.; Dong, Z. Changes in denitrifier communities and denitrification rates in an acidifying soil induced by excessive N fertilization. Arch. Agron. Soil Sci. 2019, 66, 1203–1217. [Google Scholar] [CrossRef]
  37. Hu, X.; Gu, H.; Liu, J.; Liu, Z.; Li, L.; Du, S.; Yu, Z.; Li, Y.; Jin, J.; Liu, X.; et al. Biogeographic distribution patterns and assembly processes of nirS-type and nirK-type denitrifiers across the black soil zone in Northeast China. Soil Sci. Soc. Am. J. 2021, 86, 1383–1396. [Google Scholar] [CrossRef]
  38. Chen, Z.; Zhang, N.; Li, Y.; Xu, S.; Liu, Y.; Miao, S.; Ding, W. Extreme Rainfall Amplified the Stimulatory Effects of Soil Carbon Availability on N2O Emissions. Glob. Change Biol. 2025, 31, e70164. [Google Scholar] [CrossRef]
  39. Highton, M.P.; Bakken, L.R.; Dörsch, P.; Wakelin, S.; de Klein, C.A.; Molstad, L.; Morales, S.E. Soil N2O emission potential falls along a denitrification phenotype gradient linked to differences in microbiome, rainfall and carbon availability. Soil Biol. Biochem. 2020, 150, 108004. [Google Scholar] [CrossRef]
  40. Wei, Z.; Well, R.; Ma, X.; Lewicka-Szczebak, D.; Rohe, L.; Zhang, G.; Li, C.; Ma, J.; Bol, R.; Xu, H.; et al. Organic fertilizer amendment decreased N2O/(N2O+N2) ratio by enhancing the mutualism between bacterial and fungal denitrifiers in high nitrogen loading arable soils. Soil Biol. Biochem. 2024, 198, 109550. [Google Scholar] [CrossRef]
  41. Hallin, S.; Philippot, L.; Löffler, F.E.; Sanford, R.A.; Jones, C.M. Genomics and Ecology of Novel N2O-Reducing Microorganisms. Trends Microbiol. 2018, 26, 43–55. [Google Scholar] [CrossRef]
  42. Lin, Y.; Hu, H.-W.; Deng, M.; Yang, P.; Ye, G. Microorganisms carrying nosZ I and nosZ II share similar ecological niches in a subtropical coastal wetland. Sci. Total Environ. 2023, 870, 162008. [Google Scholar] [CrossRef]
  43. Wang, X.; Zhang, Y.; Zhou, H.; Wu, M.; Shan, J.; Yan, X. Investigating drivers of N2 loss and N2O reducers in paddy soils across China. Sci. Total Environ. 2024, 954, 176287. [Google Scholar] [CrossRef] [PubMed]
  44. Wang, L.; Xu, H.; Liu, C.; Yang, M.; Zhong, J.; Wang, W.; Li, Z.; Li, K. Stronger link of nosZ I than nosZ II to the higher total N2O consumption in anoxic paddy surface soils. Geoderma 2022, 425, 116035. [Google Scholar] [CrossRef]
  45. Shaaban, M.; Hu, R.; Wu, Y.; Song, L.; Xu, P. Soil pH management for mitigating N2O emissions through nosZ (Clade I and II) gene abundance in rice paddy system. Environ. Res. 2023, 225, 115542. [Google Scholar] [CrossRef] [PubMed]
  46. Sun, Y.; Yin, Y.; He, G.; Cha, G.; Ayala-Del-Río, H.L.; González, G.; Konstantinidis, K.T.; Löffler, E.F. pH selects for distinct N2O-reducing microbiomes in tropical soil microcosms. ISME Commun. 2024, 4, ycae070. [Google Scholar] [CrossRef]
  47. Qian, X.; Chen, H.; Li, Q.; Wang, F. Converse Responses of Biochar Application on N2O Emissions in Soils at Different pH Values in a Subtropical Citrus Orchard. Agronomy 2024, 14, 1831. [Google Scholar] [CrossRef]
  48. Domeignoz-Horta, L.A.; Pold, G.; Liu, X.-J.A.; Frey, S.D.; Melillo, J.M.; DeAngelis, K.M. Microbial diversity drives carbon use efficiency in a model soil. Nat. Commun. 2020, 11, 3684. [Google Scholar] [CrossRef]
  49. Su, F.; Li, Y.; Qian, J.; Li, T.; Wang, Y. Impact of freeze-thaw cycles and influent C/N ratios on N2O emissions in subsurface wastewater infiltration systems. J. Environ. Chem. Eng. 2024, 12, 114293. [Google Scholar] [CrossRef]
Figure 1. Seven sampling sites from typical paddy fields across China.
Atmosphere 16 00788 g001
Figure 2. Soil chemical properties at Shenyang, Beijing, Zhengzhou, Nanchang, Quzhou, Fuzhou, and Kunming sites. Vertical bars represent the standard deviations of the mean (n = 3). Different letters above bars indicate significant differences (p < 0.05).
Atmosphere 16 00788 g002
Figure 3. Microbial gene abundance at Shenyang, Beijing, Zhengzhou, Nanchang, Quzhou, Fuzhou, and Kunming sites. Vertical bars represent the standard deviations of the mean (n = 3). Different lowercase letters above bars indicate statistically significant differences (p < 0.05).
Atmosphere 16 00788 g003
Figure 4. Potential N2O production rate (a) and N2O reduction rate (b) at Shenyang, Beijing, Zhengzhou, Nanchang, Quzhou, Fuzhou, and Kunming sites. For N2O production potential (a), soils were incubated without acetylene. The N2O reduction rate (b) was calculated as the difference between N2O production potential (acetylene-free) and denitrification rate (with acetylene). Denitrification rates are provided in Supplementary Figure S1. Vertical bars represent the standard deviations of the mean (n = 3). Different lowercase letters above bars indicate statistically significant differences (p < 0.05).
Atmosphere 16 00788 g004
Figure 5. Principal Component Analysis (PCA) of microbial gene abundances (a) and soil chemical properties (b). The PCA illustrates the dominant patterns of variation in quantitative gene data (including bacteria, fungi, and nirS, nirK, fungal nirK, nosZ I and nosZ II) and soil chemical properties, with axes representing the principal components explaining the highest proportion of variance (percentage values shown).
Atmosphere 16 00788 g005
Figure 6. Correlation between potential N2O production rate and N2O reduction rate, soil chemical properties, and microbial gene abundances (a). The importance of abiotic and biotic factors as predictors of N2O production and reduction, as determined by the random forest analysis (b). % IncMSE is the percentage increase in mean square error.
Atmosphere 16 00788 g006
Figure 7. Structural equation modeling (SEM) of abiotic and biotic drivers of potential N2O production rate and N2O reduction rate. The model quantifies direct and indirect pathways, with arrow widths proportional to standardized effect sizes (*** p < 0.001; ** p < 0.01; * p < 0.05). Goodness-of-fit indices (χ2/df, RMSEA, CFI, GFI) indicate strong model-data agreement.
Atmosphere 16 00788 g007
Table 1. Primer sets and thermal cycling conditions for qPCR.
GenePrimerSequence 5′ to 3′Thermal Cycling Conditions
16s rRNA515F/806RGTGYCAGCMGCCGCGGTAA/
GGACTACNVGGGTWTCTAAT
95 °C for 1 min, 1 cycle; 95 °C for 30 s, 55 °C for 30 s, 72 °C for 30 s, 40 cycles; 75 °C for 10 min. [24]
Fungal ITS5.8S-F/ITS1f-RCGCTGCGTTCTTCATCG/
TCCGTAGGTGAACCTGCGG
95 °C for 1 min, cycle; 98 °C for 10 s, 53 °C for 30 s, 72 °C for 30 s, 40 cycles; 75 °C for 10 min. [25]
nirSnirS-cd3aF/
nirS-R3cd
GASTTCGGRTGSGTCTTGA/
ATCATGGTSCTGCCGCG
95 °C for 1 min, 1 cycle; 98 °C for 10 s, 53 °C for 30 s, 72 °C for 30 s, 40 cycles; 75 °C for 10 min. [26]
nirKnirK-FlaCu/
nirK-R3Cu-GCb
ATCATGGTSCTGCCGCG/
GCCTCGATCAGRTTGTGGTT
94 °C for 3 min, 1 cycle; 94 °C for 30 s, 57 °C for 1 min, 73 °C for 1 min, 35 cycles; 75 °C for 10 min. [27]
Fungal nirKnirKfF/
nirKfR
TACGGGCTCATGtaygtnsarcc/
AGGAATCCCACAscnccyttntc
95 °C for 5 min, 1 cycle; 95 °C for 30 s, 61.5 °C for 30 s, 72 °C for 1 min, 35 cycle; 72 °C for 10 min. [28]
nosZ InosZ I F/
nosZ I R
GGCAARCTVTCDCCVAC/
AVCGGTCYTTVGAGAAYTT
95 °C for 2 min, 1 cycle; 95 °C for 45 s, 53 °C for 45 s, 72 °C for 1 min, 35 cycles; 72 °C for 10 min. [29]
nosZ IInosZ- II -F/
nosZ- II -R
CTIGGICCIYTKCAYAC/
GCIGARCARAAITCBGTRC
95 °C for 5 min, 1 cycle; 95 °C for 30 s, 54 °C for 60 s, 72 °C for 1 min, 35 cycles; 72 °C for 10 min. [30]
Disclaimer/Publisher’s Note: The statements, opinions and data contained in all publications are solely those of the individual author(s) and contributor(s) and not of MDPI and/or the editor(s). MDPI and/or the editor(s) disclaim responsibility for any injury to people or property resulting from any ideas, methods, instructions or products referred to in the content.