Article

Multi-Model Simulations of a Mediterranean Extreme Event: The Impact of Mineral Dust on the VAIA Storm

1
Institute of Atmospheric Sciences and Climate (CNR-ISAC), National Research Council, Via Gobetti 101, 40129 Bologna, Italy
2
Department of Physical and Chemical Sciences, University of L’Aquila, Via Vetoio, Coppito, 67100 L’Aquila, Italy
3
Institute of Atmospheric Sciences and Climate (CNR-ISAC), National Research Council, Strada Prov.le Lecce-Monteroni Km 1,200, 73100 Lecce, Italy
4
Forest Modelling Laboratory, Institute for Agricultural and Forest Systems in the Mediterranean (CNR-ISAFOM), National Research Council, Via Della Madonna Alta, 128, 06121 Perugia, Italy
*
Author to whom correspondence should be addressed.
Atmosphere 2025, 16(6), 745; https://doi.org/10.3390/atmos16060745
Submission received: 25 March 2025 / Revised: 20 May 2025 / Accepted: 10 June 2025 / Published: 18 June 2025
(This article belongs to the Section Aerosols)

Abstract

:
This study investigates the impact of desert dust on precipitation patterns using multi-model simulations. Dust-based processes of formation/removal of ice nuclei (IN) and cloud condensation nuclei (CCN) are investigated by using both the online access model WRF-CHIMERE and the online integrated model WRF-Chem. Comparisons of model predictions with rainfall measurements (GRISO: Spatial Interpolation Generator from Rainfall Observations) over the Italian peninsula show the models’ ability to reproduce heavy orographic precipitation in alpine regions. To quantify the impact of the mineral dust transport concomitant to the atmospheric river (AR) on cloud formation, a sensitivity study is performed by using the WRF-CHIMERE model (i) by setting dust concentrations to zero and (ii) by modifying the settings of the Thompson Aerosol-Aware microphysics scheme. Statistical comparisons revealed that WRF-CHIMERE outperformed WRF-Chem. It achieved a correlation coefficient of up to 0.77, mean bias (MB) between +3.56 and +5.01 mm/day, and lower RMSE and MAE values (~32 mm and ~22 mm, respectively). Conversely, WRF-Chem displayed a substantial underestimation, with an MB of −25.22 mm/day and higher RMSE and MAE values. Our findings show that, despite general agreement in spatial precipitation patterns, both models significantly underestimated the peak daily rainfall in pre-alpine regions (e.g., 216 mm observed at Malga Valine vs. 130–140 mm simulated, corresponding to a 35–40% underestimation). Although important instantaneous changes in precipitation and temperature were modeled at a local scale, no significant total changes in precipitation or air temperature averaged over the entire domain were observed. These results underline the complexity of aerosol–cloud interactions and the need for improved parameterizations in coupled meteorological models.

1. Introduction

The high complexity of the atmospheric composition is the result of multiple simultaneous factors, including a mixture of particles that interact in different ways across time and space. Atmospheric particles can modify clouds’ microphysical properties, such as the droplet number and size and water/ice phase, and thus alter the intensity and spatial distribution of precipitation events [1]. Although numerous research efforts have been made, the mechanisms through which they influence the clouds and heavy precipitation are still unclear. Nevertheless, work on this challenging topic (i.e., the impact of aerosol cycling and formation on meteorology and vice versa) draws upon robust and consolidated results from the literature [1,2,3,4,5,6,7]. It is well known that physical and chemical properties of atmospheric particles can influence meteorology through direct, semidirect, and indirect effects [8,9,10]. The direct aerosol effect refers to aerosol scattering and the absorption of short- and longwave radiation. These effects on radiation result in changes in temperature, wind speed, relative humidity, and atmospheric stability, which are termed semidirect effects [10]. The effects of aerosols through clouds are classified as indirect effects [11], which are further sub-classified according to their role into the formation of cloud condensation nuclei (CCN) or ice nuclei (IN) [1].
Although the impact of columnar aerosol loading—even during sand and dust storms—on estimating radiative transport throughout the atmosphere is clear [12,13,14], there is more uncertainty in quantifying the effects of atmospheric particles on cloudiness and precipitation. The interaction between aerosol and cloud parameters is unlikely to be random and depends on various additional factors; their overall impact remains a complex issue [15]. An adequate numerical representation of these effects can guarantee consistent treatment of processes and allow for two-way interactions between physical and chemical components, particularly for air quality (AQ) and numerical weather prediction (NWP) communities [3]. Indeed, the indirect effects seem to be very sensitive to the sophistication of the chosen parameterizations and the details of the implementation [13]. For instance, employing essentially the same theoretical approaches for CCN, very different results are sometimes achieved [13]. In fact, dust particles, which cover approximately 50% of the global load of natural airborne particles [16], play a key role in rainfall formation, as they provide a surface for condensation. Previous studies on the effects of aerosols on rainfall have reported contradicting results, with some indicating that dust enhances rainfall, while others report a suppressing effect. Thus, dust can both increase and decrease rainfall by affecting air mass circulation at a local scale [14,15,16,17]. In general, feedback effects seem to have a crucial impact in the vicinity of large emission sources, such as the Saharan desert.
Western Europe and the Mediterranean basin, where intense mesoscale vortices [18] are often associated with heavy mineral dust transport from the Sahara Desert [19], might be considered a natural laboratory in which such processes can be investigated. Remy et al. [12] highlighted how important accurate forecasts of the timing of the storm are, since depending on the local time of the dust-lifting episodes, the interactions between the aerosol and boundary layer meteorology are of a very different nature. Menut et al. [20], in their sensitivity experiments carried out to evaluate the impact of the aerosols on the meteorology in southern west Africa, stated that the most important effect of aerosol–cloud interactions is found by halving the emissions of mineral dust, which results in a decrease in the 2 m temperature by 0.5 K and in the boundary layer height of 25 m on a monthly average over the Saharan region. The presence of dust aerosols also increases (or decreases) the shortwave or (longwave) radiation at the surface by 25 W m−2. Parajuli et al. [21] pointed out that although the domain-average rainfall change caused by dust appeared small, the effect can be significant at different locations and times. In addition, the same authors, by investigating in a quantitative manner the direct and indirect dust effect over a ten-year period, found that dust enhanced rainfall for extreme rainfall events but suppressed rainfall for normal rainfall events [21]. Flaounas et al. [22] argue in their recent paper about the key role of mineral dust particle mobilization from northern Africa upon cyclonic circulation conditions that there is a current lack of knowledge about the net effect—ascribable to the huge load of mineral dust particles—on (i) the radiation balance of the atmosphere and (ii) cloud and precipitation processes during the triggering and development of severe episodes.
This paper addresses the role of Saharan dust in affecting the regional weather system in the Mediterranean basin. Specifically, it investigates the VAIA thunderstorm episode (29 October 2018) to clarify this topic. The study employs three distinct numerical experiments using two state-of-the-art fully coupled models: WRF-CHIMERE and WRF-Chem. The main method is based on (i) a control run to simulate the baseline scenario, (ii) a run removing the mineral dust to isolate its impact, and (iii) a run replacing the parametrization scheme for cloud condensation nuclei (CCN) and ice-nucleating particle (INP) formation, following the schemes proposed by DeMott et al., 2015 [23]. This approach is innovative in its combined use of two different models and the specific focus on the VAIA storm, a high-impact weather event. This study aims to shed light on the mechanism by which the Saharan dust influences severe weather in the Mediterranean, particularly the formation of CCN and INP. The key contributions include a detailed analysis of the dust’s role in a real-world extreme event and a comparison of the effects of different microphysical parameterizations on the simulation results.

2. Data and Methods

For this study, multi-model simulations were used to investigate the impact of desert dust on precipitation patterns. The formation/removal processes of ice nuclei (IN) and cloud condensation nuclei (CCN) were studied using two models: the online access model WRF-CHIMERE and the online integrated model WRF-Chem. The model predictions were compared with the measured precipitation (GRISO: Spatial Interpolation Generator from Rainfall Observations) over the Italian peninsula. To quantify the impact of mineral dust transport concomitant to the atmospheric river (AR) on precipitation formation, a sensitivity study was conducted using the WRF-CHIMERE model by (i) zeroing dust concentrations and (ii) modifying the Thompson Aerosol-Aware microphysics scheme.

2.1. Description of Numerical Modeling

This study employed two fully coupled models, WRF-CHIMERE v2020r3 and WRF-Chem v4.2.1 [24], to carry out numerical simulations of a severe Mediterranean Saharan dust storm. The simulations focused on the day of 29 October 2018, when an intense Saharan dust outbreak occurred over the Mediterranean basin. Figure 1 depicts the integration domains that were designed for WRF-Chem (left panel) and WRF-CHIMERE (right panel) that were considered in this study.

2.2. CHIMERE Model Fully Coupled with WRF

In this work, we used version 2020r3 of the WRF-CHIMERE model. WRF-CHIMERE is an online access meteorology–chemistry coupled model which allows for the simulation of direct and indirect effects of aerosols [25,26,27]. In this modeling tool, the mesoscale meteorological model WRF V3.7.1 is coupled with the CHIMERE chemical and transport model [27,28], exchanging the meteorological and aerosol fields via the external coupling software OASIS3-MCT v3.0 [29] with the subhourly frequency being chosen by the user. The models run on the same horizontal grid, but the vertical grids are different. WRF feeds CHIMERE with 28 meteorological fields. The direct effect is simulated by using the aerosol optical depth, aerosol single-scattering albedo, and asymmetry parameter, calculated based on the aerosol mass distribution size predicted by CHIMERE. These optical properties are diagnosed with Mie theory under an external mixing assumption and are used in WRF to force the Rapid Radiative Transfer Model for GCMs (RRTMG) scheme [30] in both visible and infrared bands. Further details are provided in [25]. Indirect aerosol effects are simulated as described by Tuccella et al. (2019) [26] via the aerosol-aware cloud microphysics scheme developed by Thompson and Eidhammer (2014) [31]. This scheme considers the aerosol activation as cloud droplet and ice nucleation starting from an aerosol climatology, assumed to be log-normally distributed. In WRF-CHIMERE, this approach is replaced with the aerosol fields predicted by CHIMERE. The aerosol size distribution and bulk hygroscopicity, which are determined from the aerosol mass calculated by CHIMERE following a sectional approach [27,28], are used in WRF to calculate the aerosol activation rate as cloud droplets according to Abdul-Razzak (2002) [32], with the maximum supersaturation being determined from a Gaussian spectrum of updraft velocity according to Ghan et al. (1997) [33]. Following Thompson and Eidhammer (2014) [31], aerosol activation occurs in the cloud when the number of activated aerosols is larger than the existing droplet mixing ratio. Heterogeneous and homogeneous ice nucleation are parameterized following Thompson and Eidhammer (2014) [31], but the climatology of ice-nucleating particles and deliquesced aerosols are replaced with the fields predicted by CHIMERE. In WRF-CHIMERE, dust particles with a diameter larger than 0.5 µm are considered ice nuclei for heterogeneous ice nucleation. The number of dust particles which nucleate as ice particles is determined using the parameterization method of DeMott et al. (2015) [23]. Homogeneous nucleation of deliquesced aerosols is parameterized according to Koop et al. (2000) [34]. In WRF-CHIMERE, a mixture of sea salt and inorganic and secondary organic aerosols with diameters larger than 0.1 µm is considered to be deliquesced aerosols that are suitable for homogeneous ice nucleation.
The horizontal domain designed for WRF–CHIMERE runs is composed of a parent domain which covers Europe, with a horizontal resolution of 15 km, and the nested one, which covers the Italian peninsula, with a horizontal grid spacing of 3 km, as reported in Figure 1 (right panel). The simulation started on 27 October 2018 (00:00 UTC) and ended on 31 October 2018 (00:00 UTC). The WRF vertical grid is composed of 33 levels extending up to 50 hPa, while CHIMERE is created with 28 vertical meshes up to 150 hPa. The exchange frequency between the models is 5 min. The parameterizations adopted for WRF-CHIMERE are the same as those used by Tuccella et al. (2019) [26]. This setup has been successfully implemented in different previous works (e.g., [7,20]). As described above, the Thompson and Eidhammer (2014) [31] and RRTMG [30] schemes are adopted for cloud microphysics and radiation. Planetary boundary layer is parameterized with the YSU scheme [35], Noah is used as the land surface model [36], and the convective parameterization adopted is the scheme of Grell and Freitas (2014) [37]. No cumulus parameterization is used in the inner domain. The gas-phase chemical model adopted in CHIMERE is the MELCHIOR2 scheme [38], and photolytic rates are calculated with the Fast-JX model according to Wild et al. (2000) [39]. Aerosol evolution is parameterized with a sectional approach [27,28,40]. The aerosol species predicted by CHIMERE are sulfate (SO4), nitrate (NO3), ammonium (NH4), black carbon (BC), primary unspeciated aerosol, primary organic matter (POM), secondary organic aerosols (SOAs), aerosol water, mineral dust, and sea salt. Anthropogenic emissions are from the EMEP inventory, biogenic emissions are calculated with the model of Emissions of Gases and Aerosols from Nature (MEGAN) [41], soil dust emission flux is parameterized according to the description provided in Menut et al. (2015) [42], and sea salt emissions follow Monahan (1986) [43].

2.3. WRF-Chem Fully Coupled Online Model

WRF-Chem model version 4.2.1 was utilized in a numerical domain covering the upper Sahara Desert and the central Mediterranean. Figure 1 (left panel) reports the WRF-Chem integration domain, with 600 × 600 points and a horizontal grid spacing of 5 km. As the WRF-CHIMERE ran, the simulation started on October 27 and ended on 31 October 2018 (00:00 UTC). The boundary and initial conditions were at a 1-degree resolution and provided from the NCAR/NCEP Final Analysis from Global Forecast System (FNL from GFS). In essence, the meteorological model WRF used the same physical set of parameterizations. Based on the WRF setup recommended by Rizza et al. (2020) [44], the following parameterizations were utilized: the Mellor–Yamada–Janjic Scheme (MYJ) parameterization was used to describe the planetary boundary layer (bl_pbl_physics = 2), and the surface layer (sf_sfclay_physics = 2) was described using the Eta similarity scheme. The Noah–MP Land Surface Model (sf_surface_physics = 4) was chosen to represent the land surface processes [45]. The four-dimensional data assimilation (FDDA) scheme, based on Analysis Nudging (grid_fdda = 1) as described by Stauffer and Seaman (1994) [46], was utilized to account for the meteorological large-scale forcing on the Mediterranean basin [44]. The radiative schemes were parameterized using the Rapid Radiative Transfer Model [30] for both shortwaves (ra_sw_physics = 4) and longwaves (ra_lw_physics = 4) and coupled with the Goddard Chemistry Aerosol Radiation and Transport (GOCART) model [47] by the variable “aer rad feedback”, defined in the namelist.input chem-section. The coupling strategy between the aerosol field forecast from the GOCART model (chem_opt = 300) and the microphysics parameterization was implemented here following a recent methodology formulated by Su and Fung (2018) [48]. In this context, the updated Thompson microphysics scheme (mp_physics = 28), which is a bulk two-moment aerosol-aware microphysics scheme that considers the mixing ratios and number concentrations for the five water species of cloud water, cloud ice, snow, rain, and a mixed hail–graupel class [31], was coupled with the GOCART aerosol model, enabling WRF-Chem to simulate the effect of dust aerosol in the ice nucleation processes online during simulations [48]. In particular, the updated Thompson–Eidhammer scheme in its default version incorporates the activation of aerosols serving as cloud condensation nuclei (CCN) and ice nuclei (IN), and therefore it explicitly predicts the number concentrations of CCN (NWFA—Number of Water-Friendly Aerosols) and IN (NIFA—Number of Ice-Friendly Aerosols), as well as the number concentrations of cloud droplets and ice crystals. In the coupling proposed here, the bulk number concentration of ice-friendly aerosols from the GOCART aerosol model is passed into the DeMott et al. (2015) [23] ice nucleation scheme for the calculation of the number concentration of ice-nucleating particles.
P ice ijk = c f GNIFA α 273.2 T k + β exp γ 273.2 T k + δ
where P(i, j, k) is the ice crystal number per unit produced by the ice nucleation induced by ice-friendly aerosols, with α = 0, β = 1.25, γ = 0.46, δ = −11.6, and cf = 3. GNIFA (Gocart Number of Ice-Friendly Aerosols) represents an additional coupling variable that should be defined in the registry.chem WRF configuration file and defined in the code as the ratio between the concentration and the total mass of dust aerosols:
GNIFA ijk = n = 1 5 C n ijk ρ n 4 3 π r n 3
In Equation (2), n = 1,5 is the index of the five aerosol bins defined in the GOCART scheme, described below. The final coupling step consists of passing out the tendency of the aerosol number concentration for the wet removal calculation, which represents the tendency for bulk aerosol number concentration. The WRF-Chem setup related to the aerosols concerns the hybrid bulk/sectional GOCART model. This may be utilized by putting the namelist variable chem_opt = 300. It consists of seven bulk aerosol species—organic carbon (OC1, OC2), black carbon (BC1, BC2), other GOCART primary species (PM2.5, PM10), and sulfate (only secondary aerosol species). The current version of the AFWA dust emission scheme (dust_opt = 3) that is implemented in WRF-Chem [49] considers five dust size bins, ranging between 200 nm and 20 µm. A detailed description of the AFWA dust emission scheme is already provided in the recent works of LeGrand et al. (2019) [49], Ukhov et al. (2020) [50], and Rizza et al. (2021) [51]. It is important to point out that in this kind of parameterization, the dust emission is controlled by the saltation of larger particles (0–100 µm) that are activated by wind shear at the surface. This leads to the emission and entrainment in the air of smaller particles (0–10 µm) by saltation bombardment, and the resulting vertical bulk dust flux is calculated as follows:
  F bulk = G   x   EROD γ x   β
with
β = 10 0.134 % clay 6
where G is the total streamwise horizontal saltation flux [49], β is the sandblasting mass efficiency, which is calculated considering only the soil clay fraction and is the exponential tuning constant for erodibility. Once the total bulk emission (Fbulk) is established, size-resolved dust emission fluxes (g cm2 s−1) are obtained according to the five dust size bin distribution described above.

3. Short Description of Observational Datasets

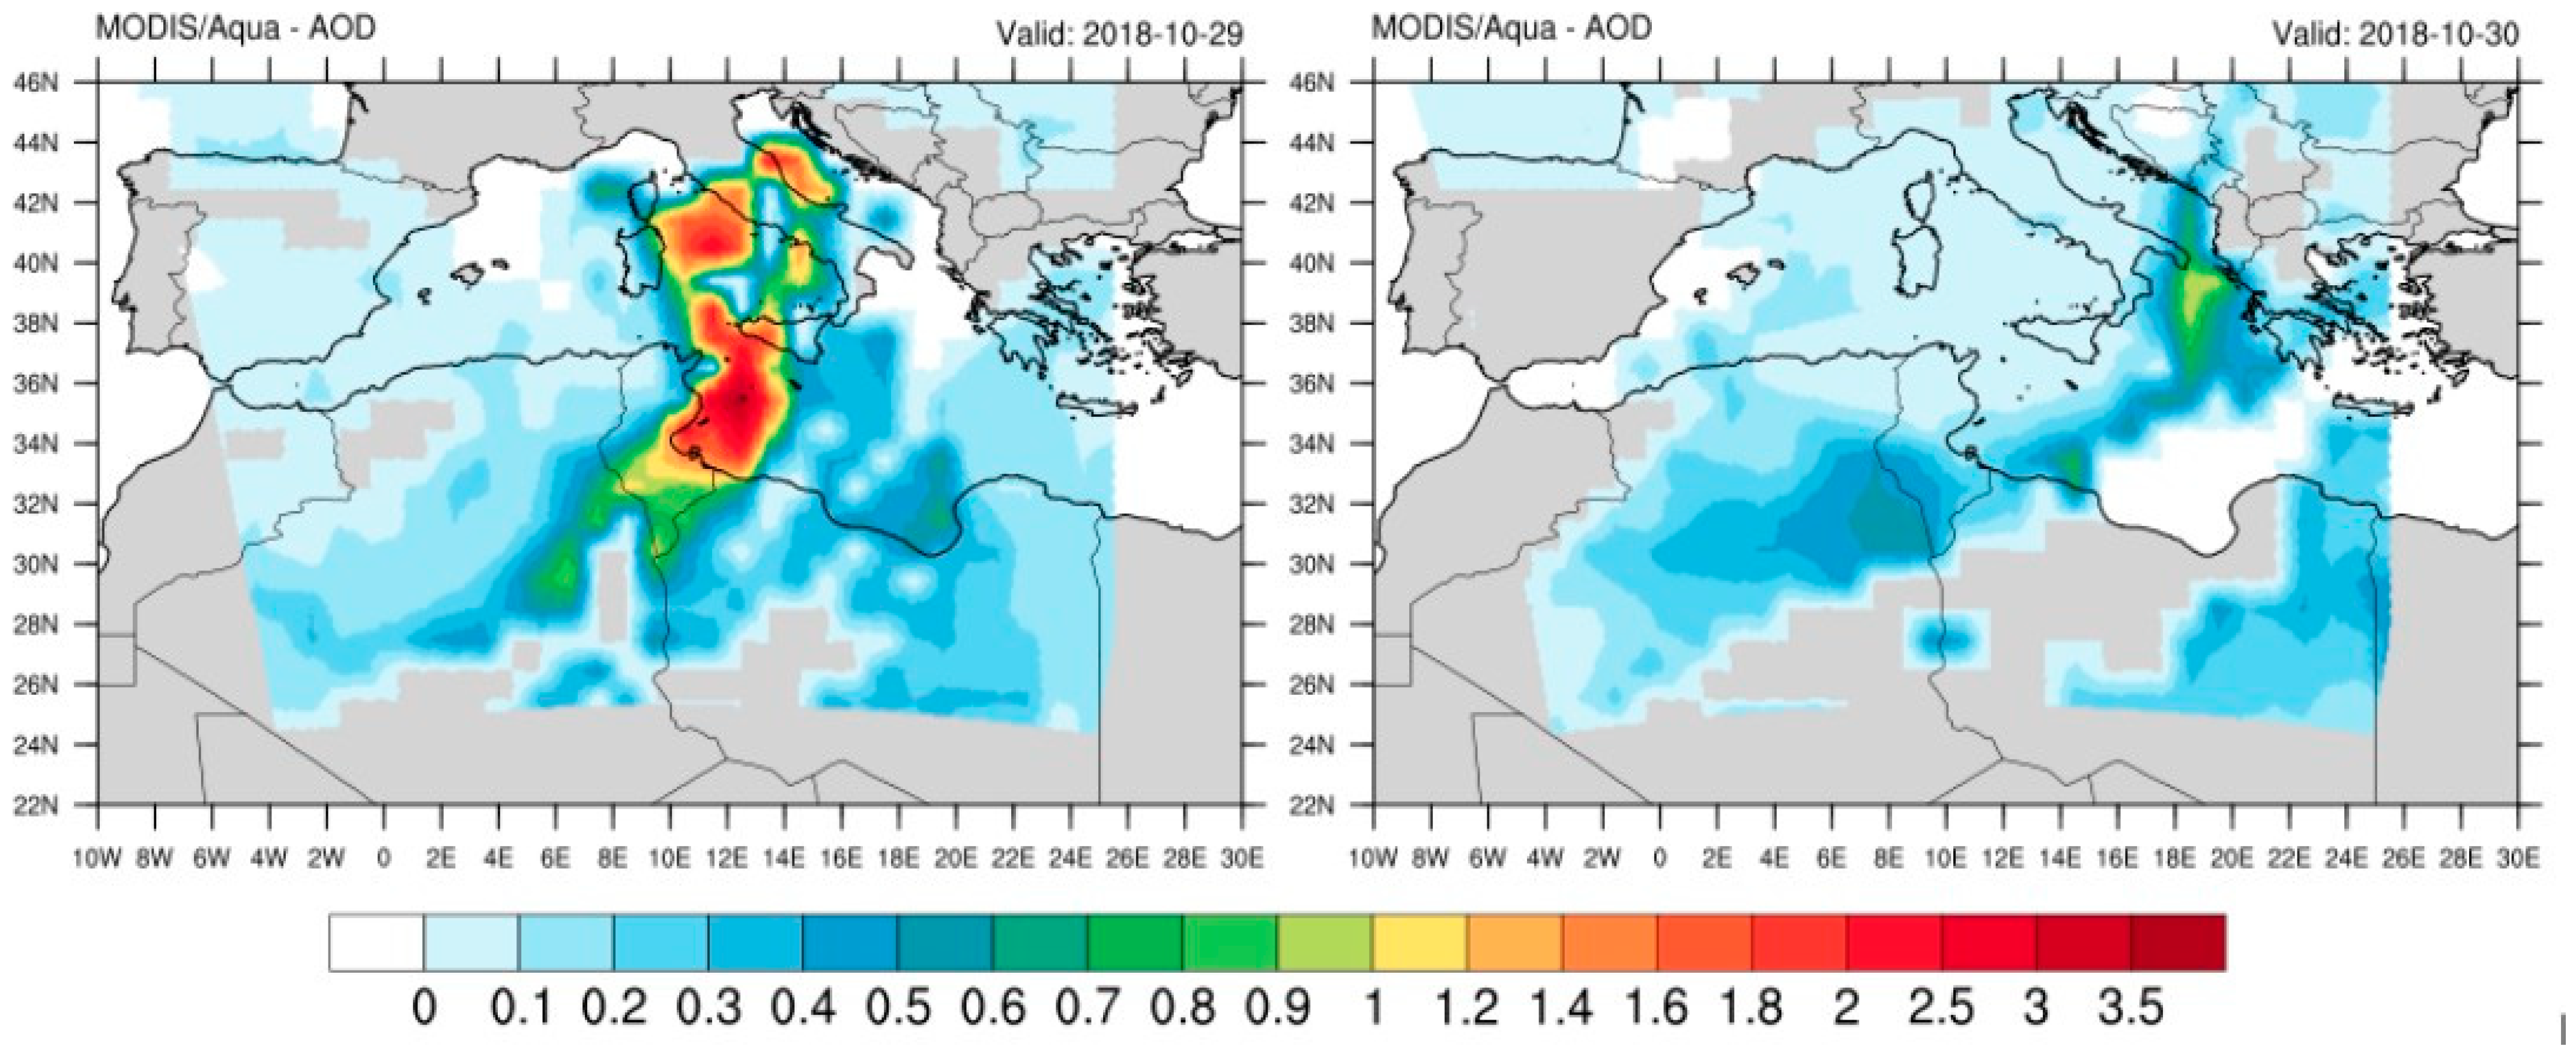
3.1. Moderate-Resolution Imaging Spectroradiometer Dataset

The MODerate-resolution Imaging Spectroradiometer (MODIS) instrument has flown on board the Aqua spacecraft since May 2002. It has 36 wavelength bands covering the visible and the infrared spectrum and a high spatial resolution. Aqua, whose data are used here, overpasses the Equator at 13:30 LST. The characterization of aerosols is the core of the MODIS mission [52], and the aerosol optical depth (AOD) is still the most important physical aerosol parameter derived from space. Two different approaches are currently used to retrieve the AOD from MODIS data. These are indicated as “Dark Target” [51] and “Deep Blue” [53]. The algorithm at the basis of the DT approach is further differentiated when applied over ocean [54] or land [2]. In contrast, the DB approach was developed to be applied over bright surfaces (deserts, snow, sun glint) to complement the DT retrievals. The most recent collection (C006) of MODIS AOD data provides a single AOD product combining both the DT and the DB AOD retrievals (here we use the MODIS daily product MYD08 D3 v6; https://modis.gsfc.nasa.gov/data/dataprod/mod08.php, accessed on 24 March 2025).

3.2. Spatial Interpolation Generator from Rainfall Observations

GRISO (Spatial Interpolation Generator from Rainfall Observations) is a software tool that is designed to perform spatial interpolation of rainfall data collected from weather stations or similar observational networks. By utilizing various interpolation techniques (e.g., kriging, inverse distance weighting, or spline methods), GRISO generates continuous spatial rainfall distribution maps from discrete data points. It is commonly used in hydrology, meteorology, and environmental management to analyze rainfall patterns, assess water resource availability, and support decision-making in flood forecasting and agricultural planning.

4. Synoptic Description by Modeling and Satellite Data

A recent study reported that a Mediterranean extreme event occurred in its western sector between 26 and 30 October 2018. The authors pointed out the presence of an atmospheric river (AR) that developed within a typical autumn synoptic circulation, generally associated with heavy rainfall over the western Mediterranean Sea basin. In particular, such a Mediterranean storm—called “VAIA”—was characterized by explosive cyclogenesis, storm surge, and extremely intense wind gusts on the western Mediterranean basin and the Northern Sahara Desert. As depicted in Figure 2, taken by Davolio et al., 2020 [55], an AR was detected.
The AR was about 3000 km long and confined in the lower troposphere, below 3000 m all along its path, reaching its maximum intensity over the Mediterranean area. Associated with this synoptic circulation, the MODIS sensor onboard the Aqua spacecraft observed a significant Saharan dust intrusion over the Italian peninsula on 29 October 2018. The spacecraft passed over Sardinia at 12:40 UTC on 29 October and over Albania at 11:40 UTC on 30 October. Figure 3 depicts the aerosol optical depth, measured by the Modis Aqua platform, over the region of interest.

5. Modeling Results

Numerical simulations of the event that occurred on 29 October 2018 were performed with the WRF/CHIMERE and WRF/Chem models. Initially, the outputs were compared with the Copernicus Atmosphere Monitoring Service (CAMS) reanalysis, which is considered a benchmark, since the validated reanalysis is a data-assimilated field of air pollutant concentrations based on observation data that have been rigorously validated according to the air quality reporting principles set in EU Decision 2011/850/EU [56] on the reciprocal exchange of information and reporting on ambient air quality. The comparison of PM10 concentrations at ground level is depicted in Figure 4.
Our simulations generally reproduce the spatial patterns and timing of high PM10 levels well, although WRF-CHEM largely overestimates the ground-level concentrations. It is worth noting that the comparison involved remapping CAMS (10 km resolution) and WRF-Chem (5 km resolution) data onto the highest-resolution grid of WRF-CHIMERE (3 km resolution). The discrepancies found with the considered benchmark might be due to (i) different starting integration domains and/or (ii) different dust emission schemes, which are basically a threshold process that critically depends on the estimation of the 10 m wind speed. Nevertheless, non-redundant model settings are likely to be useful to quantify the uncertainties associated with each numerical estimation. Secondly, the simulated 24 h accumulated precipitation for 29 October 2018 was compared with the gridded observations (GRISO). We performed this comparison by including the different WRF-CHIMERE runs, as reported in Table 1. Table 1 presents the run labels (i.e., CPL1, CPL4, CPL4nd), along with their respective coupling settings and considered aerosol species.
The qualitative comparison of the accumulated daily precipitation maps for October 29 is shown in Figure 5.
The comparison between the observations and numerical results shows that the main characteristics of the storm are simulated well by both models, although WRF-CHEM underestimates the accumulated rainfall over the Apuane Alps, which can act as the first orographic barrier of the AR. In contrast, WRF-CHIMERE overestimates the precipitation in the western Po basin. The observations clearly show a sharp decrease in this area compared to the alpine areas of Liguria to the south and Lombardy and Piedmont to the north. Figure 6 presents the scatter plots and the bias analyses for the precipitation rates from CPL1, CPL4, CPL4ND, and WRF-Chem against observations from the GRISO rain gauge network.
Overall, all model simulations exhibit a correlation coefficient exceeding 0.60, indicating a reasonable capability in capturing precipitation patterns. Among the tested configurations, the WRF-CHIMERE simulations show the highest agreement with observations, reaching a correlation of approximately 0.75. WRF-Chem yields a slightly lower correlation of 0.65. The statistical performance metrics are summarized in Table 2.
As shown in Figure 5, WRF-CHIMERE does not exhibit a systematic bias in the spatial distribution of precipitation. In the CPL1 configuration, the mean bias is approximately +5 mm, which appears to be reduced in the fully coupled simulations. However, both the Mean Absolute Error (MAE) and Root Mean Square Error (RMSE) remain constant across the different WRF-CHIMERE runs. In contrast, WRF-Chem underestimates precipitation, with the exception of the Alpine regions in northwestern Italy. Overall, WRF-Chem simulations are characterized by a mean bias of approximately −25 mm, indicating a systematic negative deviation from the observed values.
In addition, we analyzed the accumulated hourly precipitation at Malga Valine (Figure 7), which has been chosen as representative of the pre-alpine region, where extreme accumulated precipitation was recorded.
At this specific location, the timing seems to be captured by the models: the models accurately capture the start of precipitation after a few hours without rain during the night of October 28th–29th. Nevertheless, both models fail in simulating the extremely high values observed between 12 UTC and 15 UTC. In addition, WRF-CHIMERE overestimates the precipitation at the end of the event, between 17 UTC and 21 UTC. WRF-CHEM provides a better representation of the daily precipitation pattern, whereas WRF-CHIMERE simulates a brief afternoon break in precipitation that was not recorded at the weather station. Overall, on the day that we considered, the models underestimate the 24 h accumulated rain. The weather station of Malga Valine measured 216 mm day−1, while the models calculated 140 mm day−1 by WRF-CHIMERE in offline mode, 130 mm day−1 in online mode, and 138 mm day−1 in online mode without dust. WRF/Chem predicts 128 mm day−1 for 29 October. The models’ underestimations range between 35% and 40%. By focusing on the WRF-CHIMERE runs compared with measurements, we did not find linearity in terms of hourly bias among the different sensitivities. The authors argue about the role of aerosols in the precipitation process, which is still unclear due to the complexity of indirect effect calculations in online models. In Section WRF-CHIMERE Sensitivity Tests, we report a few preliminary results, which aim to shed light on these interesting aspects.

WRF-CHIMERE Sensitivity Tests

To determine the effects of dust in the model, we used the online WRF-CHIMERE run, which includes all aerosols (dust, sea salt, sulfate, organic, and black carbon) as our baseline simulation. This baseline simulation accurately reproduces the real-world scenario for 29 October 2018. The results of this run were compared with the no-dust simulation (named CLP4nd in Section 5), in which we assigned zero values to dust concentrations. Both simulations include aerosol–radiation, aerosol–cloud, and microphysical interactions, thus representing the total (direct and indirect) effect of aerosols. Thus, we analyzed the differences we found for a few key parameters, such as cloud condensation nuclei for different supersaturation thresholds (0.02%, 0.04%, 0.1%, 0.2%, 0.5%, and 1%) and the aerosol hygroscopicity, liquid droplets, and ice nuclei number. Figure 8 reports the percentage variation resulting from zeroing dust concentrations in the WRF-CHIMERE online runs.
As expected, removing dust concentrations led to a significant decrease in the average PM10 and PM2.5 mass concentrations across the entire 3D integration domain—by approximately 78% and 59%, respectively. Since aerosols act as cloud condensation nuclei, one would typically expect that lower particulate matter levels in the atmosphere would lead to a reduced number of CCN. Surprisingly, contrary to this expectation, the no-dust simulation showed an increase in CCN volume concentrations, except at the lowest supersaturation level (0.02%). The authors attribute this counterintuitive result to changes in aerosols hygroscopicity, which increased by about 40% by removing dust particles from the atmosphere. In the CHIMERE model, the mean hygroscopicity parameter is calculated as a volume-weighted average of the hygroscopicity values of the individual model species. Dust is treated as a hydrophobic species with a hygroscopicity value of 0.03, whereas sea salt has the highest hygroscopicity (1.16) and black carbon the lowest (1.0 × 10⁻⁶). In CHIMERE, the CCN spectrum is calculated at different constant supersaturation levels. By zeroing the dust, two competing effects could interplay. First, the reduction in large particles that would act as condensation nuclei. These particles, despite having a significant mass, are few in number, thus removing a lot of mass but relatively few CCN. The second effect—which in fact increases the number of CCN—is the lowering of the average activation diameter of the condensation nuclei as a result of increasing the average hygroscopicity, facilitating the formation of CCN, even for smaller particles that are numerous.
Basically, the effects of aerosols or dust particles on rainfall are governed by multiple microphysical, dynamic, and radiative interactions, which can suppress, enhance, or cause no net effect on rainfall depending on the topography and—in general—on the case study. In addition, the scattering and albedo effects of the dust particles themselves caused differences in radiation, consequently leading to significant variations in surface temperature, planetary boundary layer (PBL) height, wind speed, and shortwave radiation. Figure 9 reports the Hovmöller diagrams for the mentioned parameters.
Figure 9 shows the net effect of mineral dust on the spatial distribution of the aforementioned variables. The presence of dust leads to a shift in the spatial patterns of T2m and wind speed, as well as in the vertical motions associated with the PBL calculation. As expected, due to increased atmospheric transparency, the shortwave radiation reaching the surface is higher under no-dust conditions across the entire latitudinal extent of the integration domain.

6. Discussion

The findings of this study contribute to a growing body of literature examining aerosol–cloud–precipitation interactions, with a specific focus on mineral dust as an active modulator of precipitation in the Mediterranean basin. Prior studies, such as those by Rosenfeld et al. (2014) [6] and Menut et al. (2019) [20], have demonstrated that dust may both enhance or suppress rainfall, depending on regional meteorological and microphysical conditions. In agreement with these results, our simulations indicate a complex, nonlinear relationship between the dust load and precipitation. While WRF-CHIMERE captured spatial precipitation patterns reasonably well, WRF-Chem significantly overestimated ground-level PM10, suggesting that emission schemes and model coupling strategies critically influence the simulation accuracy. All tested configurations demonstrated moderate-to-strong correlations with the observations (R > 0.60), but the WRF-CHIMERE model consistently yielded superior statistical performance, especially in its fully coupled mode (CPL4). This result aligns with previous findings (e.g., Menut et al., 2019 [20]; Deroubaix et al., 2022 [7]) showing enhanced reliability of online-coupled models in resolving aerosol–cloud processes.
In particular, the sensitivity simulations revealed an unexpected increase in CCN number concentrations when dust was removed from the domain. This counterintuitive behavior is likely due to shifts in aerosol hygroscopicity and altered activation dynamics, highlighting the sensitivity of microphysical schemes to particle composition. Such model behavior points to the importance of refining the treatment of aerosol mixing states and interactions within online coupled frameworks, pointing out the intricate microphysical feedback processes that can arise from aerosol composition changes.
Moreover, the domain-averaged precipitation changes were minimal, reinforcing the conclusion by Parajuli et al. (2022) [21] that dust-induced effects are often highly localized. The strongest discrepancies were observed in complex orographic regions, emphasizing the role of topography in modulating storm intensification and precipitation dynamics.
A key limitation of this study is the relatively short duration of the simulations and focus on a single case study. While the VAIA storm provides a valuable example of extreme aerosol–weather interaction, broader statistical analyses over multiple events would be necessary to generalize our findings. Additionally, improvements are needed in dust source parameterizations, vertical transport processes, and the integration of real-time observations for model validation.
Future research should prioritize the following:
  • Ensemble simulations with diverse aerosol schemes.
  • Coupling with satellite assimilation products.
  • Evaluating model performance across varied climatic and geographic settings.

7. Conclusions

This study provides valuable insights into the influence of desert dust on the spatial and temporal variations in precipitation, based on multi-model simulations of the VAIA storm over the Mediterranean. The key findings can be summarized as follows:
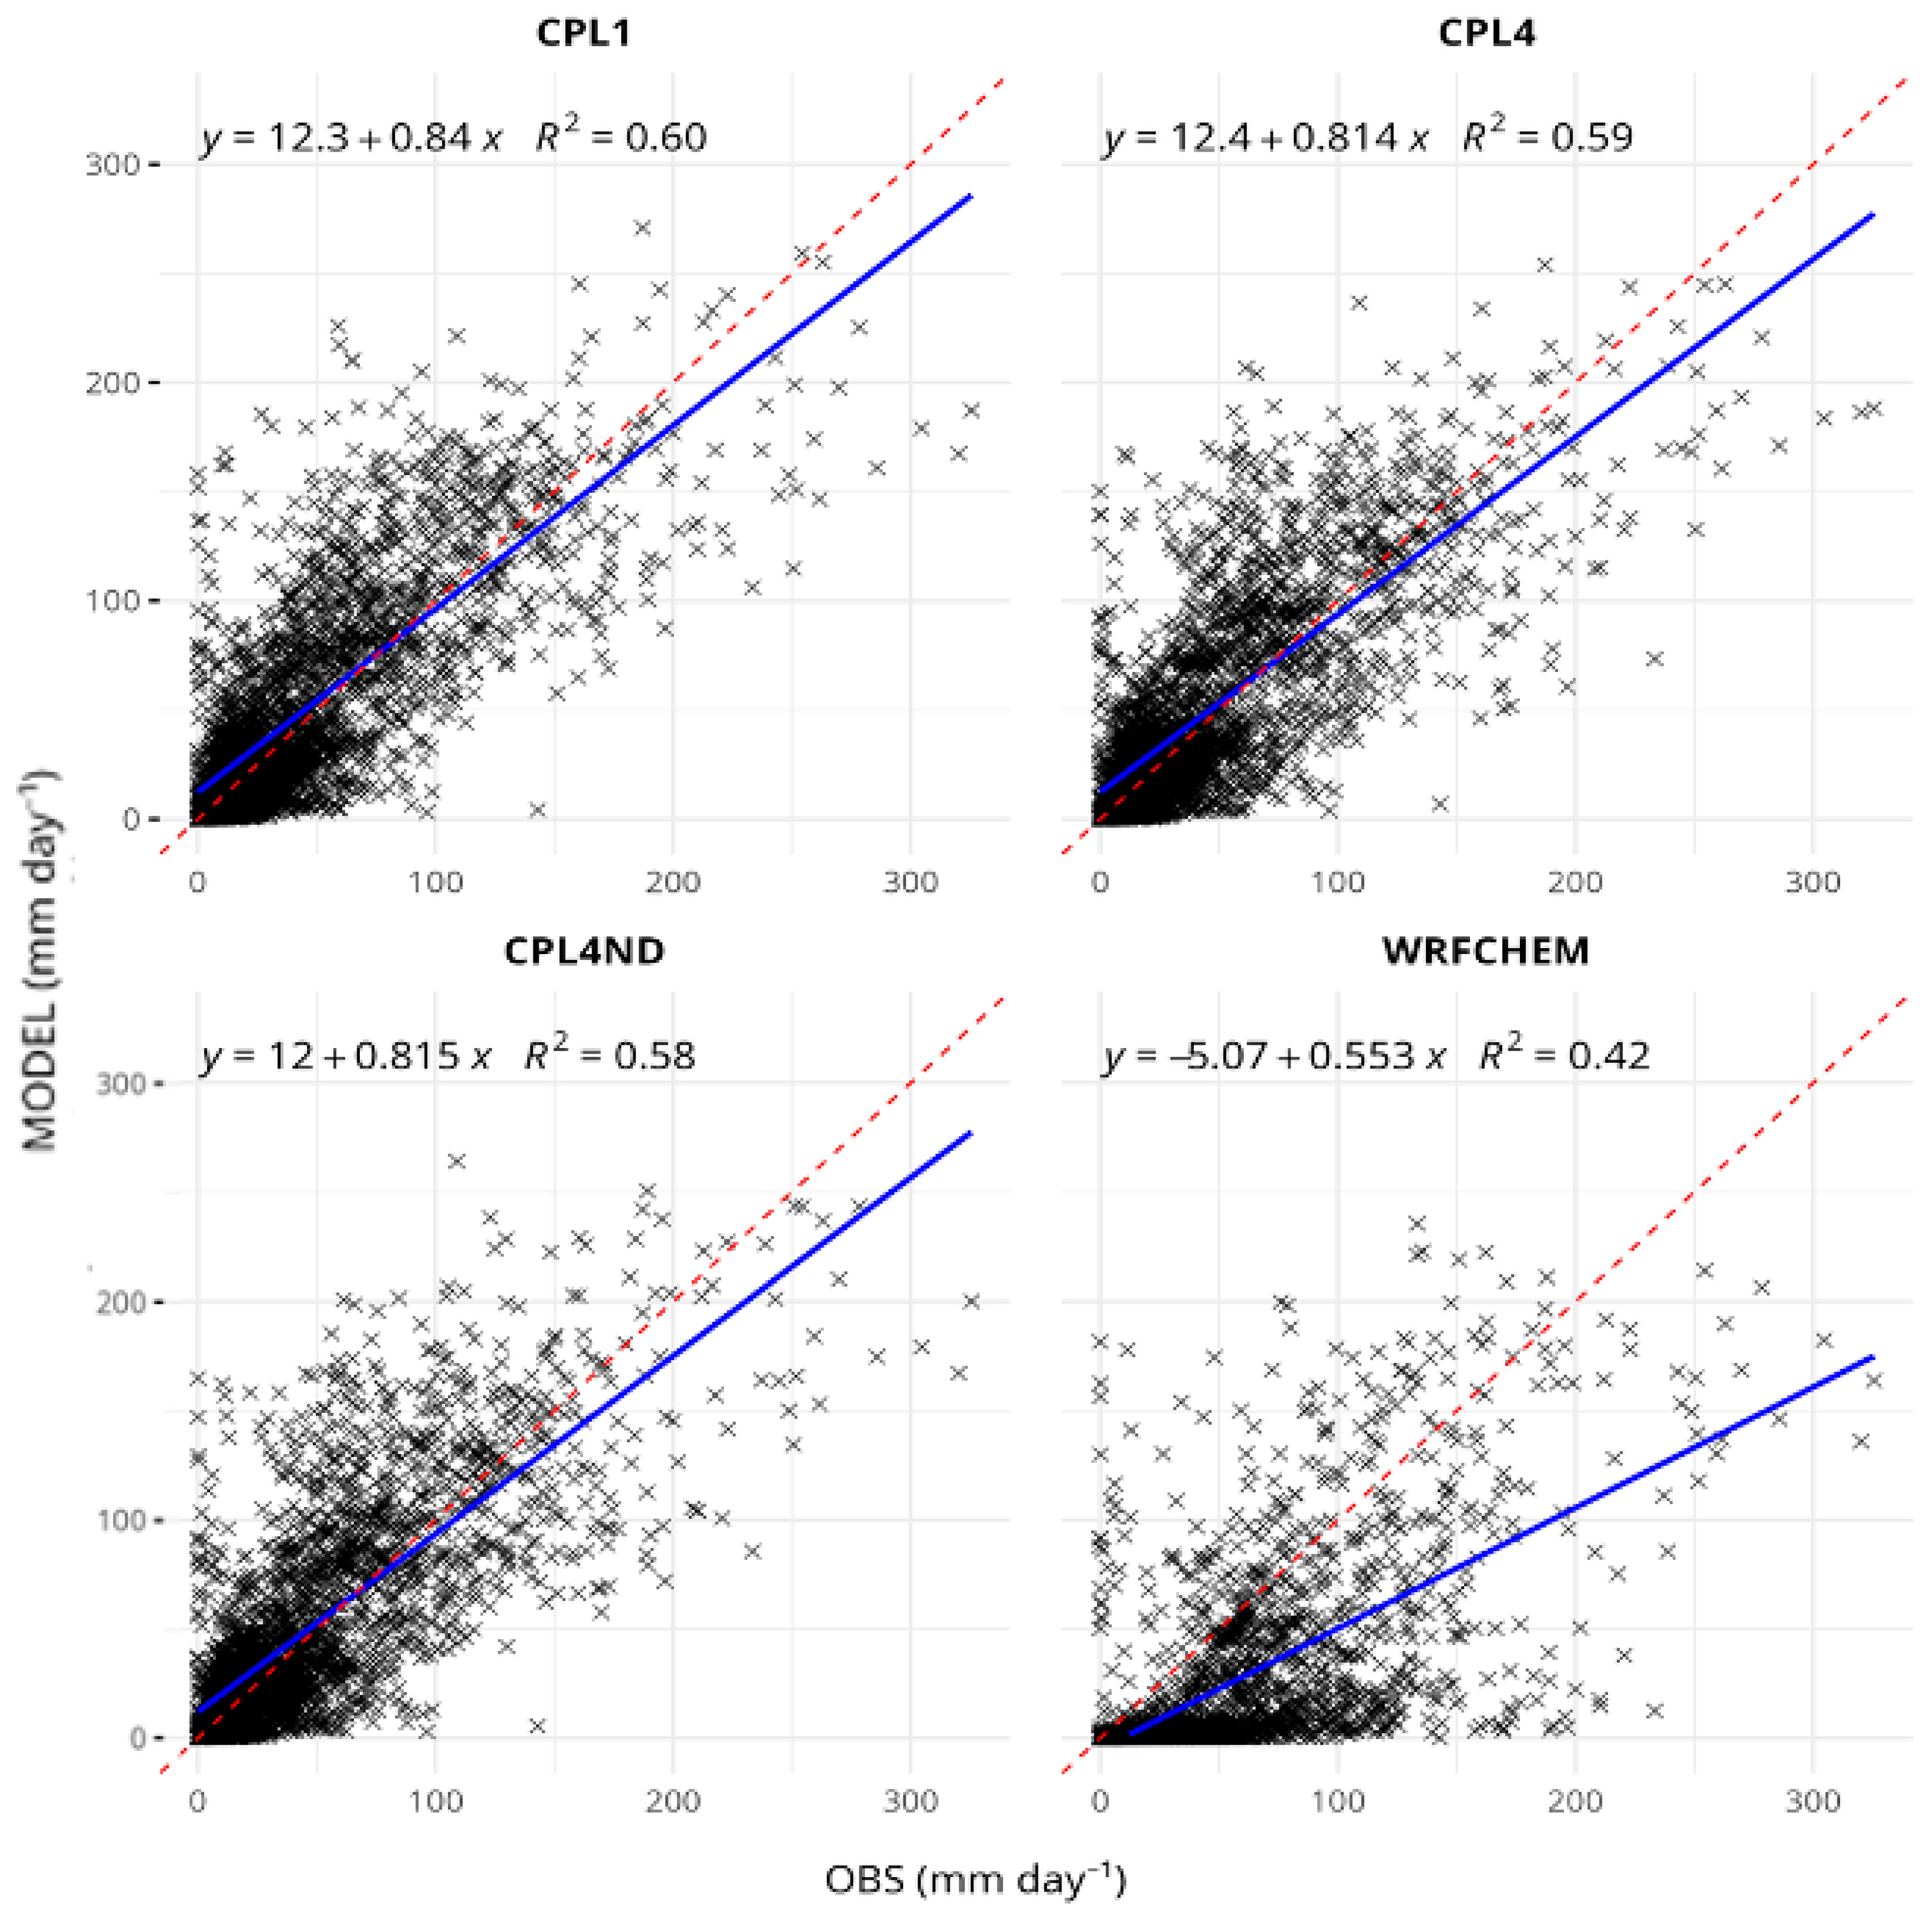
  • Both the WRF-CHIMERE and WRF-Chem models captured the overall precipitation patterns but significantly underestimated the 24 h rainfall at key locations (e.g., Malga Valine).
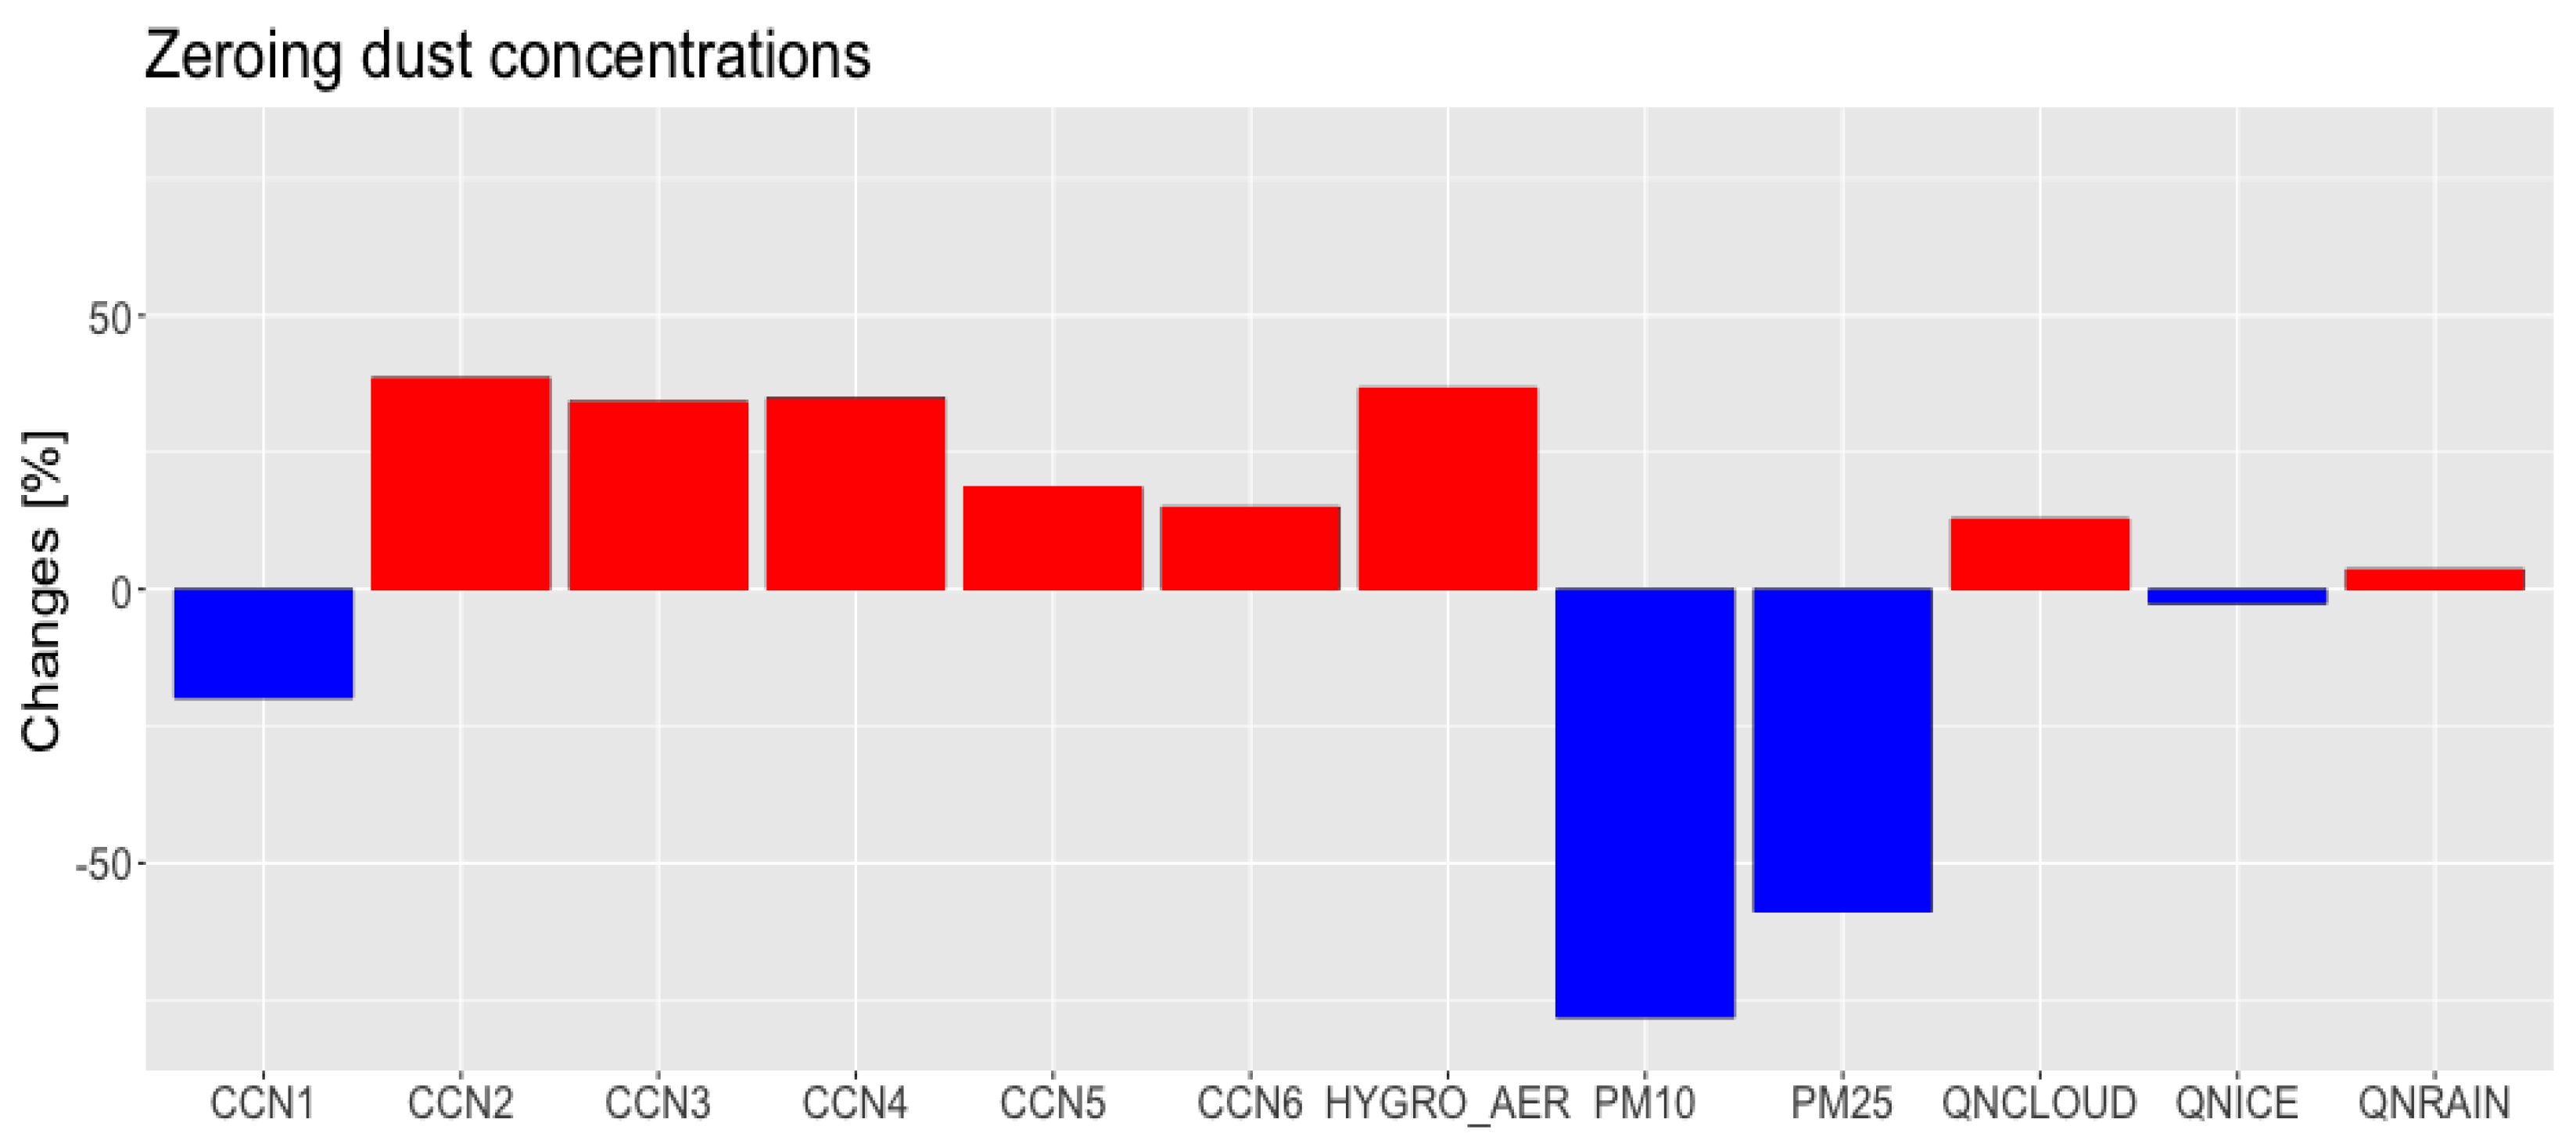
  • Simulations without dust showed up to 78% lower PM10 and 59% lower PM2.5 mass concentrations, but increased CCN numbers for most supersaturation thresholds due to changes in aerosol hygroscopicity.
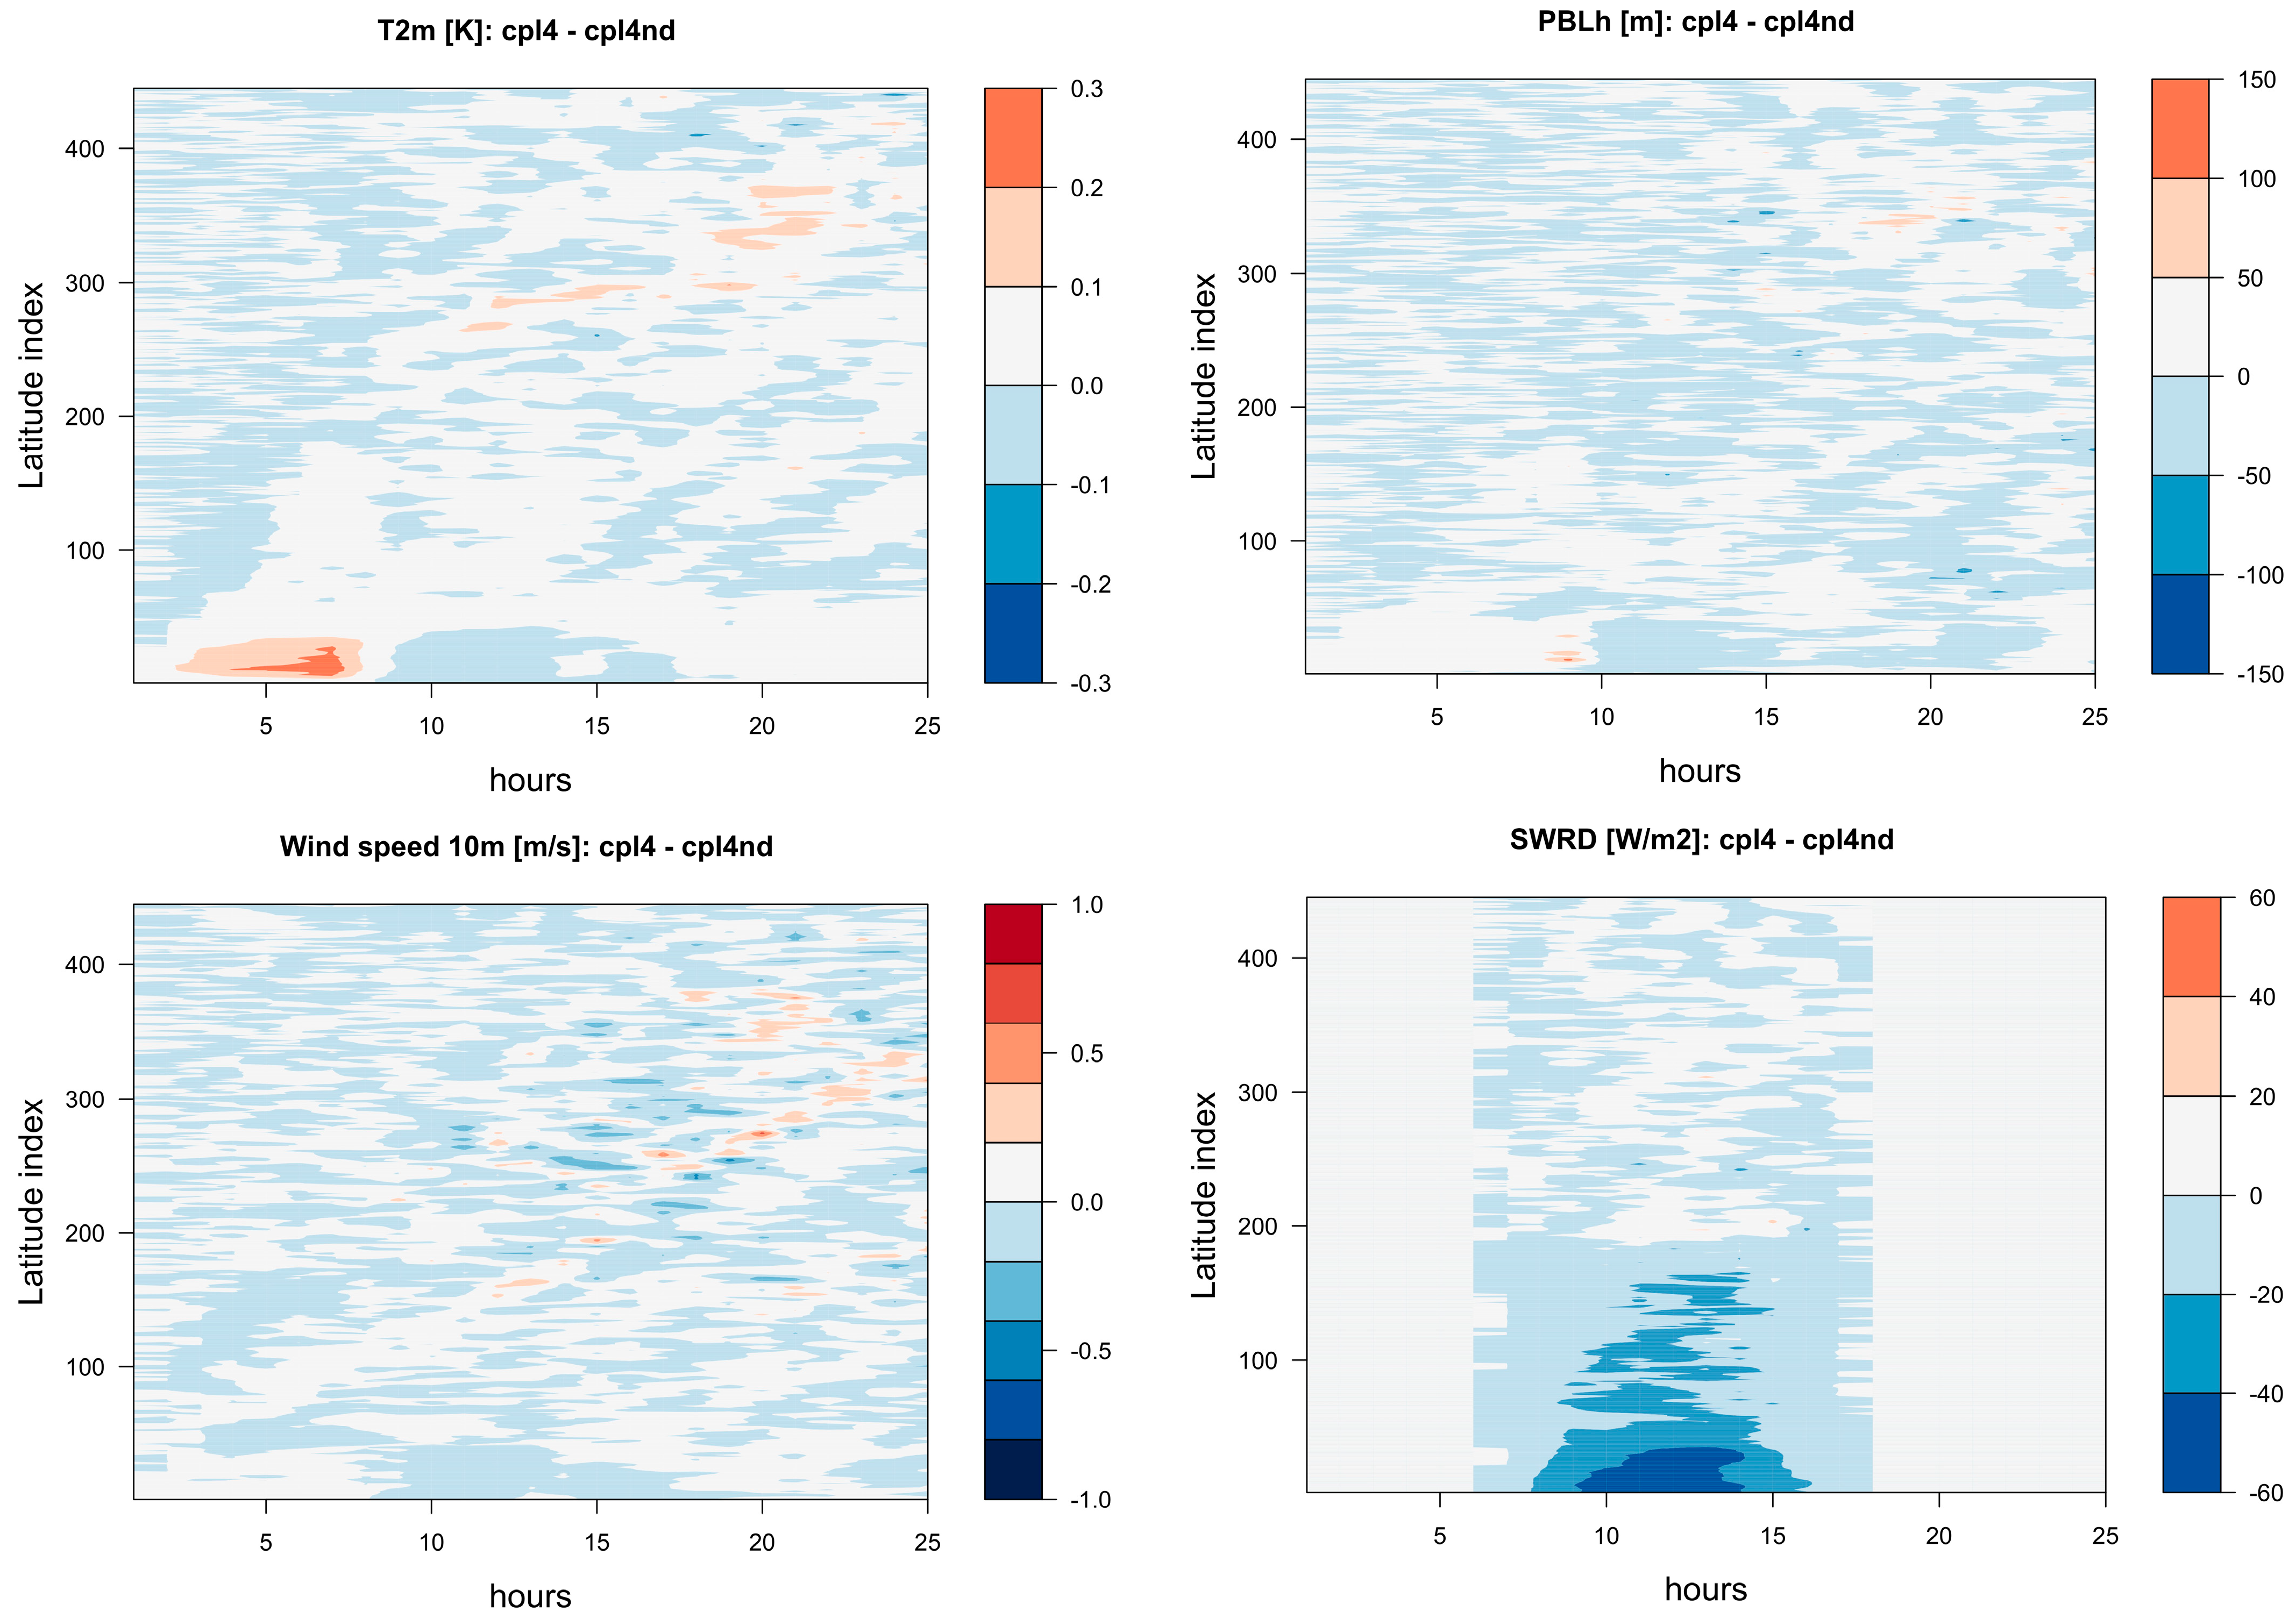
  • Domain-averaged impacts on total precipitation and temperature were limited, suggesting that dust effects are highly localized and dependent on the orography and microphysics.
  • WRF-Chem exhibited larger biases, pointing to the need for tuning the dust emission and aerosol coupling schemes.
  • The results underscore the complexity and context-dependence of aerosol–cloud–precipitation interactions, warranting further multi-event and ensemble-based investigations.
In conclusion, this paper provides a targeted and specific analysis of the impact of desert dust on heavy precipitation in the Italian region supported by a multi-model approach and sensitivity study.

Author Contributions

The initial concept and paper structure were developed by T.C.L. and U.R. T.C.L., U.R. and M.M. executed all model simulations required for the study. T.C.L. and M.M. analyzed and compared the model predictions with observational datasets. P.T. provided essential technical support for the numerical simulations on the HPC infrastructure and authored the WRF-CHIMERE model description. All authors contributed to the writing and review of the manuscript. T.C.L. prepared the final version of the paper for submission. All authors have read and agreed to the published version of the manuscript.

Funding

This research received no external funding.

Data Availability Statement

The data that support the findings of this study are available on request from the corresponding author, [T.C.L. and M.M.].

Acknowledgments

The authors thank Lin Su of Sun Yat-Sen University (SYSU) School of Atmospheric Sciences, Guangzhou (China), for sharing the modification of the WRF-Chem model, Fabio Grasso and Fabrizio Roccato of National Research Council, Institute of Atmospheric Science and Climate, for their invaluable technical support for model implementation onto the HPC infrastructure. This research benefited from the use of MODIS data, CAMS air quality data, and the WRF-Chem and WRF-CHIMERE modeling resources. The authors are grateful for the free access to these valuable tools. A special thanks to Domenico Trotta for his assistance in refining and editing the English language and style throughout the manuscript.

Conflicts of Interest

The authors declare no conflicts of interest.

References

  1. Andreae, M.; Rosenfeld, D. Aerosol–cloud–precipitation interactions. Part 1. The nature and sources of cloud-active aerosols. Earth-Sci. Rev. 2008, 89, 13–41. [Google Scholar] [CrossRef]
  2. Levy, H.; Horowitz, L.W.; Schwarzkopf, M.D.; Ming, Y.; Golaz, J.-C.; Naik, V.; Ramaswamy, V. The roles of aerosol direct and indirect effects in past and future climate change. J. Geophys. Res. Atmos. 2013, 118, 4521–4532. [Google Scholar] [CrossRef]
  3. Baklanov, A.; Brunner, D.; Carmichael, G.; Flemming, J.; Freitas, S.; Gauss, M.; Hov, Ø.; Mathur, R.; Schlu, K.H.; Seigneur, C.; et al. Key issues for seamless integrated chemistry–meteorology modeling. Bull. Am. Meteorol. Soc. 2017, 98, 2285–2292. [Google Scholar] [CrossRef] [PubMed]
  4. Raes, F.; Van Dingenen, R.; Vignati, E.; Wilson, J.; Putaud, J.-P.; Seinfeld, J.H.; Adams, P. Formation and cycling of aerosols in the global troposphere. Atmos. Environ. 2000, 34, 4215–4240. [Google Scholar] [CrossRef]
  5. Jacobson, M.Z. Global direct radiative forcing due to multicomponent anthropogenic and natural aerosols. J. Geophys. Res. Atmos. 2001, 106, 1551–1568. [Google Scholar] [CrossRef]
  6. Rosenfeld, D.; Andreae, M.O.; Asmi, A.; Chin, M.; de Leeuw, G.; Donovan, D.P.; Kahn, R.; Kinne, S.; Kiveka, N.; Kulmala, M.; et al. Global observations of aerosol-cloud-precipitation-climate interactions. Rev. Geophys. 2014, 52, 750–808. [Google Scholar] [CrossRef]
  7. Deroubaix, A.; Menut, L.; Flamant, C.; Knippertz, P.; Fink, A.H.; Batenburg, A.; Brito, J.; Denjean, C.; Dione, C.; Dupuy, R.; et al. Sensitivity of low-level clouds and precipitation to anthropogenic aerosol emission in southern west Africa: A dacciwa case study. Atmos. Chem. Phys. 2022, 22, 3251–3273. [Google Scholar] [CrossRef]
  8. Forkel, R.; Werhahn, J.; Hansen, A.B.; McKeen, S.; Peckham, S.; Grell, G.; Suppan, P. Effect of aerosol-radiation feedback on regional air quality—A case study with wrf/chem. Atmos. Environ. 2012, 53, 202–211. [Google Scholar] [CrossRef]
  9. Salah, Z.; Steiner, A.; Zakey, A.S.; Shalaby, A.; Wahab, M.A. An exploration of the aerosol indirect effects in east Asia using a regional climate model. Atmόsfera 2020, 33, 87–103. [Google Scholar] [CrossRef]
  10. Liu, X.; Easter, R.C.; Ghan, S.J.; Zaveri, R.; Rasch, P.; Shi, X.; Lamarque, J.-F.; Gettelman, A.; Morrison, H.; Vitt, F.; et al. Toward a minimal representation of aerosols in climate models: Description and evaluation in the community atmosphere model cam5. Geosci. Model Dev. 2012, 5, 709–739. [Google Scholar] [CrossRef]
  11. Twomey, S. Aerosols, clouds and radiation. Atmos. Environ. Part A Gen. Top. 1991, 25, 2435–2442. [Google Scholar] [CrossRef]
  12. Re, S.; Benedetti, A.; Bozzo, A.; Haiden, T.; Jones, L.; Razinger, M.; Flemming, J.; Engelen, R.; Peuch, V.; Thepaut, J. Feedbacks of dust and boundary layer meteorology during a dust storm in the eastern Mediterranean. Atmos. Chem. Phys. 2015, 15, 12909–12933. [Google Scholar]
  13. Galmarini, S.; Hogrefe, C.; Brunner, D.; Makar, P.; Baklanov, A. Special issue section evaluating coupled models (aqmeii p2) preface. Atmos. Environ. 2015, 115, 340–344. [Google Scholar] [CrossRef]
  14. Filonchyk, M.; Peterson, M.P.; Zhang, L.; Yan, H. An analysis of air pollution associated with the 2023 sand and dust storms over China: Aerosol properties and PM10 variability. Geosci. Front. 2024, 15, 101762. [Google Scholar] [CrossRef]
  15. Tiwari, S.; Kumar, H.; Singh, S.; Kumar, A. Current status of aerosol-cloud interactions and their impact over the Northern Indian Ocean: A comprehensive review. Atmos. Res. 2023, 283, 106555. [Google Scholar] [CrossRef]
  16. Zender, C.S.; Miller, R.; Tegen, I. Quantifying mineral dust mass budgets: Terminology, constraints, and current estimates. Eos. Trans. Am. Geophys. Union 2004, 85, 509–512. [Google Scholar] [CrossRef]
  17. Jacobson, M.Z.; Kaufman, Y.J. Wind reduction by aerosol particles. Geophys. Res. Lett. 2006, 33, L24814. [Google Scholar] [CrossRef]
  18. Miglietta, M.M. Mediterranean tropical-like cyclones (medicanes). Atmosphere 2019, 10, 206. [Google Scholar] [CrossRef]
  19. Varga, G. Changing nature of Saharan dust deposition in the Carpathian basin (central Europe): 40 years of identified north african dust events (1979–2018). Environ. Int. 2020, 139, 105712. [Google Scholar] [CrossRef]
  20. Menut, L.; Tuccella, P.; Flamant, C.; Deroubaix, A.; Gaetani, M. The role of aerosol–radiation–cloud interactions in linking anthropogenic pollution over southern west africa and dust emission over the sahara. Atmos. Chem. Phys. 2019, 19, 14657–14676. [Google Scholar] [CrossRef]
  21. Parajuli, S.P.; Stenchikov, G.L.; Ukhov, A.; Mostamandi, S.; Kucera, P.A.; Axisa, D.; Gustafson, W.I., Jr.; Zhu, Y. Effect of dust on rainfall over the red sea coast based on wrf-chem model simulations. Atmos. Chem. Phys. 2022, 22, 8659–8682. [Google Scholar] [CrossRef]
  22. Flaounas, E.; Davolio, S.; Raveh-Rubin, S.; Pantillon, F.; Miglietta, M.M.; Gaertner, M.A.; Hatzaki, M.; Homar, V.; Khodayar, S.; Korres, G.; et al. Mediterranean cyclones: Current knowledge and open questions on dynamics. prediction, climatology and impacts. Weather. Clim. Dyn. 2022, 3, 173–208. [Google Scholar] [CrossRef]
  23. DeMott, P.J.; Prenni, A.J.; McMeeking, G.R.; Sullivan, R.C.; Petters, M.D.; Tobo, Y.; Niemand, M.; Möhler, O.; Snider, J.R.; Wang, Z.; et al. Integrating laboratory and field data to quantify the immersion freezing ice nucleation activity of mineral dust particles. Atmos. Chem. Phys. 2015, 15, 393–409. [Google Scholar] [CrossRef]
  24. Fast, J.D.; Gustafson, W.I., Jr.; Easter, R.C.; Zaveri, R.A.; Barnard, J.C.; Chapman, E.G.; Grell, G.A.; Peckham, S.E. Evolution of ozone, particulates, and aerosol direct radiative forcing in the vicinity of Houston using a fully coupled meteorology-chemistry-aerosol model. J. Geophys. Res. Atmos. 2006, 111, D21305. [Google Scholar] [CrossRef]
  25. Briant, R.; Tuccella, P.; Deroubaix, A.; Khvorostyanov, D.; Menut, L.; Mailler, S.; Turquety, S. Aerosol–radiation interaction modelling using online coupling between the wrf 3.7.1 meteorological model and the chimere 2016 chemistry-transport model, through the oasis3-mct coupler. Geosci. Model Dev. 2017, 10, 927–944. [Google Scholar] [CrossRef]
  26. Tuccella, P.; Menut, L.; Briant, R.; Deroubaix, A.; Khvorostyanov, D.; Mailler, S.; Siour, G.; Turquety, S. Implementation of aerosol-cloud interaction within wrf-chimere online coupled model: Evaluation and investigation of the indirect radiative effect from anthropogenic emission reduction on the benelux union. Atmosphere 2019, 10, 20. [Google Scholar] [CrossRef]
  27. Menut, L.; Bessagnet, B.; Briant, R.; Cholakian, A.; Couvidat, F.; Mailler, S.; Pennel, R.; Siour, G.; Tuccella, P.; Turquety, S.; et al. The chimere v2020r1 online chemistry-transport model. Geosci. Model Dev. 2021, 14, 6781–6811. [Google Scholar] [CrossRef]
  28. Mailler, S.; Menut, L.; Khvorostyanov, D.; Valari, M.; Couvidat, F.; Siour, G.; Turquety, S.; Briant, R.; Tuccella, P.; Bessagnet, B.; et al. Chimere-2017: From urban to hemispheric chemistry-transport modeling. Geosci. Model Dev. 2017, 10, 2397–2423. [Google Scholar] [CrossRef]
  29. Craig, A.; Valcke, S.; Coquart, L. Development and performance of a new version of the oasis coupler, oasis3-mct 3.0. Geosci. Dev. 2017, 10, 3297–3308. [Google Scholar] [CrossRef]
  30. Iacono, M.J.; Delamere, J.S.; Mlawer, E.J.; Shephard, M.W.; Clough, S.A.; Collins, W.D. Radiative forcing by long-lived greenhouse gases: Calculations with the AER radiative transfer models. J. Geophys. Res. Atmos. 2008, 113, D13103. [Google Scholar] [CrossRef]
  31. Thompson, G.; Eidhammer, T. A study of aerosol impacts on clouds and precipitation development in a large winter cyclone. J. Atmos. Sci. 2014, 71, 3636–3658. [Google Scholar] [CrossRef]
  32. Abdul-Razzak, H.; Ghan, S.J. A parameterization of aerosol activation sectional representation. J. Geophys. Res. Atmos. 2002, 107, AAC 1-1–AAC 1-6. [Google Scholar] [CrossRef]
  33. Ghan, S.J.; Leung, L.R.; Easter, R.C.; Abdul-Razzak, H. Prediction of cloud droplet number in a general circulation model. J. Geophys. Res. Atmos. 1997, 102, 21777–21794. [Google Scholar] [CrossRef]
  34. Koop, T.; Luo, B.; Tsias, A.; Peter, T. Water activity as the determinant for homogeneous ice nucleation in aqueous solutions. Nature 2000, 406, 611–614. [Google Scholar] [CrossRef]
  35. Hong, S.-Y.; Noh, Y.; Dudhia, J. A new vertical diffusion package withan explicit treatment of entrainment processes. Mon. Weather Rev. 2006, 134, 2318–2341. [Google Scholar] [CrossRef]
  36. Chen, F.; Dudhia, J. Coupling an advanced land surface–hydrology model with the penn state–ncar mm5 modeling system. part I: Model implementation and sensitivity. Mon. Weather Rev. 2001, 129, 569–585. [Google Scholar] [CrossRef]
  37. Grell, G.A.; Freitas, S.R. A scale and aerosol aware stochastic convective parameterization for weather and air quality modeling. Atmos. Chem. Phys. 2014, 14, 5233–5250. [Google Scholar] [CrossRef]
  38. Derognat, C.; Beekmann, M.; Baeumle, M.; Martin, D.; Schmidt, H. Effect of biogenic volatile organic compound emissions on tropospheric chemistry during the atmospheric pollution over the paris area (esquif) campaign in the ile-de-france region. J. Geophys. Res. Atmos. 2003, 108, 8560. [Google Scholar] [CrossRef]
  39. Wild, O.; Zhu, X.; Prather, M.J. Fast-j: Accurate simulation of in and below-cloud photolysis in tropospheric chemical models. J. Atmos. Chem. 2000, 37, 245–282. [Google Scholar] [CrossRef]
  40. Bessagnet, B.; Hodzic, A.; Vautard, R.; Beekmann, M.; Cheinet, S.; Honoré, C.; Liousse, C.; Rouil, L. Aerosol modeling with chimere—Preliminary evaluation at the continental scale. Atmos. Environ. 2004, 38, 2803–2817. [Google Scholar] [CrossRef]
  41. Guenther, A.; Karl, T.; Harley, P.; Wiedinmyer, C.; Palmer, P.I.; Geron, C. Estimates of global terrestrial isoprene emissions using megan (model of emissions of gases and aerosols from nature). Atmos. Chem. Phys. 2006, 6, 3181–3210. [Google Scholar] [CrossRef]
  42. Menut, L.; Mailler, S.; Siour, G.; Bessagnet, B.; Turquety, S.; Rea, G.; Briant, R.; Mallet, M.; Sciare, J.; Formenti, P.; et al. Ozone and aerosol tropospheric concentrations variability analyzed using the adrimed measurements and the wrf and chimere models. Atmos. Chem. Phys. 2015, 15, 6159–6182. [Google Scholar] [CrossRef]
  43. Monahan, E.C. The ocean as a source of atmospheric particles. In The Role of Air-Sea Exchange in Geochemical Cycling; D. Reidel Publishing Company: Dordrecht, The Netherlands, 1986; pp. 129–163. [Google Scholar]
  44. Rizza, U.; Brega, E.; Caccamo, M.T.; Castorina, G.; Morichetti, M.; Munao, G.; Passerini, G.; Magazu, S. Analysis of the etna 2015 eruption using wrf–chem model and satellite observations. Atmosphere 2020, 11, 1168. [Google Scholar] [CrossRef]
  45. Niu, G.-Y.; Yang, Z.-L.; Mitchell, K.E.; Chen, F.; Ek, M.B.; Barlage, M.; Kumar, A.; Manning, K.; Niyogi, D.; Rosero, E.; et al. The community noah land surface model with multiparameterization options (noah-mp): 1. model description and evaluation with local-scale measurements. J. Geophys. Res. Atmos. 2011, 116, D12109. [Google Scholar] [CrossRef]
  46. Stauffer, D.R.; Seaman, N.L. Multiscale four-dimensional data assimilation. J. Appl. Meteorol. Climatol. 1994, 33, 416–434. [Google Scholar] [CrossRef]
  47. Ginoux, P.; Chin, M.; Tegen, I.; Prospero, J.M.; Holben, B.; Dubovik, O.; Lin, S.-J. Sources and distributions of dust aerosols simulated with the gocart model. J. Geophys. Res. Atmos. 2001, 106, 20255–20273. [Google Scholar] [CrossRef]
  48. Su, L.; Fung, J.C. Investigating the role of dust in ice nucleation within clouds and further effects on the regional weather system over east asia part 1: Model development and validation. Atmos. Chem. Phys. 2018, 18, 8707–8725. [Google Scholar] [CrossRef]
  49. LeGrand, S.L.; Polashenski, C.; Letcher, T.W.; Creighton, G.A.; Peckham, S.E.; Cetola, J.D. The afwa dust emission scheme for the gocart aerosol model in wrf-chem v3.8.1. Geosci. Model Dev. 2019, 12, 131–166. [Google Scholar] [CrossRef]
  50. Ukhov, A.; Ahmadov, R.; Grell, G.; Stenchikov, G. Improving dust simulations in wrf-chem v4.1.3 coupled with the gocart aerosol module. Geosci. Model Dev. 2020, 14, 473–493. [Google Scholar] [CrossRef]
  51. Rizza, U.; Kandler, K.; Eknayan, M.; Passerini, G.; Mancinelli, E.; Virgili, S.; Morichetti, M.; Nolle, M.; Eleftheriadis, K.; Vasilatou, V.; et al. Investigation of an intense dust outbreak in the mediterranean using xmed-dry network, multiplatform observations, and numerical modeling. Appl. Sci. 2021, 11, 1566. [Google Scholar] [CrossRef]
  52. Kaufman, Y.J.; Wald, A.E.; Remer, L.A.; Gao, B.-C.; Li, R.-R.; Flynn, L. The modis 2.1-/spl mu/m channel-correlation with visible reflectance for use in remote sensing of aerosol. IEEE Trans. Geosci. Remote Sens. 1997, 35, 1286–1298. [Google Scholar] [CrossRef]
  53. Hsu, N.; Jeong, M.-J.; Bettenhausen, C.; Sayer, A.; Hansell, R.; Seftor, C.; Huang, J.; Tsay, S.-C. Enhanced deep blue aerosol retrieval algorithm: The second generation. J. Geophys. Res. Atmos. 2013, 118, 9296–9315. [Google Scholar] [CrossRef]
  54. Remer, L.A.; Tanr, D.; Kaufman, Y.J.; Levy, R.; Mattoo, S. Algorithm for Remote Sensing of Tropospheric Aerosol from Modis: Collection 005; National Aeronautics and Space Administration: Washington, DC, USA, 2006. [Google Scholar]
  55. Davolio, S.; Della Fera, S.; Laviola, S.; Miglietta, M.M.; Levizzani, V. Heavy precipitation over Italy from the Mediterranean storm “Vaia” in October 2018: Assessing the role of an atmospheric river. Mon. Weather Rev. 2020, 148, 3571–3588. [Google Scholar] [CrossRef]
  56. European Commission. Commission Implementing Decision 2011/850/EU of 12 December 2011 laying down rules for the timing, format and submission of information by Member States pursuant to Directive 2007/2/EC of the European Parliament and of the Council on the spatial information infrastructure in the European Community (INSPIRE). Off. J. Eur. Union 2011, L335, 15–22. [Google Scholar]
Figure 1. The integration domains considered for this study. (Left panel): integration domain of WRF-Chem run. It is centered over Tunisia with a grid spacing of about 5 km. (Right panel): integration domains of WRF-CHIMERE simulation considered for this study; a European domain with a 15 km horizontal resolution and a nested domain centered over Italy, with a grid spacing of about 3 km.
Atmosphere 16 00745 g001
Figure 2. (a) The atmospheric river representation, taken by Davolio et al., 2020 [55], (a) at 18:00 UTC on 28 October 2018 (blue shading), along with the geopotential height at 700 hPa (m; contours). The dashed line in (a) indicates the location of (b), which displays the vertical cross-section of the water vapor flux (g m−2 s−1; color shading) and the normal wind speed component (m s−1; contour lines every 5 m s−1; dashed contour lines represent negative values).
Atmosphere 16 00745 g002
Figure 3. AOD at 550 nm from Modis Aqua on October 29 (left panel); AOD at 550 nm from Modis Aqua on October 30 (right panel).
Atmosphere 16 00745 g003
Figure 4. Map of daily PM10 concentrations at ground level for the 29 October 2018. The CAMS European air quality interim reanalysis, provided by COPERNICUS European air quality service and produced by COPERNICUS Atmosphere Monitoring Service (left panel) and WRF-CHIMERE (center panel) appear quite similar, while WRF-CHEM (right panel) significantly overestimates the particulate matter mass concentrations.
Atmosphere 16 00745 g004
Figure 5. Comparison of accumulated daily precipitation for 29 October 2018 over Italian peninsula between observations (upper panel) and the WRF-CHIMERE and WRF-CHEM simulations, performed by using different settings: WRF-CHIMERE offline (a), online (b), online no dust (c), and WRF/Chem online (d).
Atmosphere 16 00745 g005
Figure 6. Scatter plots of simulated 24 h accumulated rainfall for 29 October 2018 (i.e., CPL1, CPL4, CPL4nd, and WRF-Chem) versus observed values using the Random Generator of Spatial Interpolation from uncertain Observations (i.e., GRISO). Each panel reports the correlation coefficient (R2), the corresponding regression equation, the 1:1 reference line (red dashed), and the best-fit linear regression line (blue) (Npoint = 2724).
Atmosphere 16 00745 g006
Figure 7. Hourly measured precipitation (gray bars) at Malga Valine compared with WRF-CHIMERE predictions with different settings: offline (black line), online (red line), online zeroing dust (blue line), and WRF-CHEM in fully coupled mode (green line).
Atmosphere 16 00745 g007
Figure 8. Percentage differences resulting from zeroing the dust concentrations for testing by running WRF-CHIMERE in online mode on key parameters, such as CCN, aerosol hygroscopicity, and liquid droplet and ice nuclei number. The values refer to the overall integration domain. The blue and the red colors represent the negative and positive values, respectively.
Atmosphere 16 00745 g008
Figure 9. Hovmoller diagram of absolute differences, cpl4-cpl4nd, of surface temperature (upper left panel), planetary boundary layer height (upper right panel), wind speed (lower left panel), and shortwave radiation (lower right panel).
Atmosphere 16 00745 g009
Table 1. Different runs performed by the WRF-CHIMERE model.
WRF-CHIEMERE Runs
LabelCPL1CPL4CPL4nd
Couplingofflineonlineonline
Aerosolsall speciesall speciesall species without dust
Table 2. Summary of the statistics between simulated (i.e., CPL1, CPL4, CPL4nd, and WRF-Chem) and observed values of 24 h accumulated rainfall for 29 October 2018 using the Random Generator of Spatial Interpolation from uncertain Observations (i.e., GRISO). The table reports the values of the mean bias (MB—mm day−1), Root Mean Square Error (RMSE—mm day−1), Mean Absolute Error (MAE—mm day−1), and Pearson’s Coefficient (r—dimensionless).
CPL1CPL4CPL4ndWRF-Chem
MB5.013.883.56−25.22
RMSE32.8132.7533.4244.22
MAE22.2522.1822.3531.68
R0.770.770.760.65
Disclaimer/Publisher’s Note: The statements, opinions and data contained in all publications are solely those of the individual author(s) and contributor(s) and not of MDPI and/or the editor(s). MDPI and/or the editor(s) disclaim responsibility for any injury to people or property resulting from any ideas, methods, instructions or products referred to in the content.

