Article

Projections of Extreme Precipitation Changes over the Eastern Tibetan Plateau: Exploring Thermodynamic and Dynamic Contributions

1
State Grid Sichuan Electric Power Company Electric Power Research Institute, Chengdu 610041, China
2
School of Atmospheric Sciences, Chengdu University of Information Technology, Chengdu 610225, China
*
Authors to whom correspondence should be addressed.
Atmosphere 2025, 16(6), 664; https://doi.org/10.3390/atmos16060664
Submission received: 25 April 2025 / Revised: 15 May 2025 / Accepted: 30 May 2025 / Published: 31 May 2025
(This article belongs to the Section Meteorology)

Abstract

The Eastern Tibetan Plateau (ETP), characterized by its intricate topography and pronounced altitudinal gradient, presents significant challenges for climate model simulations. This study assesses precipitation over the ETP using high-resolution (HR) and low-resolution (LR) models from CMIP6 HighResMIP. Both HR and LR models successfully reproduce the spatial distribution of annual precipitation, capturing the northwest-to-southeast increasing gradient. However, HR models significantly outperform LR models, reducing the annual mean precipitation bias from 1.09 mm/day to 1.00 mm/day (9% reduction, p < 0.05, two-tailed Student’s t-test) and decreasing RMSE by 12% (p < 0.05) in the ETP for the 1985–2014 period. Furthermore, HR models exhibit superior skill in simulating extreme precipitation events, particularly over the Sichuan Basin. For the 1985–2014 period, HR models show markedly smaller biases in representing extreme precipitation and accurately reflect observed trends. Projections for the future suggest a pronounced intensification of extreme precipitation events across the region. Process-based scaling diagnostics attribute these changes predominantly to dynamical components, which account for approximately 85% of the total scaling change in HR models and 89% in LR models. These findings underscore the pivotal role of dynamical processes in shaping extreme precipitation and highlight the advantages of HR models in enhancing simulation fidelity. This study provides critical insights into climate model performance, offering robust information to inform climate mitigation and adaptation strategies tailored for the ETP.

1. Introduction

Extreme precipitation events rank among the most consequential climatic phenomena, exerting profound impacts on hydrological cycles, the resilience of infrastructure, and the stability of ecosystems [1,2,3,4,5]. Understanding the variability and future projections of extreme precipitation events is especially vital for regions such as the Eastern Tibetan Plateau (ETP), distinguished by its intricate topography and pronounced altitude gradients. The ETP’s unique geographical and climatic attributes not only shape local weather patterns but also play a pivotal role in regulating regional hydrological systems [6,7,8]. Extreme precipitation events in this region frequently set off cascading effects, such as landslides, flooding, and disruptions to agriculture and water resources. These far-reaching consequences underscore the critical importance of examining the characteristics of extreme precipitation and their future trajectories, establishing this as a pressing area of research.
Simulating extreme precipitation in the ETP poses a formidable challenge due to its complex topography and pronounced altitudinal gradients [9,10,11,12,13]. This challenge stems from the complex interplay of thermodynamic and dynamic processes that govern precipitation patterns, coupled with the inherent difficulty of accurately capturing fine-scale topographic features [14,15,16,17,18]. Traditional low-resolution (LR) climate models have yielded valuable insights into large-scale climatic phenomena. However, their coarse spatial resolution often limits their ability to accurately capture localized precipitation extremes [9,19]. The persistent biases in simulating the spatial distribution of precipitation, especially over regions such as the Hengduan Mountains and the Sichuan Basin, underscore the inherent limitations of these models [20,21,22,23]. These shortcomings highlight the pressing need for higher-resolution models to improve the accuracy of precipitation projections. Recent advancements in high-resolution (HR) modeling, as exemplified by the CMIP6 HighResMIP initiative, present promising solutions. HR models exhibit an enhanced capacity to resolve fine-scale climatic processes, particularly those involving the intricate interactions between atmospheric dynamics and topographic features [24,25,26,27]. Preliminary assessments indicate that HR models significantly mitigate biases and more effectively capture observed precipitation trends. However, their capacity to illuminate the physical mechanisms underlying future changes in extreme precipitation—particularly the relative contributions of thermodynamic and dynamic processes—remains insufficiently explored.
This study seeks to bridge these gaps by systematically assessing the performance of CMIP6 HighResMIP models in simulating both historical and future extreme precipitation over the ETP. We utilize diagnostic scaling methods to disentangle the contributions of thermodynamic and dynamic processes to changes in extreme precipitation [28]. Thermodynamic effects, primarily driven by shifts in atmospheric moisture, and dynamic effects, associated with variations in vertical atmospheric circulation, are examined to elucidate their respective roles. By identifying the predominant drivers of these changes, we aim to offer essential insights into the mechanisms underlying extreme precipitation variability and their potential implications in future climate scenarios. A primary motivation for this research is the urgent need to generate robust scientific evidence that can guide climate adaptation and risk management strategies in the region. The ETP is home to numerous vulnerable communities and ecosystems that face growing exposure to the adverse impacts of climate change. Accurate simulations and dependable projections of extreme precipitation are critical for formulating effective mitigation strategies, including enhanced flood management systems and sustainable water resource planning. Moreover, a deeper understanding of the underlying physical mechanisms can refine climate models and reduce uncertainties in future projections.
To accomplish these objectives, this study analyzes daily precipitation data from 14 CMIP6 HighResMIP models, comparing the outputs of high-resolution (HR) and low-resolution (LR) models against observational datasets for the 1985–2014 period. Extreme precipitation indices, as recommended by the Expert Team on Climate Change Detection and Indices (ETCCDI), are employed to evaluate model performance and project future changes. Additionally, diagnostic scaling methods are applied to quantify the contributions of thermodynamic and dynamic processes to projected shifts in extreme precipitation. The findings of this study are poised to deepen our understanding of extreme precipitation dynamics in regions with complex terrain. By showcasing the advantages of high-resolution models and identifying the key drivers of precipitation changes, this work offers critical insights for enhancing climate model accuracy and advancing climate adaptation strategies.
Through this comprehensive investigation, we seek to establish a solid foundation for more accurate and reliable projections of extreme precipitation over the ETP. The results will not only enhance the broader scientific understanding of extreme precipitation but also provide a valuable resource for policymakers and stakeholders responsible for managing climate risks in this ecologically sensitive and socioeconomically crucial region.

2. Materials and Methods

2.1. Observational Data

In this study, the ETP is located between 24 and 34° N and between 95 and 110° E (Figure 1).
In this research, we utilize the CN05.1 daily precipitation grid dataset as our observational reference, covering the period from 1961 to 2014 [29,30]. CN05.1 is renowned for its precision in representing regional near-surface meteorological conditions and has been frequently utilized for the assessment of climate models [19,31,32].

2.2. Model Data

The study encompasses daily precipitation data from 14 CMIP6 HighResMIP models [33]. The study incorporates data from 14 models, split evenly between high and low resolution, with an emphasis on atmospheric simulations spanning from 1985 to 2014 for historical data, and from 2020 to 2049 for projections into the future. CMIP6 HighResMIP future data only focuses on SSP370 [34]. A summary of the models is detailed in Table 1. In this study, the model data are interpolated to a consistent 0.25° × 0.25° grid as that of the observational data.

2.3. Extreme Precipitation Indices

In this research, we have utilized the extreme precipitation indices endorsed by the Expert Team on Climate Change Detection and Indices (ETCCDI), as shown in Table 2. These are: consecutive dry days (CDD), consecutive wet days (CWD), heavy precipitation days (R10mm), very wet days (R95p), highest 1-day precipitation amount (Rx1day), and simple daily intensity index (SDII).

2.4. Extreme Precipitation Indices

Two metrics are used to assess how well the HighResMIP models simulate extreme precipitation events.
The ratio of the standard deviation (RSD) is used to recognize information about the differences in amplitude between the models and the observations:
R S D = σ m σ o ,
where σ m   and σ o are the spatial standard deviation of the model runs and the observational data, respectively. For each year within the 1985–2014 period (or other relevant time periods), we calculate the precipitation value at each grid point. Then, we compute the average precipitation across all grid points for that year. After obtaining the average precipitation values for all years in the dataset, we calculate the standard deviation of these values. This resulting standard deviation is the spatial standard deviation, which measures the variability of precipitation values across the spatial grid points in the dataset. A value closer to unity represents a better match of variabilities between the model simulation and the observational dataset.
The Root Mean Square Error (RMSE) is used to quantify the differences between the values simulated by the models and the corresponding values from the observations:
RMSE = 1 n i = 1 n ( M i O i ) 2 ,
where M i represents the values from the models at the i-th grid point, O i represents the values from the observations at the same grid point, and n is the total number of grid points.

2.5. Physical Scaling Diagnostic

Using the Physical Scaling Diagnostic, this research quantitatively assesses how thermodynamic and dynamic processes influence changes in extreme precipitation events [28].
δ P e ~ δ ω e d q s d p θ * = δ T H + δ D Y + R e s
δ T H = ω e h i s ( d q s d p θ * ) f u r ω e h i s ( d q s d p θ * ) h i s
δ D Y = ω e f u r ( d q s d p θ * ) h i s ω e h i s ( d q s d p θ * ) h i s
δ = f u r h i s
In this context, P e represents extreme precipitation, ωe denotes the vertical ascending velocity (Pa/s) at the time of extreme precipitation, d q s d p θ * is the vertical derivative of saturation specific humidity when the saturation equivalent potential temperature is constant, {⋅} denotes the mass-weighted vertical integral over all ascending layers in the troposphere, his and fur denote historical (1985–2014) and future (2020–2049) periods, δTH represents the thermodynamic effect caused by changes in saturation specific humidity, and δDY represents the dynamic effect due to changes in vertical velocity. According to the physical scaling diagnostic equation, changes in precipitation amount (δPe) can be decomposed into the change in thermodynamic effect (δTH), the change in dynamic effect (δDY), and the residual (Res). Since the residual is much smaller in magnitude compared to the other terms, its contribution to precipitation can be considered negligible.

3. Results

3.1. Model Performance

Figure 2 depicts the spatial distribution of precipitation over the eastern Tibetan Plateau, revealing pronounced heterogeneity, with a gradient of increasing precipitation from northwest to southeast. During the 1985–2014 period, the CMIP6 HighResMIP models were generally able to reasonably capture the overall precipitation pattern. However, comparisons between low-resolution (LR) models and observational data reveal a consistent overestimation of precipitation near the Hengduan Mountains and the eastern margin of the plateau (Figure 2b–h). Notably, models such as CMCC-CM2-HR4, CNRM-CM6-1, and MPI-ESM1-2-HR exhibit a northward displacement of the simulated precipitation belt. In contrast, high-resolution (HR) models show distinct advantages in simulating precipitation, particularly around 30° N (Figure 2j–q), where the simulated rain belts more closely align with observations, effectively capturing the precipitation gradient from the plateau to the basin. Furthermore, the multi-model ensemble mean of HR models (MME-HR, Figure 2r) shows a slightly smoother spatial distribution of precipitation compared to the ensemble mean of LR models (MME-LR, Figure 2i), though both exhibit similar overall patterns.
Figure 3 illustrates the differences in spatial precipitation distribution between low-resolution (LR) and high-resolution (HR) model simulations and observational data. In most LR models (Figure 3a–g), wet biases are evident over the plateau region, while dry biases are observed in the Sichuan Basin, southern Guizhou, northern Guangxi, and parts of Yunnan. In contrast, HR models show smaller precipitation biases (Figure 3i–o), with area-averaged absolute biases ranging from 0.67 to 2.01 mm/day, lower than those in LR models (area-averaged absolute biases of 0.99 to 2.03 mm/day). The multi-model ensemble mean (MME) bias decreases from 1.09 mm/day in LR models to 1.00 mm/day in HR models (9% reduction, p < 0.05, two-tailed Student’s t-test). In the Sichuan Basin, HR models reduce RMSE by 12% (p < 0.05) compared to LR models, particularly for extreme precipitation indices like Rx1day.Notably, the EC-Earth3P-HR and CNRM-CM6-1-HR models exhibit relatively low biases, while models such as HadGEM3-GC31 and MPI-ESM1-2 show comparatively higher biases. These results suggest that divergent convective parameterizations across models contribute to variations in precipitation simulations [33]. A comparison of LR and HR models reveals that the latter significantly reduces wet biases along the eastern edge of the Tibetan Plateau and the Hengduan Mountains, with the area-averaged bias of the multi-model ensemble mean of HR models (MME-HR) at 1.09 mm/day, lower than that of LR models (MME-LR) at 1.00 mm/day. These findings underscore the critical role of model resolution in simulating precipitation distribution. While an increase in resolution leads to a reduction in overall precipitation bias, substantial biases persist in regions with complex terrain, such as the eastern Tibetan Plateau and Hengduan Mountains, highlighting that CMIP6 HighResMIP models still face challenges in simulating precipitation in such areas.
To further investigate the characteristics of extreme precipitation events over the eastern Tibetan Plateau, Figure 4 presents the RMSE and RSD of extreme precipitation indices for both high- and low-resolution models, compared against observational datasets. Lighter grid cells indicate more accurate simulations. Significant differences in model performance are evident, with most HR models demonstrating superior simulation skills. Among the LR models, five exhibit large RMSE values for CDD (over 3.5), while only two HR models show poor performance, suggesting that HR models are more adept at simulating CDD. However, for R95p, HR models underperform relative to LR models. Overall, the multi-model ensemble mean (MME) consistently outperforms individual models in terms of RMSE, and its RSD values are closer to 1, indicating superior performance. Consequently, to minimize uncertainty, the following analysis will focus on the MME, as it provides more reliable results for simulating extreme precipitation over the Eastern Tibetan Plateau.

3.2. Projection of Extreme Precipitation

Figure 5 illustrates the spatial distribution of future extreme precipitation events, comparing projections from high-resolution (HR) and low-resolution (LR) models, both of which exhibit similar trends. Significant changes in extreme precipitation are expected across the eastern Tibetan Plateau, particularly in the Sichuan Basin. With the exception of CWD, most areas are projected to experience marked increases in extreme precipitation, characterized by both a broad spatial extent and heightened intensity. Under the LR scenario, CWD is projected to decrease by more than 24 days near the Hengduan Mountains, with a more substantial reduction than under the HR scenario (Figure 5c,d). These findings suggest that, in a warmer future climate, the Eastern Tibetan Plateau is likely to experience shorter precipitation periods by the end of the century. CDD shows an increasing trend in both scenarios, except in the northern regions of the plateau (Figure 5a,b). Indices such as R10mm, R95p, Rx1day, and SDII consistently show increases, with the Sichuan Basin exhibiting higher rates of change than other areas (Figure 5e–l), signaling a significant rise in both the frequency and intensity of extreme precipitation events.
Regionally, all indices, with the exception of CWD, show substantial increases (Figure 6). Rx1day exhibits the most pronounced rise, with regional mean increases of 31% and 49% for the LR and HR scenarios, respectively. For the remaining indices, the LR scenario generally shows a greater magnitude of change than the HR scenario. Overall, in response to global warming and human emissions, both LR and HR models predict a trend toward more intense precipitation extremes across much of the Eastern Tibetan Plateau, with heavier yet shorter-duration extreme precipitation events anticipated by mid-century.

3.3. Thermodynamic and Dynamic Contributions

To explore the underlying mechanisms driving future changes in extreme precipitation events, we employ the diagnostic scaling method to decompose these extremes into thermodynamic and dynamic components. In line with previous studies, Rx1day, which has already been analyzed, is selected as the representative index to capture changes in extreme precipitation [28]. As illustrated in Figure 7, the scaling estimates for precipitation changes effectively capture the differences in extreme precipitation between the periods 2020–2049 and 1985–2014, with spatial correlations between the scaling estimates and Rx1day exceeding 0.8 (Figure 7a,b). The increase in extreme precipitation is predominantly driven by the dynamic scaling component, which plays a leading role in shaping the overall regional changes (Figure 7g,h). In contrast to the consistent rise observed in thermodynamic scaling, dynamic scaling exhibits significant regional variations. Notably, the contribution from dynamic scaling is much larger in the Sichuan Basin (Figure 7g,h). These thermodynamic changes closely align with variations in the vertically integrated saturation specific humidity (Figure 7i,j), while dynamic scaling correlates with the vertical mean of vertical velocity (Figure 7k,l). This reinforces the notion that the thermodynamic component is largely influenced by changes in saturation specific humidity, while the dynamic component is primarily driven by changes in vertical velocity. The spatial correlation between the scaling estimates and dynamic scaling exceeds 0.9, underscoring the profound influence of dynamic scaling on the spatial distribution of extreme precipitation patterns. These findings are consistent with prior global-scale studies [28].
For the regional mean results from the multi-model ensemble, the thermodynamic component (δTH) shows a change of 6.1% (5.0%) in HR (LR) models, while the dynamic component (δDY) increases by 41.4% (34.6%) in HR (LR) models (Figure 8a). In both HR and LR models, the dynamic contribution (δDY) accounts for approximately 85% (89%) of the total scaling change, while the thermodynamic contribution (δTH) represents around 13% (7%) (Figure 8b). When compared to changes in atmospheric saturation specific humidity, the increase in vertical atmospheric circulation is identified as the primary driver behind the projected rise in extreme precipitation. Overall, on the eastern Tibetan Plateau, the intensification of Rx1day is primarily driven by the dynamic contribution. By mid-century, changes in vertical wind speed are expected to amplify the hydrological cycle, a factor closely linked to shifts in precipitation extremes.

4. Discussion

This study examines projected changes in extreme precipitation over the Eastern Tibetan Plateau (ETP) during the mid-21st century, in comparison to the historical period, utilizing CMIP6 HighResMIP models under different resolution scenarios. By applying diagnostic methods for extreme precipitation, we assess the scaling of Rx1day and analyze the relative contributions of thermodynamic and dynamic mechanisms to the anticipated changes in extreme precipitation. The key findings are as follows.
(1)
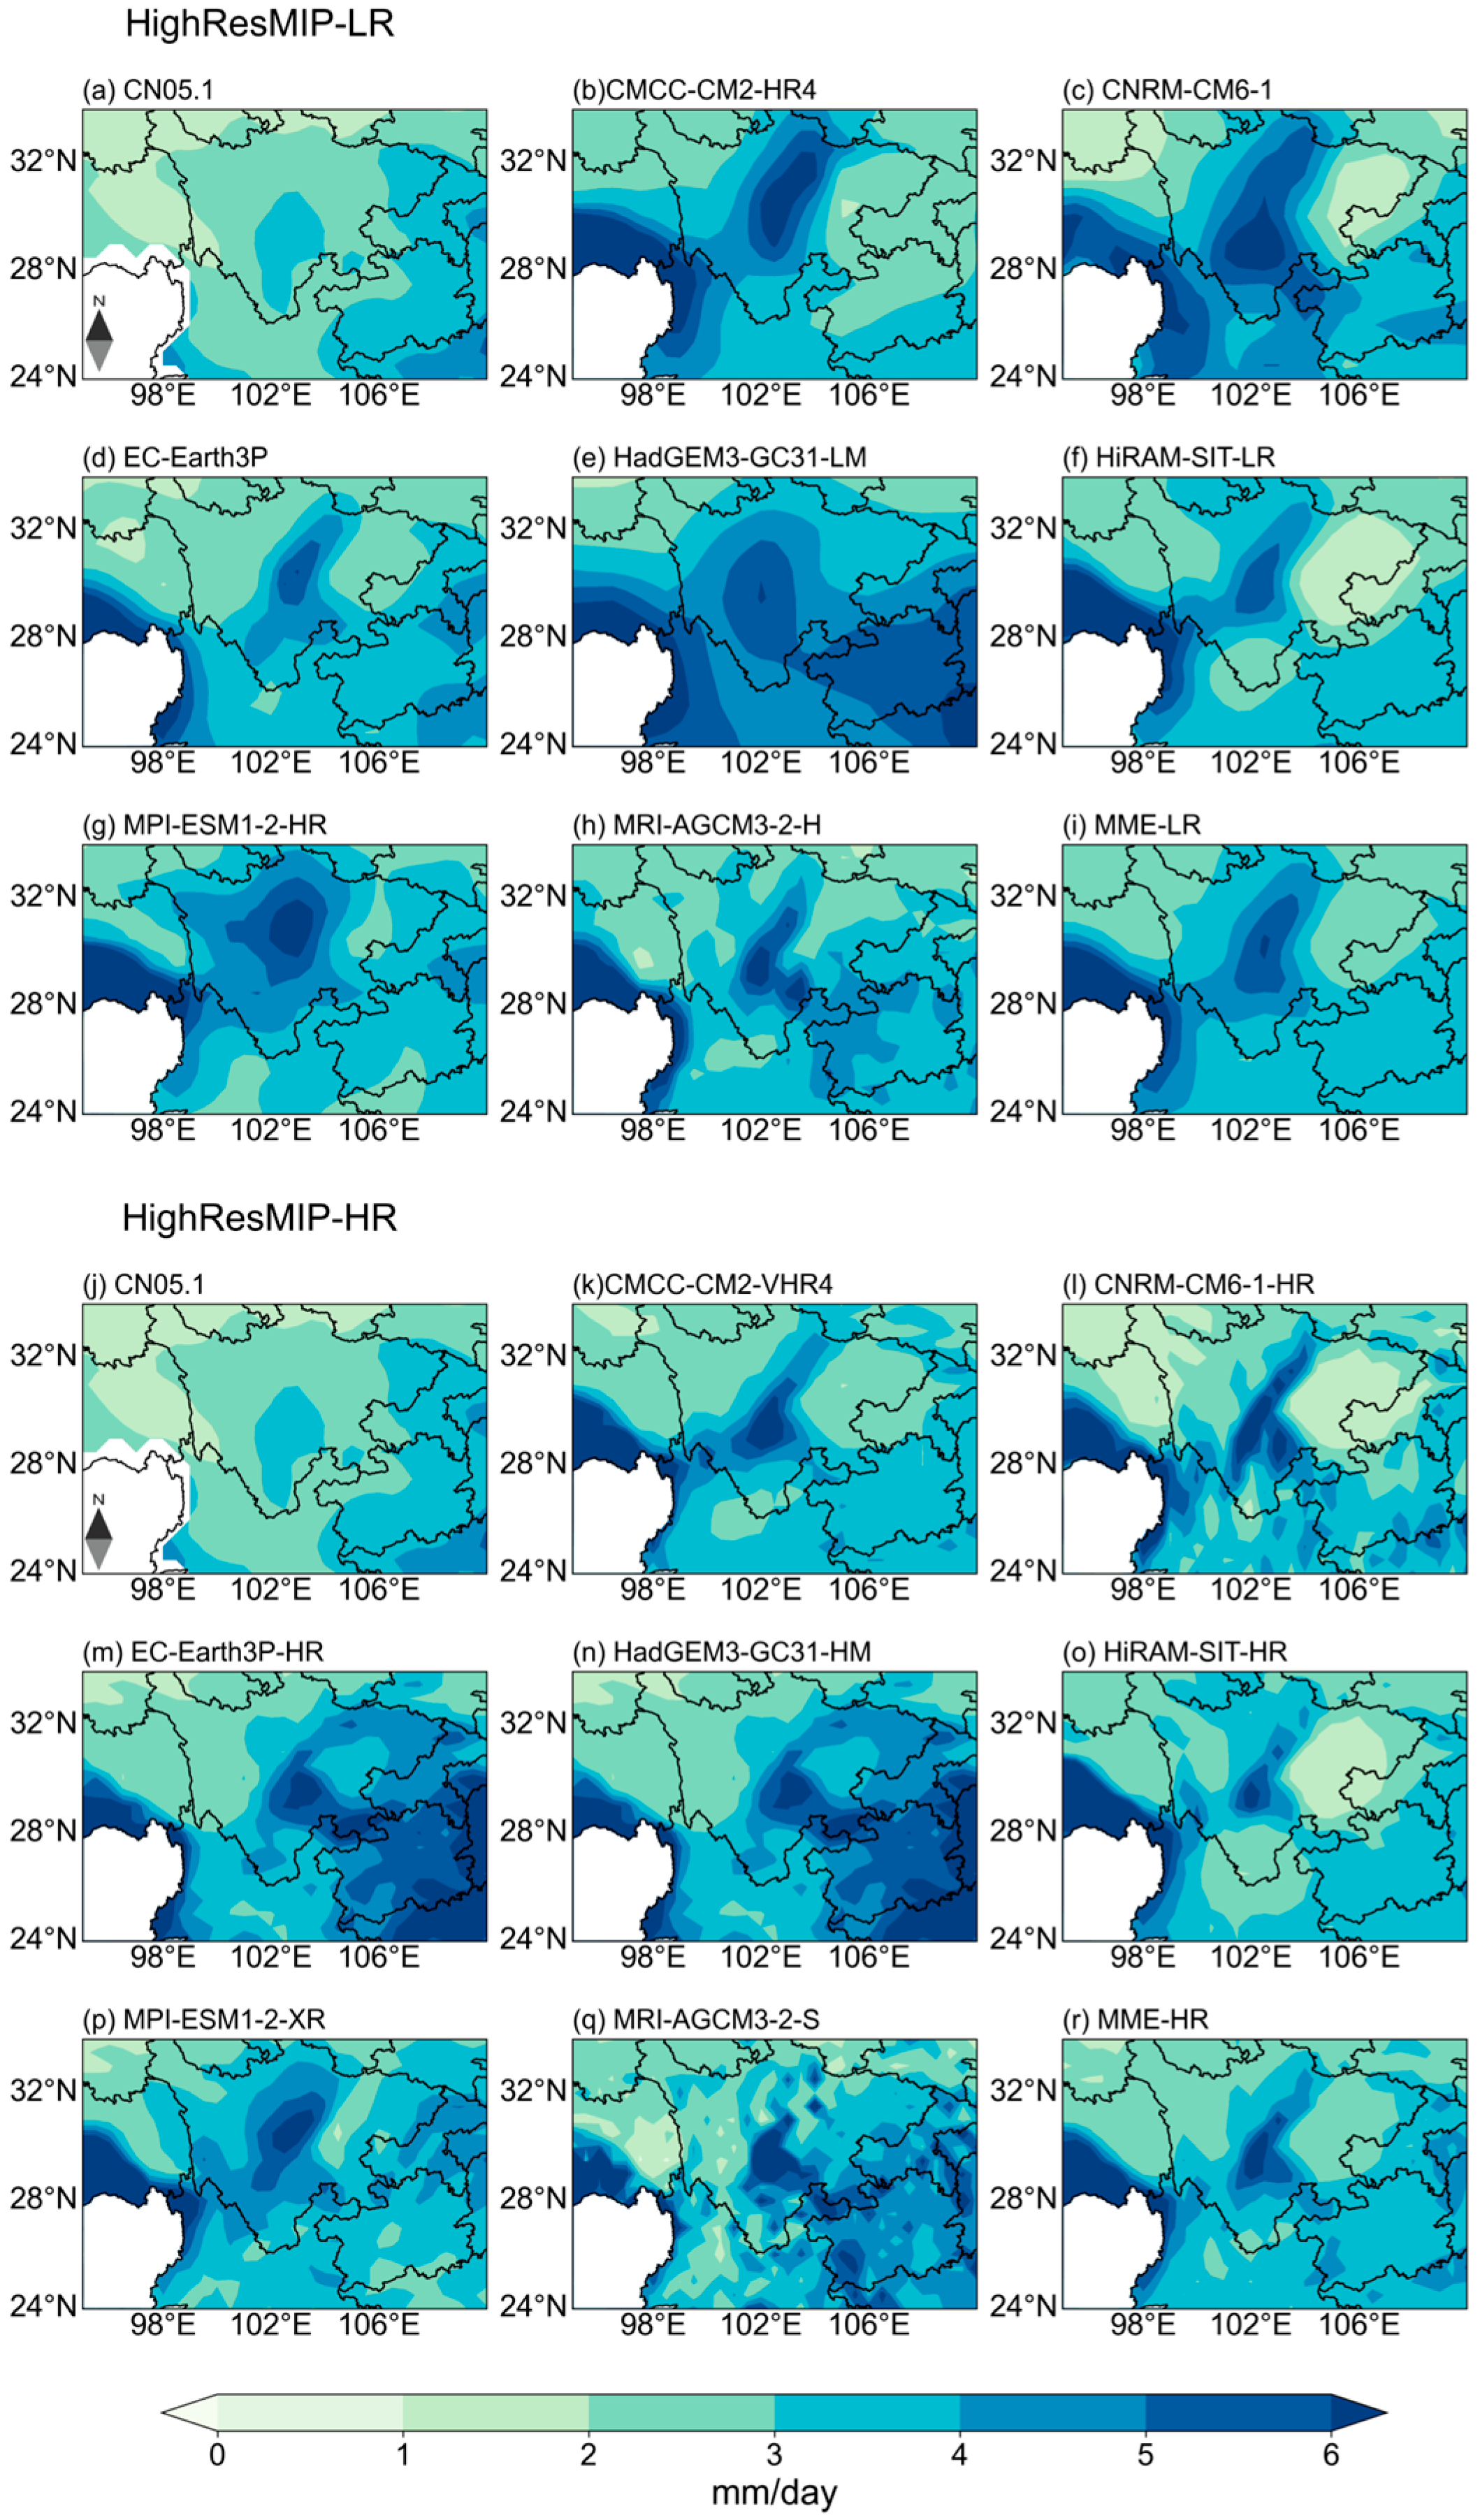
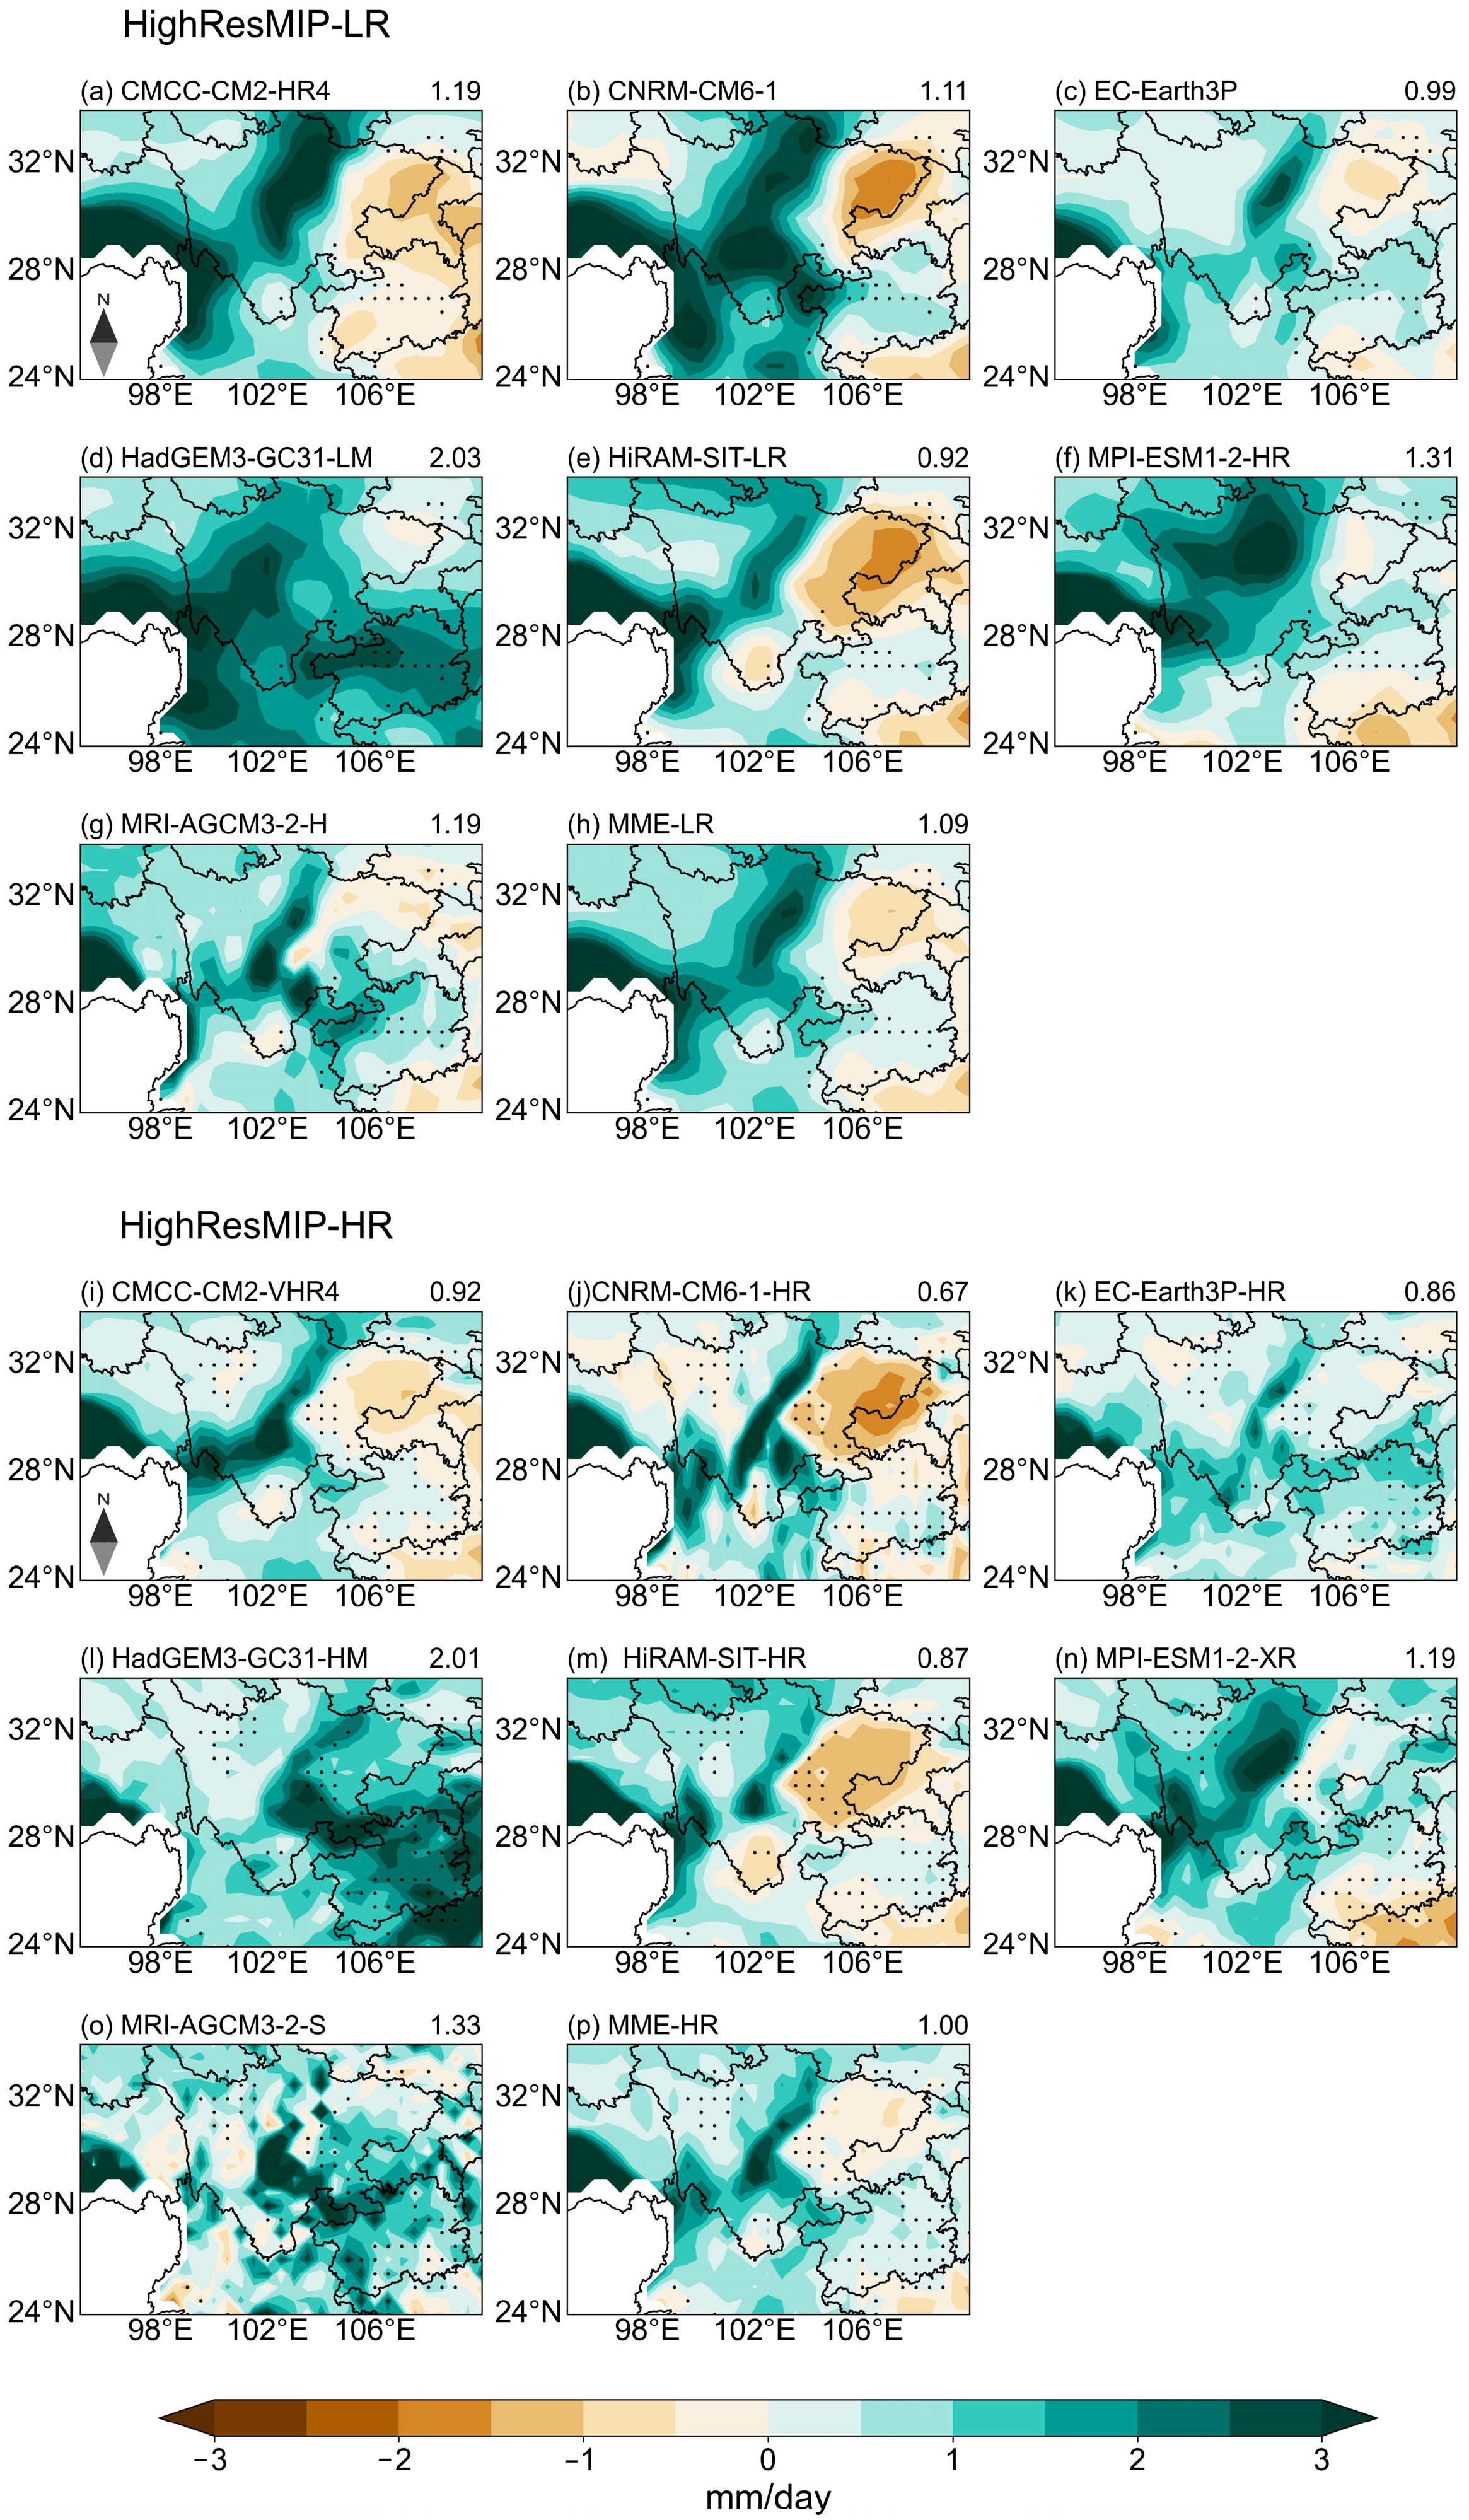
Both the LR and HR models effectively capture the spatial distribution of precipitation, with a noticeable increase in precipitation over the Hengduan Mountains and the eastern Tibetan Plateau, and a reduction in the Sichuan Basin. However, the models exhibit wet biases along the eastern edge of the Tibetan Plateau and in the Hengduan Mountains, alongside dry biases in the Sichuan Basin. Notably, the area-averaged absolute bias for the MME decreases from 1.09 mm/day in the LR models to 1.00 mm/day in the HR models, highlighting an improvement in the simulation of precipitation patterns in the ETP by the HR models.
(2)
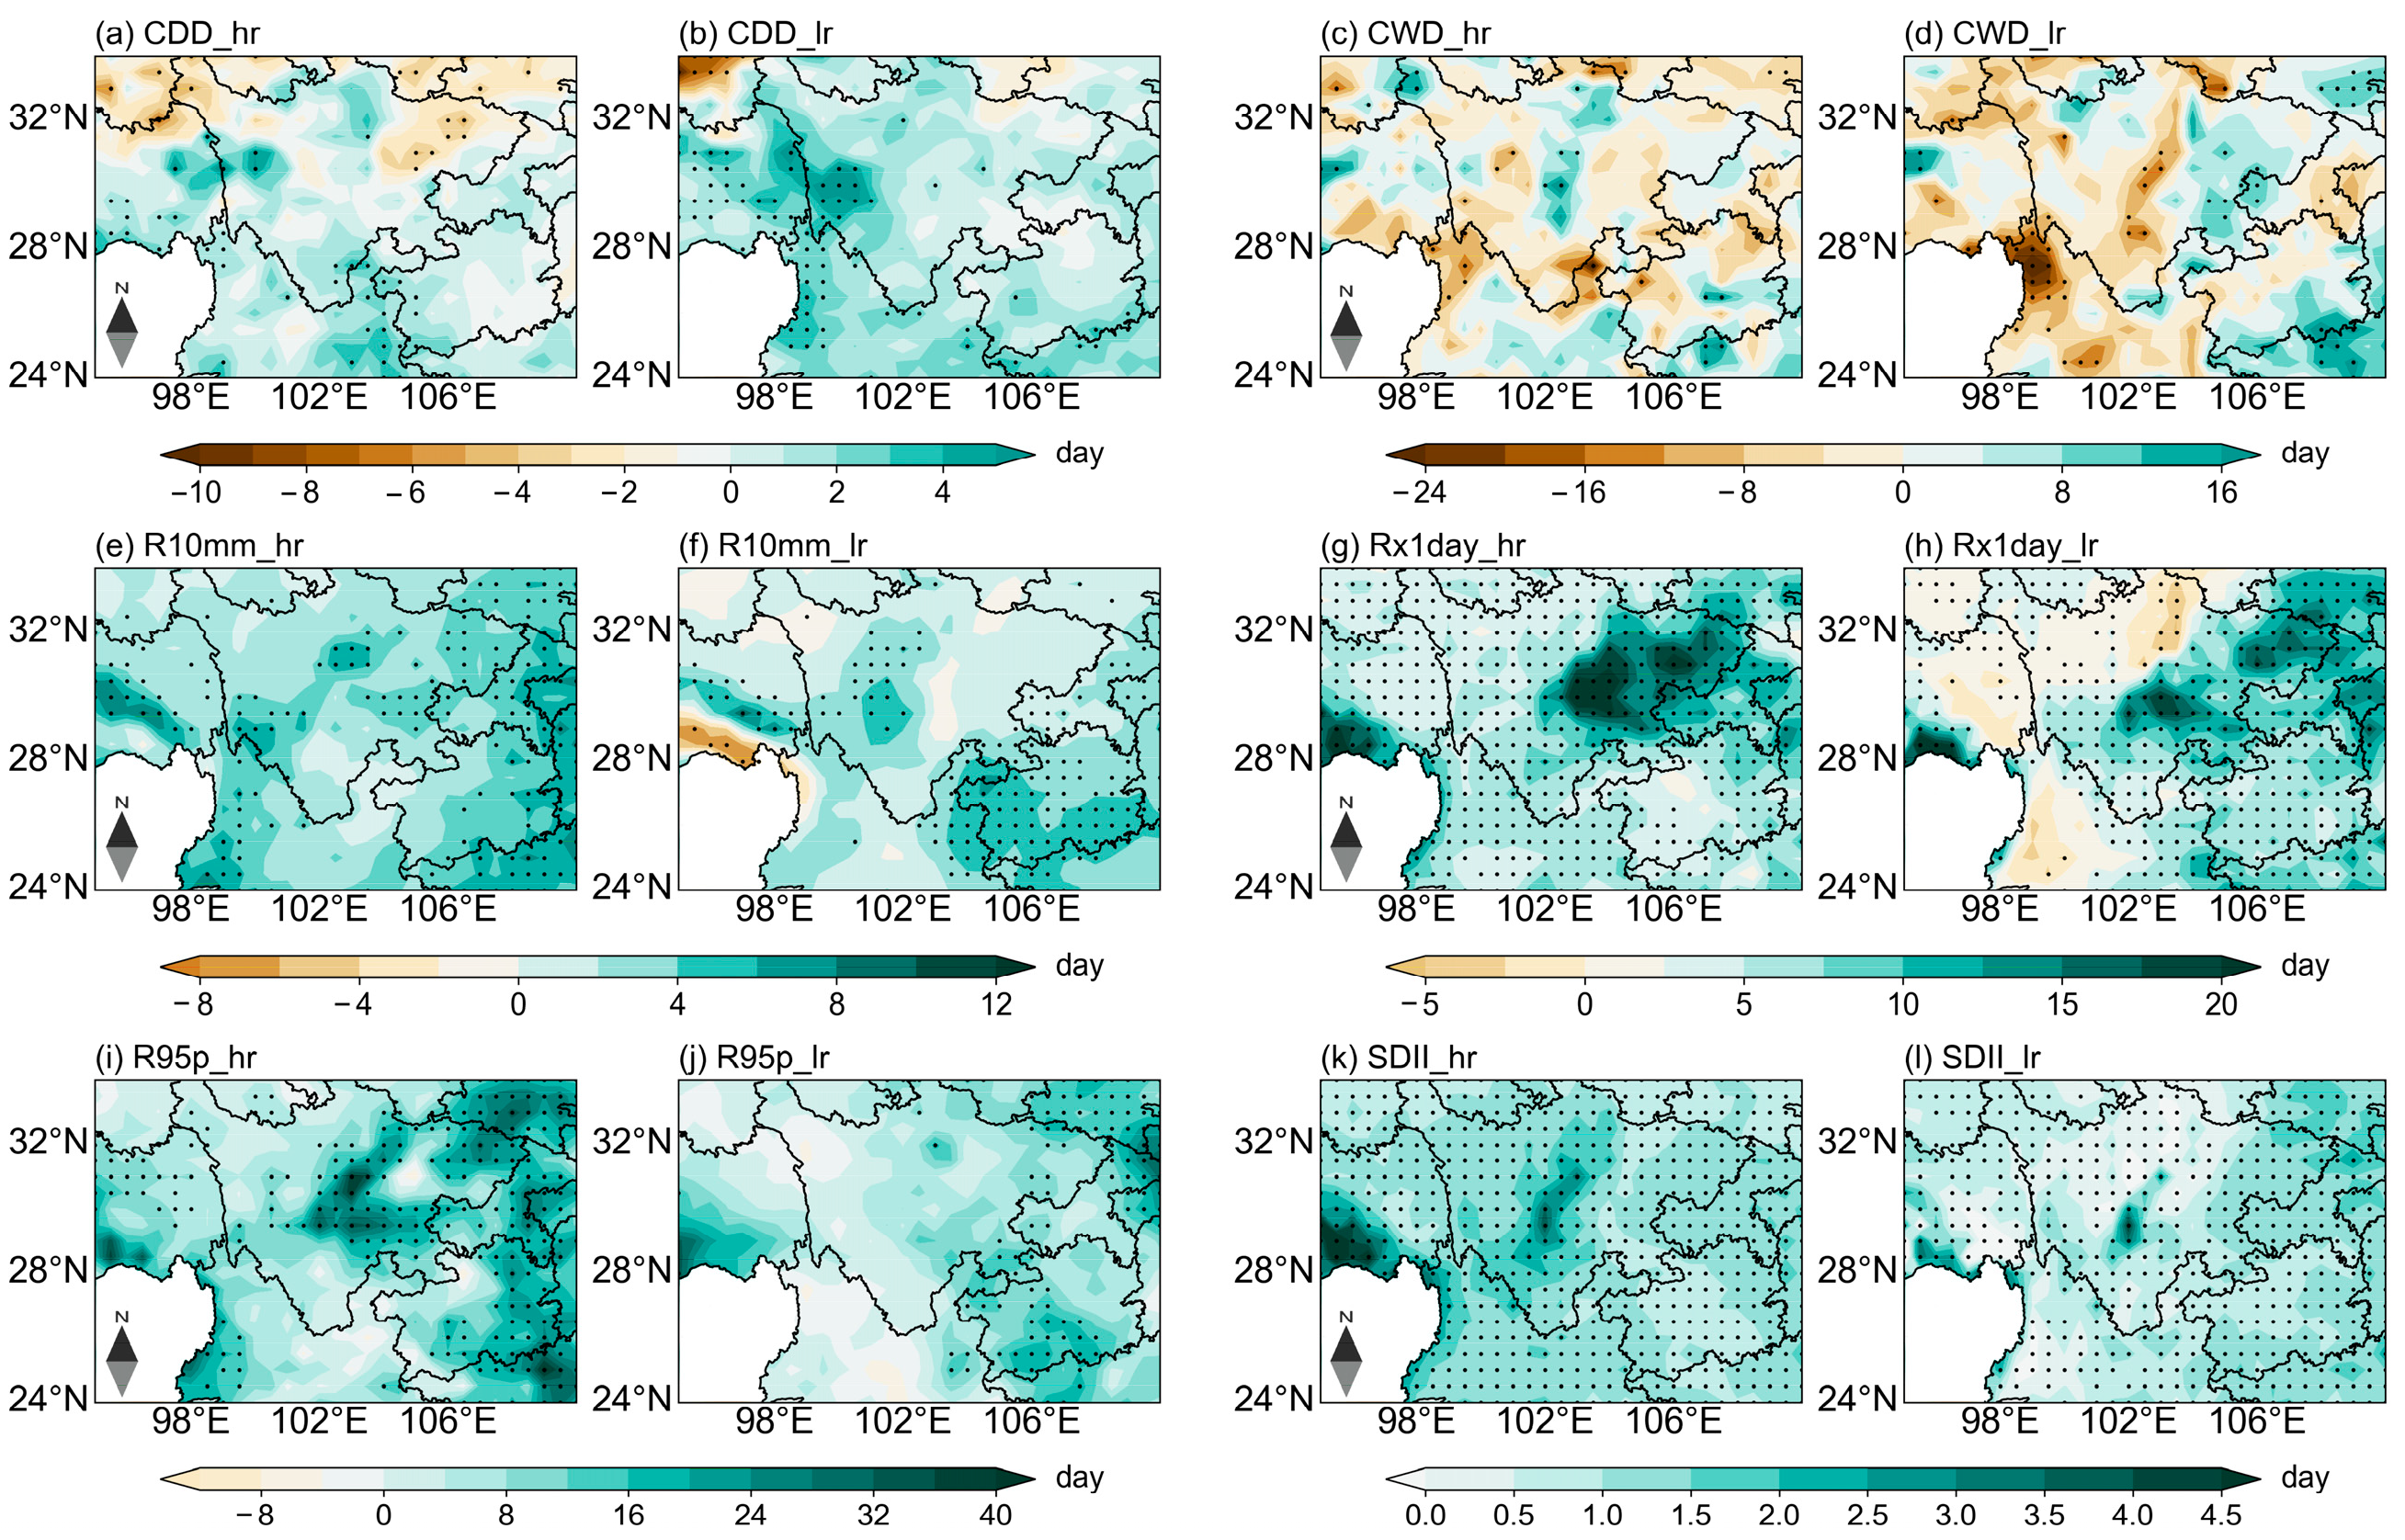
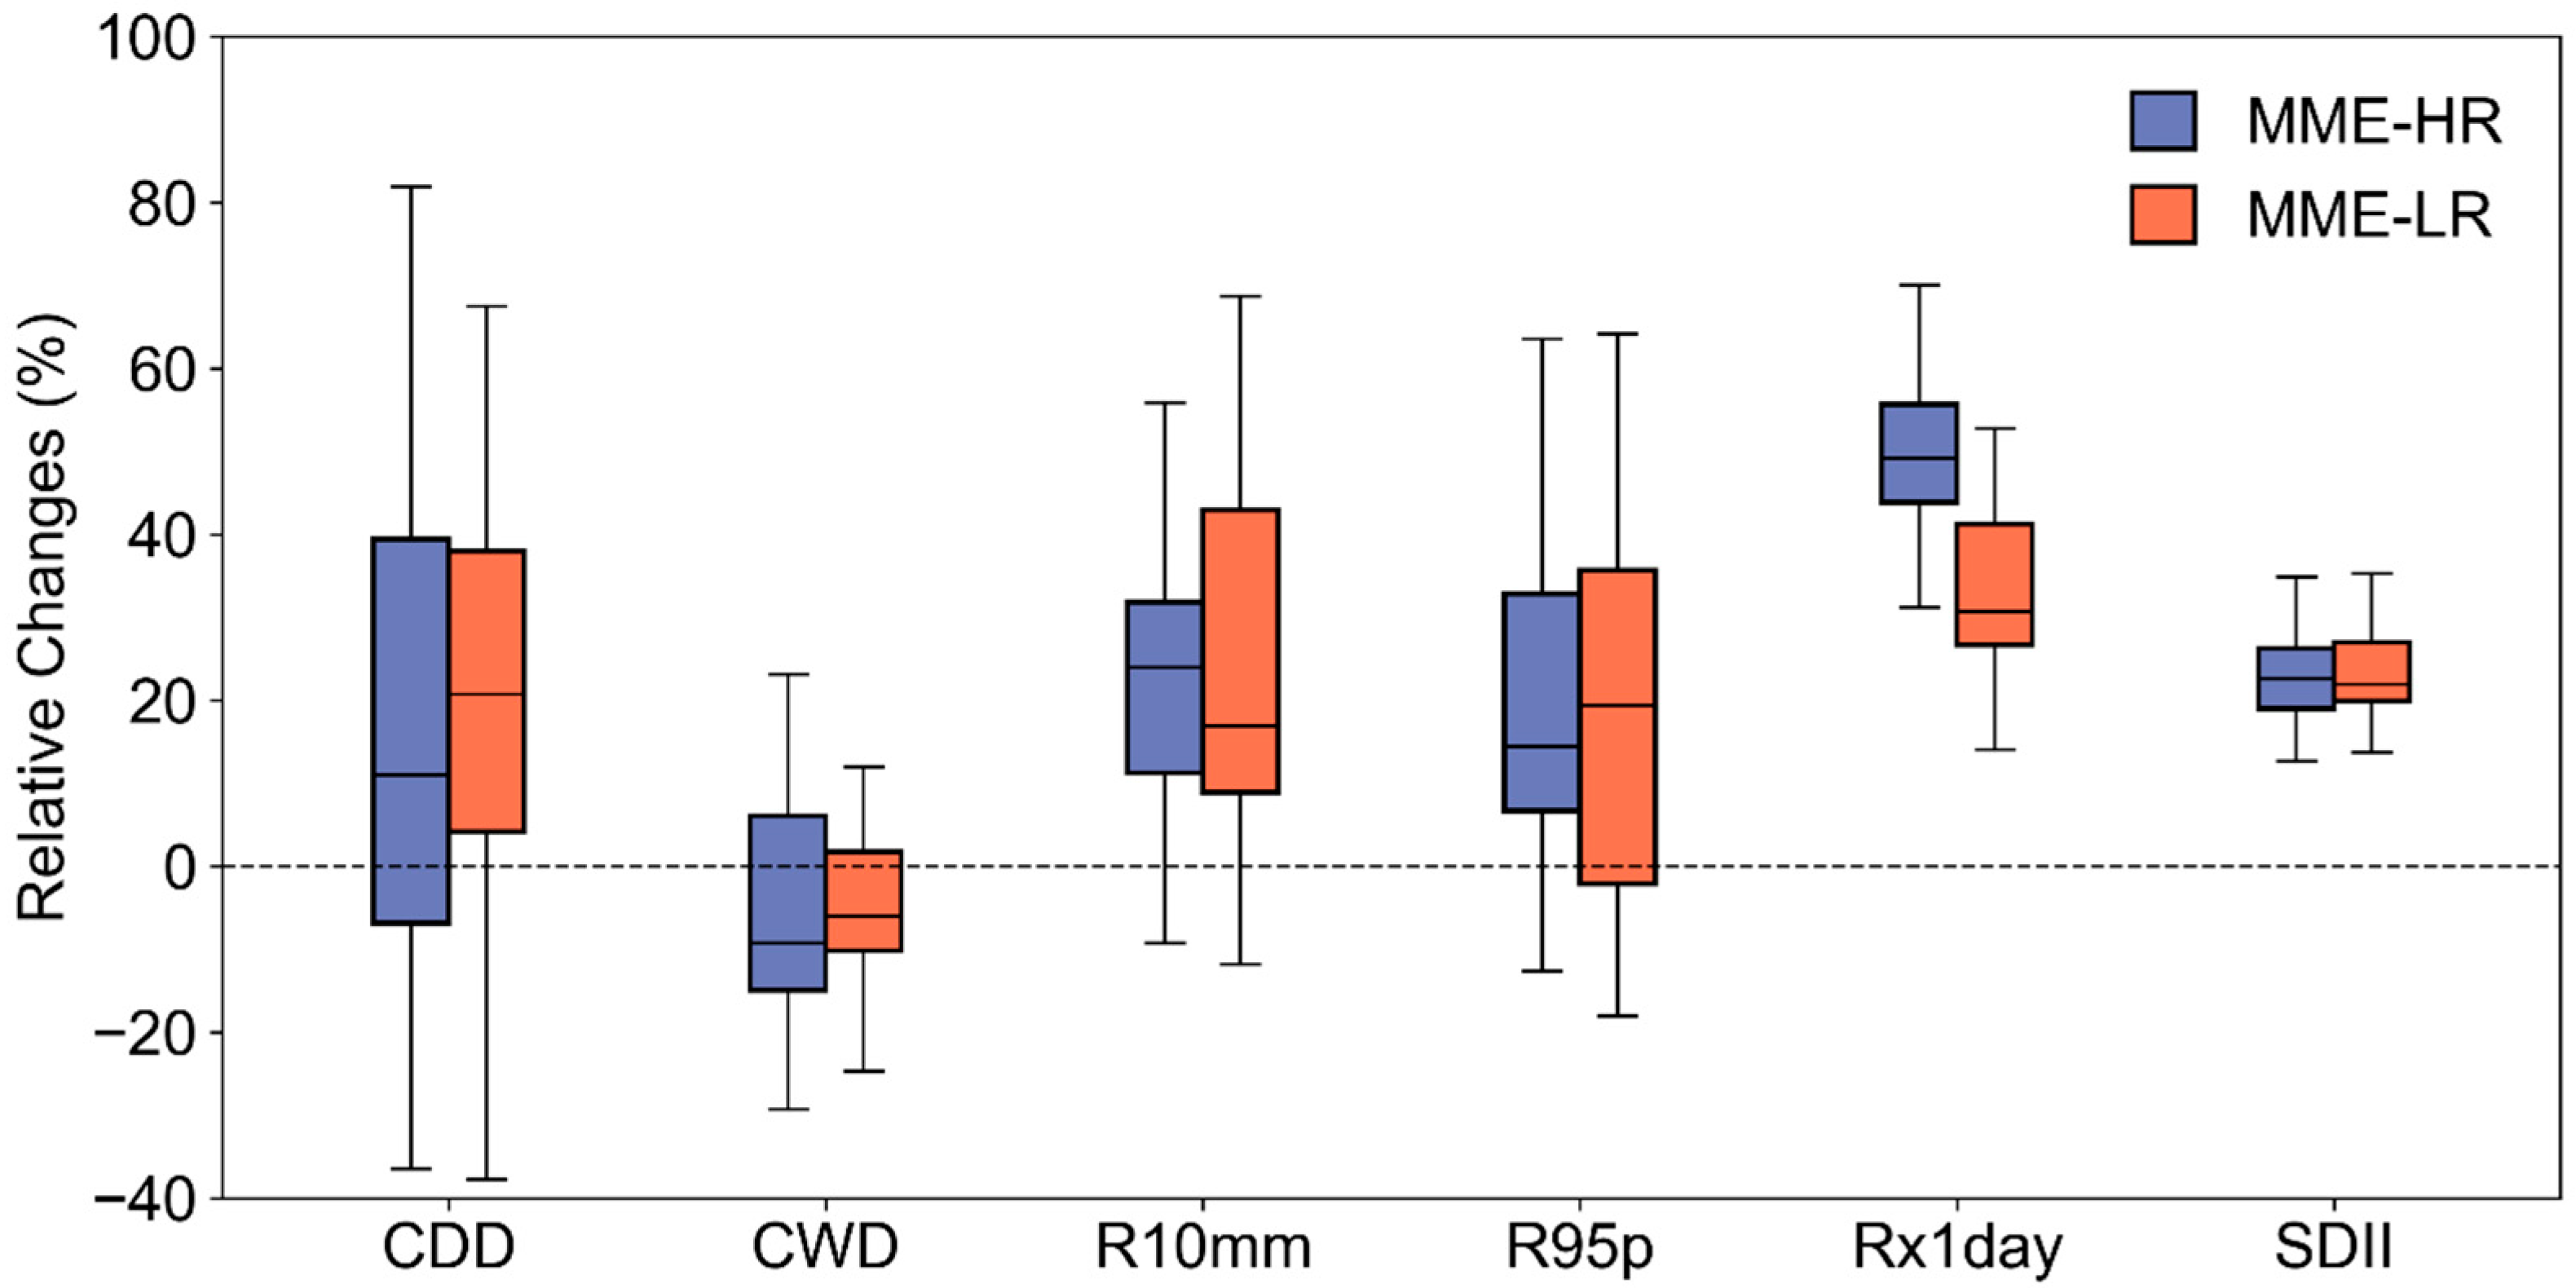
The majority of extreme precipitation indices over the Eastern Tibetan Plateau show an upward trend, with the exception of CWD, which demonstrates a decline. By the mid-21st century, both HR and LR models forecast an intensification of short-duration heavy precipitation events. Projections also indicate a significant rise in both the frequency and intensity of extreme precipitation in the Sichuan Basin, with these changes being more pronounced in HR models than in LR models.
(3)
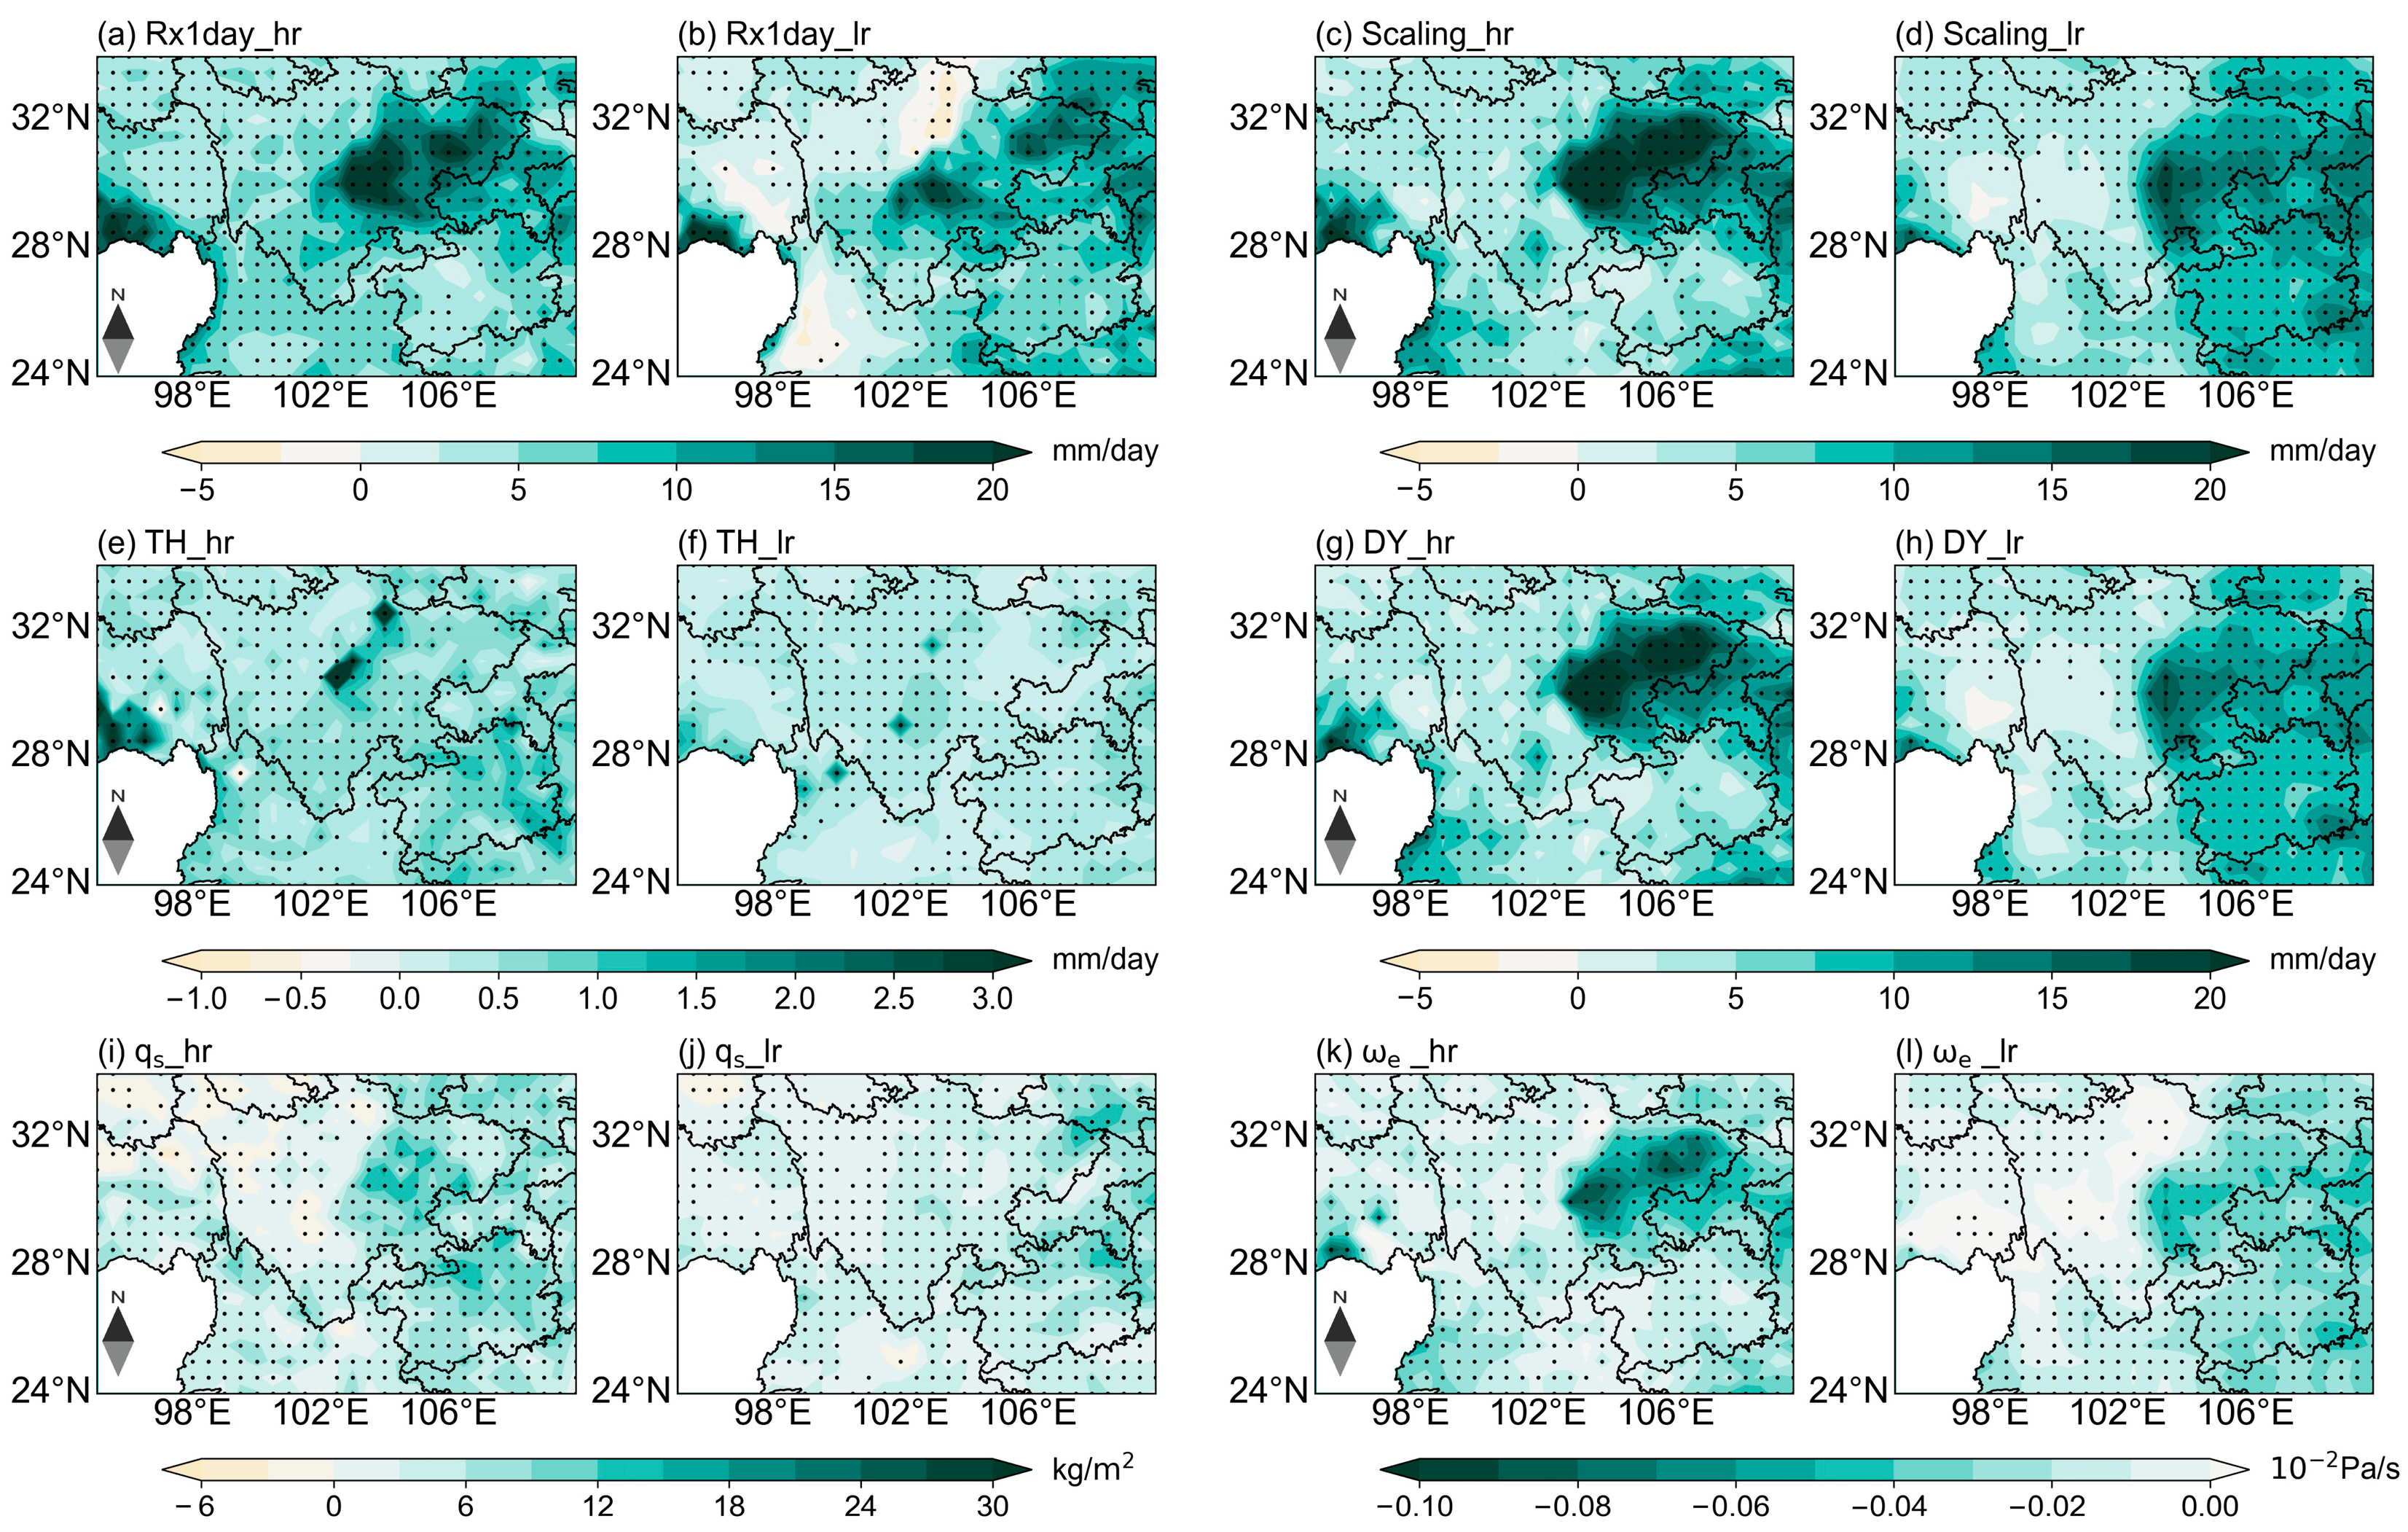
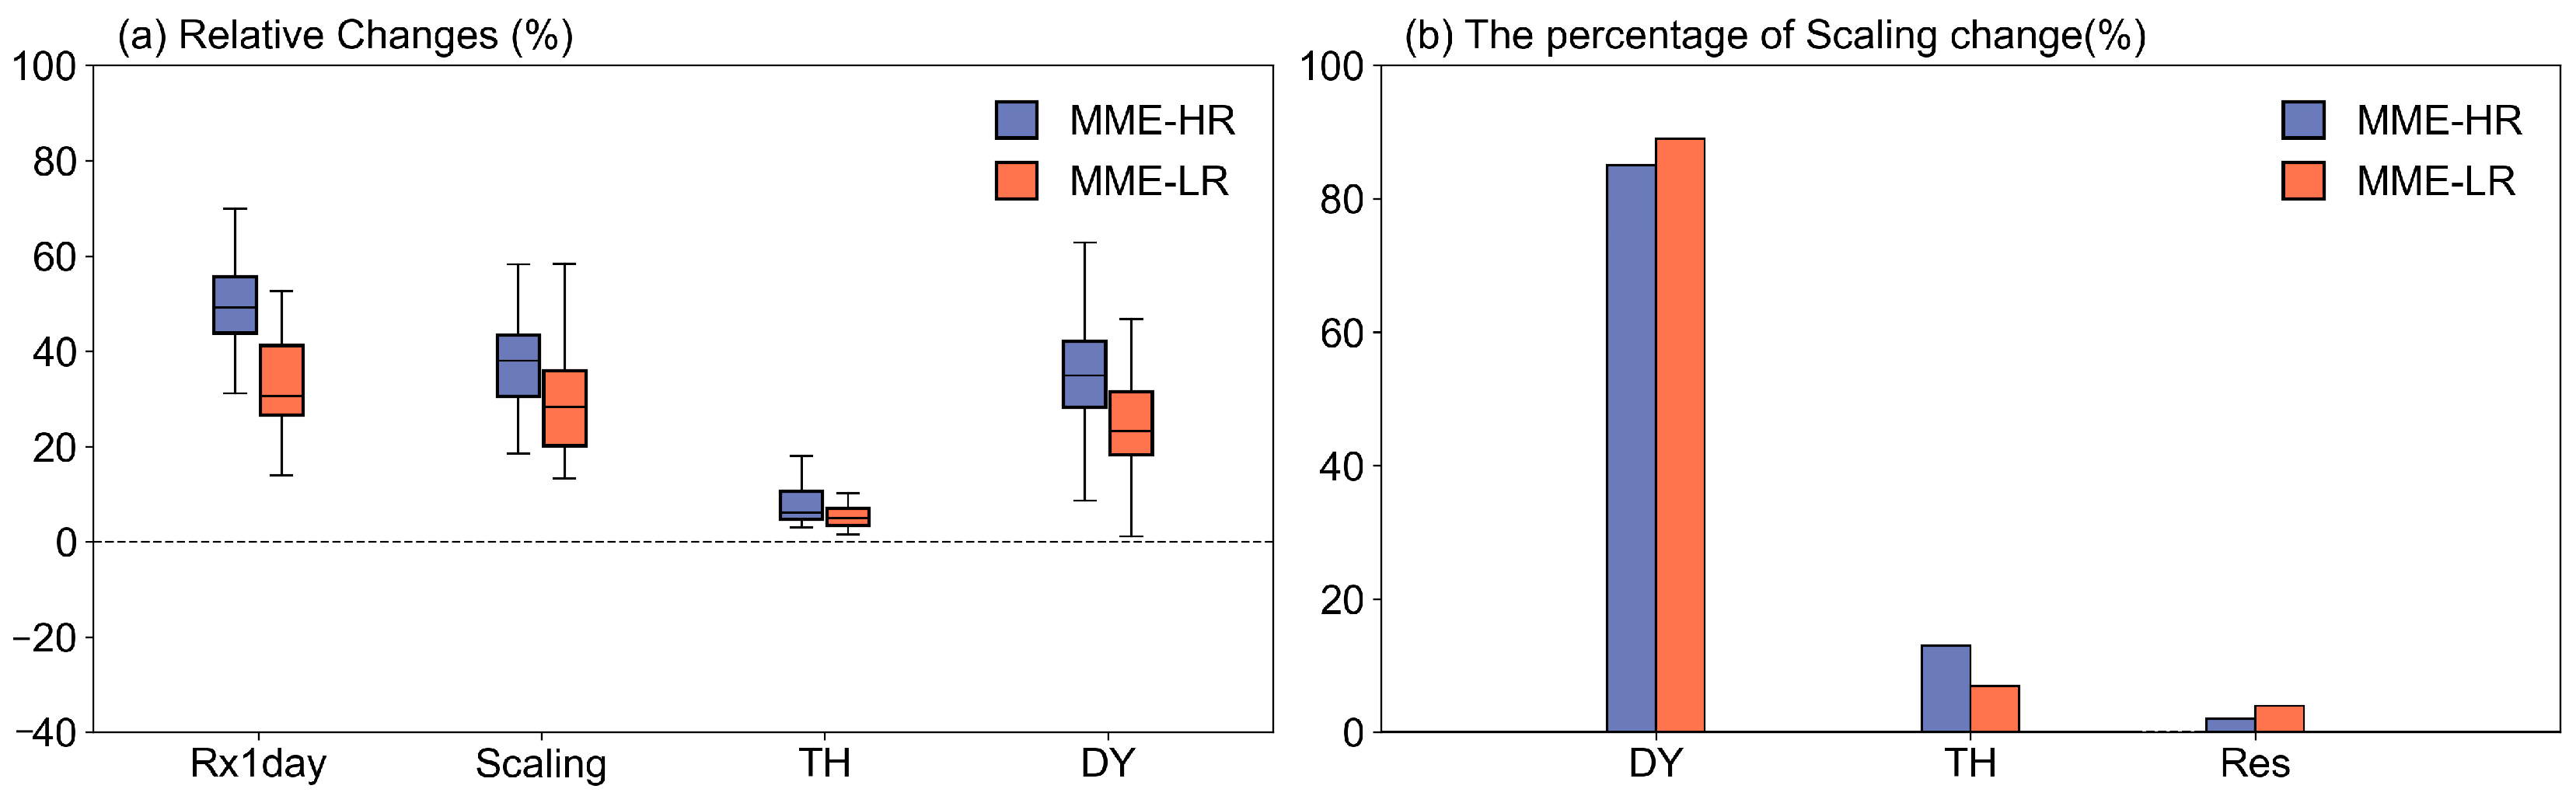
The changes in extreme precipitation over the eastern Tibetan Plateau are primarily driven by dynamic scaling, which governs the regional variations, particularly in the Sichuan Basin. The thermodynamic component plays a lesser role, being predominantly influenced by saturation specific humidity. Multi-Model Ensemble (MME) results reveal that dynamic scaling contributes 85% of the total change in HR models and 89% in LR models. Anticipated changes in vertical wind speed are expected to strengthen the hydrological cycle, exerting a profound impact on the patterns of extreme precipitation.

5. Conclusions

This study underscores the critical role of high-resolution climate models in accurately simulating the spatial distribution of extreme precipitation over the Eastern Tibetan Plateau, particularly in minimizing biases in regions characterized by complex topography. Although high-resolution models show notable improvements in precipitation simulations, substantial biases remain in certain areas, suggesting that further advancements are needed in the CMIP6 HighResMIP models for these regions. Furthermore, while dynamic factors emerge as the primary drivers of increasing extreme precipitation, thermodynamic factors—though less dominant—remain significant due to their influence on saturation specific humidity.
The findings of this research offer valuable new perspectives on the future evolution of extreme precipitation over the Eastern Tibetan Plateau and are crucial for shaping regional climate adaptation and risk management strategies. To refine prediction accuracy, future studies should explore the impact of model resolution on precipitation simulations, particularly in regions with intricate topography. Furthermore, greater attention should be given to understanding the roles and interactions of thermodynamic and dynamic factors in extreme precipitation events. This deeper exploration is essential for enhancing our capacity to forecast and respond to extreme weather events. Through these efforts, we can better equip ourselves to address the challenges posed by extreme precipitation, ultimately protecting the Eastern Tibetan Plateau and its communities from the adverse effects of climate change.

Author Contributions

Conceptualization, Q.C.; methodology, X.L. (Xiaojiang Liu); software, K.W.; validation, X.L. (Xi Liu) and C.L.; formal analysis, X.M. and K.C.; investigation, K.W.; resources, H.C.; data curation, Z.S.; writing—original draft preparation, K.W.; writing—review and editing, Q.C.; visualization, K.C. and X.M.; supervision, Q.C. and H.C.; project administration, H.C.; funding acquisition, Q.C. and H.C. All authors have read and agreed to the published version of the manuscript.

Funding

This study was jointly supported by the Science and Technology Project “Research on high-precision power meteorological prediction and forewarning technology based on micro-terrain area of Liangshan in Sichuan” of State Grid Sichuan Electric Power Company (B7199624M004), the Sichuan Science and Technology Program (2025YFN0006), the National Natural Science Foundation of China (U2442210, U20A2097).

Institutional Review Board Statement

Not applicable.

Informed Consent Statement

Not applicable.

Data Availability Statement

The CN05.1 daily precipitation grid dataset, covering the period from 1961 to 2014, was used as the observational reference for this study. This dataset is publicly available and can be accessed from the China Meteorological Data Service Centre at https://data.cma.cn. The CMIP6 HighResMIP models are available from the ESGF (Earth System Grid Federation). These models provide historical data from 1985 to 2014 and future projections from 2020 to 2049. The CMIP6 model data can be accessed via the ESGF node at https://esgf-node.llnl.gov/ (accessed on 29 May 2025).

Acknowledgments

All figures were created using Python 3.6.

Conflicts of Interest

Authors Xiaojiang Liu, Xi Liu, Chengxin Li, Xiaomin Ma, Kena Chen and Zhenhong Sun were employed by the State Grid Sichuan Electric Power Company Electric Power Research Institute. The remaining authors declare that the research was conducted in the absence of any commercial or financial relationships that could be construed as a potential conflict of interest.

References

  1. Zhou, Z.; Zhang, L.; Zhang, Q.; Cao, H.; Zhang, H.; Jia, B.; Liu, L.; Tang, Z.; Chen, J. Amplified temperature sensitivity of extreme precipitation events following heat stress. npj Clim. Atmos. Sci. 2024, 7, 243. [Google Scholar] [CrossRef]
  2. Myhre, G.; Alterskjær, K.; Stjern, C.W.; Hodnebrog, Ø.; Marelle, L.; Samset, B.H.; Sillmann, J.; Schaller, N.; Fischer, E.; Schulz, M.; et al. Frequency of extreme precipitation increases extensively with event rareness under global warming. Sci. Rep. 2019, 9, 16063. [Google Scholar] [CrossRef] [PubMed]
  3. Lang, Q.; Wan, Z.; Zhang, J.; Zhang, Y.; Zhu, D.; Liu, G. Resilience Assessment and Enhancement Strategies for Urban Transportation Infrastructure to Cope with Extreme Rainfalls. Sustainability 2024, 16, 4780. [Google Scholar] [CrossRef]
  4. Hamisi, R.; Renman, G.; Renman, A.; Wörman, A. Modelling phosphorus sorption kinetics and the longevity of reactive filter materials used for on-site wastewater treatment. Water 2019, 11, 811. [Google Scholar] [CrossRef]
  5. Zulu, B.; Oyewo, O.A.; Sithole, B.; Leswifi, T.Y.; Onyango, M.S. Functionalized sawdust-derived cellulose nanocrystalline adsorbent for efficient removal of vanadium from aqueous solution. Front. Environ. Sci. 2020, 8, 56. [Google Scholar] [CrossRef]
  6. Wang, X.; Liu, L. The impacts of climate change on the hydrological cycle and water resource management. Water 2023, 15, 2342. [Google Scholar] [CrossRef]
  7. Zhang, W.; Zhou, T. Increasing impacts from extreme precipitation on population over China with global warming. Sci. Bull. 2020, 65, 243–252. [Google Scholar] [CrossRef]
  8. Naveendrakumar, G.; Vithanage, M.; Kwon, H.H.; Chandrasekara, S.S.K.; Iqbal, M.C.M.; Pathmarajah, S.; Fernando, W.C.; Obeysekera, J. South Asian perspective on temperature and rainfall extremes: A review. Atmos. Res. 2019, 225, 110–120. [Google Scholar] [CrossRef]
  9. Zhang, J.; Li, C.; Zhang, X.; Zhao, T. Improving simulations of extreme precipitation events in China by the CMIP6 global climate models through statistical downscaling. Atmos. Res. 2024, 303, 107344. [Google Scholar] [CrossRef]
  10. Alizadeh, O. Advances and challenges in climate modeling. Clim. Change 2022, 170, 18. [Google Scholar] [CrossRef]
  11. Luo, N.; Guo, Y. Impact of model resolution on the simulation of precipitation extremes over China. Sustainability 2021, 14, 25. [Google Scholar] [CrossRef]
  12. Abbate, A.; Papini, M.; Longoni, L. Extreme rainfall over complex terrain: An application of the linear model of orographic precipitation to a case study in the Italian pre-alps. Geosciences 2020, 11, 18. [Google Scholar] [CrossRef]
  13. Liu, H.; Zhao, X.; Duan, K.; Shang, W.; Li, M.; Shi, P. Optimizing simulation of summer precipitation by weather research and forecasting model over the mountainous southern Tibetan Plateau. Atmos. Res. 2023, 281, 106484. [Google Scholar] [CrossRef]
  14. Sun, X.; Li, Q.; Wu, Q. Mechanisms of early and late summer precipitation in Southwest China: Dynamic and thermodynamic processes. Clim. Dyn. 2024, 62, 7907–7925. [Google Scholar] [CrossRef]
  15. Oueslati, B.; Yiou, P.; Jézéquel, A. Revisiting the dynamic and thermodynamic processes driving the record-breaking January 2014 precipitation in the southern UK. Sci. Rep. 2019, 9, 2859. [Google Scholar] [CrossRef]
  16. Zhou, Y.; Yu, R.; Zhang, Y.; Li, J. Dynamic and thermodynamic processes related to precipitation diurnal cycle simulated by GRIST. Clim. Dyn. 2023, 61, 3935–3953. [Google Scholar] [CrossRef]
  17. Lai, H.W.; Chen, D.; Chen, H.W. Precipitation variability related to atmospheric circulation patterns over the Tibetan Plateau. Int. J. Climatol. 2024, 44, 91–107. [Google Scholar] [CrossRef]
  18. Zhang, W.; Kirtman, B. Estimates of decadal climate predictability from an interactive ensemble model. Geophys. Res. Lett. 2019, 46, 3387–3397. [Google Scholar] [CrossRef]
  19. Jin, Z.; Ge, F.; Chen, Q.; Lin, Z. To what extent horizontal resolution improves the simulation of precipitation in CMIP6 HighResMIP models over Southwest China? Front. Earth Sci. 2023, 10, 1003748. [Google Scholar] [CrossRef]
  20. Lai, P.; Yang, J.; Liu, L.; Zhang, Y.; Sun, Z.; Huang, Z.; Shao, D.; He, L. Sichuan Rainfall Prediction Using an Analog Ensemble. Atmosphere 2023, 14, 1223. [Google Scholar] [CrossRef]
  21. Liang, X.; Zhang, L.; He, S.; Song, K.; Zheng, Z. Characteristics and projection of rainfall erosivity distribution in the Hengduan Mountains. Land 2023, 12, 1435. [Google Scholar] [CrossRef]
  22. Ou, T.; Chen, D.; Linderholm, H.W.; Jeong, J.H. Evaluation of global climate models in simulating extreme precipitation in China. Tellus A Dyn. Meteorol. Oceanogr. 2013, 65, 19799. [Google Scholar] [CrossRef]
  23. Pan, B.; Wang, Y.; Lin, Y.; Hsieh, J.S.; Lavallee, M.; Zhao, L.; Zhang, R. Radiative and microphysical impacts of the Saharan dust on two concurrent tropical cyclones: Danielle and Earl (2010). J. Geophys. Res. Atmos. 2024, 129, e2023JD039245. [Google Scholar] [CrossRef]
  24. Chen, Q.; Ge, F.; Jin, Z.; Lin, Z. How well do the CMIP6 HighResMIP models simulate precipitation over the Tibetan Plateau? Atmos. Res. 2022, 279, 106393. [Google Scholar] [CrossRef]
  25. Jiang, J.; Yu, Y.; Zhou, Y.; Qian, S.; Deng, H.; Tao, J.; Hua, W. Influence of Model Resolution on Wind Energy Simulations over Tibetan Plateau Using CMIP6 HighResMIP. Atmosphere 2024, 15, 1323. [Google Scholar] [CrossRef]
  26. Wu, T.; Yu, R.; Lu, Y.; Jie, W.; Fang, Y.; Zhang, J.; Zhang, L.; Xin, X.; Li, L.; Wang, Z.; et al. BCC-CSM2-HR: A high-resolution version of the Beijing Climate Center Climate System Model. Geosci. Model Dev. Discuss. 2020, 2020, 1–64. [Google Scholar] [CrossRef]
  27. Guo, X.; Gao, Y.; Zhang, S.; Cai, W.; Leung, L.R.; Lu, J.; Chen, X.; Zscheischler, J.; Thompson, L.; Guan, B.; et al. More high-impact atmospheric river-induced extreme precipitation events under warming in a high-resolution model. One Earth 2024, 7, 2223–2234. [Google Scholar] [CrossRef]
  28. Pfahl, S.; O’Gorman, P.A.; Fischer, E.M. Understanding the regional pattern of projected future changes in extreme precipitation. Nat. Clim. Change 2017, 7, 423–427. [Google Scholar] [CrossRef]
  29. Wu, J.; Gao, X.; Giorgi, F.; Chen, D. Changes of effective temperature and cold/hot days in late decades over China based on a high resolution gridded observation dataset. Int. J. Climatol. 2017, 37, 788–800. [Google Scholar] [CrossRef]
  30. Wu, J.; GAO, X.J. A gridded daily observation dataset over China region and comparison with the other datasets. Chin. J. Geophys. 2013, 56, 1102–1111. [Google Scholar]
  31. Feng, S.; Gu, X.; Guan, Y.; Wang, Q.J.; Zheng, Y.; Wang, L.; Zhang, X.; Kong, D. Anthropogenic exacerbation in dry-hot probability and consequential record-shattering droughts in the middle and lower reaches of the Yangtze River. J. Geophys. Res. Atmos. 2024, 129, e2024JD041603. [Google Scholar] [CrossRef]
  32. Yang, R.; Wang, G.; Zhang, Y.; Zhang, P.; Li, S.; Cabral, P. Cropland Exposure to Extreme Dryness and Wetness in China Under Shared Socioeconomic Pathways. Int. J. Climatol. 2025, 45, e8715. [Google Scholar] [CrossRef]
  33. Eyring, V.; Bony, S.; Meehl, G.A.; Senior, C.A.; Stevens, B.; Stouffer, R.J.; Taylor, K.E. Overview of the Coupled Model Intercomparison Project Phase 6 (CMIP6) experimental design and organization. Geosci. Model Dev. 2016, 9, 1937–1958. [Google Scholar] [CrossRef]
  34. John, A.; Douville, H.; Ribes, A.; Yiou, P. Quantifying CMIP6 model uncertainties in extreme precipitation projections. Weather Clim. Extrem. 2022, 36, 100435. [Google Scholar] [CrossRef]
Figure 1. (a) ETP landscape and geographical coordinates (m as the unit); (b) detailed view of the ETP within the red-boxed area (24–34° N, 95–110° E).
Atmosphere 16 00664 g001
Figure 2. Annual precipitation climatology over ETP from 1985 to 2014 depicted through ob-servations and simulations by CMIP6 HighResMIP models (unit: mm/day). In this context, (bh) corresponds to low–resolution-model simulation, while (kq) pertains to high–resolution-model simulation. CN05.1 (a,j) and MME (i,r) denote multi–model ensemble means and observations, respectively.
Atmosphere 16 00664 g002
Figure 3. Similar to Figure 2, but this illustration portrays the spatial variance in precipitation disparities between individual models and observations. The top-right section of each panel provides the areal-mean absolute bias (unit: mm/day) across ETP. Regions with statistically significant precipitation similarities at the 95% confidence level, determined using a two-tailed Student’s t-test, are indicated by black dots.
Atmosphere 16 00664 g003
Figure 4. (a) Assessment of precipitation extremes in low—resolution models; (b) Assessment of precipitation extremes in high—resolution models. Comparative analysis of RMSE and RSD for CMIP6 HighResMIP precipitation extremes (1985–2014) against observations. The upper triangle denotes RMSE; the lower triangle denotes RSD.
Atmosphere 16 00664 g004
Figure 5. Projected extreme precipitation indices shifts for HR and LR models, 2020–2049, relative to 1985–2014. The black dots mark regions with statistically significant changes at the 95% confidence level.
Atmosphere 16 00664 g005
Figure 6. Percentage change in mean precipitation extreme indices from 2020 to 2049 under HR and LR models compared to 1985–2014.
Atmosphere 16 00664 g006
Figure 7. Relative changes in Rx1day, scaling of precipitation extremes, thermodynamic scaling (δth), dynamic scaling (δdy), vertically integrated saturation-specific humidity, and vertically averaged vertical velocity for the multi-model ensemble mean during 2020–2049 under hr and lr models compared to 1985–2014.
Atmosphere 16 00664 g007
Figure 8. The relative changes (%) in components of the physical scaling diagnostic equation for the multi-model ensemble means (MME-HR and MME-LR) from 2020 to 2049, compared to the period from 1985 to 2014. Panel (a) depicts the relative changes in Rx1day, total scaling, thermodynamic scaling (δTH), and dynamic scaling (δDY). Panel (b) shows the percentage contribution of dynamic scaling (δDY), thermodynamic scaling (δTH), and the residual term (Res) to the changes in extreme precipitation. Units: %.
Atmosphere 16 00664 g008
Table 1. CMIP6 HighResMIP model data employed in research.
ModelInstitutionCountry/RegionHorizontal
Resolution
(lon. × lat.)
CMCC-CM2-HR4Euro-Mediterranean
Centre on Climate Change (CMCC)
Italy1.25° × 0.94°
CMCC-CM2-VHR40.31° × 0.23°
CNRM-CM6-1National Centre for Meteorological ResearchFrance1.40° × 1.40°
CNRM-CM6-1-HR0.50° × 0.50°
EC-Earth3PEC-EARTH consortiumEurope0.35° × 0.35°
EC-Earth3P-HR0.70° × 0.89°
HadGEM3-GC31-MMMet Office Hadley Centre (MOHC)United Kingdom0.56° × 0.83°
HadGEM3-GC31-HM0.23° × 0.35°
HiRAM-SIT-LRGeophysical Fluid Dynamics LaboratoryAmerica0.50° × 0.50°
HiRAM-SIT-HR0.23° × 0.23°
MPI-ESM1-2-XRMax Planck Institute for Meteorology (MPI-M)Germany0.47° × 0.47°
MPI-ESM1-2-HR0.94° × 0.94°
MRI-AGCM3-2-SMeteorological Research Institute (MRI)Japan0.19° × 0.19°
MRI-AGCM3-2-H0.56° × 0.56°
Table 2. Overview and explanation of extreme precipitation indices for study.
IndexDescriptionDefinitionUnits
CDDConsecutive dry daysMaximum number of consecutive days with PRCP(Precipitation) < 1 mmdays
CWDConsecutive wet daysMaximum number of consecutive days with PRCP ≥ 1 mmdays
R10mmHeavy precipitation daysAnnual count of days when PRCP ≥ 10 mmdays
R95pExtreme rainfall at the 95th percentile95th percentile of precipitation in the analyzed periodmm
Rx1dayMaximum 1-day precipitationMaximum of 1 day of precipitation amountmm
SDIISimple daily intensity indexTotal wet day precipitation divided by number of rainy daysmm/day
Disclaimer/Publisher’s Note: The statements, opinions and data contained in all publications are solely those of the individual author(s) and contributor(s) and not of MDPI and/or the editor(s). MDPI and/or the editor(s) disclaim responsibility for any injury to people or property resulting from any ideas, methods, instructions or products referred to in the content.

