1. Introduction
Fighting global warming is becoming increasingly challenging as global greenhouse gas (GHG) emissions are rising continuously. Apart from sustained efforts in curbing carbon dioxide (CO
2) emissions, abating emissions of methane (CH
4), another major contributor to global warming, has recently become the focus of the global efforts following COP26 [
1,
2]. The global energy sector accounts for over 70% of the total methane emissions in 2022, of which an estimated 39 million tons of methane emissions are from extracting, processing, and distributing natural gas [
3,
4]. Fugitive loss or leakage from gas distribution systems is one of the main sources of methane emissions. Thus, an accurate estimation of methane leakage is necessary to assess the current emission control performance and develop effective mitigation strategies for the future.
Numerous efforts have been made in past decades to estimate methane emissions from gas distribution systems. In the 1990s, the U.S. Gas Research Institute and the Environmental Protection Agency (GRI/EPA) studied methane emissions from natural gas operations by developing methane emission factors (EFs) and activity factors (AFs) for each component within the natural gas industry, including gas production, processing, transmission/storage, and distribution [
5]. EFs refer to the rate of methane emitted from an emitting source, such as a unit length of pipelines or one set of joints. AFs are the population of emitting sectors, such as the length of pipelines and the number of joints. An emitting sector can be either an underground pipeline made of a certain type of material and operating under a certain pressure or a joint of a particular type. The US national methane leakage was estimated based on the products of EFs and AFs for different source classifications in the four components of the natural gas industry. Based on the EFs and AFs established in the 1990s and updated in 2011, methane leakage from natural gas distribution systems was determined to be 1329 Gg/year (1 Gg = 1000 tonnes) in 2011 and updated by the EPA GHG emissions inventory [
6].
As the equipment and pipes experience substantial replacement over time, updating EFs is needed for accurate emission estimation on the go. In this context, in 2015, a high-flow sampling method was used to directly quantify the fugitive losses at randomly selected pipeline leaks and metering and regulating facilities [
7]. The total leakage was determined to be 393 Gg/year, much lower than the value determined previously on the basis of the EPA data. Such a reduction in annual methane emission was attributed to the pipeline station upgrades as well as more mature leakage detection and maintenance operations. Older pipelines made of cast iron and unprotected steel had been continuously replaced by protected steel and plastic ones, thus leading to fewer leakage accidents and longer service life. The same group also conducted a similar methane leakage measurement and modeling in Indianapolis, Indiana, reaching the result of 29 Gg/year for the city [
8].
Recently, Alvarez et al. combined ground-based, facility-scale measurements with aircraft observations to estimate the overall methane emissions from the U.S. oil and gas supply chain, including production, gathering, processing, transmission, and distribution [
9]. This work measured methane emissions by using two methods, namely top–down (TD) and bottom–up (BU) methods, and compared the estimations in nine oil and gas production areas. TD studies refer to leakage quantification by aircraft or satellites across large geographies, while the BU approach directly measures the leakage at pipelines or facilities. Results showed similar trends between TD and BU studies with total methane emissions estimated to be 13,000 Gg/year, providing a more comprehensive picture of methane emissions from the U.S. oil and gas industry.
Apart from the work performed in the U.S., MARCOGAZ in Europe is also recognized as a technical reference by international organizations like United Nations, Oil & Gas Methane Partnership 2.0 (OGMP 2.0), and Methane Guiding Principles (MGP) to calculate CH
4 emissions from the natural gas distribution system using a “bottom–up” methodology in the EU28 [
10]. A dataset covering 46% of the pipeline network in length across Europe was collected among the Macrogaz members in 2016. The EFs and AFs of distribution pipelines, service lines, and city gate stations were used to estimate the overall CH
4 leakage. Notably, different materials and pressures of the pipelines were associated with different EFs. The total CH
4 emissions from the distribution networks were in the range of 339–553 Gg/year. Riddick et al. proposed that the reported CH
4 emissions from oil and gas activities in the United Kingdom have been substantially underestimated, and widespread and frequent direct measurements should be conducted to update EFs [
11].
Apart from the above summarized cases, extensive efforts have also been made to estimate GHG emissions from natural gas distribution networks in other parts of the world [
12,
13,
14,
15]. However, there is limited research on simplified methodologies applied to urban gas systems in diverse geographical contexts. It is highly important to simplify estimation methods from different regions to offer a generalizable framework for estimating pipeline leakage that can be applied to other urban gas distribution systems worldwide. The city gas used in Hong Kong, namely town gas, has different gas properties and the transportation network may have different conditions (i.e., characteristics of leak apertures, wind speed, and laying environment). Meanwhile, in response to the Hong Kong Government’s call for climate actions, an estimation of potential GHG emissions in the gas industry is important at this time and urgently needed. Towngas, as a signatory of the MGP partnership, is also committed to quantifying and reducing methane emission across the production value chain and improve methane reduction efforts collectively among industry peers. Therefore, a dedicated study should be conducted to obtain reliable gas leakage data through a simplified methodology and better evaluate GHG emissions from the local gas distribution systems. It is also necessary to identify the specific solutions to reduce leakage based on the different contributing factors.
Town gas is city gas produced from 60% natural gas and 38% naphtha with 2% landfill gas by Towngas [
16]. The chemical composition and physical properties of town gas are listed in
Table 1 and
Table 2, respectively. When leakage occurs, town gas, being lighter than air, will dissipate into the air and will be detectable easily due to its added odorant. Both important components of town gas, namely CO
2 and CH
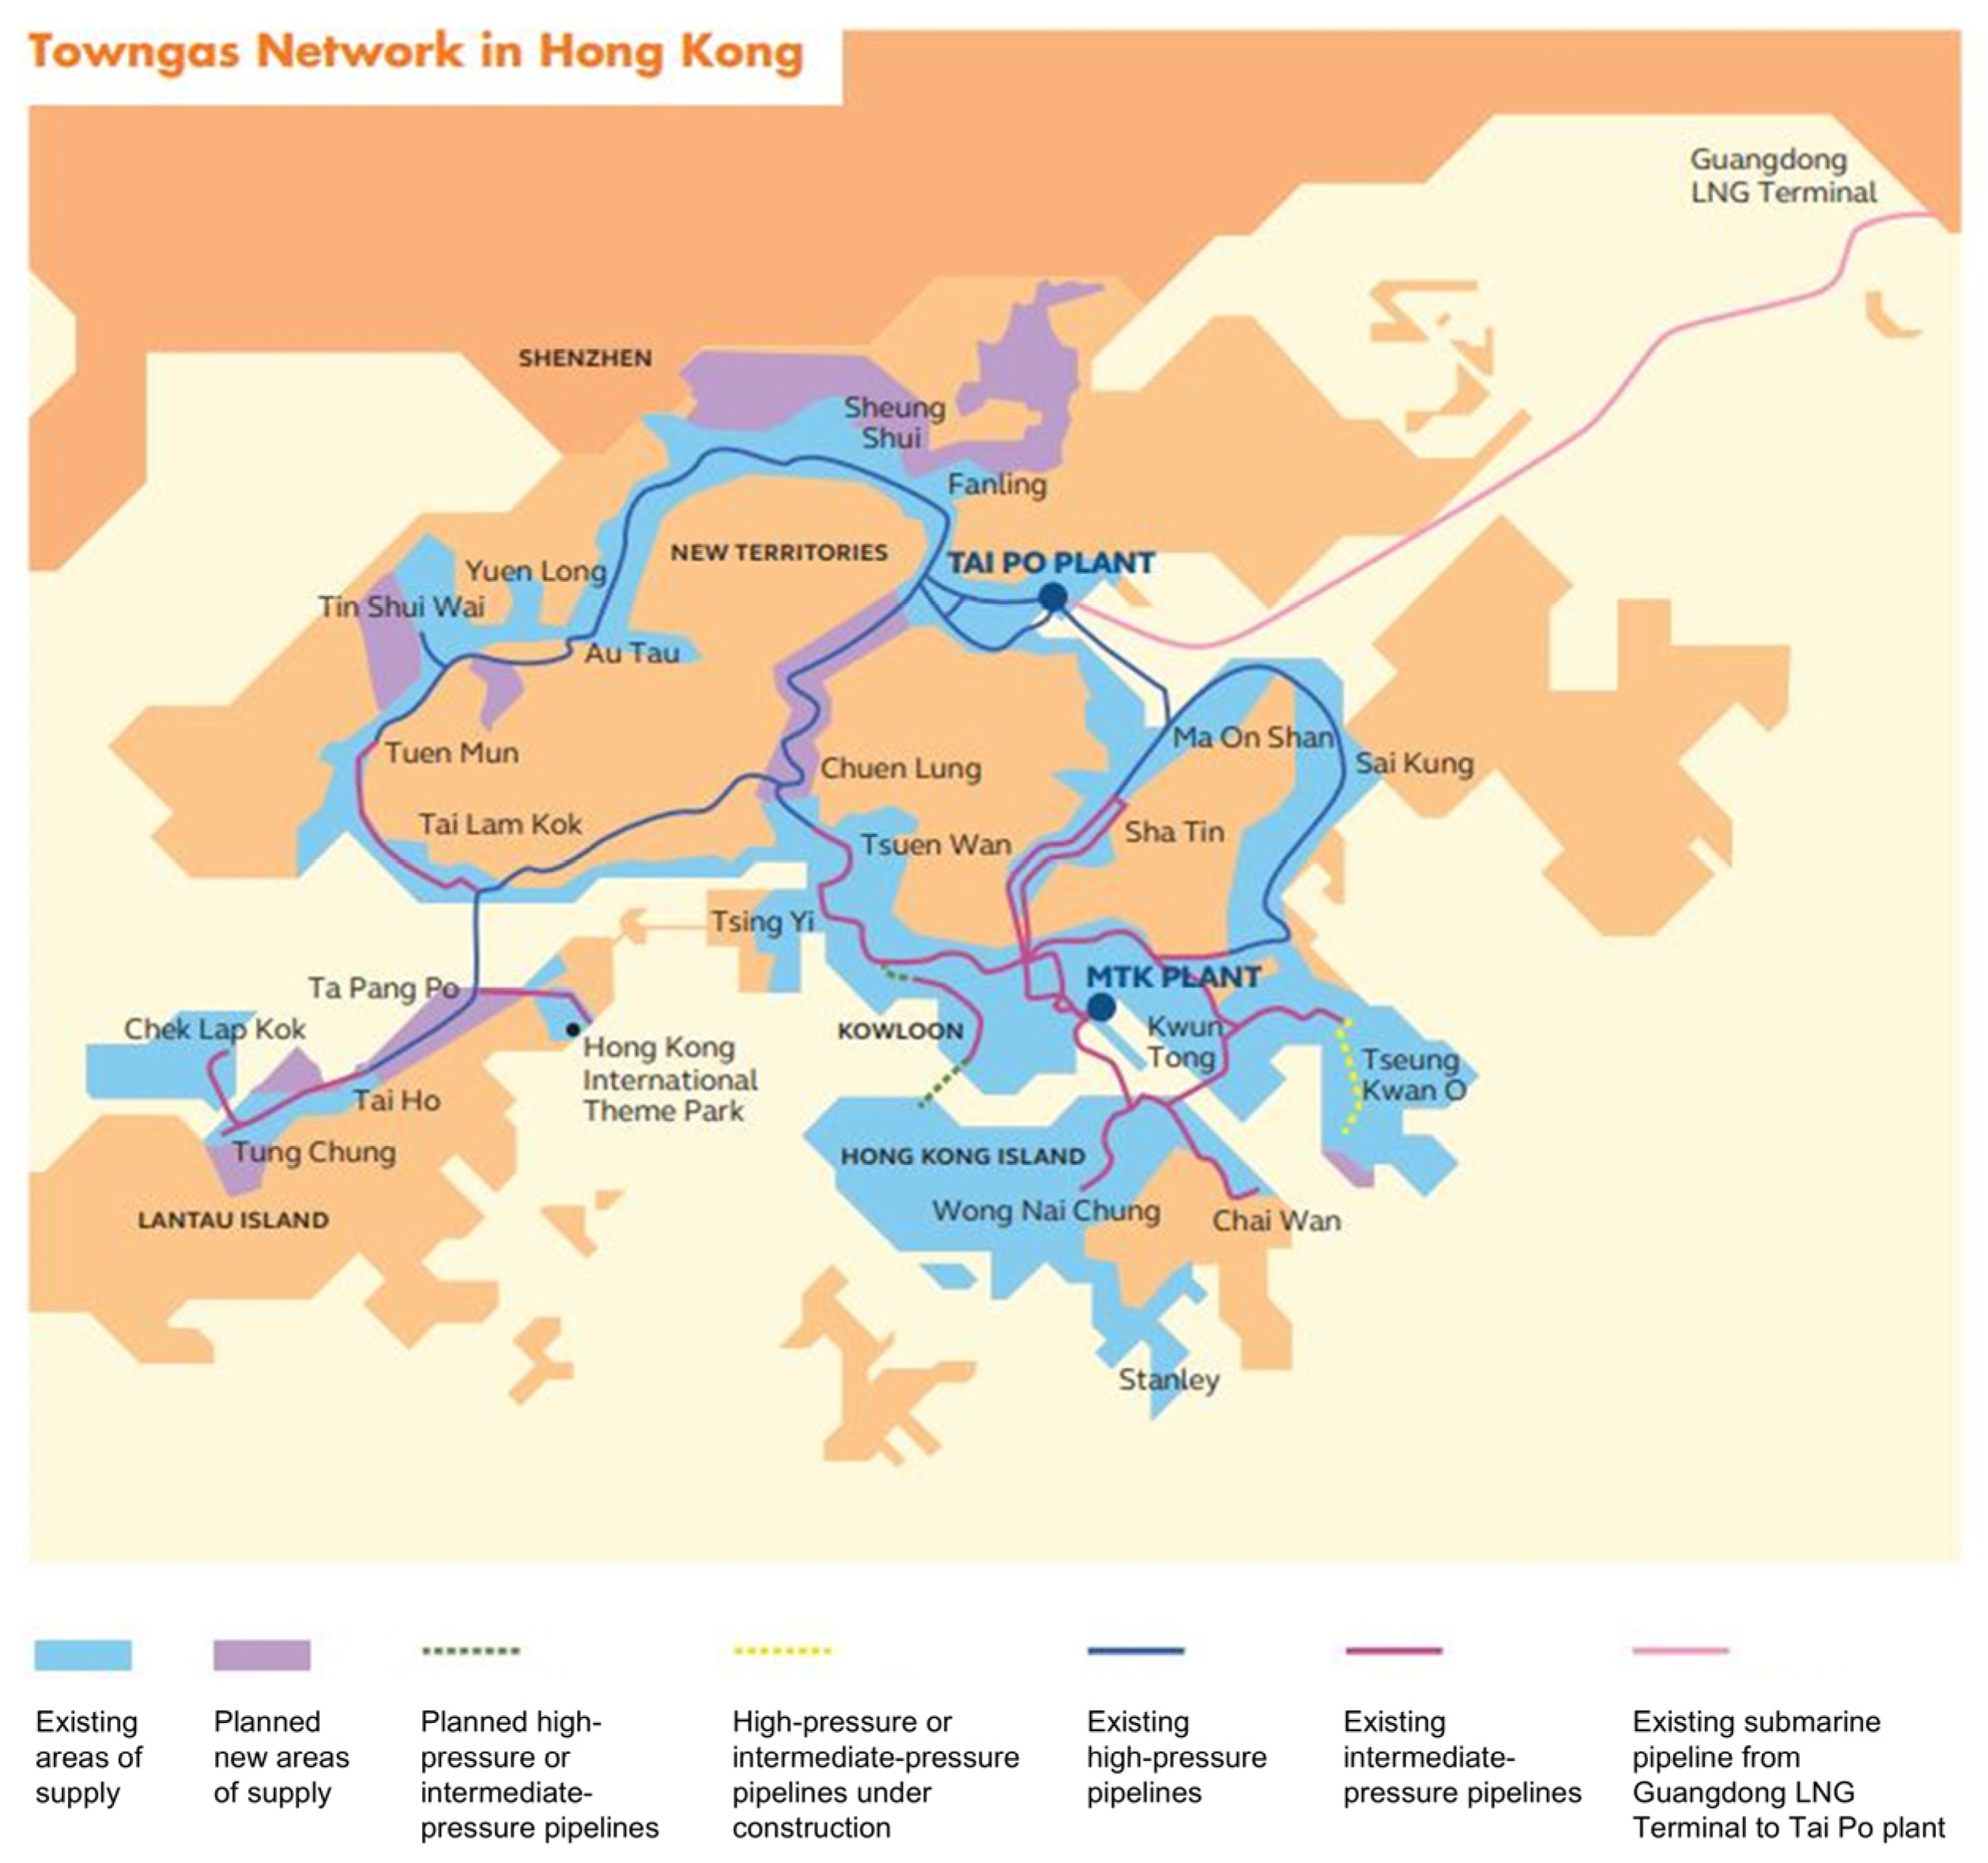
4, if leaked, contribute to GHG emissions and cause environmental concerns. In Hong Kong, town gas is a major domestic fuel gas and is supplied through a network of pipelines. As shown in
Figure 1, the town gas supply network has been invested in continuously and grown over the years, extending to over 3700 km in 2022 [
17]. There are various types of town gas leakage, which will be introduced separately.
Herein, we hypothesize that urban gas leakage, including fugitive losses, can be accurately estimated using simplified methodologies with error margins comparable to those observed in studies of other gases globally. To test this hypothesis, we adapted EFs from previous studies and combined them with AFs specific to Hong Kong’s town gas distribution system in the year 2022. The results were compared to benchmarks from similar studies conducted across various regions and gas types. By validating the effectiveness of these methodologies, this study aims to provide a generalizable framework for urban gas leakage estimation and contribute to efforts to reduce GHG emissions.
2. Leakage Sources and Methodology
To test the hypothesis, a simplified methodology was constructed. It used the data provided by the local gas company in Hong Kong, The Hong Kong and China Gas Company Limited (Towngas). The methodology was based on their town gas distribution and leakage records in the year 2022. Leakage sources included third-party damage, permeation, third-party damage, pipeline commissioning/decommissioning, and fugitive leakage. After that, EFs were adapted from previously reported studies, while AFs were based on operational data. The total leakage volumes were calculated for each source and compared to benchmarks derived from global studies of natural gas and other urban gas systems. The specific evaluation methods for each type of gas leakage are introduced below.
2.1. Third-Party Damage
Third-party damage (TPD) to pipelines refers to the mechanical damage caused by individuals or external organizations to Towngas. It often occurs during excavation, construction, and farming activities when the operator is unaware of the presence of the pipeline. Related research in the United States and Europe shows that TPD is the leading threat to gas distribution pipelines and accounts for a major part of the total number of incidents reported [
18,
19]. Owing to the diversity and uncertainty, several models have been developed to predict the risk of TPD accidents and to estimate the amount of methane emissions [
20]. However, such models cannot be directly used in Hong Kong because the situation is different in Hong Kong. The leakage time is generally shorter as the dense population and restricted land area in Hong Kong allow for faster accident report and maintenance response. Once the TPD of the distribution pipelines occurs, town gas with low density dissipates into the air and is easily detectable due to its special odor. Residents nearby report the leakage within a short period of time, followed by emergency repairs carried out by the network team. Accordingly, although the leakage rate may be higher than normal fugitive leakage, the total amount is often small due to the relatively short leakage time. Based on the data provided by Towngas company, there were only eighteen TPD cases reported in Hong Kong in 2022.
The total leakage amount can be estimated by using the following equations:
where
and
are the total mass and volume of the TPD leakage;
is the density of town gas; and
and
are the mass flow rate and leakage time in case
, respectively. To calculate
, two situations should be taken into consideration.
For incompressible flow with
, we use
where
refers to the orifice discharge coefficient;
is the leakage area and
is the pipeline pressure.
For pipelines with
, the velocity of the released gas is sonic, and the flow is choked [
20]. By assuming the ideal gas,
under this condition can be calculated by
where
is the molecular weight of town gas;
is the gas constant;
is the temperature; and
is the adiabatic component of town gas.
2.2. Long-Term Permeation
Long-term permeation from pipelines is another part of gas leakage. Permeated gas can accumulate in unpredictable locations and lead to environmental and safety concerns. It is of great importance to determine the gas permeability of pipelines in gas distribution systems, especially for flammable and explosive gases such as hydrogen and town gas [
21].
Permeation is the diffusion of a substance through a solid body. The influencing factors of the gas permeation velocity through a pipeline wall include the concentration gradient, temperature, and pipeline material. Polyethylene (PE) pipelines are widely used for gas distribution thanks to their ease of installation, low cost, light weight, and chemical stability [
22]. Both Grand Canonical Monte Carlo (GCMC) and Molecular Dynamics simulations have been used to understand gas diffusion characteristics through PE pipelines [
23,
24]. Results have shown that compared with metal pipelines, PE ones are more prone to long-term gas permeation, owing to the higher solubility and diffusivity of specific gases. Therefore, only permeation from PE pipelines will be considered in this part [
25]. Town gas permeation is estimated by using the equation below [
26]:
where
is the permeated volume;
is the permeation coefficient;
is the average value of the inner and outer pipeline area;
is the ratio of the wall thickness to the pipeline diameter; and
is the pressure difference. The total permeation volume can be calculated by plugging in the data of town gas distribution pipelines accordingly.
2.3. Flaring upon Pipeline Commissioning
When new pipelines are installed, impurities may exist, such as dirt and oil, which could result in contamination risks or even accidents. For instance, hydrocarbons may cause explosions when mixing with oxygen reaching specific explosive limits and an ignition source. Therefore, pipeline commissioning is needed before operation. Commissioning refers to the practice of making a pipeline able to operate with the purpose of ensuring pipelines’ safety, reliability, and efficiency. Common procedures include pipeline cleaning and pigging, hydrostatic pretesting, dewatering, and flaring. Among them, only flaring, which aims to ensure pipeline safety and reduce the amount of GHG emissions, involves gas leakage into the atmosphere.
Sweep-through purging involves introducing an inert gas as the purge gas into the pipeline on one side and withdrawing the mixed gas on the other side [
27]. In our commissioning purge procedure, nitrogen is used as the purge gas to remove air in the pipelines, followed by the injection of town gas to complete the commissioning process. Therefore, town gas emissions during the nitrogen–town gas mixing process should be considered part of the total leakage. To minimize the environmental and safety concerns, town gas is completely flamed to carbon dioxide before venting into the atmosphere.
Herein, to obtain the leakage amount of town gas, the initial state (100% nitrogen) and final state (90% town gas and 10% nitrogen) are set accordingly. The leakage volume of town gas can be calculated by using the equation below [
28]:
where
is the volumetric flow rate of town gas;
is the flow time;
is the pipeline volume; and
and
are the initial and final concentrations of nitrogen, respectively.
is the correction factor that reflects the degree of deviation from perfect mixing. For pipes,
equals to 0.25 [
26]. The total town gas leakage volume by commissioning purge can be determined by the summation of all the cases:
2.4. Flaring and Purging upon Pipeline Decommissioning
Pipeline decommissioning refers to the safe removal of pipelines from operation. Similarly to commissioning purging, nitrogen is used as the purge gas to remove town gas from the pipeline. For pipelines with pressure above 1 kPa, GHG emissions can be divided into two parts. When decommissioning starts, town gas will be continuously flared until the pipeline pressure is below 1 kPa. Accordingly, the methane and carbon monoxide in the town gas will be converted into carbon dioxide at the end of pipelines and contribute to one part of GHG emissions. The remaining town gas will be purged directly into the atmosphere as the other part of GHG emissions.
Herein, the flared mass of town gas and emitted carbon dioxide can be estimated by
where
and
are the pressure and volume of pipeline
;
is the atmospheric pressure;
is the mass percentage of the specific gas
in town gas; and
is the molecular weight of gases.
After flaring to 1 kPa, the total purged mass of town gas can be calculated by
where
is the town gas density after flaring to 1 kPa.
2.5. Fugitive Leakage from Pipelines
This part contains fugitive leakage from different parts of the town gas distribution system, including leakage due to localized corrosion, crack lines, plug seepage, joint seepage, valve spindle seepage, material transition fitting seepage, etc. Such leakage cases would be either detected by the Towngas workers during regular inspections or reported by the nearby residents.
Compared with the TPD leakages that are often reported and repaired within a short period of time, fugitive leakage cases may be fixed after a relatively long period of time because they tend to have lower leakage rates and are thus harder to detect. A small leakage can exist for about one month, resulting in a large leakage amount. According to historical records, fugitive leakages have an average general leakage rate of <0.002 kg/s, and this is adopted for modeling purpose/calculation in this paper. In addition, the number of incidents of fugitive leakage is much higher than that of the TPD leakage. According to the data collected, there were 278 fugitive leakage cases and 18 TPD cases reported in 2022.
After reviewing the consolidated data and the nature of the majority of leaking cases, we concluded upon a typical case of leakage rate of
for application to the 278 cases. Among them, 53 cases were reported by the public while the rest were detected by Towngas’ regular survey. The average leakage time for public reported cases was empirically determined to be 1 week, while the time for regular surveyed cases was 1 month. The total leakage amount of fugitive leakage can be estimated by
3. Results and Discussion
The overall results of town gas leakage estimation (Hong Kong, 2022) are listed in
Table 3. The leakage volume from different sources was calculated based on the simplified methodology above. Among the five leakage sources, fugitive leakage was determined to be 1,938,914
, which accounted for a major part owing to the large incident number and long leakage time. Commissioning (38,059
) and TPD cases (16,833
) also contributed to a considerable amount of town gas leakage, followed by decommissioning (8761
) and permeation (7425
). According to the data reported by Towngas, the total heating value of town gas sales was 27,398
in the year of 2022, corresponding to 1,586,458,492
of town gas in volume. Accordingly, the leakage percentage of each component could be estimated. The total leakage percentage was determined to be 0.13%. This value is comparable to Lamb’s results in 2015 (0.10% to 0.22%) and Macrogaz’s results in 2020 (0.1% to 0.2%), validating our method for estimating the emissions [
7,
10].
Table 1 shows that the two GHGs included in town gas are CO
2 (18
) and CH
4 (29.35
). As stated by the IPCC 6th assessment in 2021, the warming potential of methane is 28 [
29]. The emitted CO
2, CH
4, and CO
2 equivalent (CO
2e) from different leakage sources were calculated accordingly. In summary, the total CO
2e leaked from the Towngas distribution system in Hong Kong in 2022 was 11,944.07
. Among the five sources, fugitive leakage accounted for 11,744.16
as the most important contributor. Notably, in both the commissioning and decommissioning part, CH
4 leakage only accounted for a very small proportion, resulting in a relatively low CO
2e leakage amount and a reduced environmental concern. This benefited from the combustion process that converts both CH
4 and CO in town gas into CO
2 before purging into the atmosphere.
To verify the reliability of our simplified methodologies, our results were compared with benchmarks from studies of natural gas distribution systems in non-Asian counties. Their emission factors (EFs) from natural gas distribution systems were applied to our town gas distribution system. Natural gas is normally composed of 70–90 mol% CH
4 [
30], and therefore, 80 mol% CH
4 in natural gas was used to convert the EFs from natural gas to town gas. By combining these with the activity factors (AFs) for each component in Hong Kong in 2022, the total town gas emissions could be estimated based on models built in the U.S. and Europe.
Table 4 lists the town gas pipeline lengths with three different materials. In Hong Kong, polyethylene (PE) and ductile iron (DI) are the two main materials for gas distribution pipelines. As no specific EFs are available for galvanized iron (GI) pipes, they were grouped into the category of “metal iron” with DI pipes and their gas leakage property was assumed to be the same as that of DI pipes. The listed pipeline lengths were used as AFs for further calculations.
Table 5 summarizes the EFs for different pipeline materials from other works.
Table 6 lists the results of town gas leakage and CO
2e estimated based on other models. The first three models, namely 1992 GRI/EPA, 2015 USA Lamb, and 2020 USA Zachery, were built in the U.S., while the rest two were obtained from Europe. Next, results from all the five models will be discussed separately.
The total town gas leakage was calculated to be 4,045,051
by using the model of the U.S. GRI and EPA in the 1990s [
5], which was much higher than our result of 2,009,991
and those of the other four models. The higher value estimated by the U.S. GRI/EPA model was due to the large EFs adopted in the model then. Following the substantial replacement and upgrades of pipelines and equipment in the gas distribution systems since the 1990s [
6], EFs have been updated [
7]. Applying the updated model to our case gave a town gas leakage of 1,016,988
and 0.064% of gas sales, which were lower than those in our own estimation. The limitation of Lamb’s study lies in the reliance on utility leak inventories derived from traditional leak survey approaches such as high-flow sampling method. Differently from cities like Hong Kong, the U.S. is sparsely populated, and therefore, random sampling may not fully reflect the gas leakage cases. When adopting the 2020 USA Zachery model which provides a new set of EFs [
31], we obtained a total town gas leakage of 2,782,956
, higher than that estimated by the 2015 USA Lamb model and our own result. This higher value might be attributed to the new method, namely, advanced mobile leak detection (AMLD), combined with utility pipeline GIS, which provides a more comprehensive leakage finding skill.
Apart from the models built in the U.S., two sets of EFs were also established in Europe, including 2004 NED and 2020 Macrogaz [
10,
32]. As shown in
Table 6, similar town gas leakage volumes (761,494
by 2004 NED and 695,044
by 2020 Macrogaz) were calculated based on the two European models, which were both smaller than our results. Notably, Macrogaz covered 23 member organizations in 18 countries in Europe by using different leak measurement techniques [
10]. Therefore, the 2020 Macrogaz results should be more reliable than the 2004 NED results, owing to the considerable database combined with their experienced sampling and statistical methods. Meanwhile, the pipeline system in Hong Kong was constructed using British standards, which are similar to those in Europe. In this context, Macrogaz-derived EFs were believed to be reasonable references and were chosen as part of our results after combination with the AFs in Hong Kong in 2022.
In general, despite the different methodology in leakage measurements and various pipeline situations in gas distribution systems, our results closely align with benchmarks from other works. By combining the 2020 Macrogaz model with our work, the estimated town gas leakage in Hong Kong in 2022 was between and and the total leaked CO2e was in the range of to . The total leakage percentage with respect to town gas sales was determined to be between 0.045% to 0.13%. These results support the hypothesis that simplified methodologies can provide accurate leakage estimates comparable to more comprehensive approaches.
This study represents the first success of this kind in Hong Kong, but it is not free of limitations, which leaves room for improvement in future endeavors. Currently, fugitive leakage cases with lower leakage rates are harder to detect, leading to potentially longer and uncertain fixed leakage time. In addition, onsite leakage measurement by methane detectors might be inaccurate due to different leakage types, measuring locations, and wind speeds. Thus, advancements in emission identification and quantification technology are needed to further increase the accuracy and reliability of the estimation. For instance, AMLD combined with GIS may provide more comprehensive fugitive leakage collection, which could help develop a new set of EFs in Hong Kong. In addition, we believe that conducting pipeline leakage experiments is necessary to obtain more specific EFs tailored to different regional conditions. For example, the relationship between the gas leakage rate and the aperture size of pipeline damage requires a combined approach of experiments and simulations to establish a functional relationship. Moreover, for the same type of pipeline, it is essential to establish the relationship between the aperture size of pipeline damage, the probability of occurrence, and service life, in order to set targeted pipeline service life limits.
4. Conclusions
This study tested the hypothesis that urban gas leakage can be accurately estimated using simplified methodologies with error margins comparable to those observed in studies of other urban gas systems worldwide. Using the town gas leakage from the distribution system in Hong Kong in 2022 as an example, the total town gas leakage volume and corresponding CO2e amount were in the range of to and to , respectively. The leaked gas accounted for 0.045–0.13% of the total town gas sales in 2022. Among the five leakage sources provided by Towngas, fugitive leakage accounted for the major part with the leakage volume of . Therefore, to significantly decrease the gas leakage, pipeline replacement in the oldest and most leaky pipe sections should be conducted, together with frequent leakage inspections. To comprehensively benchmark all emission factors (EFs), those from previously reported studies were adapted to the town gas scenario and combined with the current activity factors (AFs) in Hong Kong to calculate leakage amounts, providing actionable data for policymakers and utility companies to address gas leakage issues and support efforts to reduce greenhouse gas emissions. A comparison of the results using different models with our own results showed that the estimated leakage amount varied with years, regions, and sampling methods. For instance, upgrades of pipeline materials may contribute to smaller EFs and thus to reducing the total gas leakage amount. Future work should focus on advancing emission identification technologies (e.g., AMLD-GIS integration), conducting pipeline leakage experiments to establish region-specific EFs, and developing functional relationships between leakage rates, aperture sizes, occurrence probabilities, and service life to optimize pipeline lifespan management. In summary, our work offers a simplified but accurate estimation of the town gas distribution system in Hong Kong and provides a general approach for estimating pipeline leakage for other parts of the world.


