

Dispersion Modeling of Odor Emissions from Area Sources in a Municipal Wastewater Treatment Plant

 ,
, 

 , ,
, ,
Abstract
1. Introduction
2. Materials and Methods
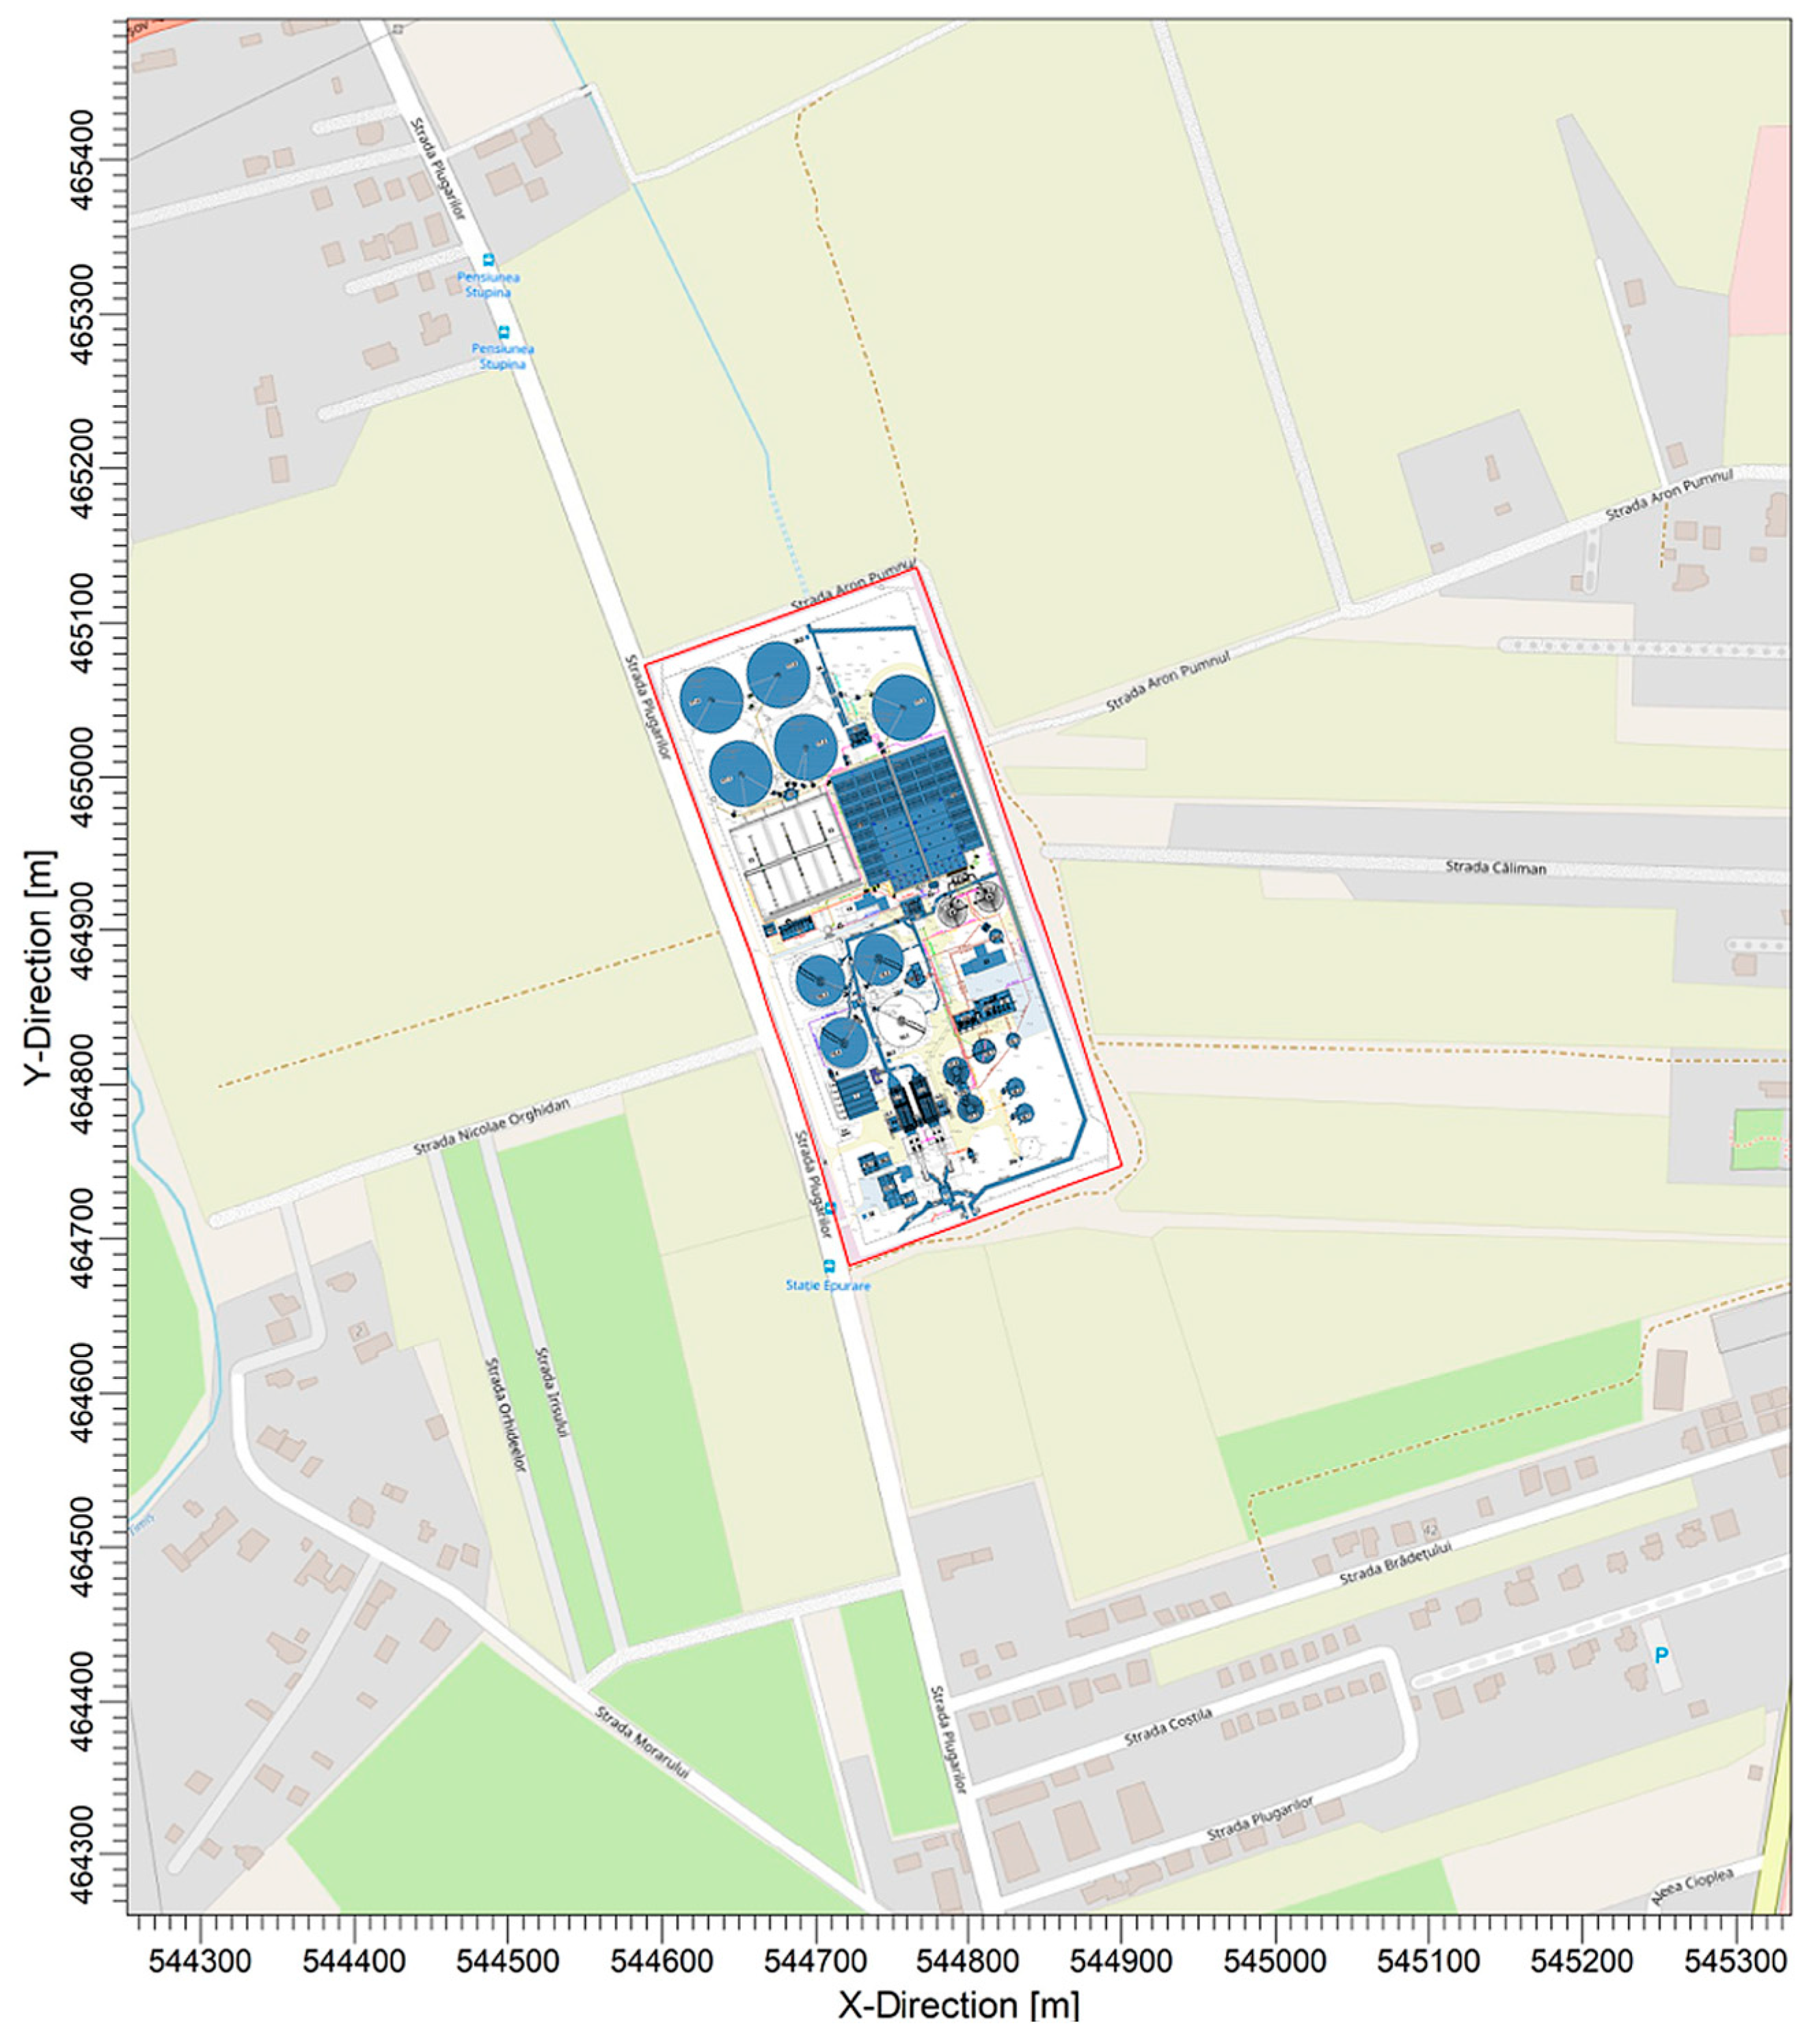
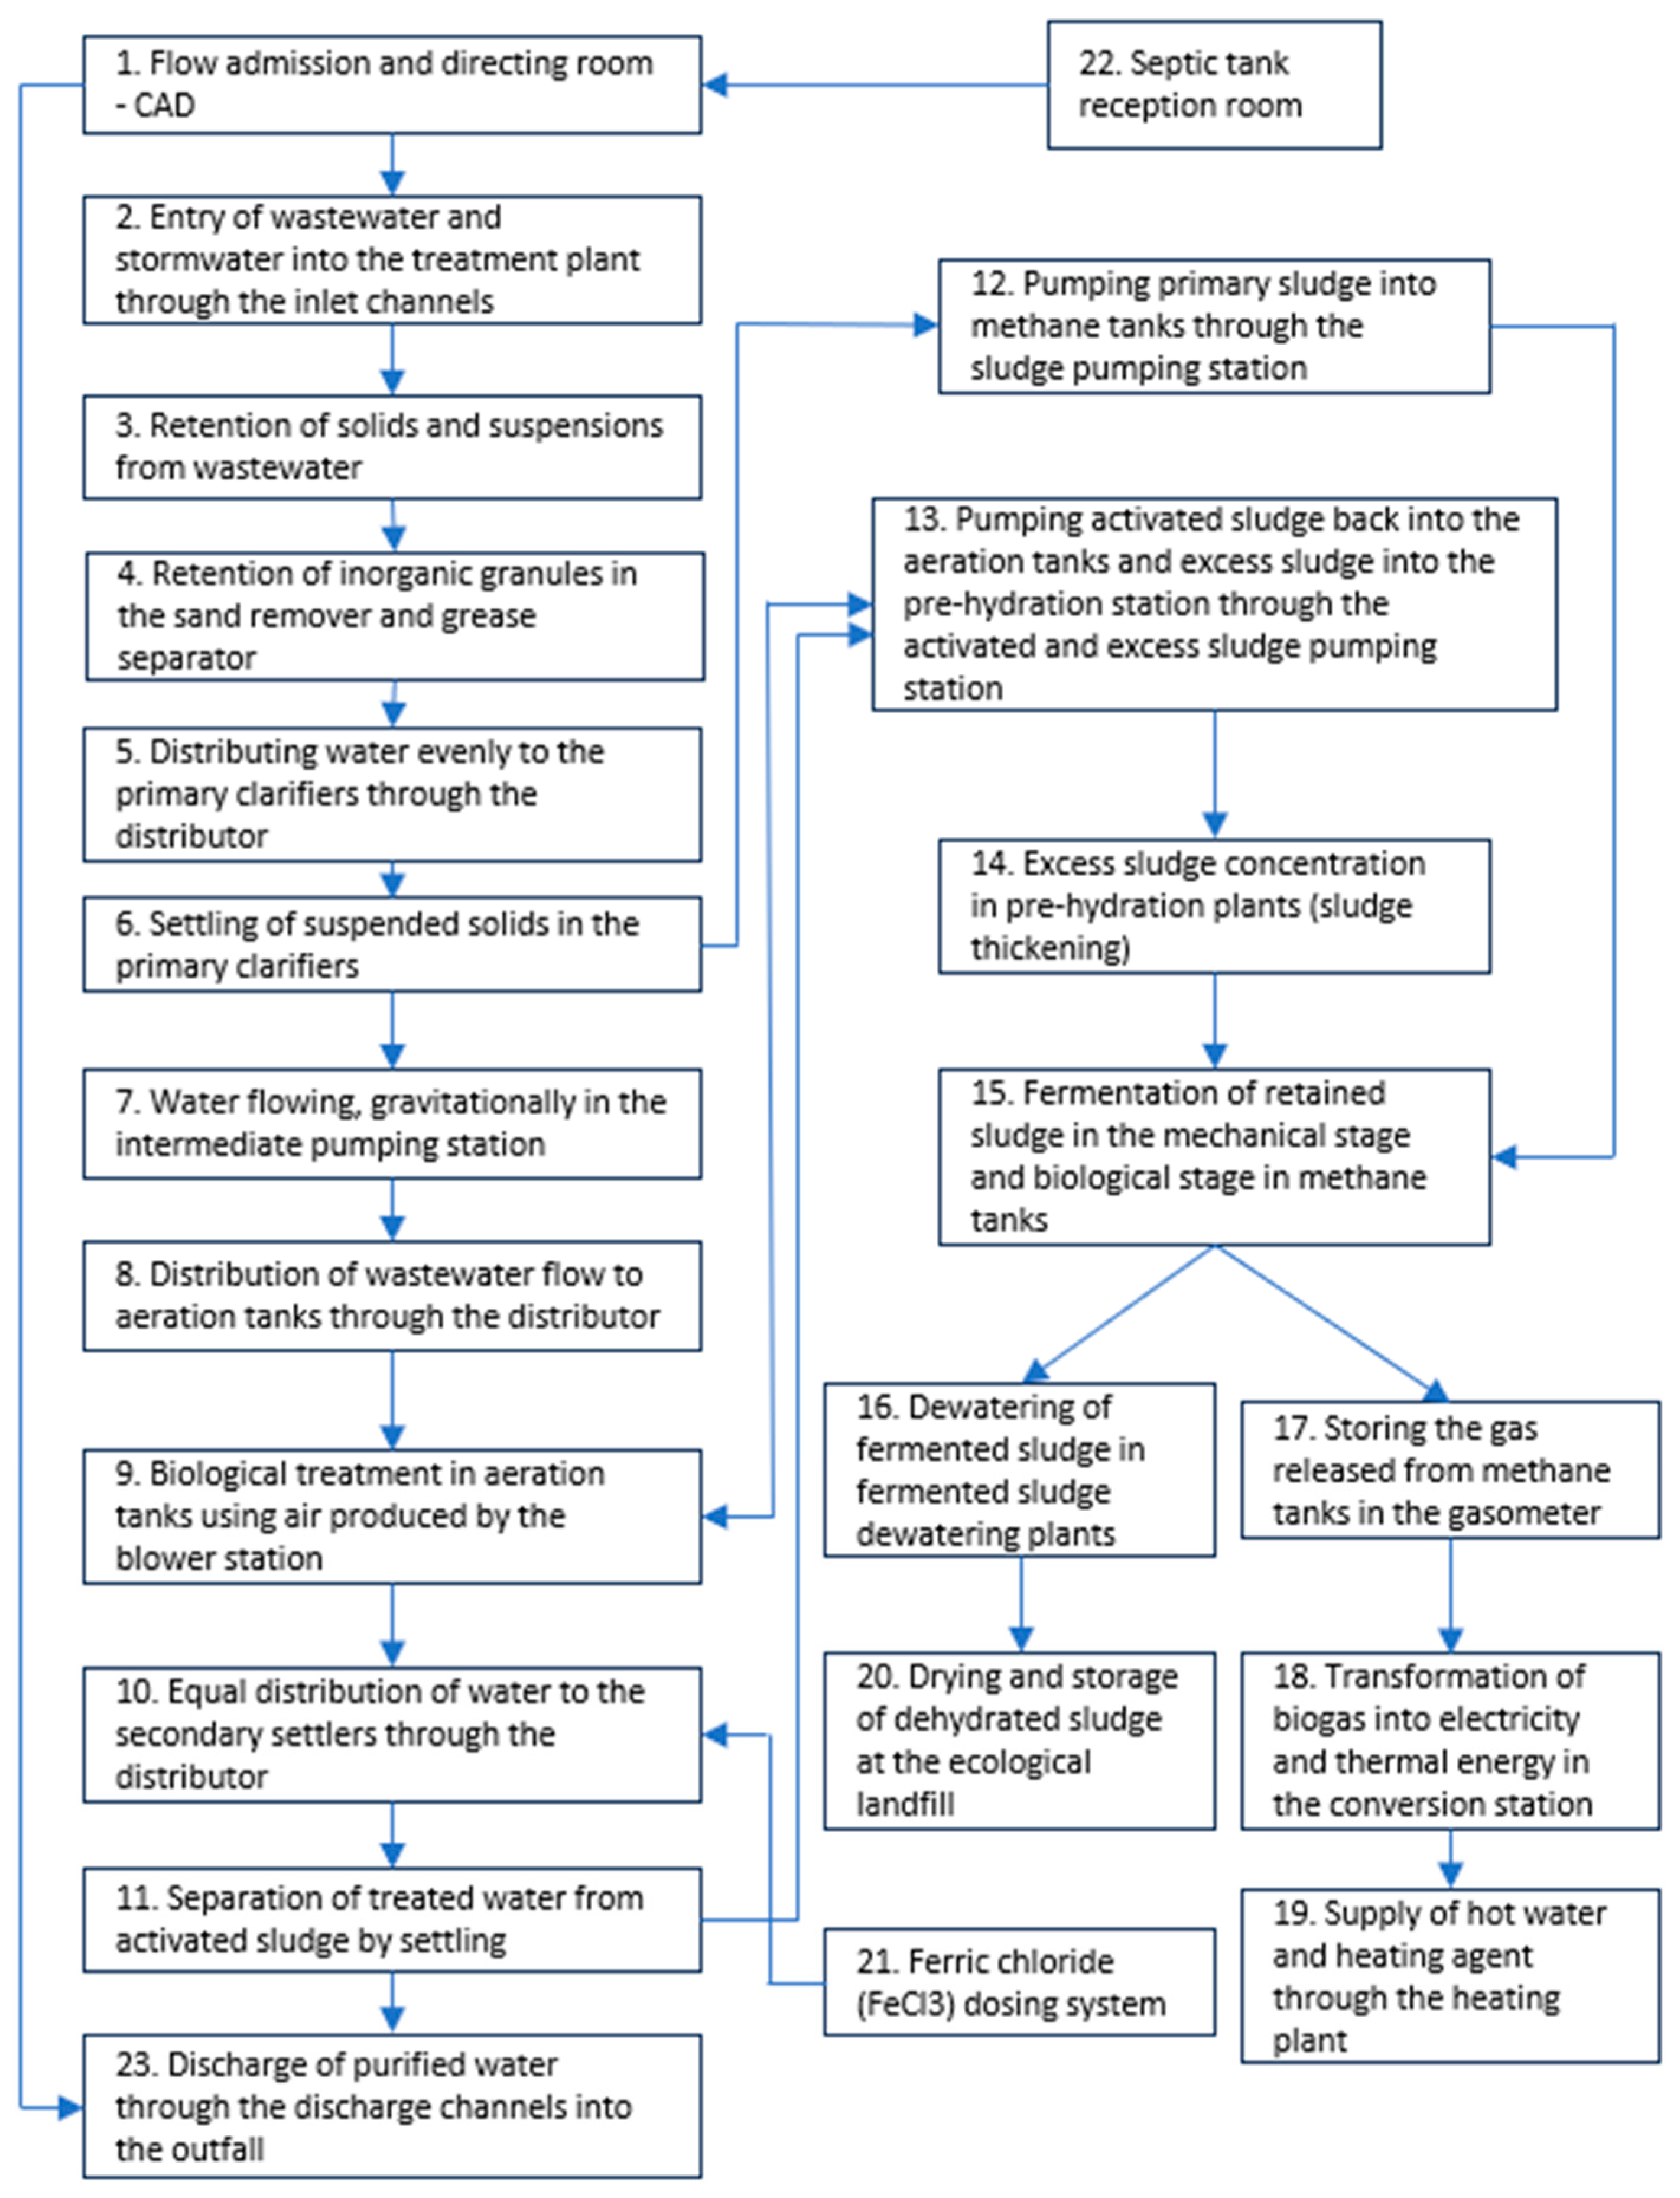
2.1. Description of the Wastewater Treatment Plant and Main Odor Sources
2.2. Odor Measurements
2.3. Determination of Odor Emission Rate from Area Source
- SOER is the specific odor emission rate in ouE/m2/s;
- Qair is the airflow inside the hood (m3·s−1) (equal to 180 L/h);
- Cod is the odor concentration in ouE/m3;
- Ahood is the area of the wind tunnel in m2 (equal to 0.5 m2).
2.4. Model Description
- A Uniform Cartesian Grid was used to apply two receptor networks, with one on the entire surface of the dispersion map (6200 × 6200 m) and 32 points spaced 200 m apart, giving a total of 1024 receptors. The second network was applied centrally at the site level, covering 2450 × 2450 m and having 50 points spaced 50 m apart, giving a total of 2500 receptors for a uniform distribution of the iso–concentration curves at the level of the dispersion maps.
- Topographic data processing was performed using the AERMAP terrain processor, which is included in the AERMOD software platform. The “flat terrain” option was used with a digital map in SRTM 30 format (Shuttle Radar Topography Mission) with the aim of creating digital terrain maps over almost the entire surface of the Earth with a resolution of 30 m.
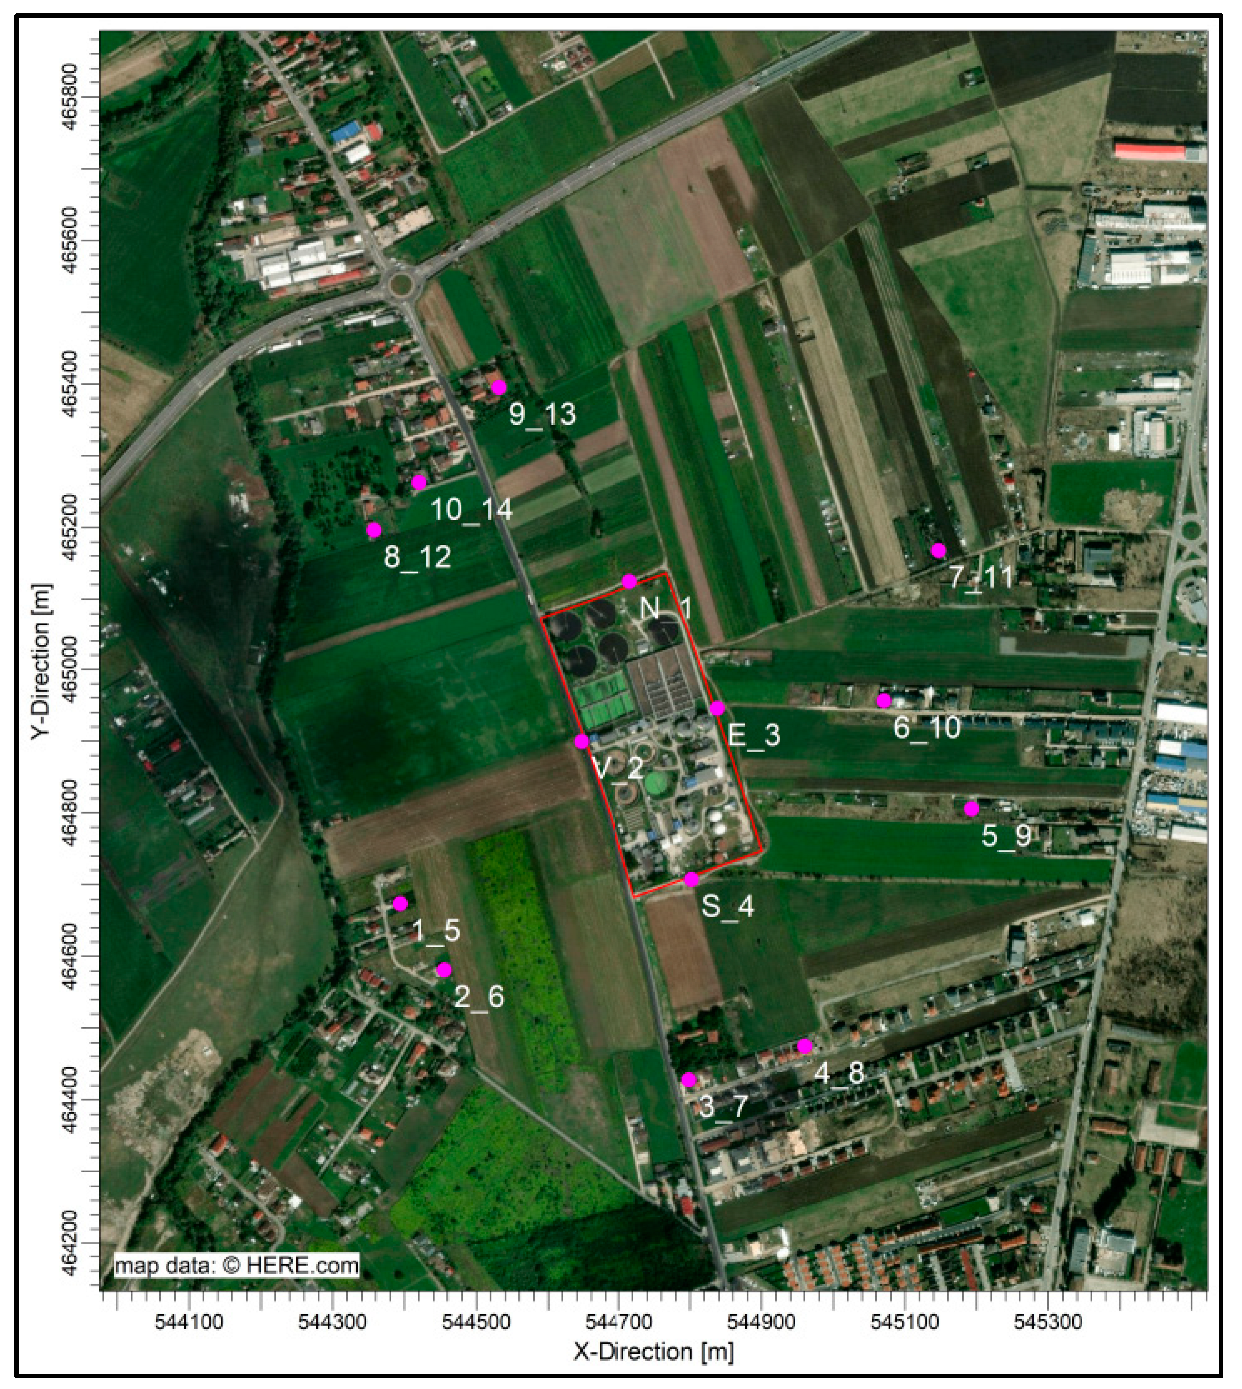
- To draw attention to the odor concentrations estimated at the property’s edge and in populated areas close to the WWTP, 14 locations of sensitive Cartesian receptors were inserted in the model (4 at the property’s edge and 10 in populated areas), as shown in Table 1.
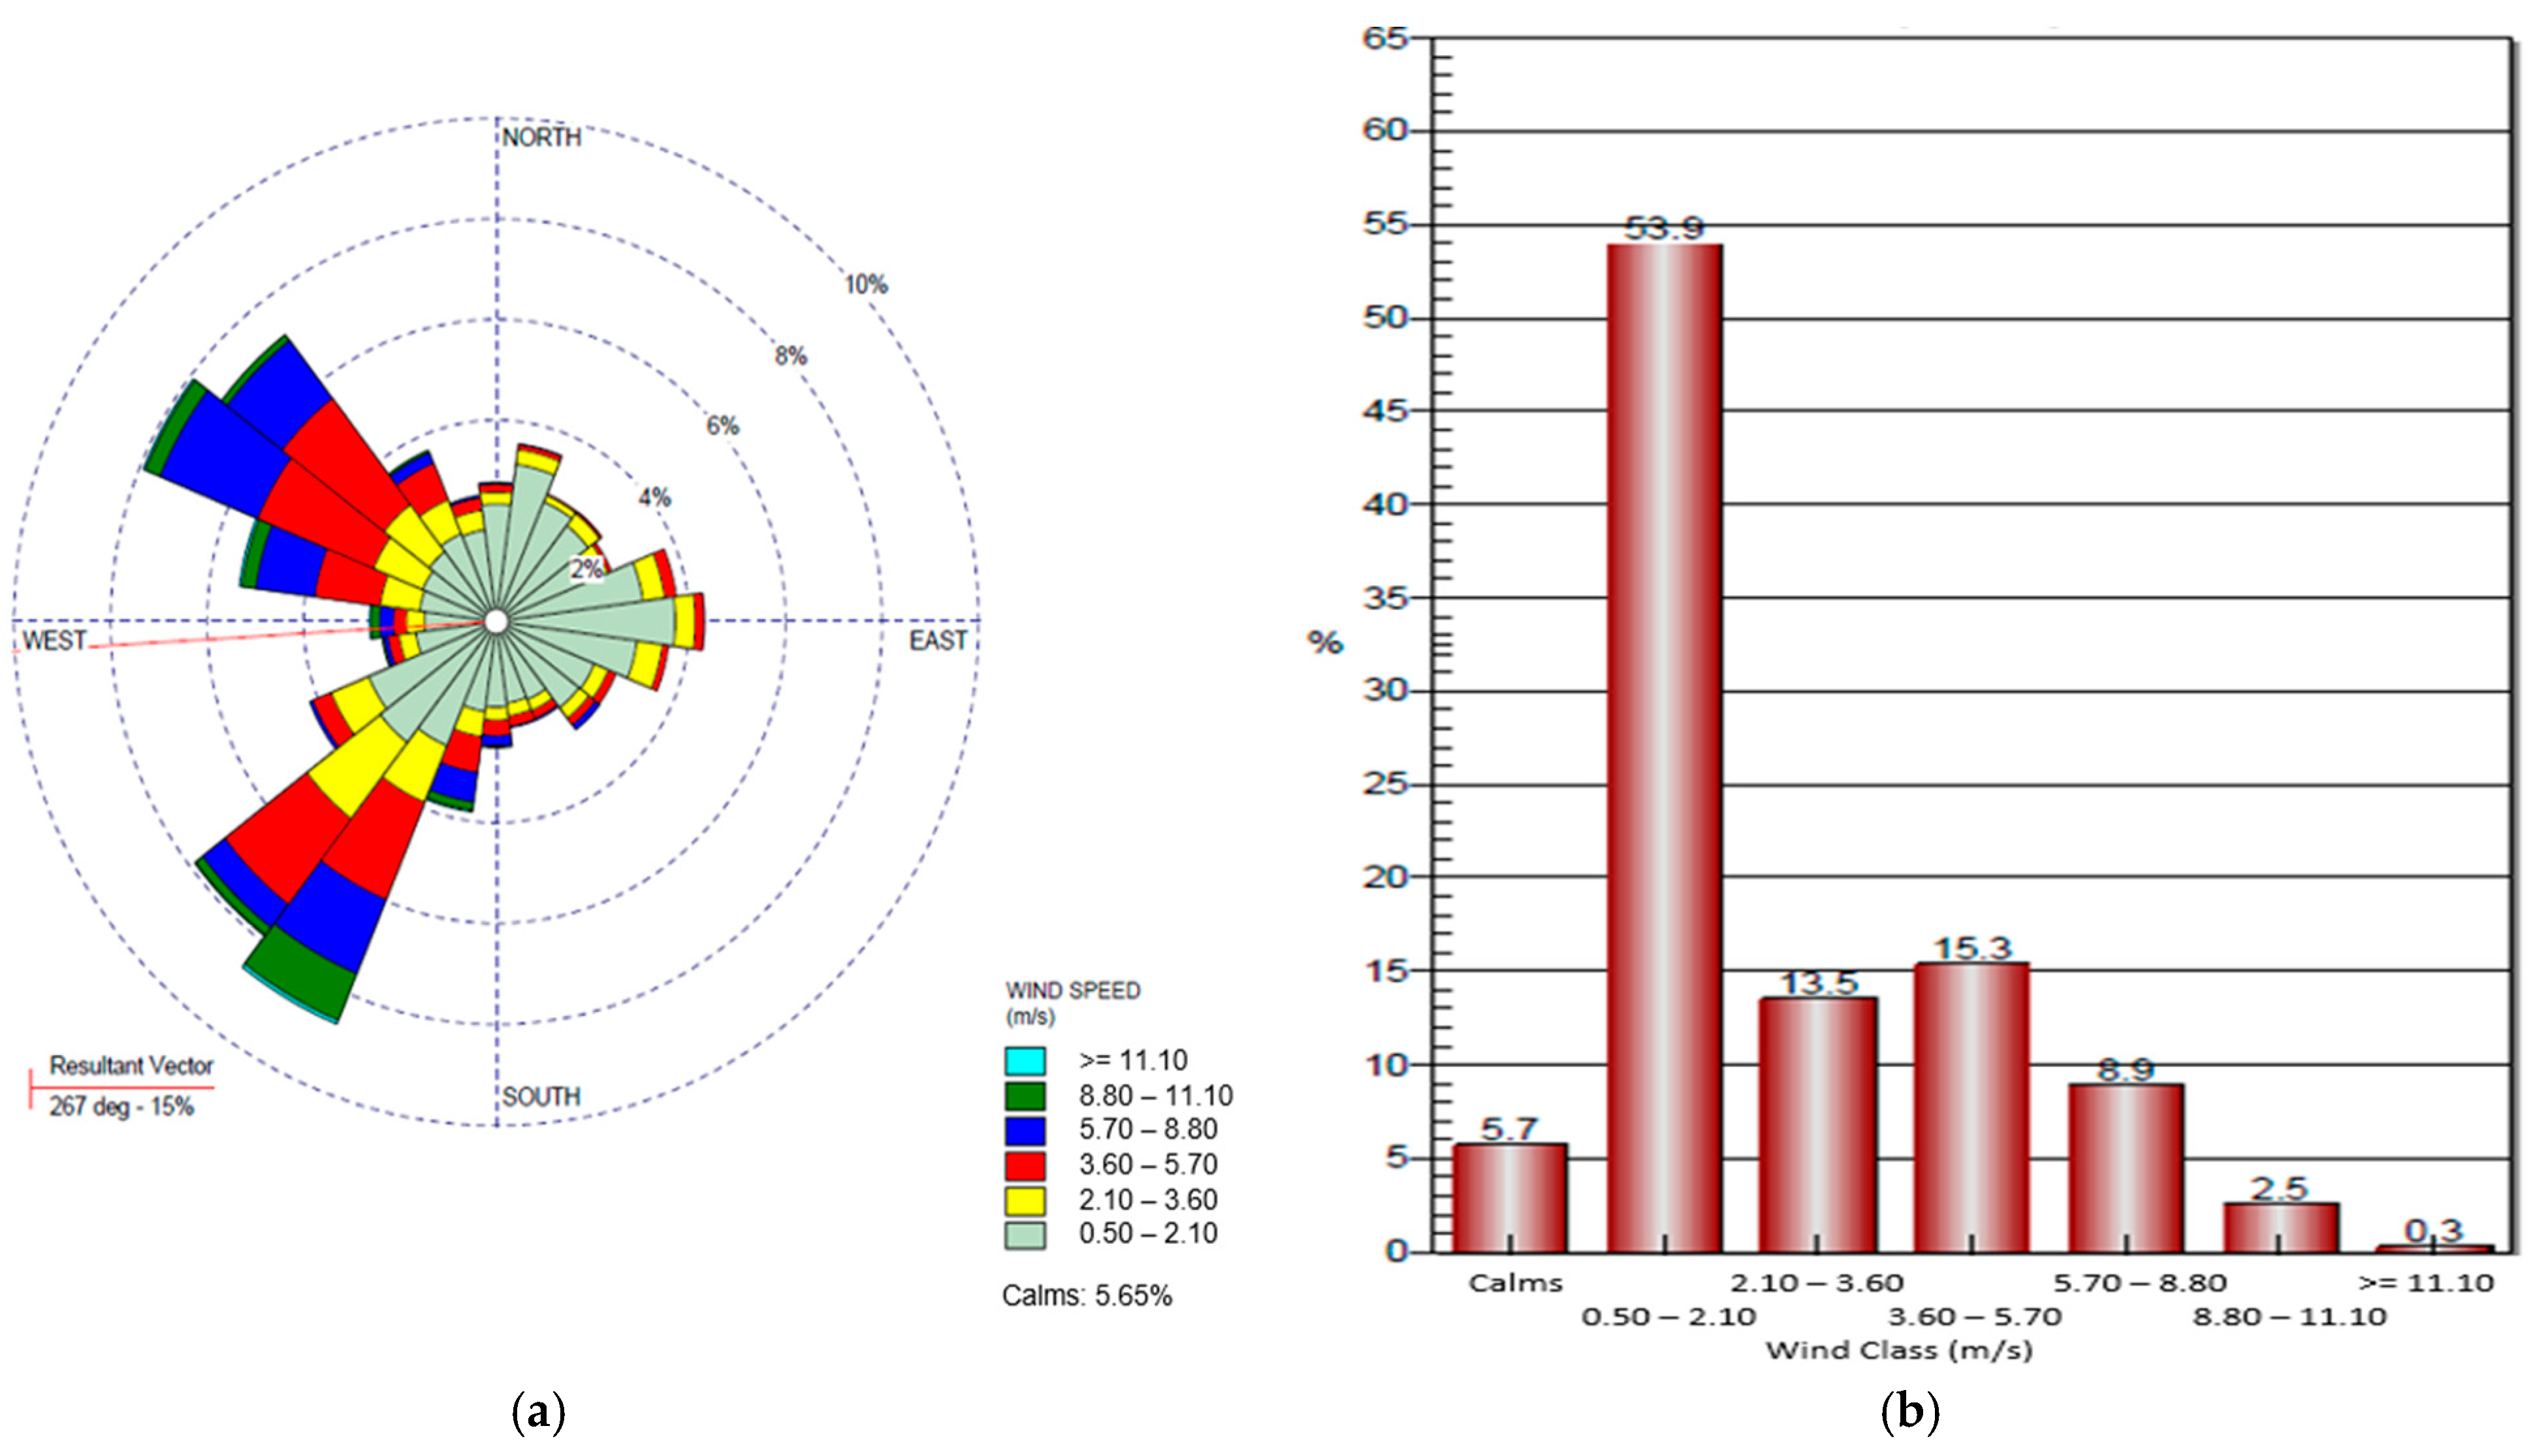
2.5. Meteorological Data Used
2.6. Analyzed Parameters
- A Horiba APSA-370 for ambient H2S monitoring measured the SO2 converted H2S through an oxidation catalyst based on Ultra Violet Fluorescence. In order to reduce the measurement error by water concentration fluctuation in ambient conditions, the humidifier was set at the sample line. This enables long-term stability according to stabilizing catalytic reaction. The analyzer operates within a measurement range of 0 to 0.5 ppm, making it well suited for monitoring low concentrations of H2S in a variety of environments. It delivers high performance, with a repeatability of ±1.0% and linearity of ±1.0%, ensuring both precision and reliability throughout the entire measurement range. The measurement uncertainty is estimated at ±19%.
- A Horiba APNA-370 automatic analyzer for ambient ammonia monitoring measured increased nitrogen oxide (NOx), which was found to have reacted through oxide catalyst treatment via the ammonia (NH3) concentration with the chemiluminescent (CLD) method. HORIBA’s original cross-flow modulation method ensures long-term stability and reliable measuring value with 5 ppb for minimum detectable sensitivity. This analyzer is capable of measuring NH3 within a range of 0 to 0.5 ppm, making it suitable for monitoring the low concentrations typically found in environmental and industrial settings. It offers excellent performance characteristics, with a repeatability of ±1.0% and linearity of ±1.0%, ensuring both consistent and accurate results across its full measurement range. The measurement uncertainty was estimated at ±18.3%.
- The Thermo-FID model PT introduces a complete plug and play portable analyzer measuring Org.C components from a high range (ppm) to very low range (LEL). The portable unit includes gas bottle compartments and pressure regulators for both hydrogen and span gas. The instrument provides a built-in temperature regulator and mains supply for the standard external heated sample line (samples). It has a measurement range between 0 and 100 mg/Nm3. Calibration gases, specifically propane of a known concentration, are used to calibrate the analyzer. The measurement uncertainty was estimated at ±7.5%.
3. Results
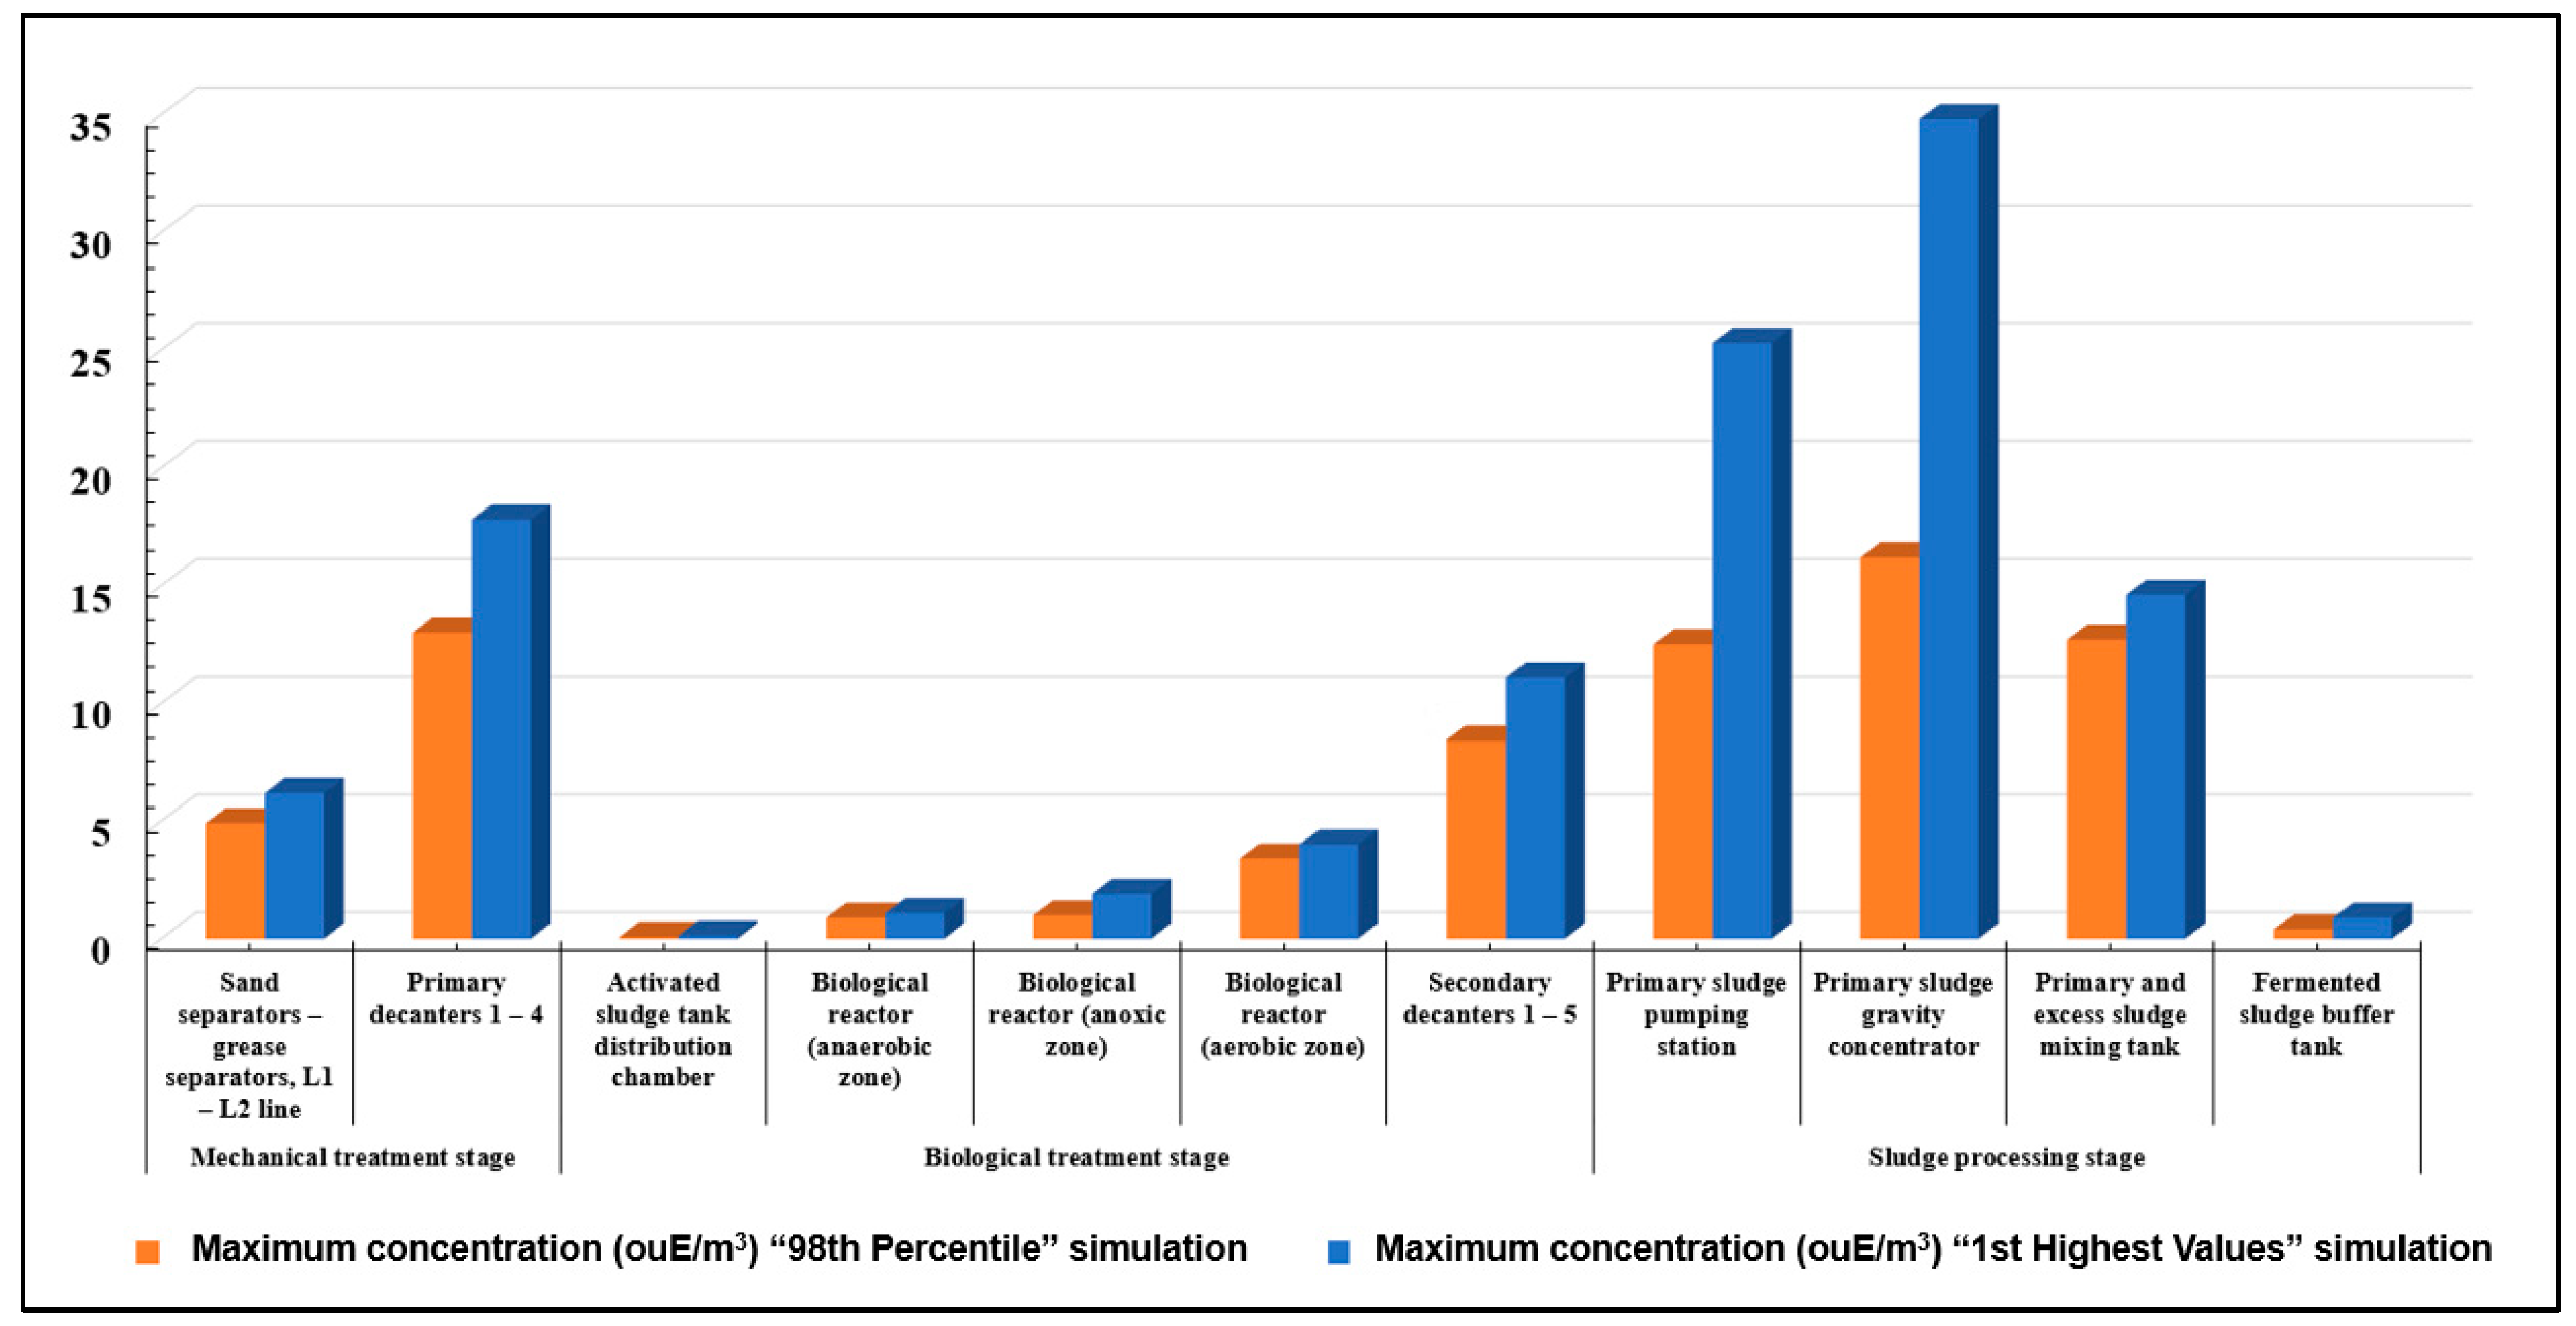
3.1. Results of the Odor Concentrations by Dynamic Olfactometry
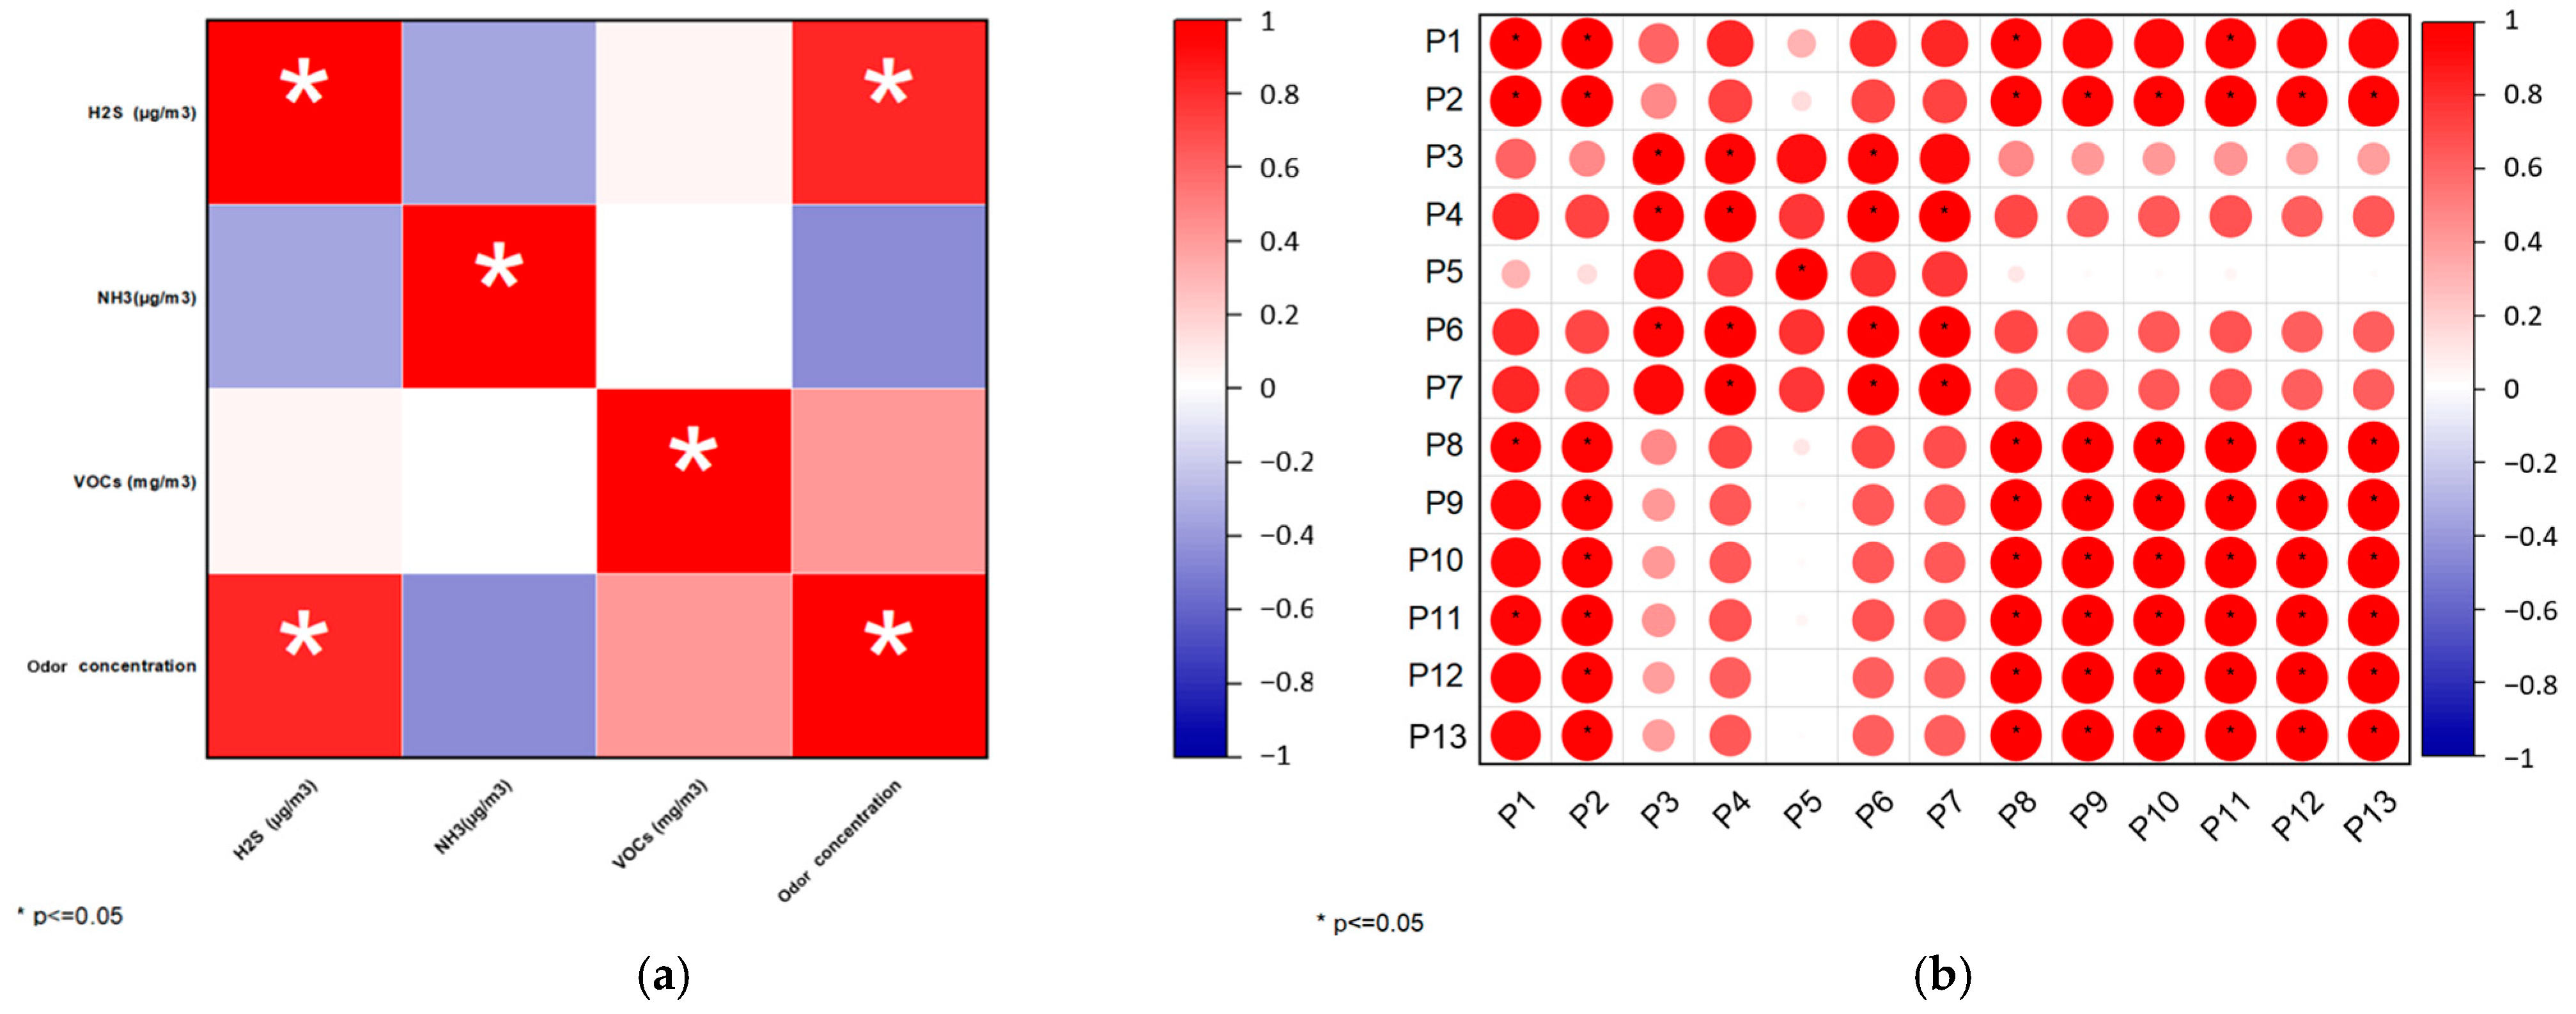
3.2. Pearson Correlation for the Analyzed Parameters
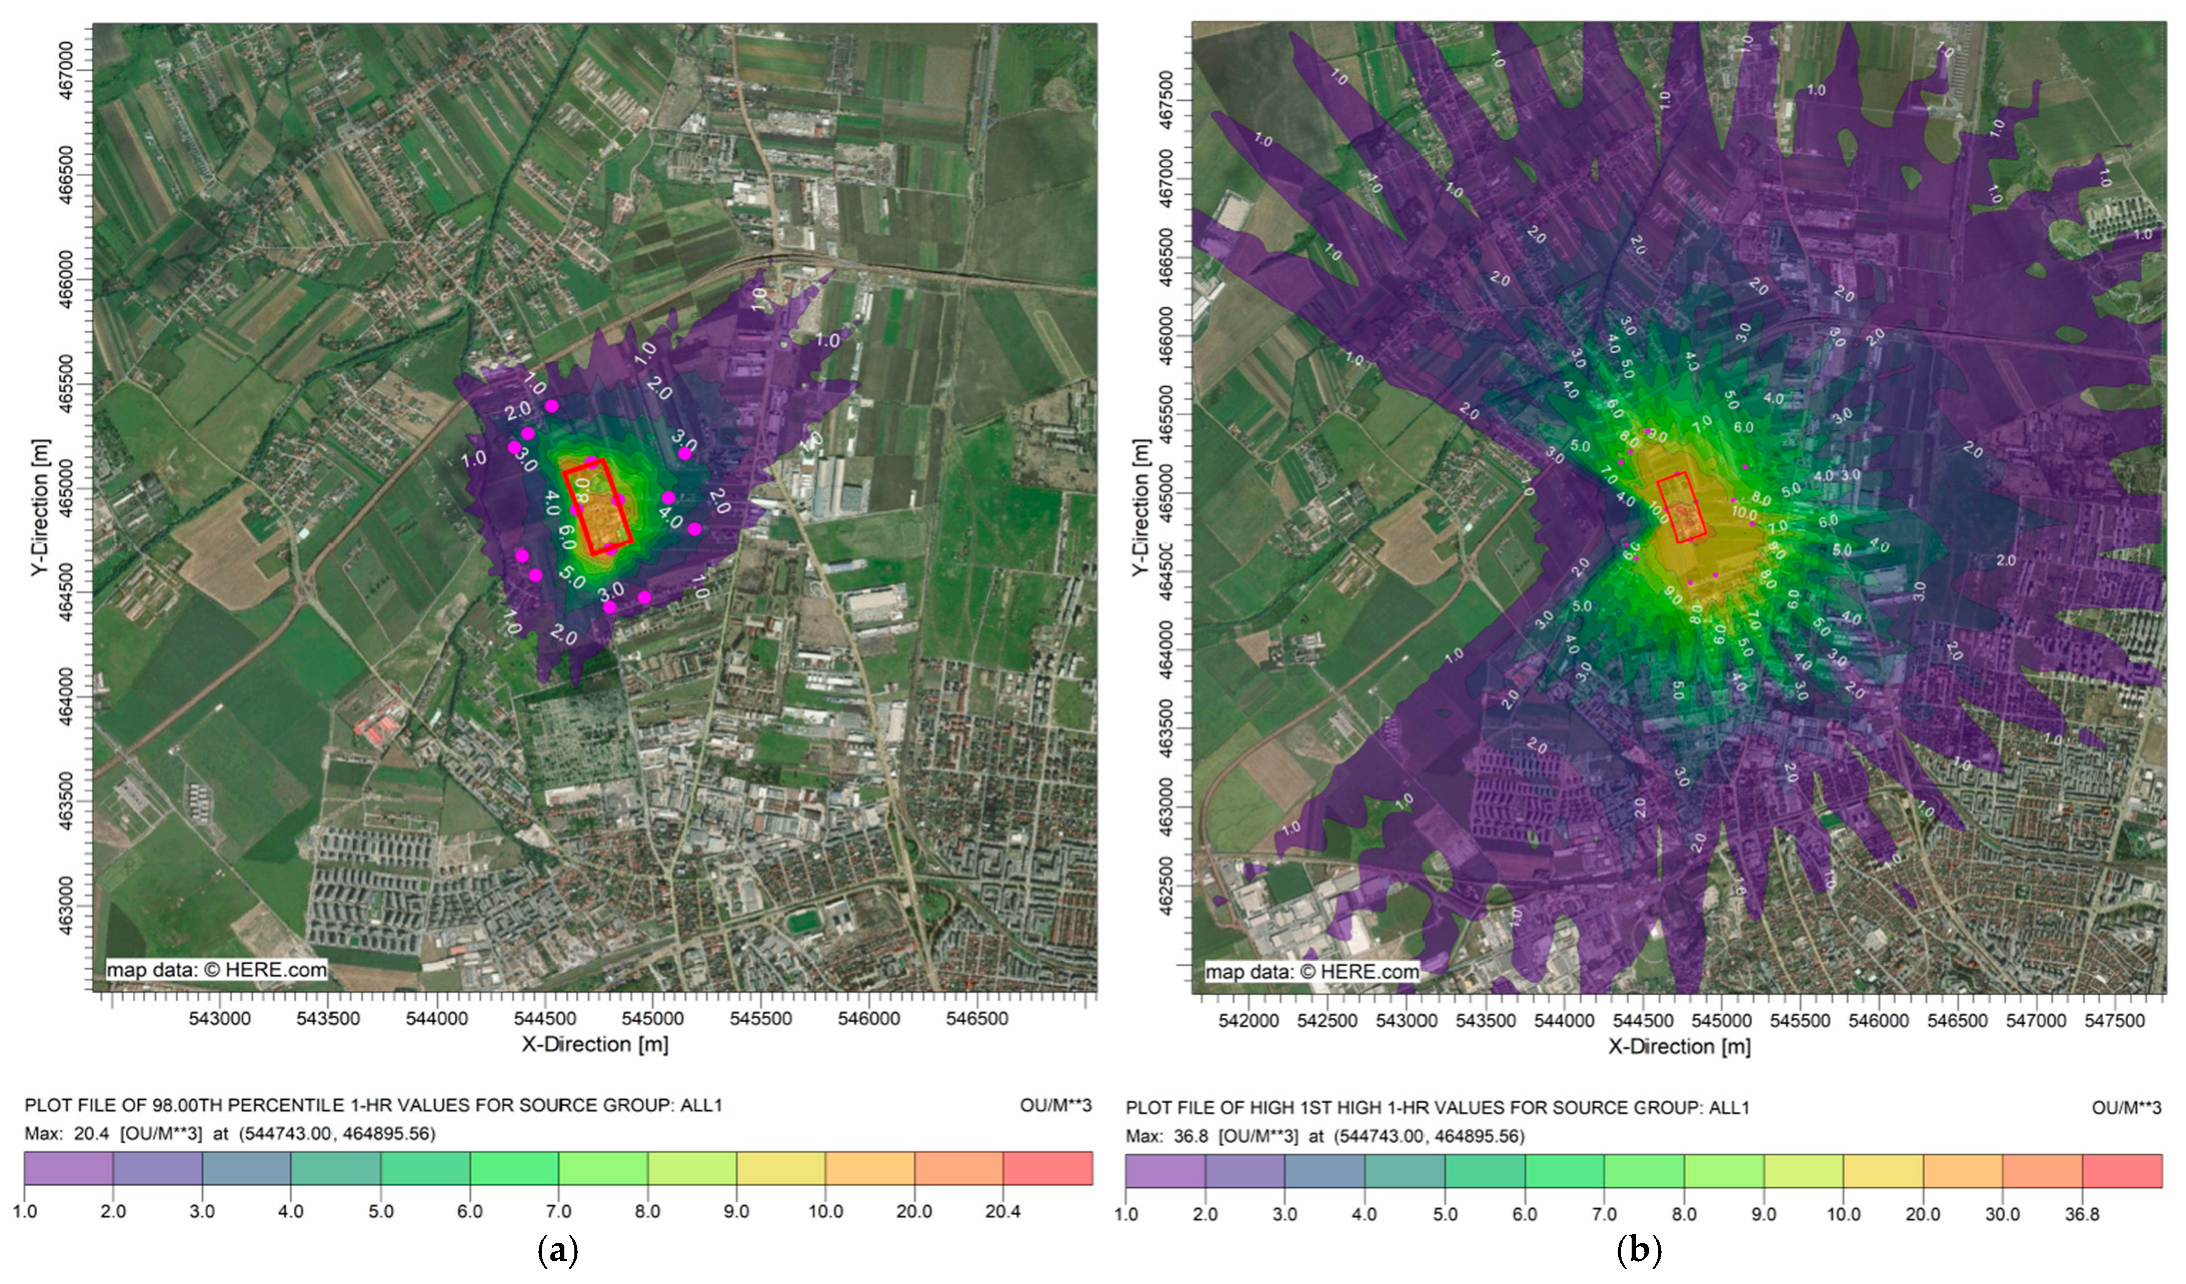
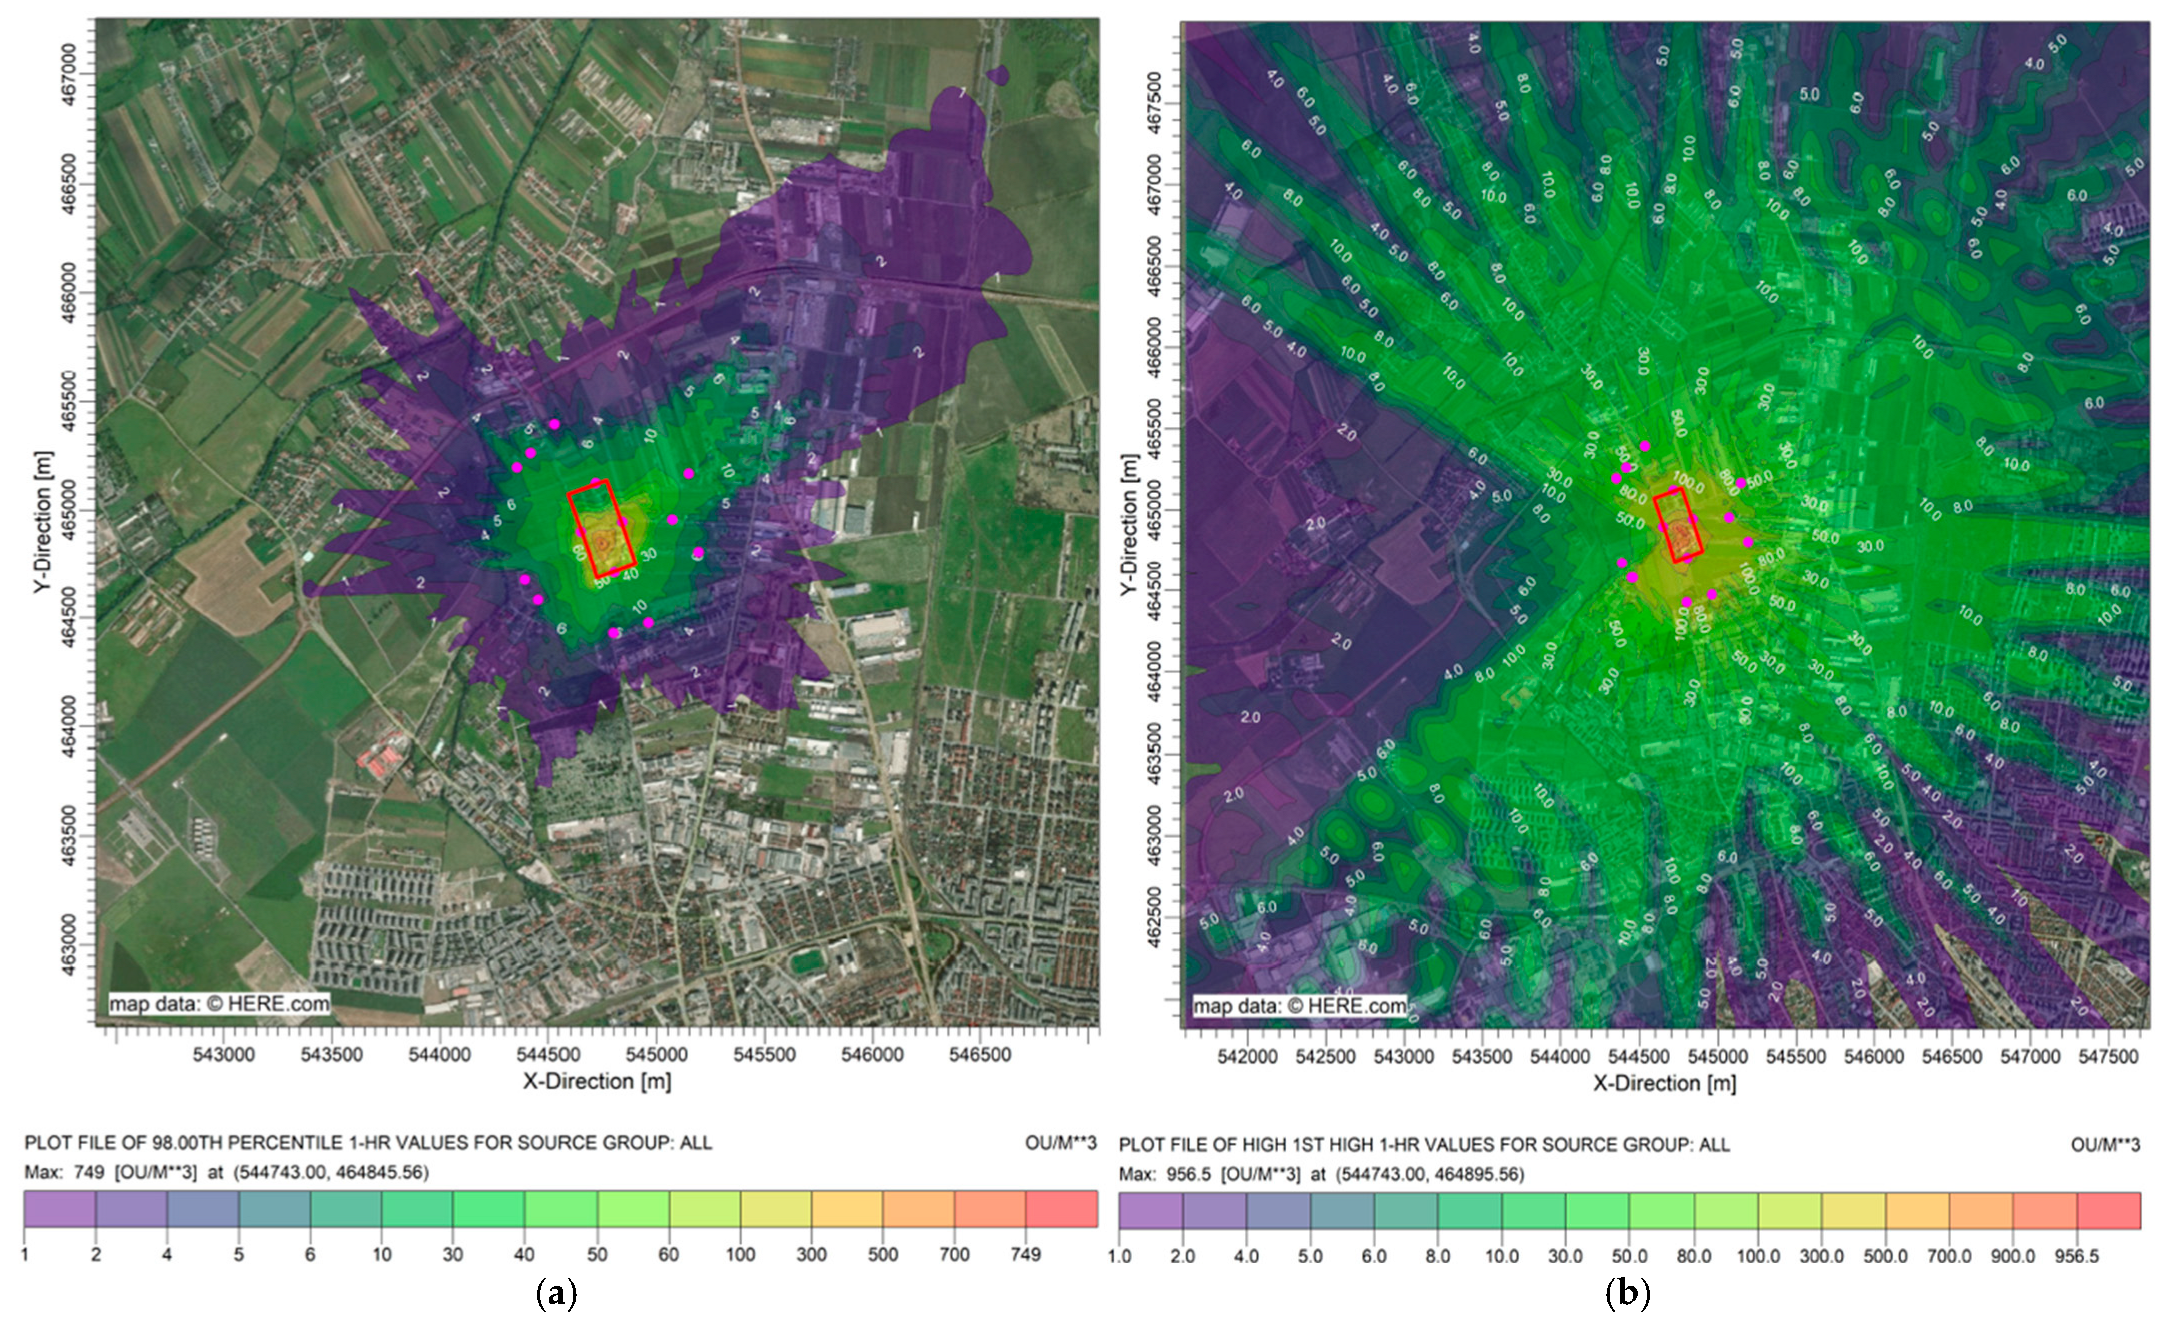
3.3. Results of the Odor Concentrations by Mathematical Modeling in the Surrounding Air
- The concentration of 1 ouE/m3 was considered as the minimum odor concentration perceived by 50% of the population, although only a part of the population showed a biological response at this concentration.
- The limit values established by some European countries for residential areas are located in the range of 2–7 ouE/m3, and these are accompanied by a maximum number of hours per year when these limits can be exceeded or the 98th percentile value is applied.
- The range of 5 ouE/m3 to 10 ouE/m3 is where olfactory discomfort occurs.
3.4. Result of the Odor Concentrations on the Environmental Air
4. Discussion
5. Conclusions
Author Contributions
Funding
Institutional Review Board Statement
Informed Consent Statement
Data Availability Statement
Acknowledgments
Conflicts of Interest
References
- Munsif, R.; Zubair, M.; Aziz, A.; Nadeem Zafar, M. Industrial Air Emission Pollution: Potential Sources and Sustainable Mitigation. In Environmental Emissions, 1st ed.; Viskup, R., Ed.; IntechOpen Limited: London, UK, 2021; pp. 1–13. [Google Scholar] [CrossRef]
- Zhou, P.; Sun, S.; Chen, T.; Pan, Y.; Xu, W.; Zhang, H. Impacts of Social Inequality, Air Pollution, Rural–Urban Divides, and Insufficient Green Space on Residents’ Health in China: Insight from Chinese General Social Survey Data Analysis. Int. J. Environ. Res. Public Health 2022, 19, 14225. [Google Scholar] [CrossRef] [PubMed]
- Gutiérrez, M.C.; Hernández-Ceballos, M.A.; Márquez, P.; Chica, A.F.; Martín, M.A. Identification and simulation of atmospheric dispersion patterns of odour and VOCs generated by a waste treatment plant. Atmos. Pollut. Res. 2023, 14, 101636. [Google Scholar] [CrossRef]
- Agus, E.; Zhang, L.; Sedlak, D.L. A framework for identifying characteristic odor compounds in municipal wastewater effluent. Water Res. 2012, 46, 5970–5980. [Google Scholar] [CrossRef]
- Abe, K.C.; Dos Santos, G.M.S.; Coêlho, M.S.Z.S.; Miraglia, S.G.E.K. PM 10 exposure and cardiorespiratory mortality—Estimating the effects and economic losses in São Paulo, Brazil. Aerosol Air Qual. Res. 2018, 18, 3127–3133. [Google Scholar] [CrossRef]
- Vítězová, M.; Vítěz, T.; Mlejnková, H.; Lošák, T. Microbial contamination of the air at the wastewater treatment plant. Acta Univ. Agric. Silvic. Mendel. Brun. 2012, LX, 233–240. [Google Scholar] [CrossRef]
- Ren, B.; Zhao, Y.; Lyczko, N.; Nzihou, A. Current Status and Outlook of Odor Removal Technologies in Wastewater Treatment Plant. Waste Biomass Valor. 2019, 10, 1443–1458. [Google Scholar] [CrossRef]
- Teixeira, J.V.; Miranda, S.; Monteiro, R.A.R.; Lopes, F.V.S.; Madureira, J.; Silva, G.V.; Pestana, N.; Pinto, E.; Vilar, V.J.P.; Boaventura, R.A.R. Assessment of indoor airborne contamination in a wastewater treatment plant. Environ. Monit. Assess. 2013, 185, 59–72. [Google Scholar] [CrossRef]
- Márquez, P.; Muñoz-Serrano, E.; Gutiérrez, M.C.; Siles, J.A.; Martín, M.A. Odour impact simulation of a large urban wastewater treatment plant through the numerical solution of a Eulerian model. J. Environ. Manag. 2024, 372, 123327. [Google Scholar] [CrossRef]
- Widiana, D.R.; Wang, Y.F.; You, S.J.; Yang, H.H.; Wang, L.C.; Tsai, J.H.; Chen, H.M. Air pollution profiles and health risk assessment of ambient volatile organic compounds above a municipal wastewater treatment plant, Taiwan. Aerosol Air Qual. Res. 2019, 19, 375–382. [Google Scholar] [CrossRef]
- Saleh, I.A.; Mohammed, A.M.F. Contour maps of Air Pollutants and their Health Risk Assessment in Abu-Rawash Wastewater Treatment Plant, Egypt. Egypt J. Chem. 2023, 66, 319–330. [Google Scholar] [CrossRef]
- Rolewicz-Kalińska, A.; Lelicińska-Serafin, K.; Manczarski, P. Volatile organic compounds, ammonia and hydrogen sulphide removal using a two-stage membrane biofiltration process. Chem. Eng. Res. Des. 2021, 165, 69–80. [Google Scholar] [CrossRef]
- Godayol, A.; Alonso, M.; Besalú, E.; Sanchez, J.M.; Anticó, E. Odour-causing organic compounds in wastewater treatment plants: Evaluation of headspace solid-phase microextraction as a concentration technique. J. Chromatogr. A 2011, 1218, 4863–4868. [Google Scholar] [CrossRef]
- Carrera-Chapela, F.; Donoso-Bravo, A.; Souto, J.A.; Ruiz-Filippi, G. Modeling the odor generation in WWTP: An integrated approach review. Water Air Soil Pollut. 2014, 225, 1–15. [Google Scholar] [CrossRef]
- Dinçer, F.; Dinçer, F.K.; Sarı, D.; Ceylan, Ö.; Ercan, Ö. Dispersion modeling and air quality measurements to evaluate the odor impact of a wastewater treatment plant in İzmir. Atmos. Pollut. Res. 2020, 11, 2119–2125. [Google Scholar] [CrossRef]
- Gonzales, D.; Colon, J.; Sanchez, A.; Gabriel, D. Multipoint characterization of the emission of odour, volatile organic compounds and greenhouse gases from a full-scale membrane-based municipal WWTP. J. Environ. Manag. 2022, 313, 115002. [Google Scholar] [CrossRef]
- Jonca, J.; Miller, U.; Wrobel, M.; Bezyk, Y.; Wloka, A.; Janicka, A.; Sowka, I. A comprehensive approach to assess odorous air quality of a selected wastewater treatment plant: Preliminary study. Desalin. Water Treat. 2025, 322, 101168. [Google Scholar] [CrossRef]
- Liao, Z.; Gao, T.; Li, P.; Zheng, T.; Li, L.; Li, C.; Wang, W.; Wang, Y.; Liu, J. Diffusion behavior and environmental impact of odorants and TVOCs detected in a wastewater treatment plant for collaborative leachate treatment in Northwest China. Chemosphere 2024, 366, 143561. [Google Scholar] [CrossRef]
- Brancher, M.; Griffiths, K.D.; Franco, D.; de Melo Lisboa, H. A review of odour impact criteria in selected countries around the world. Chemosphere 2017, 168, 1531–1570. [Google Scholar] [CrossRef]
- Canadian Environmental Protection Act. Guidance Manual for the Wastewater Sector; National Pollutant Release Inventory; Environment Canada: Gatineau, QC, Canada, 2003. [Google Scholar]
- Scotto Di Perta, E.; Fiorentino, N.; Carozzi, M.; Cervelli, E.; Pindozzi, S. A Review of Chamber and Micrometeorological Methods to Quantify NH3 Emissions from Fertilizers Field Application. Int. J. Agron. 2020, 2020, 1–16. [Google Scholar] [CrossRef]
- Loubet, B.; Cellier, P.; Flura, D.; Génermont, S. An Evaluation of the Wind-tunnel Technique for Estimating Ammonia Volatilization from Land: Part 1. Analysis and Improvement of Accuracy. J. Agric. Eng. Res. 1999, 72, 71–81. [Google Scholar] [CrossRef]
- Hafner, S.D.; Kamp, J.N.; Pedersen, J. Experimental and model-based comparison of wind tunnel and inverse dispersion model measurement of ammonia emission from field-applied animal slurry. Agric. For. Meteorol. 2024, 344, 109790. [Google Scholar] [CrossRef]
- Lucernoni, F.; Capelli, L.; Busini, V.; Sironi, S. A model to relate wind tunnel measurements to open field odorant emissions from liquid area sources. Atmos. Environ. 2017, 157, 10–17. [Google Scholar] [CrossRef]
- Capelli, L.; Sironi, S.; del Rosso, R. Odor sampling: Techniques and strategies for the estimation of odor emission rates from different source types. Sensors 2013, 13, 938–955. [Google Scholar] [CrossRef]
- Moreno-Silva, C.; Calvo, D.C.; Torres, N.; Ayala, L.; Gaitan, M.; Gonzales, L.; Rincon, P.; Rodrigues Susa, M. Hydrogen sulphide emissions and dispersion modelling from a wastewater reservoir using flux chamber measurements and AERMOD® simulations. Atmos. Environ. 2020, 224, 117263. [Google Scholar] [CrossRef]
- Prata, A.A., Jr.; Santos, J.M.; Beghini, S.P.; Fernandes, I.F.; Vom Marttens, L.L.C.; Pereira Neto, L.I.; Martians, R.S.; Reis, N.C., Jr.; Stuetz, R.M. Dynamic flux chamber measurements of hydrogen sulfide emission rate from a quiescent surface—A computational evaluation. Chemosphere 2016, 146, 426–434. [Google Scholar] [CrossRef]
- Lucernoni, F.; Tapparo, F.; Capelli, L.; Sironi, S. Evaluation of an Odour Emission Factor (OEF) to estimate odour emissions from landfill surfaces. Atmos. Environ. 2016, 144, 87–99. [Google Scholar] [CrossRef]
- McCollough, M.R.; Pedersen, J.; Nyord, T.; Sørensen, P.; Melander, B. Ammonia Emissions, Exposed Surface Area, and Crop and Weed Responses Resulting from Three Post-Emergence Slurry Application Strategies in Cereals. Agronomy 2022, 12, 2441. [Google Scholar] [CrossRef]
- Pedersen, J.M.; Feilberg, A.; Kamp, J.N.; Hafner, S.; Nyord, T. Ammonia emission measurement with an online wind tunnel system for evaluation of manure application techniques. Atmos. Environ. 2020, 230, 117562. [Google Scholar] [CrossRef]
- Nicell, J.; Henshaw, P. Odor impact assessments based on dose-response relationships and spatial analyses of population response. Water Pract. 2006, 1, 1–14. [Google Scholar] [CrossRef]
- Vieira de Melo, A.M.; Santos, J.M.; Mavroidis, I.; Reis Junior, N.C. Modelling of odour dispersion around a pig farm building complex using AERMOD and CALPUFF. Comparison with wind tunnel results. Build. Environ. 2012, 56, 8–20. [Google Scholar] [CrossRef]
- Odournet Product Catalogue. 2015. Available online: https://www.odournet.com/wp-content/uploads/2015/07/Odournet-Product-Catalogue-2015.pdf (accessed on 25 June 2024).
- Constantin, C.; Popa, G.O.; Calinescu, S.; Tanase, G. Determination of odour emission rates emitted by active area sources and dispersion of odour concentration in the surrounding air. Rom. J. Ecol. Environ. Chem. 2023, 5, 117–127. [Google Scholar] [CrossRef]
- Hawko, C.; Verriele, M.; Hucker, N.; Crunaire, S.; Leger, C.; Logoge, N.; Savary, G. A review of environmental odor quantification and qualification methods: The question of objectivity in sensory analysis. Sci. Total Environ. 2021, 795, 148862. [Google Scholar] [CrossRef] [PubMed]
- EN 13725:2022; Emissions from Stationary Sources. Determination of Odor Concentration by Dynamic Olfactometry and Odor Emission Rate. European Committee for Standardization (CEN): Brussels, Belgium, 2022.
- Sironi, S.; Capelli, L.; Céntola, P.; Del Rosso, R.; Pierucci, S. Odour impact assessment by means of dynamic olfactometry, dispersion modelling and social participation. Atmos. Environ. 2010, 44, 354–360. [Google Scholar] [CrossRef]
- Lakes Software. Available online: https://www.weblakes.com/software/air-dispersion/aermod-view/ (accessed on 25 June 2024).
- User’s Guide for the AMS/EPA Regulatory Model (AERMOD); U.S. Environmental Protection Agency: Washington, DC, USA, 2024. Available online: https://nepis.epa.gov/Exe/ZyPURL.cgi?Dockey=P100XN2J.TXT (accessed on 26 June 2024).
- Romanian National Meteorological Administration. Available online: https://www.meteoromania.ro/ (accessed on 31 July 2024). (In Romanian).
- Conti, C.; Guarino, M.; Bacenetti, J. Measurements techniques and models to assess odor annoyance: A review. Environ. Int. 2020, 134, 105261. [Google Scholar] [CrossRef]
- Law No. 123/2020, Odor Law Regarding the Amendment and Completion of Government Emergency Ordinance No. 195/2005 on Environmental Protection. Available online: https://legislatie.just.ro/Public/DetaliiDocument/227780 (accessed on 15 October 2024). (In Romanian).
- STAS 12574/87. Air Quality. Air from Protected Areas. Quality Conditions. Available online: https://magazin.asro.ro/ro/standard/19048 (accessed on 15 October 2024). (In Romanian).
- Bokowa, A.; Diaz, C.; Koziel, J.A.; McGinley, M.; Barclay, J.; Schauberger, G.; Guillot, J.M.; Sneath, R.; Capelli, L.; Zorich, V.; et al. Summary and Evaluation of the Odour Regulations Worldwide. Atmosphere 2021, 12, 206. [Google Scholar] [CrossRef]
- Stefan-Duicu, V.M.; Stefan-Duicu, A. Global Analysis of the Financial Analyst’s Job within a Company. Procedia Econ. Financ. 2015, 26, 261–267. [Google Scholar] [CrossRef]


| Identification Code | Location | Identification Code | Location | Identification Code | Location |
|---|---|---|---|---|---|
| N_1 | Northern limit of the WWTP site | 1_5 | Southwest | 6_10 | East |
| V_2 | Western limit of the WWTP site | 2_6 | Southwest | 7_11 | East |
| E_3 | Eastern limit of the WWTP site | 3_7 | South | 8_12 | Northwest |
| S_4 | Southern limit of the WWTP site | 4_8 | South | 9_13 | North |
| Specify Sectors | Albedo | Bowen Ratio | Surface Roughness | Land Type |
|---|---|---|---|---|
| 1 (0–30°) | 0.28 | 0.75 | 0.0725 | Cultivated Land |
| 2 (30–60°) | 0.28 | 0.75 | 0.0725 | Cultivated Land |
| 3 (60–90°) | 0.2075 | 1.625 | 1 | Urban |
| 4 (90–120°) | 0.2075 | 1.625 | 1 | Urban |
| 5 (120–150°) | 0.28 | 0.75 | 0.0725 | Cultivated Land |
| 6 (150–180°) | 0.28 | 0.75 | 0.0725 | Cultivated Land |
| 7 (180–210°) | 0.28 | 0.75 | 0.0725 | Cultivated Land |
| 8 (210–240°) | 0.28 | 0.75 | 0.0725 | Cultivated Land |
| 9 (240–270°) | 0.28 | 0.75 | 0.0725 | Cultivated Land |
| 10 (270–300°) | 0.29 | 0.905 | 0.4025 | Grassland |
| 11 (300–330°) | 0.29 | 0.905 | 0.4025 | Grassland |
| 12 (330–360°) | 0.29 | 0.905 | 0.4025 | Grassland |
| Sampling Source | Code | Height (m) | H2S ppb | NH3 ppb | VOCs ppm | Odor Concentration ouE/m3 | Odor Emission Rate ouE/m2/s | Area of the Source m2 |
|---|---|---|---|---|---|---|---|---|
| Sand remover—grease separator line 2 | P1 | 1 | 16.6 ± 3.2 | 17.7 ± 3.2 | 2.38 ± 0.18 | 48 ± 22 | 0.40 | 506 |
| Primary decanters 1–3 | P2 | 1 | 14.5 ± 2.8 | 10.2 ± 1.9 | 2.52 ± 0.19 | 43 ± 20 | 0.36 | 2661 |
| Activated sludge tank distribution chamber | P3 | 4 | 16.4 ± 3.1 | 67.5 ± 12.3 | 5.12 ± 0.38 | 54 ± 25 | 0.45 | 24 |
| Biological reactor (anaerobic zone) | P4 | 4 | 17.4 ± 3.3 | 47.2 ± 8.6 | 4.34 ± 0.33 | 54 ± 25 | 0.43 | 300 |
| Biological reactor (anoxic zone) | P5 | 4 | 17.2 ± 3.3 | 50.1 ± 9.2 | 4.12 ± 0.31 | 25 ± 12 | 0.21 | 1200 |
| Biological reactor (aerobic zone) | P6 | 4 | 16.3 ± 3.1 | 42.5 ± 7.8 | 4.68 ± 0.35 | 48 ± 22 | 0.40 | 4100 |
| Secondary decanters 1–5 | P7 | 1 | 10.1 ± 1.9 | 19.4 ± 3.6 | 3.12 ± 0.23 | 22 ± 10 | 0.16 | 7950 |
| Primary sludge pumping station | P8 | 1 | 26.9 ± 5.1 | 54.3 ± 9.9 | 6.88 ± 0.52 | 532 ± 249 | 4.43 | 80 |
| Primary sludge gravity concentrator | P9 | 3 | 47.5 ± 9.0 | 13.6 ± 2.5 | 6.85 ± 0.51 | 1166 ± 546 | 9.27 | 227 |
| Primary and excess sludge mixing tank | P10 | 5 | 26.3 ± 5.0 | 10.8 ± 2.0 | 8.18 ± 0.61 | 2793 ± 1309 | 23.28 | 79 |
| Fermented sludge buffer tank | P11 | 4 | 20.5 ± 3.9 | 13.3 ± 2.4 | 6.59 ± 0.49 | 117 ± 55 | 0.98 | 79 |
| Sand remover—grease separator line 1 (grease collector system out of operation) | P12 | 1 | 245 ± 47 | 11.4 ± 2.1 | 4.26 ± 0.32 | 2793 ± 1309 | 23.28 | 240 |
| Primary decanter no. 4 (sludge collector system out of operation) | P13 | 1 | 226 ± 43 | 15.3 ± 2.8 | 5.59 ± 0.42 | 4171 ± 1954 | 34.76 | 887 |
| Sensitive Receptor Name Code | Odor Concentration ouE/m3 98th Percentile | Odor Concentration ouE/m3 1st Highest Values | ||
|---|---|---|---|---|
| Type A | Type B | Type A | Type B | |
| N_1 Northern limit of the WWTP site | 7.50 | 19.37 | 13.43 | 148.93 |
| V_2 Western limit of the WWTP site | 8.87 | 76.17 | 19.47 | 382.58 |
| E_3 Eastern limit of the WWTP site | 9.94 | 174.79 | 14.18 | 407.64 |
| S_4 Southern limit of the WWTP site | 12.48 | 76.44 | 20.17 | 395.32 |
| 1_5 Southwest | 1.68 | 3.74 | 3.99 | 20.65 |
| 2_6 Southwest | 1.86 | 3.96 | 8.58 | 117.53 |
| 3_7 South | 1.66 | 3.90 | 12.20 | 101.87 |
| 4_8 South | 1.33 | 5.43 | 13.16 | 140.56 |
| 5_9 Southeast | 3.05 | 5.93 | 9.41 | 84.87 |
| 6_10 East | 4.91 | 18.63 | 9.81 | 126.05 |
| 7_11 East | 3.54 | 11.82 | 7.63 | 84.18 |
| 8_12 Northwest | 1.68 | 8.63 | 7.63 | 69.92 |
| 9_13 North | 1.76 | 2.86 | 7.84 | 70.08 |
| 10_14 Northwest | 2.85 | 8.44 | 8.68 | 70.72 |
| Sensitive Receptor Name Code | Data of Analysis | Odor Concentration ouE/m3 |
|---|---|---|
| 4_8 South | 10 June 2024 | 14 |
| 27 September 2024 | <13.6 | |
| 6_10 East | 29 March 2024 | 15 |
| 11 June 2024 | 14 | |
| 27 September 2024 | <13.6 | |
| 17 December 2024 | <13.6 | |
| 8_12 Northwest | 11 June 2024 | 23 |
| 27 September 2024 | <13.6 |
Disclaimer/Publisher’s Note: The statements, opinions and data contained in all publications are solely those of the individual author(s) and contributor(s) and not of MDPI and/or the editor(s). MDPI and/or the editor(s) disclaim responsibility for any injury to people or property resulting from any ideas, methods, instructions or products referred to in the content. |
© 2025 by the authors. Licensee MDPI, Basel, Switzerland. This article is an open access article distributed under the terms and conditions of the Creative Commons Attribution (CC BY) license (https://creativecommons.org/licenses/by/4.0/).
Share and Cite
Constantin, C.; Modrogan, C.; Dancila, A.M.; Gavrila, G.O.; Calinescu, S.M.; Cirstea, A.; Danciulescu, V.; Tanase, G.; Vasile, G.G. Dispersion Modeling of Odor Emissions from Area Sources in a Municipal Wastewater Treatment Plant. Atmosphere 2025, 16, 577. https://doi.org/10.3390/atmos16050577
Constantin C, Modrogan C, Dancila AM, Gavrila GO, Calinescu SM, Cirstea A, Danciulescu V, Tanase G, Vasile GG. Dispersion Modeling of Odor Emissions from Area Sources in a Municipal Wastewater Treatment Plant. Atmosphere. 2025; 16(5):577. https://doi.org/10.3390/atmos16050577
Chicago/Turabian StyleConstantin, Cristian, Cristina Modrogan, Annette Madelene Dancila, Georgeta Olguta Gavrila, Simona Mariana Calinescu, Alexandru Cirstea, Valeriu Danciulescu, Gheorghita Tanase, and Gabriela Geanina Vasile. 2025. "Dispersion Modeling of Odor Emissions from Area Sources in a Municipal Wastewater Treatment Plant" Atmosphere 16, no. 5: 577. https://doi.org/10.3390/atmos16050577
APA StyleConstantin, C., Modrogan, C., Dancila, A. M., Gavrila, G. O., Calinescu, S. M., Cirstea, A., Danciulescu, V., Tanase, G., & Vasile, G. G. (2025). Dispersion Modeling of Odor Emissions from Area Sources in a Municipal Wastewater Treatment Plant. Atmosphere, 16(5), 577. https://doi.org/10.3390/atmos16050577