
Holiday Effect of Ozone Pollution in China


Abstract
1. Introduction
2. Search Strategy
3. Temporal Variations
3.1. Overall Characteristics
3.2. Weekend Effect
3.3. Spring Festival Effect
3.4. Chinese National Day Effect
3.5. Pandemic Effects
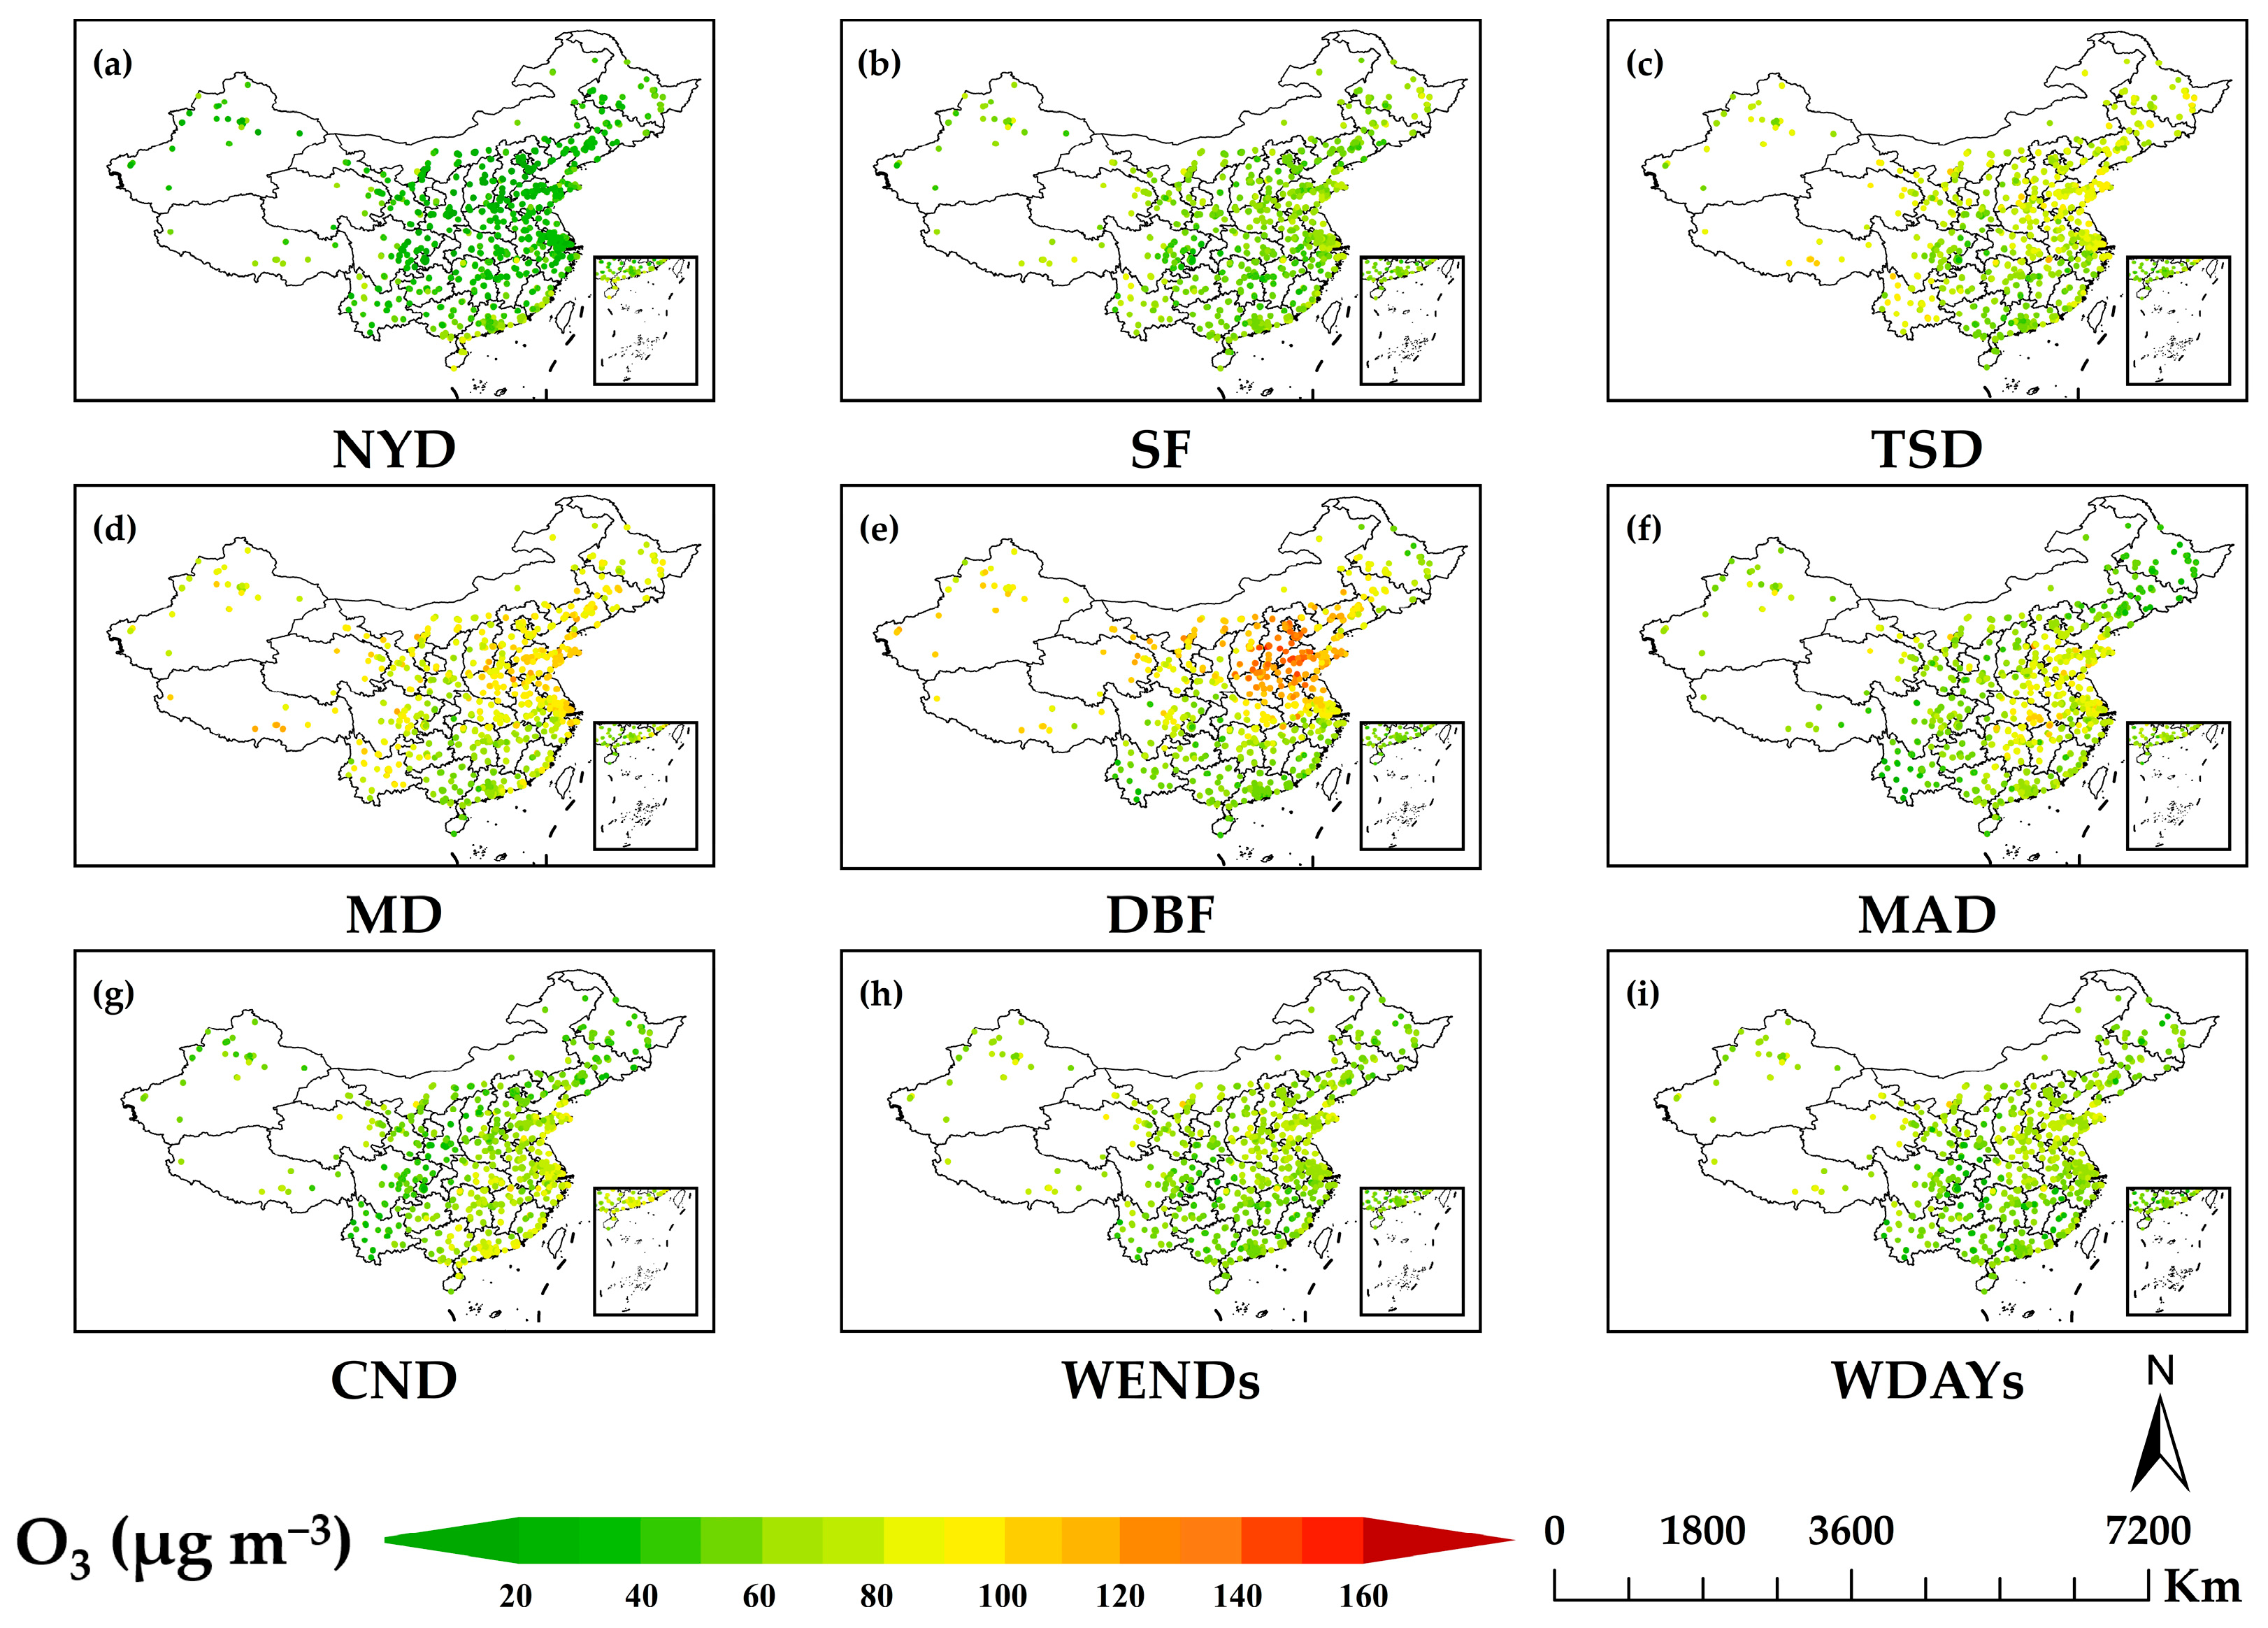
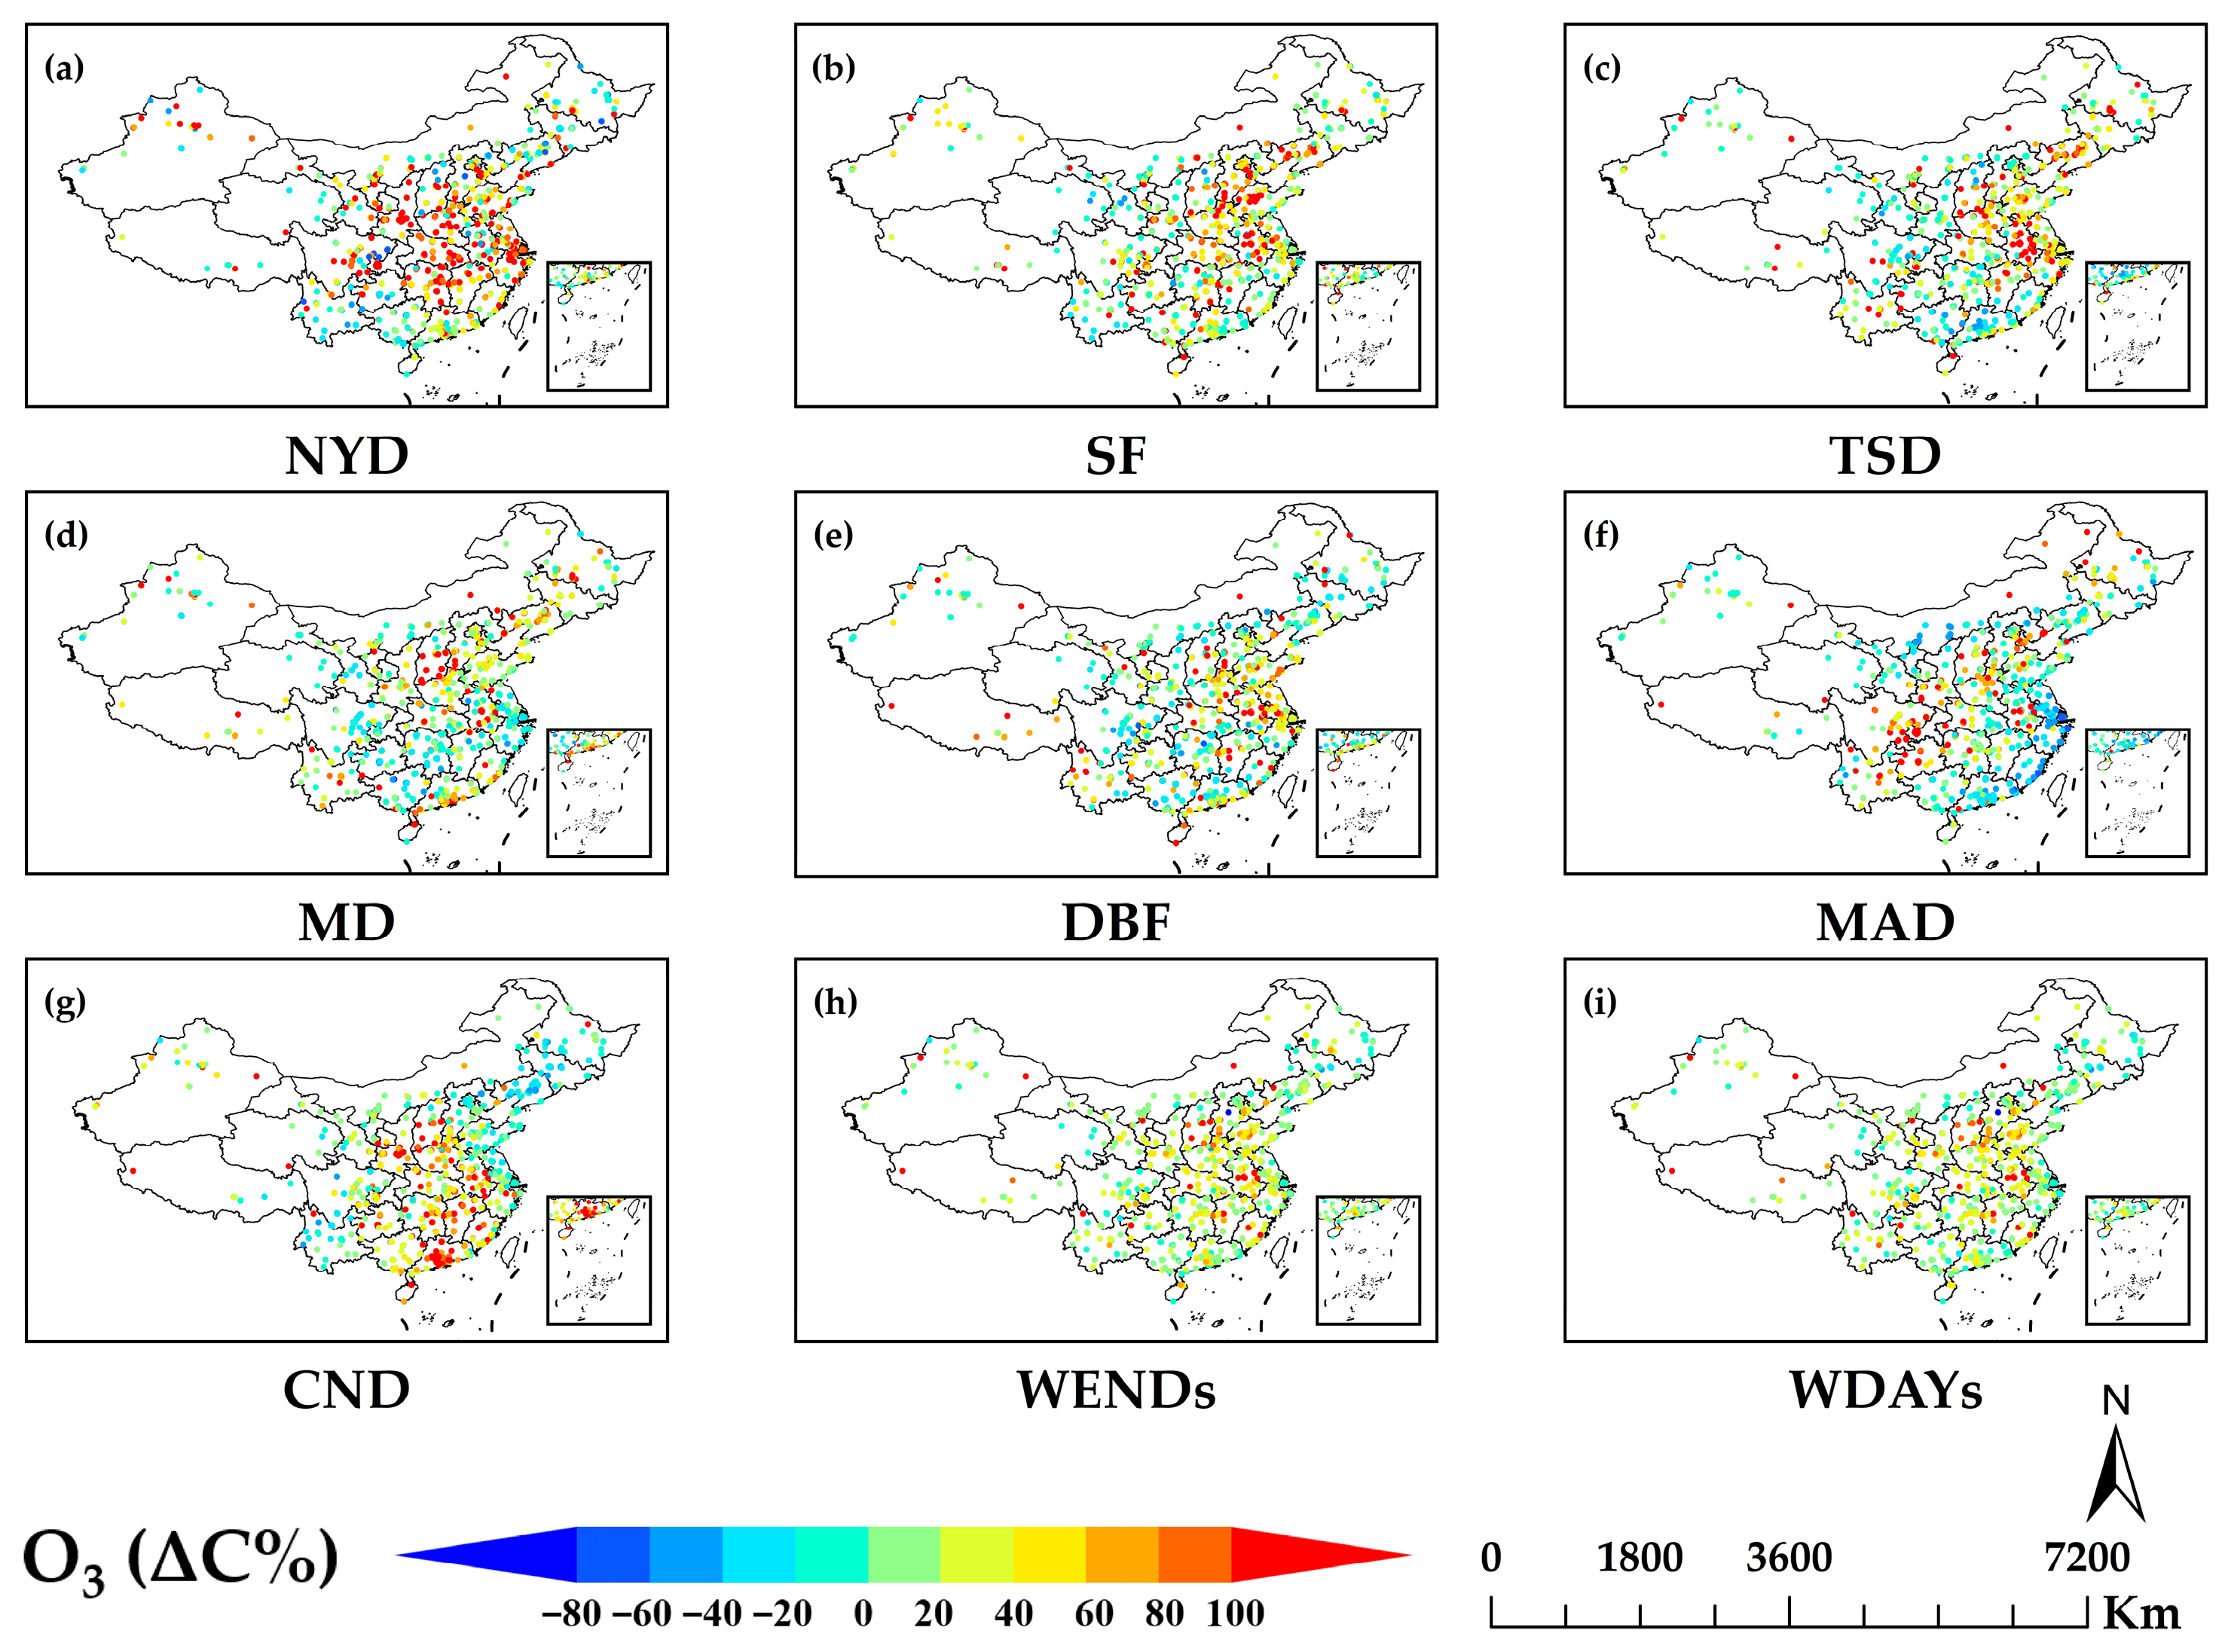
4. Spatial Variations
4.1. Beijing–Tianjin–Hebei
4.2. Yangtze River Delta
4.3. Pearl River Delta
4.4. Other Regions
5. Influencing Factors
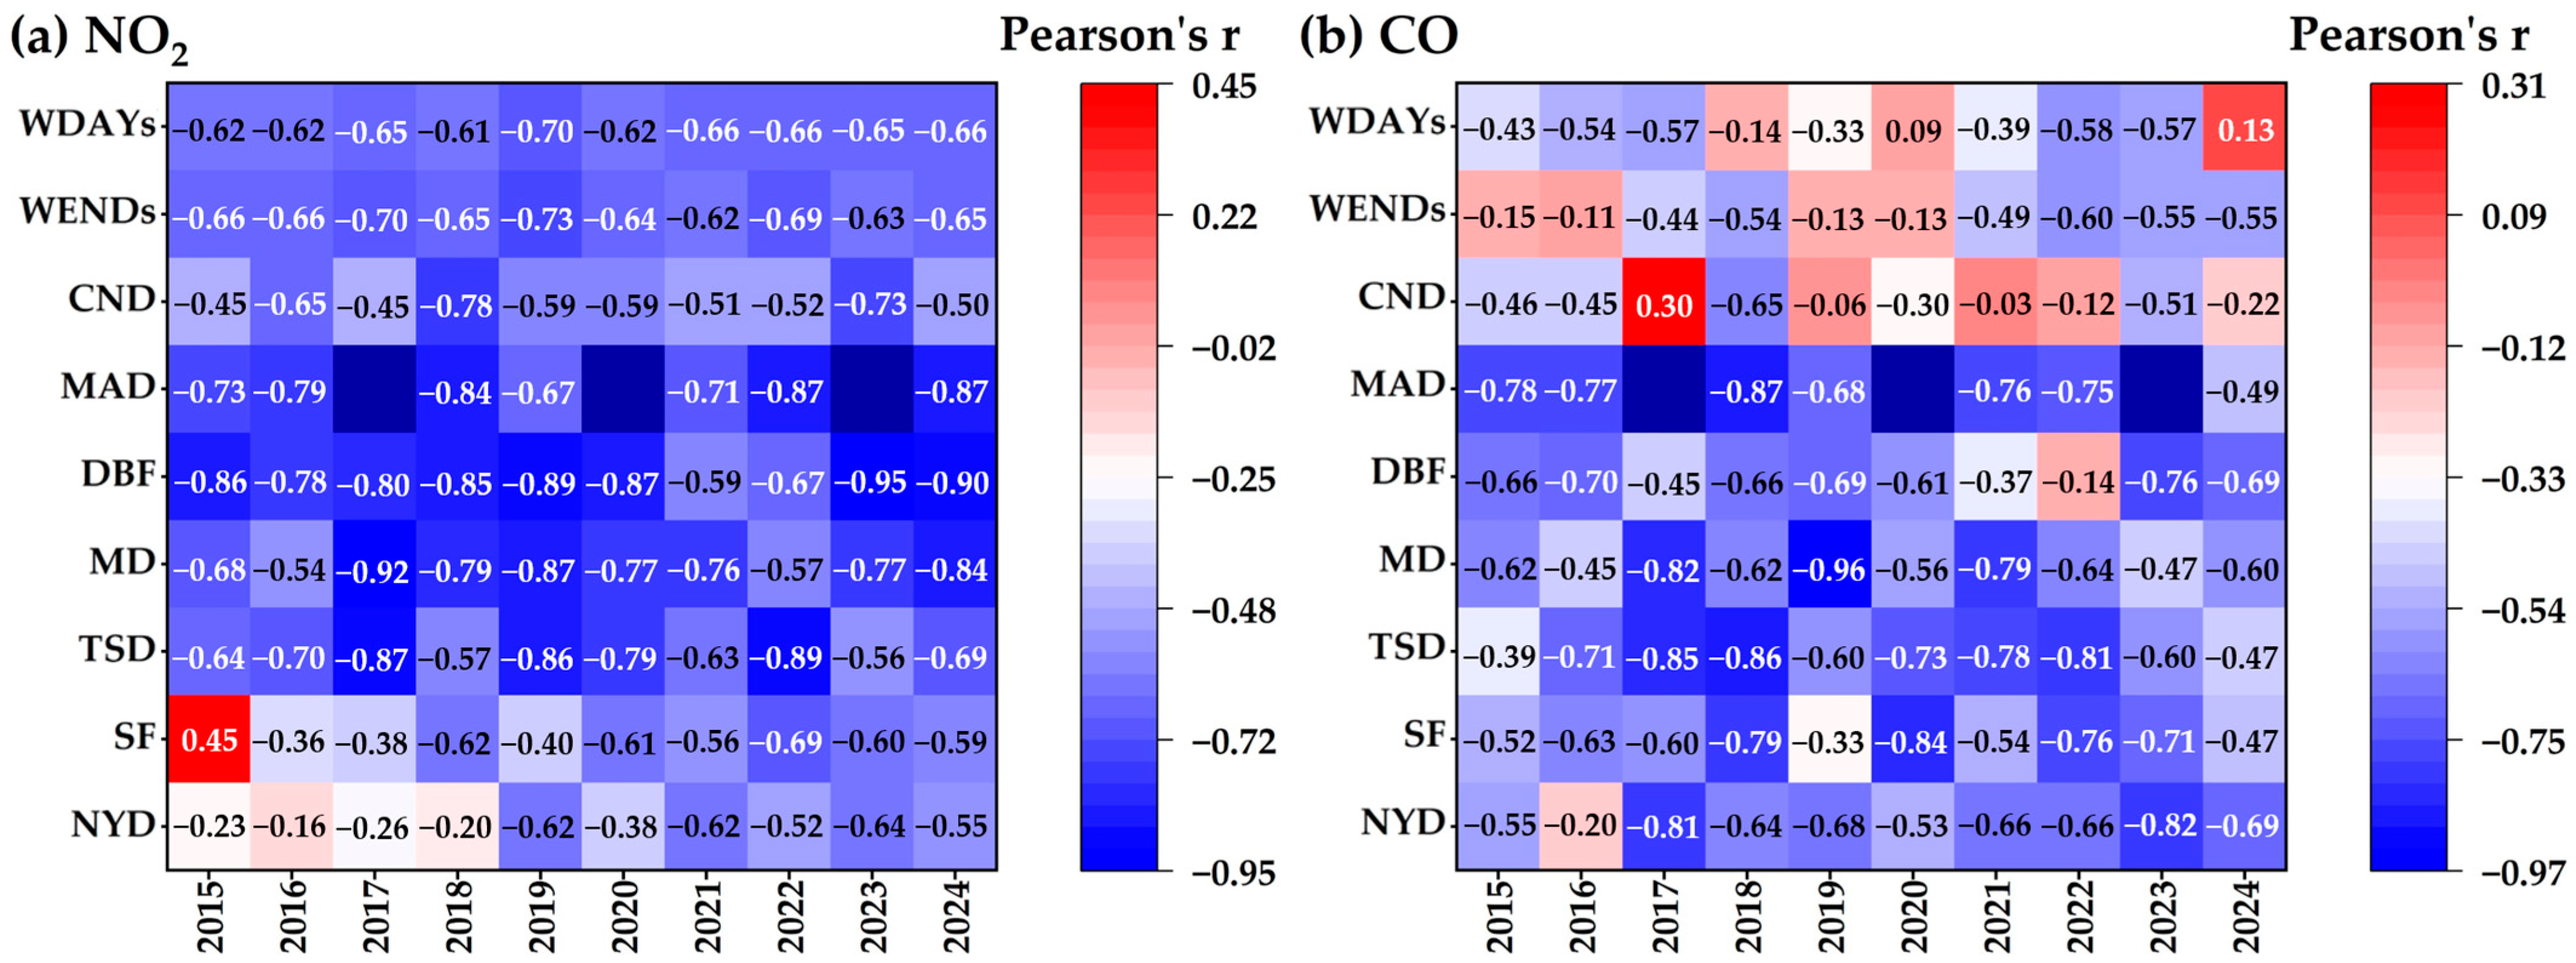
5.1. Precursors
5.1.1. O3 Formation Mechanisms
5.1.2. NOx and VOCs
5.1.3. CO
5.1.4. Primary Pollutants
5.2. Atmospheric Oxidation Capacity
5.3. Meteorological Conditions
5.4. Other Factors
6. Summary and Outlook
- Elucidate photochemical pathways under varying holiday conditions, particularly the roles of radicals (e.g., OH, NO3), reactive VOCs (e.g., BVOCs, carbonyls), and other photochemical indicators (e.g., peroxyacetyl nitrate) in O3 formation.
- Leverage machine learning to identify dominant factors (e.g., transport paths, heatwaves, biomass burning) during extreme O3 episodes in the holiday.
- Further examine AOC’s role as a prerequisite for photochemical reactions.
- Quantify cross-regional O3 contributions and vertical profiles of O3 and its precursors (i.e., VOCs and NOx), especially during long holidays like CND.
- Assess acute and chronic health impacts of holiday O3 spikes on humans and their effects on ecology (e.g., crop yield, forest).
Author Contributions
Funding
Data Availability Statement
Conflicts of Interest
Abbreviations
| AOC | Atmospheric Oxidation Capacity |
| BTH | Beijing–Tianjin–Hebei |
| CCUA | Chengdu–Chongqing Urban Agglomeration |
| CLUA | Central Liaoning Urban Agglomeration |
| CMAQ | Community Multiscale Air Quality |
| CND | Chinese National Day |
| CZXUA | Changsha–Zhuzhou–Xiangtan Urban Agglomeration |
| EKMA | Empirical Kinetic Modeling Approach |
| GSUA | Guanzhong–Shaanxi Urban Agglomeration |
| HO2 | Hydroperoxyl Radical |
| HOx | OH + HO2 |
| MAD | Mid-Autumn Festival |
| MD | May Day |
| NOx | Nitrogen Oxides |
| NSUA | North Shanxi Urban Agglomeration |
| NYD | New Year’s Day |
| O3 | Ozone |
| OFP | Ozone Formation Potential |
| OH | Hydroxyl Radical |
| PM2.5 | Fine Particulate Matter |
| PRD | Pearl River Delta |
| RH | Relative Humidity |
| RIR | Relative Incremental Reactivity |
| SF | Spring Festival |
| SO2 | Sulfur Dioxide |
| SPUA | Shandong Peninsula Urban Agglomeration |
| TSD | Tomb Sweeping Day |
| VOCs | Volatile Organic Compounds |
| WCSUA | West Coast Straits Urban Agglomeration |
| WDAYs | Weekday |
| WENDs | Weekend |
| WOS | Web of Science |
| WUA | Wuhan Urban Agglomeration |
| XUUA | Xinjiang Urumqi Urban Agglomeration |
| YRD | Yangtze River Delta |
References
- Lai, A.; Chen, X.; Liu, Y.; Jiang, M.; Liu, Y.; Wang, X.; Fan, Q. Characteristics of complex pollution with high concentrations of PM2.5 and O3 over the Pearl River Delta, China. J. Sun Yat-Sen Univ. (Nat. Sci. Ed.) 2018, 57, 30–36. [Google Scholar]
- Zhao, S.; Yin, D.; Yu, Y.; Kang, S.; Qin, D.; Dong, L. PM2.5 and O3 pollution during 2015–2019 over 367 Chinese cities: Spatiotemporal variations, meteorological and topographical impacts. Environ. Pollut. 2020, 264, 114694. [Google Scholar] [CrossRef]
- China’s State Council, Action Plan for Air Pollution Prevention and Control. 2013. Available online: https://www.gov.cn/gongbao/content/2013/content_2496394.htm (accessed on 23 April 2025).
- Shen, L.; Jacob, D.J.; Liu, X.; Huang, G.; Li, K.; Liao, H.; Wang, T. An evaluation of the ability of the Ozone Monitoring Instrument (OMI) to observe boundary layer ozone pollution across China: Application to 2005–2017 ozone trends. Atmos. Chem. Phys. 2019, 19, 6551–6560. [Google Scholar] [CrossRef]
- Shen, J.; Liu, Y.; Yan, P.; Wang, Y.; Pan, Z.; Chen, D. Analysis of ozone pollution process in Guangdong province around the National Day in 2018. Saf. Environ. Eng. 2020, 27, 75–80. [Google Scholar]
- Yan, H.; Zhang, W.; Hou, M.; Li, Y.; Gao, P. Sources and control area division of ozone pollution in cities at prefecture level and above in China. Environ. Sci. 2020, 41, 5215–5224. [Google Scholar]
- Yang, J.; Bu, D.; Liu, J.; Du, M. Research review on urban ozone pollution control in China. Environ. Sustain. Dev. 2020, 47, 86–90. [Google Scholar]
- Cao, B.; Yin, Z. Future atmospheric circulations benefit ozone pollution control in Beijing-Tianjin-Hebei with global warming. Sci. Total Environ. 2020, 743, 140645. [Google Scholar] [CrossRef]
- Wang, P.; Shen, J.; Xia, M.; Sun, S.; Zhang, Y. Unexpected enhancement of ozone exposure and health risks during National Day in China. Atmos. Chem. Phys. 2021, 21, 10347–10356. [Google Scholar] [CrossRef]
- Feng, Z.; Hu, E.; Wang, X.; Jiang, L.; Liu, X. Ground-level O3 pollution and its impacts on food crops in China: A review. Environ. Pollut. 2015, 199, 42–48. [Google Scholar] [CrossRef]
- Gao, A.; You, X.; Li, Z.; Liao, C.; Yin, Z.; Zhang, B.; Zhang, H. Health effects associated with ozone in China: A systematic review. Environ. Pollut. 2025, 199, 125642. [Google Scholar] [CrossRef]
- Zhang, Y.; Shao, K.; Tang, X. The study of urban photochemical smog pollution in China. Acta Sci. Nat. Univ. Peki. 1998, 34, 392–400. [Google Scholar]
- Hua, J.; Zhang, Y.; Foy, B.D.; Mei, X.; Shang, J.; Feng, C. Competing PM2.5 and NO2 holiday effects in the Beijing area vary locally due to differences in residential coal burning and traffic patterns. Sci. Total Environ. 2021, 750, 141575. [Google Scholar] [CrossRef]
- Wang, J.; Zhang, Y.; Wu, Z.; Luo, S.; Song, W.; Wang, X. Ozone episodes during and after the 2018 Chinese National Day holidays in Guangzhou: Implications for the control of precursor VOCs. J. Environ. Sci. 2022, 114, 322–333. [Google Scholar] [CrossRef] [PubMed]
- Zhao, M.; Zhang, Y.; Pei, C.; Chen, T.; Mu, J.; Liu, Y.; Wang, Y.; Wang, W.; Xue, L. Worsening ozone air pollution with reduced NOx and VOCs in the Pearl River Delta region in autumn 2019: Implications for national control policy in China. J. Environ. Manag. 2022, 324, 116327. [Google Scholar] [CrossRef]
- Zhao, Q.; Li, L.; Li, H. Research progress on surface ozone pollution in domestic and overseas. Adv. Environ. Sci. 2018, 31, 72–76. [Google Scholar]
- Chen, P.; Tan, P.; Chou, C.C.K.; Lin, Y.; Chen, W.; Shiu, C. Impacts of holiday characteristics and number of vacation days on “holiday effect” in Taipei: Implications on ozone control strategies. Atmos. Environ. 2019, 202, 357–369. [Google Scholar] [CrossRef]
- Xu, Z.; Huang, X.; Wei, N.; Chi, X.; Xu, Z.; Zheng, L.; Sun, P.; Ding, A. Influence of synoptic condition and holiday effects on VOCs and ozone production in the Yangtze River Delta region, China. Atmos. Environ. 2017, 168, 112–124. [Google Scholar] [CrossRef]
- Jiang, S.; Wang, K. Exploring the Holiday Effect on Air Temperatures. Sci. Rep. 2018, 8, 17943. [Google Scholar] [CrossRef]
- Liu, M.; Yue, Q.; Lv, J. Analysis and prediction of ozone concentration in urban and suburb of Shanghai. Environ. Sci. Technol. 2008, 21, 1–4. [Google Scholar]
- Liu, Z.; Xie, X.; Xie, M.; Wang, T. Spatio-temporal distribution of ozone pollution over Yangtze River Delta Region. J. Ecol. Rural Environ. 2016, 32, 445–450. [Google Scholar]
- Wang, Y.; Huang, X.; Pei, C.; Zhang, J. Spatial-temporal variations of ground-level ozone and preliminary analysis on the sensitivity of ozone formation to precursors in Guangzhou city. Saf. Environ. Eng. 2016, 23, 83–88. [Google Scholar]
- Yan, R.; Li, L.; An, J.; Huang, C. Simulation study of ozone generation and precursors control in Shanghai during summer time. Environ. Pollut. Control 2016, 38, 30–35+40. [Google Scholar]
- Ren, Y.; Wang, G.; Zhang, Q.; Tao, C.; Ji, S.; Wang, Q.; Wang, W. The impact of Chinese new year on air quality in north China based on machine learning. Atmos. Environ. 2025, 342, 120874. [Google Scholar] [CrossRef]
- Li, B. Application and research of weekend effect in air pollution. Jiangxi Chem. Ind. 2018, 29–31. [Google Scholar] [CrossRef]
- Cui, L.; Ni, C.; Wang, C.; Xie, Y.; Hu, S.; Gan, X. Temporal variation of ozone concentration and impact factors in Chengdu. Environ. Monit. China 2015, 31, 41–46. [Google Scholar]
- Zhou, G.; Song, B.; Luo, Y.; Bi, J. Holiday effects on ambient air quality in Changsha during 2016. Environ. Monit. China 2018, 34, 68–76. [Google Scholar]
- Cleveland, W.S.; Graedel, T.E.; Kleiner, B.; Warner, J.L. Sunday and workday variations in photochemical air pollutants in new jersey and new york. Science 1974, 186, 1037–1038. [Google Scholar] [CrossRef]
- Elkus, B.Z.; Wilson, K.R. Photochemical Air Pollution: Weekday-Weekend Differences. Atmos. Environ. 1977, 11, 509–515. [Google Scholar] [CrossRef]
- Levitt, S.B.; Chock, D.P. Weekday-Weekend Pollutant Studies of the Los Angeles Basin. J. Air Pollut. Control Assoc. 1976, 26, 1091–1092. [Google Scholar] [CrossRef]
- Diem, J.E. Comparisons of weekday–weekend ozone: Importance of biogenic volatile organic compound emissions in the semi-arid southwest USA. Atmos. Environ. 2000, 34, 3445–3451. [Google Scholar] [CrossRef]
- Altshuler, S.L.; Arcado, T.D.; Lawson, D.R. Weekday vs. weekend ambient ozone concentrations: Discussion and hypotheses with focus on northern California. J. Air Waste Manag. Assoc. 1995, 45, 967–972. [Google Scholar] [CrossRef]
- Qin, Y. Weekend/weekday differences of ozone, NOx, Co, VOCs, PM10 and the light scatter during ozone season in southern California. Atmos. Environ. 2004, 38, 3069–3087. [Google Scholar] [CrossRef]
- Brönnimann, S.; Neu, U. Weekend-weekday differences of near-surface ozone concentrations in Switzerland for different meteorological conditions. Atmos. Environ. 1997, 31, 1127–1135. [Google Scholar] [CrossRef]
- Pont, V.; Fontan, J. Comparison between weekend and weekday ozone concentration in large cities in France. Atmos. Environ. 2001, 35, 1527–1535. [Google Scholar] [CrossRef]
- Lei, Y.; Zhang, X.; Tang, Y.; Fan, G. Holiday effects on PM2.5 and other major pollutants in Beijing. Acta Sci. Circumstantiae 2015, 35, 1520–1528. [Google Scholar]
- Tang, W.; Zhao, C.; Geng, F.; Peng, L. Study on weekend effect of ozone in Shanghai region. Sci. Sin. 2009, 39, 99–105. [Google Scholar]
- Ruan, Y.; Li, L.; Huang, Z.; Zeng, S. Meteorological causes of ozone pollution in Sichuan and Chongqing in summer. J.Chengdu Univ. Inf. Technol. 2021, 36, 425–433. [Google Scholar]
- Wu, Q.; Zhang, L.; Chen, L.; Chen, F.; Peng, X. Analysis of air pollution characteristics and weekend effect of Liuzhou in 2019. Environ. Prot. Sci. 2020, 46, 138–143. [Google Scholar]
- Ding, J.; Shen, Y.; Chang, H.; Ma, C. Analysis of the concentrations characteristics of O3 and NO2 in Nantong. Guangdong Chem. Ind. 2014, 41, 149–150+155. [Google Scholar]
- Geng, F.; Tie, X.; Xu, J.; Zhou, G.; Peng, L.; Gao, W.; Tang, X.; Zhao, C. Characterizations of ozone, NOx and VOCs measured in Shanghai, China. Atmos. Environ. 2008, 42, 6873–6883. [Google Scholar] [CrossRef]
- Li, J.; Tie, X.; Cao, J. A preliminary study of PM2.5 weekend effect in typical cities. J. Earth Environ. 2015, 6, 224–230. [Google Scholar]
- Lin, Y.; Qin, B.; Duan, Z.; Peng, W.; Yuan, X. Characteristics and control measures of near-surface ozone pollution in China. Leather. Manuf. Environ. Technol. 2023, 4, 121–123. [Google Scholar]
- Liu, M.; Wang, C.; Hou, L.; Yu, X.; Lin, H. Spatial-temporal patterns and variation trend of ozone pollution in Shenyang. Environ. Monit. China 2017, 33, 126–131. [Google Scholar]
- Liu, X.; Zhong, Y.; He, Q.; Peng, Y.; Luo, X. The variation characteristics and influencing factors of surface ozone concentration in the taklimakan desert hinterland. J. Desert Res. 2013, 33, 626–633. [Google Scholar]
- Lv, H.; He, H.; Hao, Y. Variation characteristics and weekend effect of nitrogen oxides and ozone in Hong Kong Port. Chin. J. Environ. Eng. 2017, 11, 4196–4201. [Google Scholar]
- Li, M. Study on the Characteristics and Driving Factors of Ozone Pollutionin Shandong Province. Master’s Thesis, Shandong Normal University, Jinan, China, 2021. [Google Scholar]
- Shi, Y.; Xu, Y.; Wang, G.; Shi, L. Study of the “Weekend Effect” of O3, NOx and other pollutants in summer of Beijing. Environ. Sci. 2009, 30, 2832–2838. [Google Scholar]
- Jian, W. Study on “Weekend Effect” of air pollutants in Yubei district of Chongqing. J. Qinghai Environ. 2023, 33, 86–89+104. [Google Scholar]
- Wang, N.; Xu, J.; Pei, C.; Tang, R.; Zhou, D.; Chen, Y.; Li, M.; Deng, X.; Deng, T.; Huang, X.; et al. Air Quality During COVID-19 Lockdown in the Yangtze River Delta and the Pearl River Delta: Two Different Responsive Mechanisms to Emission Reductions in China. Environ. Sci. Technol. 2021, 55, 5721–5730. [Google Scholar] [CrossRef]
- Wang, Z.; Li, Y.; Chen, T.; Zhang, D.; Sun, F.; Wei, Q.; Dong, X.; Sun, R.; Huan, N.; Pan, L. Ground-level ozone in urban Beijing over a 1-year period: Temporal variations and relationship to atmospheric oxidation. Atmos. Res. 2015, 164–165, 110–117. [Google Scholar] [CrossRef]
- Wang, T.; Chen, M.; Zhou, M.; Li, J.; Wu, S.; Luo, M.; Xia, Z. Pollution characteristics and influence factors of air pollutants in Wuxi City. Environ. Pollut. Control 2015, 37, 74–78+95. [Google Scholar]
- Yin, Y.; Shan, W.; Ji, X.; You, L.; Su, Y. Characteristics of Atmospheric Ozone in the Urban Area of Ji’nan. Environ. Sci. 2006, 27, 2299–2302. [Google Scholar]
- Cui, M.; An, X.; Sun, Z.; Wang, B.; Wang, C.; Ren, W.; Li, Y. Characteristics and Meteorological Conditions of Ozone Pollution in Beijing. Ecol. Environ. Monit. 2019, 4, 25–35. [Google Scholar]
- Jiang, Y. Spatial and Temporal Distribution of NO2 Concentration Infive Provinces and One City in MID-Easter China Andanalysis of Influencing Factors. Master’s Thesis, Anhui Jianzhu University, Hefei, China, 2024. [Google Scholar]
- Zhang, L.; Wang, X.; Wang, Z.; Wei, Y.; Song, W.; Li, E. Ozone pollution characteristics of Shijiazhuang in 2014. Environ. Sci. Technol. 2017, 40, 1–8. [Google Scholar]
- Yang, J. Investigating the Light Absorption Properties of Black Carbon Aerosols in Shanghai’s Urban and Suburban Regions. Master’s Thesis, Shanghai Normal University, Shanghai, China, 2024. [Google Scholar]
- Luo, J.; Zhang, J.; Huang, Y.; Zhong, X.; Chen, Z.; Liu, C.; Shi, K. Multiple Fractal Difference Analysis of NO2-O3 Role in Urban and Suburban Areas. Environ. Sci. Technol. 2024, 47, 79–85. [Google Scholar]
- Zhang, Z.; Chen, S.; Ou, Z.; Zhang, Y.; Wang, X. Pollution characteristics and source apportionments of ambient NMHCs during summer in typical areas of the Chengdu-Chongqing Basin. Acta Sci. Circumstantiae 2024, 44, 35–47. [Google Scholar]
- Li, S.; Yu, D.; Shi, C.; Zhao, N.; Xu, X.; Lu, S. Correlation Analysis of PM2.5 and O3 in Different Types of Urban Forests in Beijing. Res. Environ. Sci. 2024, 37, 536–544. [Google Scholar]
- Zhang, J.; Chi, H.; Li, L. Analysis of variation characteristics of air quality in luohu district of Shenzhen in 2019. Environ. Eng. 2024, 42, 152–160. [Google Scholar]
- Tang, J. Regional Differences in Summer Ozone Response to Temperature and Weekend Effect in Beijing. Master’s Thesis, Chinese Research Academy of Environmental Sciences, Beijing, China, 2023. [Google Scholar]
- Zheng, Z. Fine-Scale Spatiotemporal Analysis of Ozone Formation Sensitivity in a Typical Industrial City of the North China Plain. Master’s Thesis, Chinese Research Academy of Environmental Sciences, Beijing, China, 2023. [Google Scholar]
- Shi, C. Correlation Study Between PM2.5 and Ozone (O3) in Beijing Urban Forests. Master’s Thesis, Shenyang Agricultural University, Shenyang, China, 2023. [Google Scholar]
- Zhang, X. Ground-Level Ozone Concentration Prediction in Beijing Using Stacking Model. Master’s Thesis, Shanxi University, Taiyuan, China, 2023. [Google Scholar]
- Liu, T. Exploring the Characteristics and Causes of Ozone Pollution Around Traffic Arteries: An Example of Roadside Monitoring Stations in Guangzhou. Master’s Thesis, Harbin Normal University, Harbin, China, 2023. [Google Scholar]
- Tang, J.; Tian, R.; Guo, W.; Zhang, Z.; Xu, J.; Liu, S.; Zhang, S.; Ma, L.; Ye, Z.; Huang, H. Quantitative relationship between near-surface ozone and air temperature over Beijing area in summer. Res. Environ. Sci. 2023, 36, 904–912. [Google Scholar]
- Zhang, G.; Sun, Y.; Xu, W.; Wu, L.; Duan, Y.; Liang, L.; Li, Y. Identifying the O3 chemical regime inferred from the weekly pattern of atmospheric O3, CO, NOx, and PM10: Five-year observations at a center urban site in Shanghai, China. Sci. Total Environ. 2023, 888, 164079. [Google Scholar] [CrossRef]
- An, J.; Hang, Y.; Zhu, B.; Wang, D. Observational study of ozone concentrations in northern suburb of Nanjing. Ecol. Environ. Sci. 2010, 19, 1383–1386. [Google Scholar]
- Huang, Z. Observational study of surface ozone and its precursors in the suburb of Shanghai during spring. Environ. Sci. Technol. 2011, 34, 87–89+99. [Google Scholar]
- Jia, P. Research on Deep Learning-Based Ozone Near-Term Forecasting Technology in the Yangtze River Delta Region. Master’s Thesis, Nanjing University of Information Science & Technology, Nanjing, China, 2021. [Google Scholar]
- Lin, J. Observational research on ozone and its precursors at Langqi island, Minjiang Estuary. Chem. Eng. Equip. 2017, 305–307. [Google Scholar] [CrossRef]
- Luan, Z.; Lu, H.; Li, T.; Chen, B. Characteristics and sensitivity analysis of near-surface atmospheric ozone pollution in Tai’an city in 2016 201. Meteorol. Environ. Sci. 2023, 46, 72–80. [Google Scholar]
- Shen, L.; Li, L.; Lv, S.; Zhang, X.; Wang, F.; Zhang, G. Impacts of fireworks on the atmospheric pollutant distributions during Spring Festival in Jiaxing. Acta. Sci. Circumstantiae 2016, 36, 1548–1557. [Google Scholar]
- Shen, L.; Wang, H.; Lu, S.; Li, L.; Zhang, X.; Zhang, G.; Wang, F. Weekend Effect in Distributions of Particulate Matters, Main Gas Pollutants and Aerosol Size in Spring of Jiaxing. Huanjing Kexue 2015, 36, 4348–4357. [Google Scholar]
- Wang, J.; An, J.; Shao, P.; Zou, J.; Lin, X.; Zhang, Y. Characteristic study on the “Weekend Effect” of atmospheric O3 in northern suburb of Nanjing. Environ. Sci. 2017, 38, 2256–2263. [Google Scholar]
- Yang, J.; Li, P.; Li, Y.; Feng, Q.; Li, J.; Han, Y. Characteristics of SO2, NO2 and O3 in the northern suburb of Nanjing. J. Meteorol. Environ. 2014, 30, 66–70. [Google Scholar]
- Xu, J.; Yang, H.; Li, G.; Ma, W.; Zhang, L.; Li, H.; Zhao, H. Variation characteristics of pollutants in ordos city and their relationship with meteorological factors. Inn. Mong. Sci. Technol. Econ. 2025, 121–125. [Google Scholar]
- Gao, W.; Zhou, L.; Zeng, Y.; Shen, J.; Gao, T.; Wang, C.; Liao, Q. Characteristics of O3 pollution and its response to environmental factors in Yueyang City. Geochimica 2024, 1–10. [Google Scholar] [CrossRef]
- Chen, L.; Ma, J.; Zhen, X.; Cao, Y. Variation characteristics and meteorological influencing factors of air pollution in Shanghai. J. Meteorol. Environ. 2017, 33, 59–67. [Google Scholar]
- Zhang, Y.; Wu, R.; Yang, X.; Yang, D.; Li, Y.; Wang, R.; Xu, H. Research on air pollution characteristics and influencing factors of typical urbanroad traffic densified monitoring stations. J. Environ. Eng. Technol. 2023, 13, 929–939. [Google Scholar]
- Guan, R.; Zheng, K.; Huang, Y. Analysis on weekend and holiday effects of air pollutants in Zhangjiajie city. J. Tongren Univ. 2018, 20, 81–85. [Google Scholar]
- Luo, J.; Huang, X.; Zhang, J.; Zhang, J.; Song, H. Study on the characteristics of air pollution and its holiday effect in Chengdu urban area. Sichuan Environ. 2018, 37, 21–26. [Google Scholar]
- Ma, B.; Chen, Z.; Liang, H. Analyse of characteristic of daily change in air pollutants’concentrations Shenzhen. Environ. Monit. China 2004, 47–54. [Google Scholar]
- Guo, Y.; Bao, Y.; Shen, L.; Zhu, Y. Spatial-temporal distribution characteristics and simulation analysis of subaerial ozone in Suzhou city. Environ. Sci. Technol. 2022, 45, 66–77. [Google Scholar]
- Fan, Y.; Fan, S.; Zhang, H.; Zu, F.; Meng, Q.; He, J. Characteristics of SO2, NO2, O3 volume fractions and their relationship with weather conditions at Linan in summer and winter. Trans. Atmos. Sci. 2013, 36, 121–128. [Google Scholar]
- Jingyi, X. Study on the Correlation and Synergistic Control of OVOCs in the Atmosphere and PM2.5 and O3 Pollution Characteristics. Master’s Thesis, Harbin Institute of Technology, Harbin, China, 2022. [Google Scholar]
- Zou, Y.; Charlesworth, E.; Yin, C.; Yan, X.; Deng, X.; Li, F. The weekday/weekend ozone differences induced by the emissions change during summer and autumn in Guangzhou, China. Atmos. Environ. 2019, 199, 114–126. [Google Scholar] [CrossRef]
- He, Y.; Lin, H.; Cao, S.; Song, J.; Su, W.; Xiong, Y. Characteristics of ozone pollution and high-impact meteorological factors in urban: A case study of Suzhou. Environ. Sci. 2023, 44, 85–93. [Google Scholar]
- Hu, Y.; Wang, J.; Xu, L.; Han, J. Analysis of meteorological conditions and temporal and spatial distribution characteristics of ground-level ozone pollution Ininner Mongolia. Environ. Monit. China 2022, 38, 65–72. [Google Scholar]
- Li, S.; Huang, Y.; Li, S.; Chen, M.; Cao, Z. Analysis on the seasonal difference of “Weekend Effect” of atmospheric O3 and its precursors in urban area of Xi’an. Environ. Pollut. Control 2019, 41, 1207–1210. [Google Scholar]
- Qiu, X.; Liang, G.; Zhang, J. Analysis of the weekend efect of air pollutants in the center of Guangzhou city. Guangzhou Environ. Sci. 2018, 33, 13–16. [Google Scholar]
- Wang, Z.; Li, Y.; Dong, X.; Sun, R.; Sun, N.; Pan, L. Analysis on weekend effect of air pollutants in urban atmosphere of Beijing. J. Univ. Chin. Acad. Sci. 2015, 32, 843–850. [Google Scholar]
- He, R.; Shan, L.; Tian, L.; Zhou, K.; Zhu, L. Evaluation of weekly cycle of air pollution in Anhui province. Trans. Atmos. Sci. 2021, 44, 363–370. [Google Scholar]
- Dai, Q.; Hou, L.; Liu, B.; Zhang, Y.; Song, C.; Shi, Z.; Hopke, P.K.; Feng, Y. Spring Festival and COVID-19 Lockdown: Disentangling PM sources in major Chinese cities. Geophys. Res. Lett. 2021, 48, e2021GL093403. [Google Scholar] [CrossRef]
- Javed, Z.; Wang, Y.; Xie, M.; Tanvir, A.; Rehman, A.; Ji, X.; Xing, C.; Shakoor, A.; Liu, C. Investigating the Impacts of the COVID-19 Lockdown on Trace Gases Using Ground-Based MAX-DOAS Observations in Nanjing, China. Remote Sens. 2020, 12, 3939. [Google Scholar] [CrossRef]
- Zhou, J.; Wu, Q. Characteristics of Spring Festival effect of atmospheric pollutants in Jinan city. J. Zhejiang Agric. Sci. 2018, 59, 338–342+347. [Google Scholar]
- Li, W.; Du, G.; Wang, M. Research on characteristics of the temporal and spatial variation of atmosphere pollutants concentrations during the Spring Festival from 2012 to 2014 in Zhengzhou. Meteorol. Environ. Sci. 2015, 38, 12–21. [Google Scholar]
- Zhou, Z.; Zhou, M.; Bao, Z.; Chen, Y.; Xu, Y. Analysis on impact of fireworks and firecrackers on air quality in county cities during Spring Festival. Environ. Sci. Manag. 2025, 50, 111–114. [Google Scholar]
- Chen, F.; Xian, Y.; Qi, M.; Qiao, Y. Characteristics of air pollution during the Spring Festival in Nanjing typical station. J. Qinghai Environ. 2018, 28, 184–188. [Google Scholar]
- Liu, W.; Hu, T.; Mao, Y.; Xu, A. Characteristics and origin analysis of air pollution during the Spring Festival in Linfen, Fenwei Plain. Environ. Sci. 2021, 42, 5122–5130. [Google Scholar]
- Liu, Y.; Ma, W.; Yin, S.; Li, C.; Xu, K.; Zhang, C.; Zhang, W.; Xue, Z.; Sun, Y.; Ji, D.; et al. Quantification of enhanced VOC emissions from fireworks. Environ. Pollut. 2022, 315, 120389. [Google Scholar] [CrossRef]
- Niu, Z.; Hu, T.; Kong, L.; Zhang, W.; Rao, P.; Ge, D. Air-pollutant mass concentration changes during COVID-19 pandemic in Shanghai, China. Air Qual. Atmos. Health 2021, 14, 523–532. [Google Scholar] [CrossRef] [PubMed]
- Li, M.; Kang, N.; Zhang, J.; Zhang, J.; Zhang, L. Analysis of air pollution status during the Spring Festival period in theYangtze River delta region from 2019 to 2022. Environ. Chem. 2025, 44, 903–915. [Google Scholar]
- Song, Y.; Wan, X.; Bai, S.; Guo, D.; Ren, C.; Zeng, Y.; Li, Y.; Li, X. The characteristics of air pollutants during two distinct episodes of fireworks burning in a valley city of north China. PLoS ONE 2017, 12, e0168297. [Google Scholar] [CrossRef] [PubMed]
- Su, X.; Feng, T.; Cao, J. Characteristics and formation mechanism of a heavy air pollution episode over Chinese cities during the National Day holiday in 2015. J. Earth Environ. 2017, 8, 25–36. [Google Scholar]
- Guo, W. Analysis of the continuous ozone pollution process during the National Day of 2018 in Shantou. Guangzhou Chem. Ind. 2020, 48, 111–115. [Google Scholar]
- Chen, J.; Gong, D.; Liao, T.; Zhou, Y. National Day effect and source analysis of atmospheric volatile organic compounds in the Pearl River Delta region. China Environ. Sci. 2023, 43, 3265–3280. [Google Scholar]
- Chen, J.; Liu, T.; Gong, D.; Li, J.; Chen, X.; Li, Q.; Liao, T.; Zhou, Y.; Zhang, T.; Wang, Y.; et al. Insight into decreased ozone formation across the Chinese National Day Holidays at a regional background site in the Pearl River Delta. Atmos. Environ. 2023, 315, 120142. [Google Scholar] [CrossRef]
- Javed, Z.; Tanvir, A.; Wang, Y.; Waqas, A.; Xie, M.; Abbas, A.; Sandhu, O.; Liu, C. Quantifying the impacts of COVID-19 lockdown and Spring Festival on air quality over Yangtze River Delta region. Atmosphere 2021, 12, 735. [Google Scholar] [CrossRef]
- Li, L.; Li, Q.; Huang, L.; Wang, Q.; Zhu, A.; Xu, J.; Liu, Z.; Li, H.; Shi, L.; Li, R.; et al. Air quality changes during the COVID-19 lockdown over the Yangtze River Delta Region: An insight into the impact of human activity pattern changes on air pollution variation. Sci. Total Environ. 2020, 732, 139282. [Google Scholar] [CrossRef]
- Wang, Y.; Yuan, Y.; Wang, Q.; Liu, C.; Zhi, Q.; Cao, J. Changes in air quality related to the control of coronavirus in China: Implications for traffic and industrial emissions. Sci. Total Environ. 2020, 731, 139133. [Google Scholar] [CrossRef] [PubMed]
- Ma, T.; Duan, F.; Ma, Y.; Zhang, Q.; Xu, Y.; Li, W.; Zhu, L.; He, K. Unbalanced emission reductions and adverse meteorological conditions facilitate the formation of secondary pollutants during the COVID-19 lockdown in Beijing. Sci. Total Environ. 2022, 838, 155970. [Google Scholar] [CrossRef] [PubMed]
- Fan, C.; Li, Y.; Guang, J.; Li, Z.; Elnashar, A. The impact of the control measures during the COVID-19 outbreak on air pollution in China. Remote Sens. 2020, 12, 1613. [Google Scholar] [CrossRef]
- Huang, X.; Ding, A.; Gao, J.; Zheng, B.; Zhou, D.; Qi, X.; Tang, R. Enhanced secondary pollution offset reduction of primary emissions during COVID-19 lockdown in China. Natl. Sci. Rev. 2021, 8, nwaa137. [Google Scholar] [CrossRef] [PubMed]
- Le, T.; Wang, Y.; Liu, L.; Yang, J.; Yung, Y.L.; Li, G. Unexpected air pollution with marked emission reductions during the COVID-19 outbreak in China. Science 2020, 369, 702–706. [Google Scholar] [CrossRef]
- Sicard, P.; Marco, A.D.; Agathokleous, E.; Feng, Z. Amplified ozone pollution in cities during the COVID-19 lockdown. Sci. Total Environ. 2020, 735, 139542. [Google Scholar] [CrossRef]
- Wang, Y.; Li, Z.; Wang, Q.; Jin, X.; Yan, P. Enhancement of secondary aerosol formation by reduced anthropogenic emissions during Spring Festival 2019 and enlightenment for regional PM2.5 control in Beijing. Atmos. Chem. Phys. 2021, 21, 915–926. [Google Scholar] [CrossRef]
- Wang, X.; Duan, W.; Zhu, J.; Wei, W.; Cheng, S.; Mao, S. Nonlinear influence of winter meteorology and precursor on PM2.5 based on mathematical and numerical models: A COVID-19 and Winter Olympics case study. Atmos. Environ. 2022, 278, 119072. [Google Scholar]
- Li, D.; Wu, Q.; Wang, H.; Xiao, H. The Spring Festival Effect: The change in NO2 column concentration in China caused by the migration of human activities. Atmos. Pollut. Res. 2021, 12, 101232. [Google Scholar] [CrossRef]
- Zhang, Y. Analysis of Ozone Pollution Characteristics in Shenyang During the Pandemic. Master’s Thesis, Liaoning University, Shenyang, China, 2023. [Google Scholar]
- Yu, X.; Yang, S.; Liu, N.; Zhang, Y. Amplification Effects of O3 Pollution in the Pearl River Delta During the Lockdown Period of COVID-19. Environ. Monit. China 2022, 38, 21–36. [Google Scholar]
- Tang, T.; Chang, E. Analysis of atmospheric ozone pollution characteristics and suggestions for control measures in the Beijing-Tianjin-Hebei region. Clean. World 2023, 39, 151–153. [Google Scholar]
- Li, M.; Zhang, Q.; Zheng, B.; Tong, D.; Lei, Y.; Liu, F. Persistent growth of anthropogenic non-methane volatile organic compound (NMVOC) emissions in China during 1990–2017: Drivers, speciation and ozone formation potential. Atmos. Chem. Phys. 2019, 19, 8897–8913. [Google Scholar] [CrossRef]
- Bai, Y.; Qin, X.; Zhao, X.; Sun, Z. Impact of urban development on natural comfort of humanliving environment in Beijing-Tianjin-Hebei region. Journal of Beijing. Norm. Univ. (Nat. Sci.) 2024, 60, 233–241. [Google Scholar]
- Zhou, Y.; Wang, Y.L.; Chen, L.; Wang, W.; Zhang, L.N.; Ji, S. Study of the relationship between O3 generation and its precursors NOx and VOCs emission in Tianjin. Environ. Monit. Forew. 2014, 6, 37–40+44. [Google Scholar]
- Ji, K. Research on the cross-regional joint prevention and control mechanism of environmental pollution in the Yangtze River Delta. J. Soc. Sci. Jiamusi Univ. 2025, 43, 40–43+48. [Google Scholar]
- Zhao, C.; Peng, L.; Sun, A.; Qin, Y.; Liu, H. Numerical modeling of tropospheric ozone over Yangtze Delta region. Acta Sci. Circumstantiae 2004, 24, 525–533. [Google Scholar]
- Fan, S.; Wang, H.; Lu, X.; He, G.; Cao, T. Progresses on ozone pollution in the Guangdong-Hong Kong-Macao Greater Bay Area since 1990s. Acta Sci. Circumstantiae 2023, 43, 1–18. [Google Scholar]
- Li, Y.; Lau, K.; Fung, J. Ozone source apportionment (OSAT) to differentiate local regional and super-regional source contributions in the Pearl River Delta region, China. J. Geophys. Res. Atmos. 2012, 117. [Google Scholar] [CrossRef]
- Zhao, W.; Fan, S.; Xie, W.; Sun, J. Influence of burning fireworks on air quality during the Spring Festival in the Pearl River delta. Environ. Sci. 2015, 36, 4358–4365. [Google Scholar]
- Zhu, Y.; Zheng, B.; Yang, C.; Tang, R.; Xu, J. Air quality changes and the driving factors in Guangdong Province during the COVID⁃19 pandemic. J. Nanjing Univ. (Nat. Sci.) 2021, 57, 1032–1041. [Google Scholar]
- Liao, M.; Gong, D.; Wang, S.; Liu, T.; Wang, H. Concentration characteristics and sources of PAN at Nanling background station during the National Day holidays. China Environ. Sci. 2021, 41, 2493–2503. [Google Scholar]
- Huang, F.; Wu, Q.; Wang, P. Population mobility and urban air quality: Causal inference and impact measurement. Sustainablity 2023, 15, 11591. [Google Scholar] [CrossRef]
- Tan, H.; Lin, Y.; Yao, Y.; Ma, K.; Fang, F. Spatiotemporal evolution and potential source areas of surface ozone in the Sichuan basin during 2015–2021. Res. Environ. Sci. 2023, 36, 660–672. [Google Scholar]
- Sun, N. Analysis of Spatiotemporal Patterns of Air Pollutants in Shenyang. Master’s Thesis, Shenyang University of Chemical, Shenyang, China, 2023. [Google Scholar]
- Fan, S.; Liu, N.; Zhang, F. Analysis of the air pollution characteristics trends and weekend effect in Urumqi. Environ. Prot. Xinjiang 2021, 43, 1–7. [Google Scholar]
- Wang, S.; Zhang, J. The ‘Holiday Effect’ of environmental air quality in Urumqi city. Arid Environ. Monit. 2025, 39, 21–33. [Google Scholar]
- Ma, Z.; Yan, J.; Yahefu, P.; Abbas, A. Characteristics and potential sources of surface O3 variation in Urumqi and Kashgar. Arid Zone Res. 2024, 41, 2004–2014. [Google Scholar]
- Lei, B. Analysis of Ozone Pollution Characteristics and Source Apportionment in Tumxuk City, Xinjiang. Master’s Thesis, Shihezi University, Shihezi, China, 2023. [Google Scholar]
- Yang, X.; Wang, Q.; Wang, L.; Liu, F.; Li, C.; Xu, G. Meteorological impacts, and potential source area analysis of ozone pollutionin Xi′an from 2014 to 2022. Res. Environ. Sci. 2025, 38, 486–496. [Google Scholar]
- Qiang, Y. Holiday Effect on Air Quality and the Impact of Control Measures in Xi’an. Master’s Thesis, Xi’an University of Architecture and Technology, Xi’an, China, 2023. [Google Scholar]
- Hua, R. Spatiotemporal Distribution Characteristics and Pollution Potential Modeling of Ozone in Changsha. Master’s Thesis, Chengdu University of Information Technology, Chengdu, China, 2023. [Google Scholar]
- Zhang, G. Analysis of Influencing Factors and Evolution Trends of PM2.5 and O3 Pollution in the Changsha-Zhuzhou-Xiangtan Urban Agglomeration. Master’s Thesis, Hunan University of Science and Technology, Xiangtan, China, 2023. [Google Scholar]
- Bin, J. Integrated Quantification of PM2.5 and Ozone Pollution Using High Spatiotemporal Resolution Prediction Modeling. Master’s Thesis, Hunan University, Changsha, China, 2023. [Google Scholar]
- Xie, R.; Hu, S. Study on ozone pollution characteristics in Qionghai City from 2018 to 2021. Environ. Sci. Manag. 2023, 48, 40–45. [Google Scholar]
- Li, L.; Wang, L.; Liu, X.; Wang, K.; Xu, Y.; Li, S.; Jiang, J. Temporal and spatial distribution characteristics of ozone and its relationship with meteorological factors in Harbin. China Environ. Sci. Manag. 2020, 40, 1991–1999. [Google Scholar]
- Yan, X.; Cao, D. Analysis on the Influence of Temporal and Spatial Variation of Ozone and Meteorological Conditions in High Altitud Area of Haidong City. J. Qinghai Environ. 2022, 32, 180–184. [Google Scholar]
- Gbrimblecombe, P.; Lai, Y. Effect of fireworks, Chinese New Year and the COVID-19 lockdown on air pollution and public attitudes. Aerosol Air Qual. Res. 2020, 20, 2318–2331. [Google Scholar] [CrossRef]
- Yu, X.; Yang, A.; Chen, L.; Wang, Y.; Zhu, L.; Wang, W.; Wang, X.; Yan, S.; Chen, E. Spatiotemporal distributions and variations in summertime ozone photochemical production regimes over Shanxi. Environ. Sci. 2024, 45, 4432–4439. [Google Scholar]
- Geng, H.; Xuan, Y.; Cai, X.; Zhang, Y.; Zhou, H. Mass concentration variation and cluster analysis of urban air pollutants in Taiyuan, Shanxi Province during Chinese New Year of 2014. Acta Sci. Circumstantiae 2015, 35, 965–974. [Google Scholar]
- Wang, Y.; Wang, X.; Zhang, B.; Zhao, L.; Liu, Y.; Si, S.; Xue, L. Traffic conditions on typical roads in urban Jinan and the differentiated impacts on air quality. J. Shandong Univ. (Eng. Sci.) 2025, 55, 138–148. [Google Scholar]
- Yang, S.; Yang, Q.; Kong, H.; Wang, R.; Xu, W. Analysis of spatio-temporal characteristics of air pollution and its impact factors in Henan province during 2015–2021. Meteorol. Environ. Sci. 2024, 47, 24–33. [Google Scholar]
- Tang, X.; Zhang, Y.; Shao, M. Atmospheric Environmental Chemistry, 2nd ed.; Higher Education Press: Beijng, China, 2006; pp. 232–236. [Google Scholar]
- Wang, L.; Li, M.; Yu, S.; Chen, X.; Li, Z. Unexpected rise of ozone in urban and rural areas, and sulfur dioxide in rural areas during the coronavirus city lockdown in Hangzhou, China: Implications for air quality. Environ. Chem. Lett. 2020, 18, 1713–1723. [Google Scholar] [CrossRef]
- Li, Y.; Shi, G.; Chen, Z. Spatial and temporal distribution characteristics of ground-level nitrogen dioxide and ozone across China during 2015–2020. Environ. Res. Lett. 2021, 16, 124031. [Google Scholar] [CrossRef]
- Silver, B.; He, X.; Arnold, S.R.; Spracklen, D.V. The impact of COVID-19 control measures on air quality in China. Environ. Res. Lett. 2020, 15, 084021. [Google Scholar] [CrossRef]
- Zhang, L.; Mu, Y.; Cai, Y.; Chen, X. Analysis of pollution characteristics of atmospheric VOCs and their ozone formation potential in Nanjing. Admin. Technol. Environ. Monit. 2024, 36, 65–69. [Google Scholar]
- Zhang, L.; Jacob, D.J.; Bowman, K.W.; Logan, J.A.; Turquety, S.; Hudman, R.C.; Li, Q.; Beer, R.; Worden, H.M.; Worden, J.R.; et al. Ozone-CO correlations determined by the TES satellite instrument in continental outflow regions. Geophys. Res. Lett. 2006, 33. [Google Scholar] [CrossRef]
- Cao, L. Pollution Characteristics and Health Risk Assessment of Odor-Causing Factors from Multi-Component Volatile Organic Compounds in Nanjing’s Atmosphere. Master’s Thesis, Nanjing University of Information Science and Technology, Nanjing, China, 2024. [Google Scholar]
- Benites-Morales, O.F.; Pacsi-Valdivia, S.A. AnÁlisis Temporal De Los Contaminantes AtmosfÉricos (NO2, O3 TroposfÉrico Y Co) Y Su RelaciÓn Con La Temperatura Del Aire Y La RadiaciÓn Solar En Lima Metropolitana. Ecol. Apl. 2023, 22, 17–25. [Google Scholar] [CrossRef]
- Yang, Y.; Wang, Y.; Zhou, P.; Yao, D.; Ji, D.; Sun, J.; Wang, Y.; Zhao, S.; Huang, W.; Yang, S.; et al. Atmospheric reactivity and oxidation capacity during summer at a suburban site between Beijing and Tianjin. Atmos. Chem. Phys. 2020, 20, 8181–8200. [Google Scholar] [CrossRef]
- Yang, Y.; Wang, Y.; Yao, D.; Zhao, S. Significant decreases in the volatile organic compound concentration, atmospheric oxidation capacity and photochemical reactivity during the National Day holiday over a suburban site in the North China Plain. Environ. Pollut. 2020, 263, 114657. [Google Scholar] [CrossRef]
- Zhao, Z.; Sun, N.; Zhou, W.; Ma, S.; Li, X.; Li, M. Chemical compositions in winter PM2.5 in Changzhou of the Yangtze River Delta Region, China: Characteristics and atmospheric responses along with the different pollution levels. Front. Environ. Sci. 2022, 10, 907735. [Google Scholar] [CrossRef]
- Yan, W.; Liu, D.; Kang, Z.; Xie, Z.; Sun, Y. The characteristics of ozone pollution and its relationship with meteorological factors in Jiangsu. J. Meteorol. Sci. 2019, 39, 477–487. [Google Scholar]
- Tan, P.H.; Chou, C.; Chou, C.C.K. Impact of urbanization on the air pollution “holiday effect” in Taiwan. Atmos. Environ. 2013, 70, 361–375. [Google Scholar] [CrossRef]
- Tan, P.H.; Chou, C.; Liang, J.Y.; Chou, C.C.K.; Shiu, C.J. Air pollution “holiday effect” resulting from the Chinese New Year. Atmos. Environ. 2009, 43, 2114–2124. [Google Scholar] [CrossRef]

| Holiday | Duration (Days) | Tourist Arrivals (Billion) | Daily Average (Million) | Tourist Trip Percentage (%) |
|---|---|---|---|---|
| NYD | 3 | 0.53 | 1757 | 1.08 |
| SF | 7 | 3.08 | 4400 | 6.30 |
| TSD | 3 | 0.24 | 792 | 0.49 |
| MD | 5 | 2.74 | 5480 | 5.6 |
| DBF | 3 | 1.06 | 3533 | 2.17 |
| MAD&CND | 8 | 8.26 | 10,325 | 16.89 |
| Other | 336 | 32.99 | 981.8 | 67.46 |
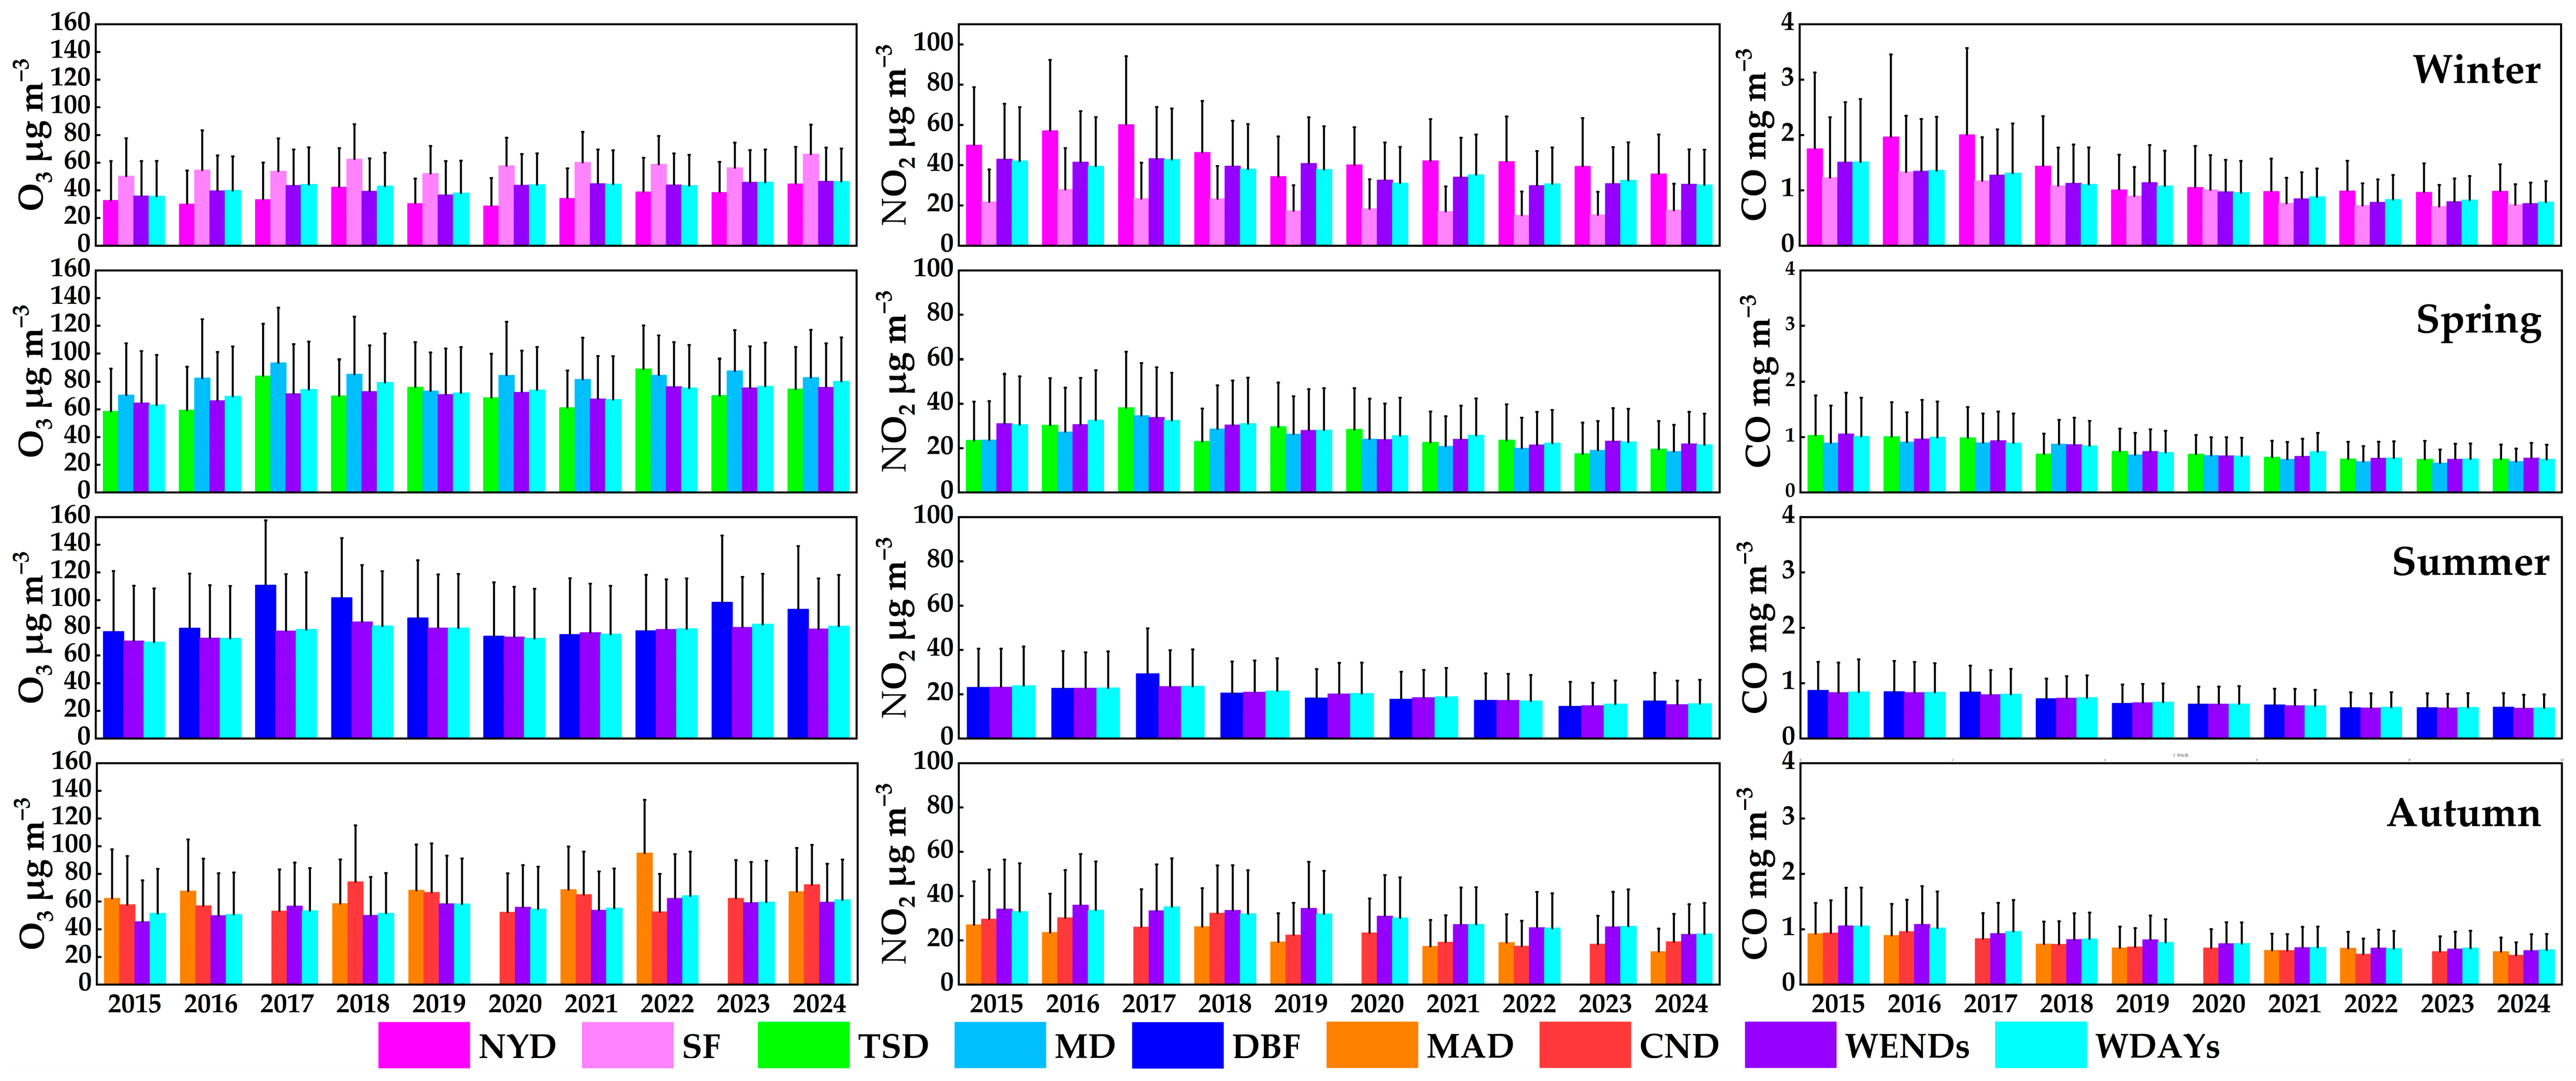
| Holiday | O3 Mean (μg/m3) | O3 Range (μg/m3) | NO₂ Mean (μg/m3) | NO₂ Range (μg/m3) | CO Mean (mg/m3) | CO Range (mg/m3) |
|---|---|---|---|---|---|---|
| NYD | 34.34 | 28.67–44.60 | 44.70 | 34.37–60.12 | 1.31 | 0.96–2.00 |
| SF | 57.23 | 50.22–66.11 | 19.68 | 15.04–27.89 | 0.97 | 0.71–1.33 |
| TSD | 71.06 | 58.49–89.18 | 26.30 | 17.40–38.26 | 0.76 | 0.60–1.03 |
| MD | 82.70 | 70.31–93.68 | 24.94 | 18.48–34.66 | 0.71 | 0.53–0.91 |
| DBF | 86.92 | 73.98–110.80 | 20.44 | 14.50–29.22 | 0.71 | 0.56–1.00 |
| MAD | 68.38 | 58.48–95.00 | 21.89 | 14.86–28.18 | 0.76 | 0.59–1.03 |
| CND | 61.30 | 52.23–74.22 | 24.65 | 17.32–33.57 | 0.73 | 0.53–1.00 |
Disclaimer/Publisher’s Note: The statements, opinions and data contained in all publications are solely those of the individual author(s) and contributor(s) and not of MDPI and/or the editor(s). MDPI and/or the editor(s) disclaim responsibility for any injury to people or property resulting from any ideas, methods, instructions or products referred to in the content. |
© 2025 by the authors. Licensee MDPI, Basel, Switzerland. This article is an open access article distributed under the terms and conditions of the Creative Commons Attribution (CC BY) license (https://creativecommons.org/licenses/by/4.0/).
Share and Cite
Chen, S.; Chen, J.; Li, J.; Gong, D.; Wang, B. Holiday Effect of Ozone Pollution in China. Atmosphere 2025, 16, 559. https://doi.org/10.3390/atmos16050559
Chen S, Chen J, Li J, Gong D, Wang B. Holiday Effect of Ozone Pollution in China. Atmosphere. 2025; 16(5):559. https://doi.org/10.3390/atmos16050559
Chicago/Turabian StyleChen, Sijun, Jun Chen, Jiangyong Li, Daocheng Gong, and Boguang Wang. 2025. "Holiday Effect of Ozone Pollution in China" Atmosphere 16, no. 5: 559. https://doi.org/10.3390/atmos16050559
APA StyleChen, S., Chen, J., Li, J., Gong, D., & Wang, B. (2025). Holiday Effect of Ozone Pollution in China. Atmosphere, 16(5), 559. https://doi.org/10.3390/atmos16050559