
Particulate Matter 2.5 (PM2.5): Persistence and Trends in the Air Quality of Five India Cities


Abstract
:1. Introduction
2. Literature Review
3. Data
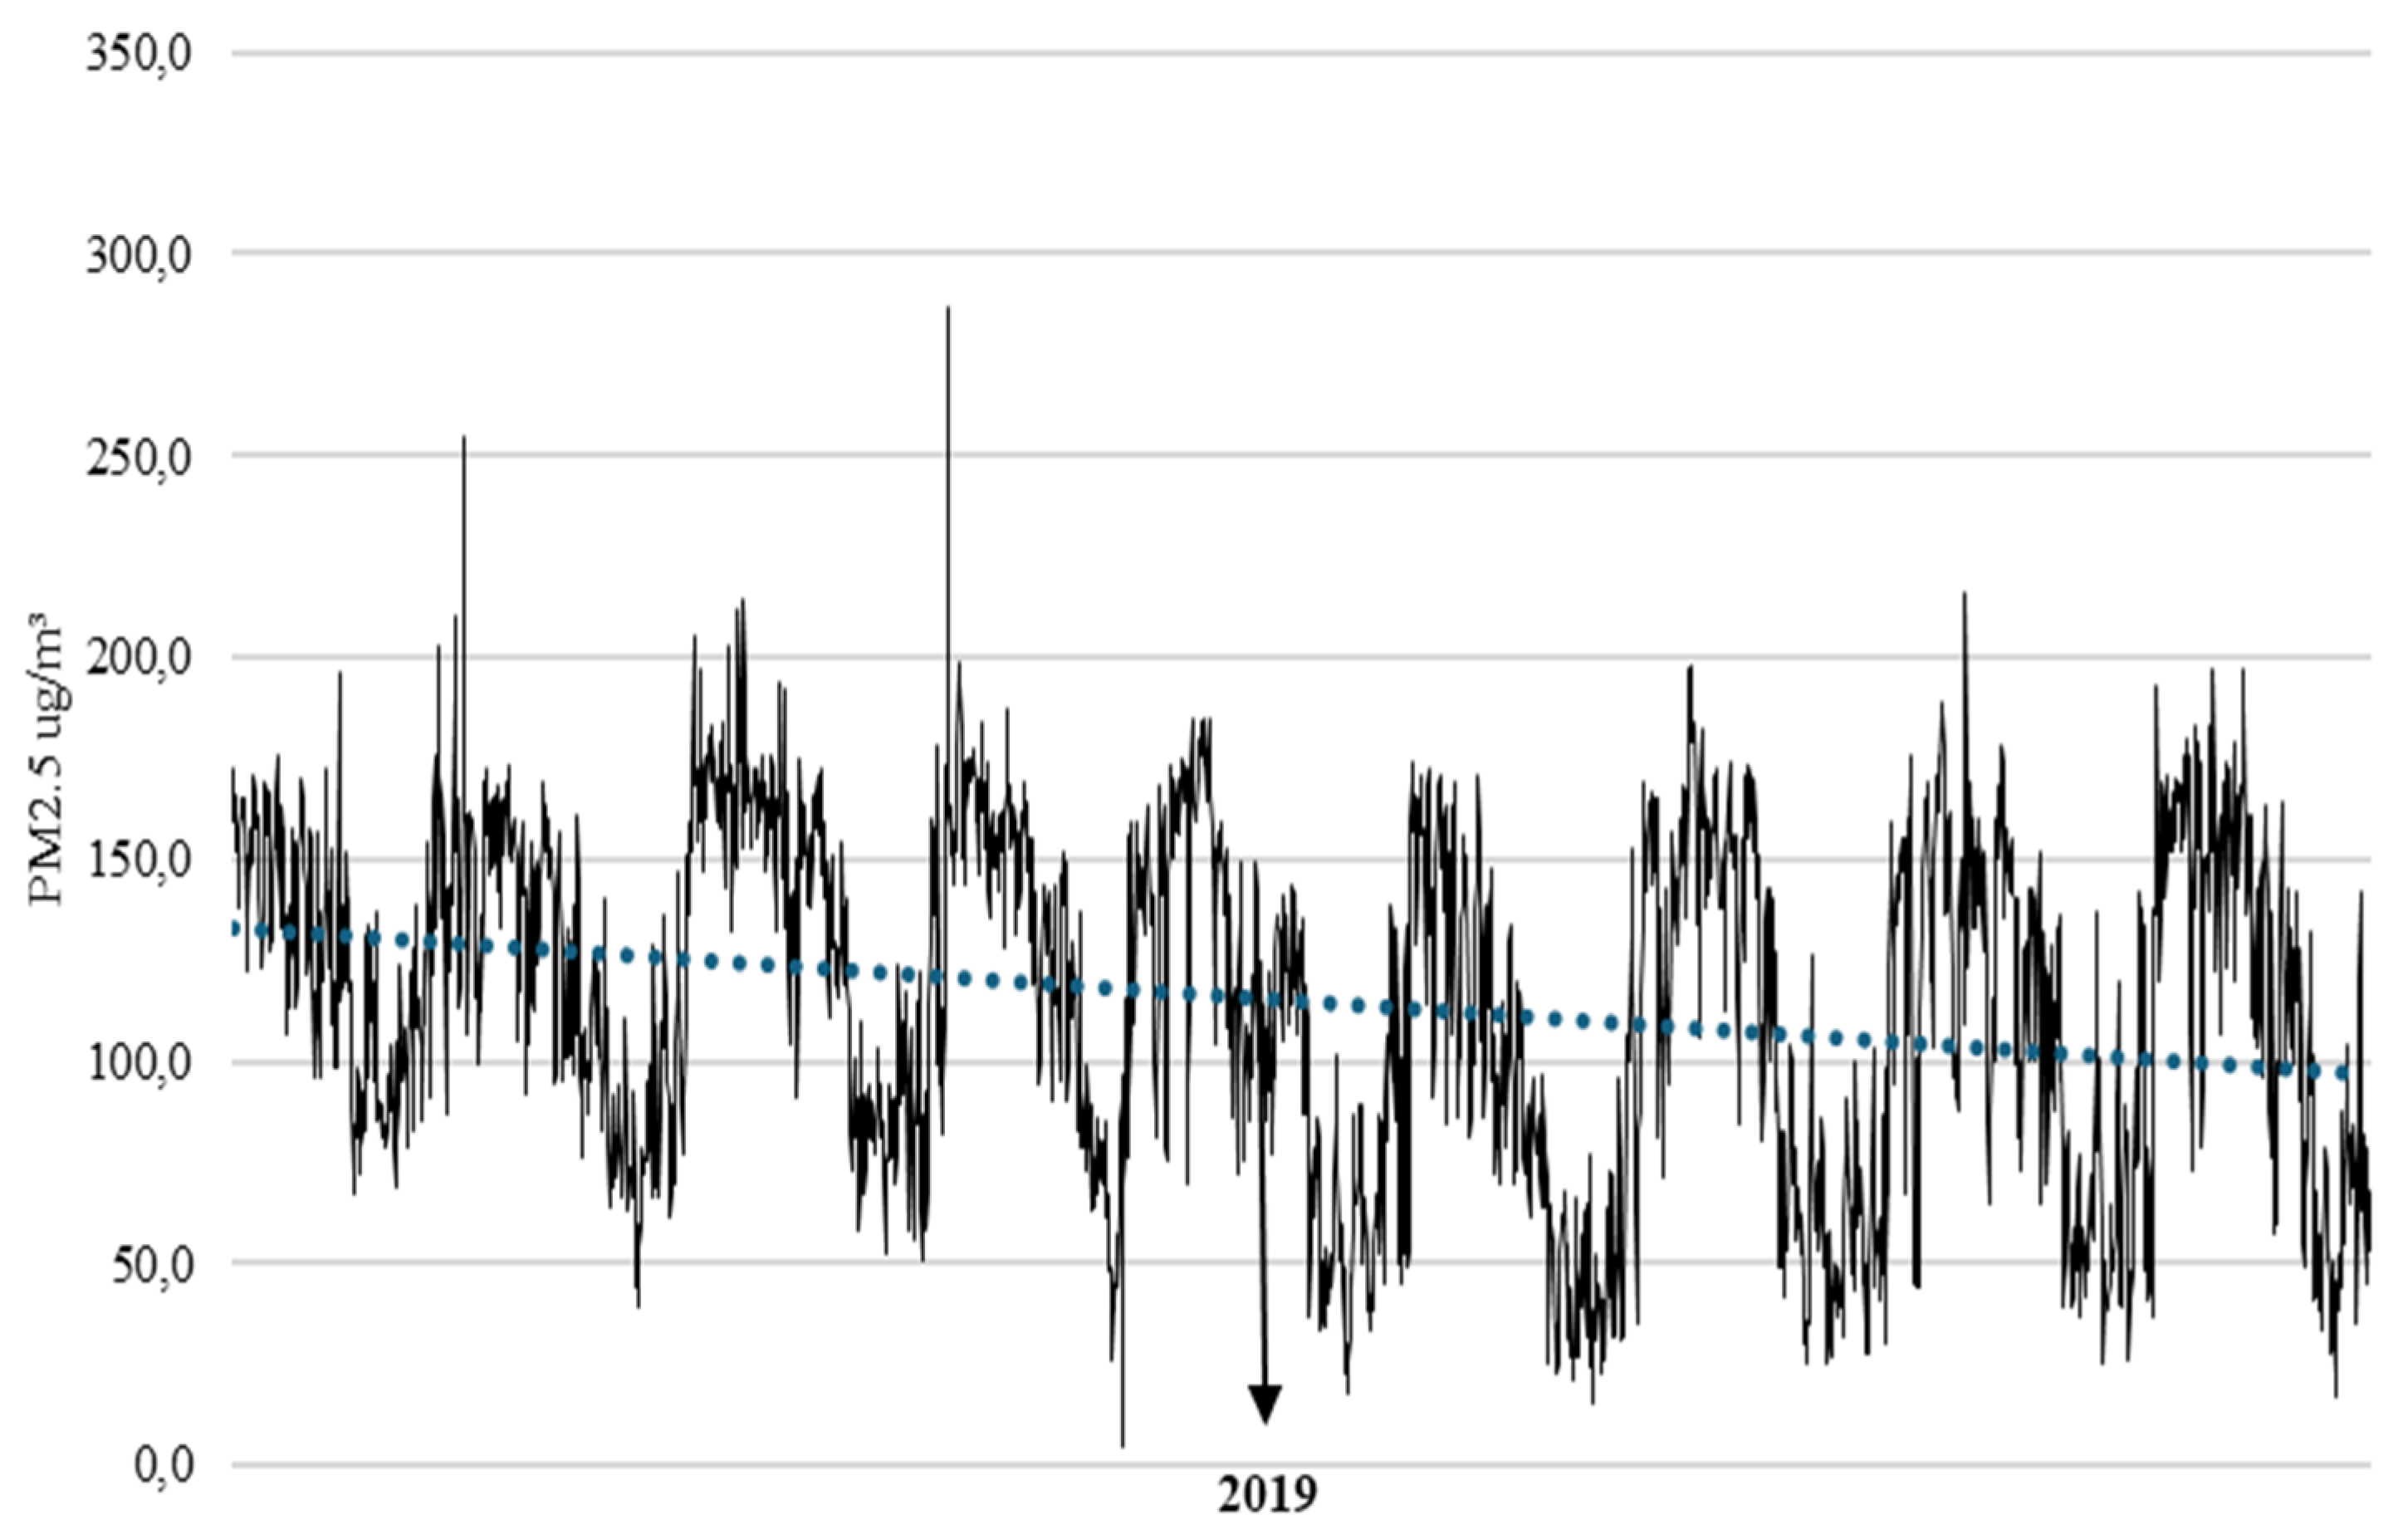
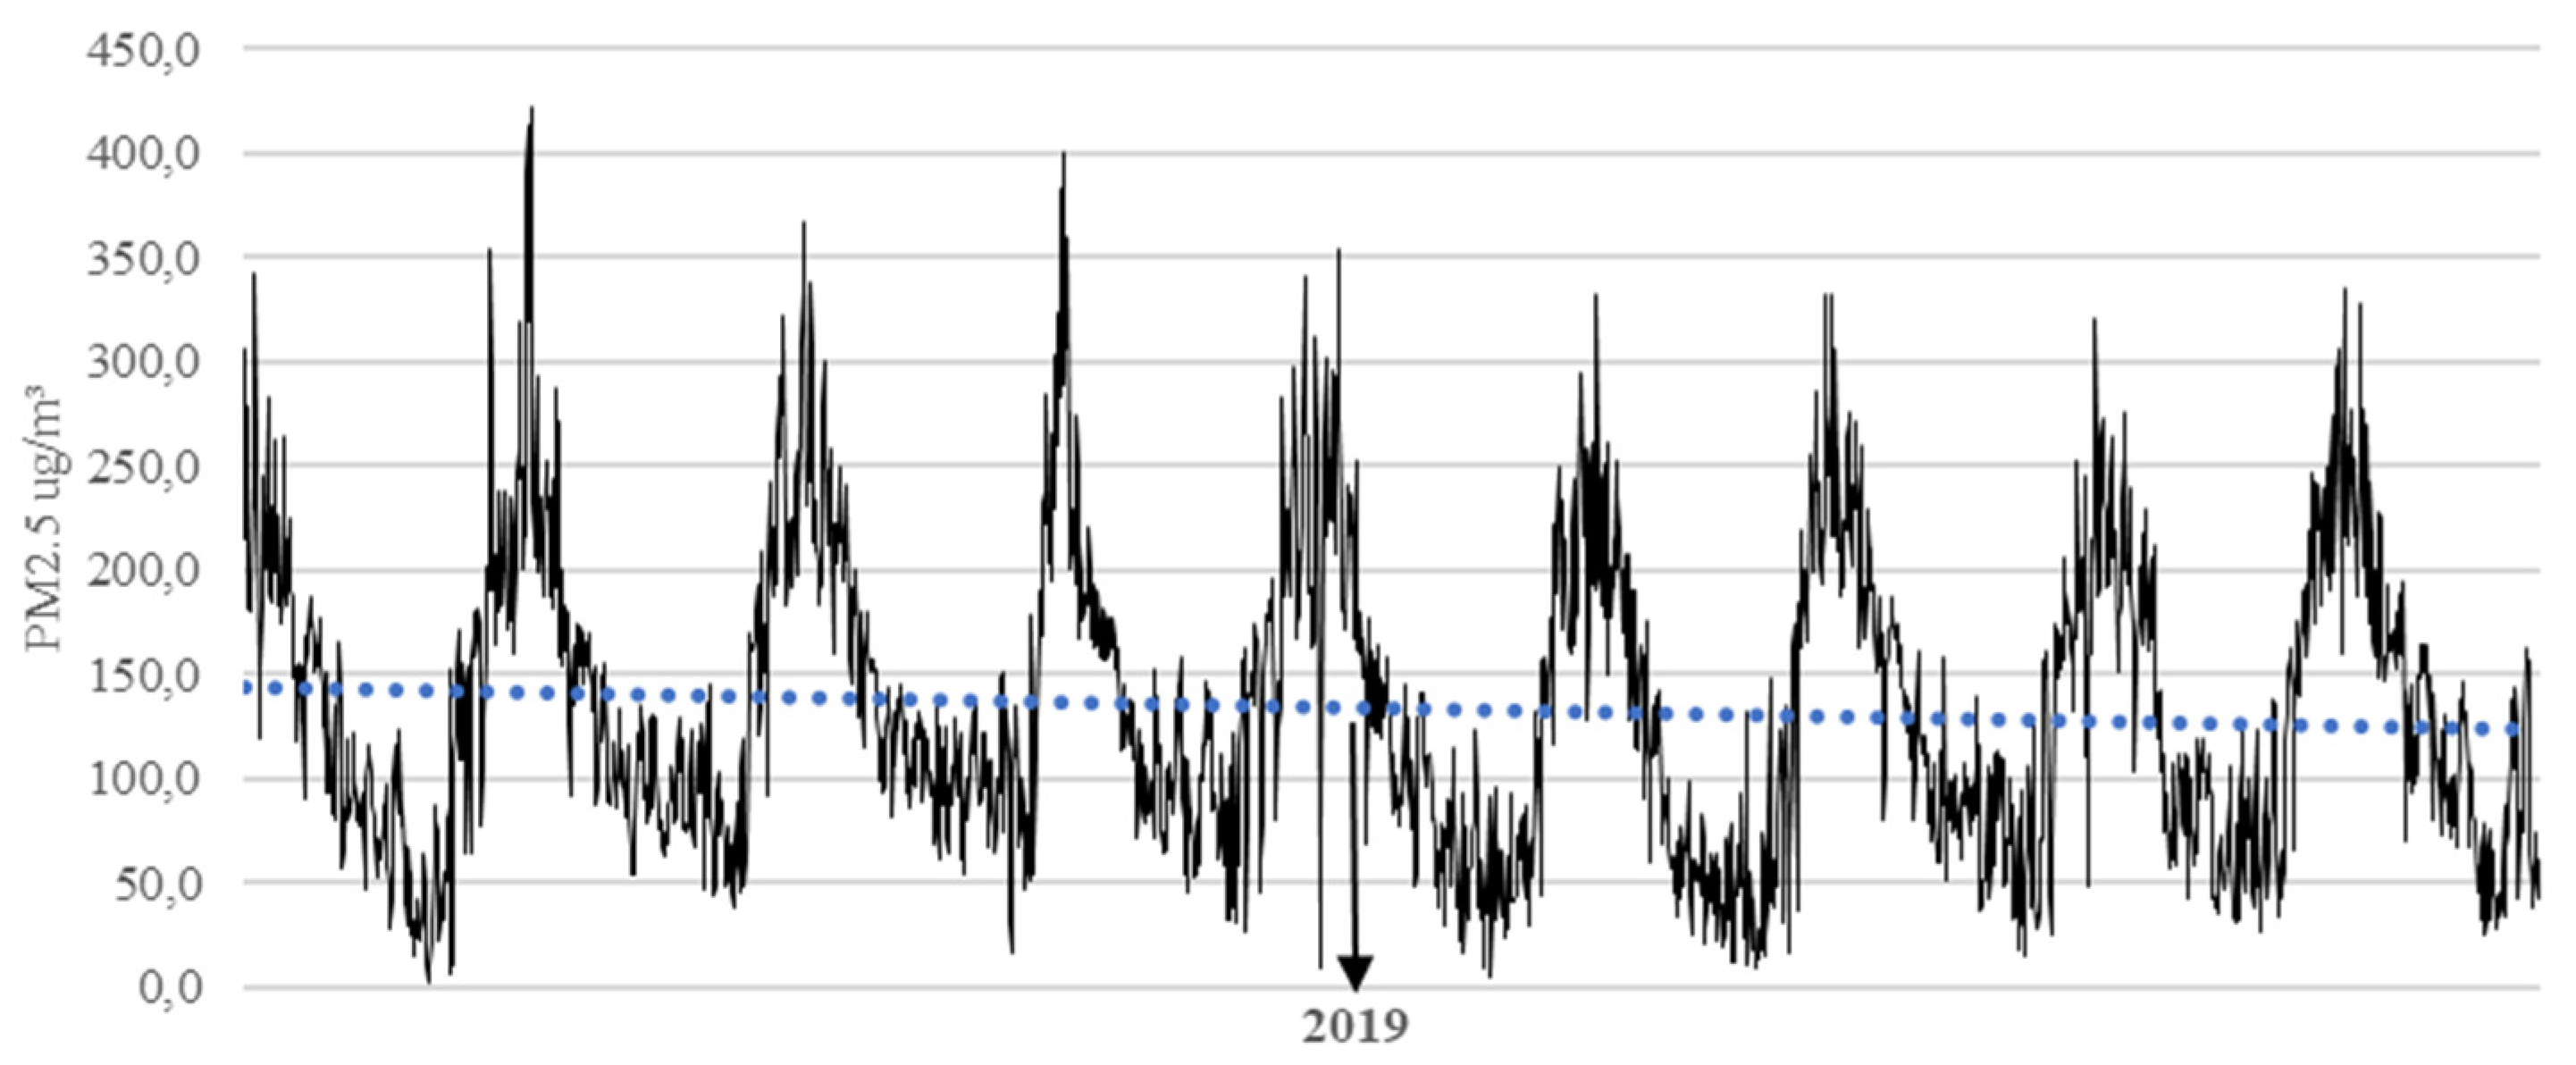
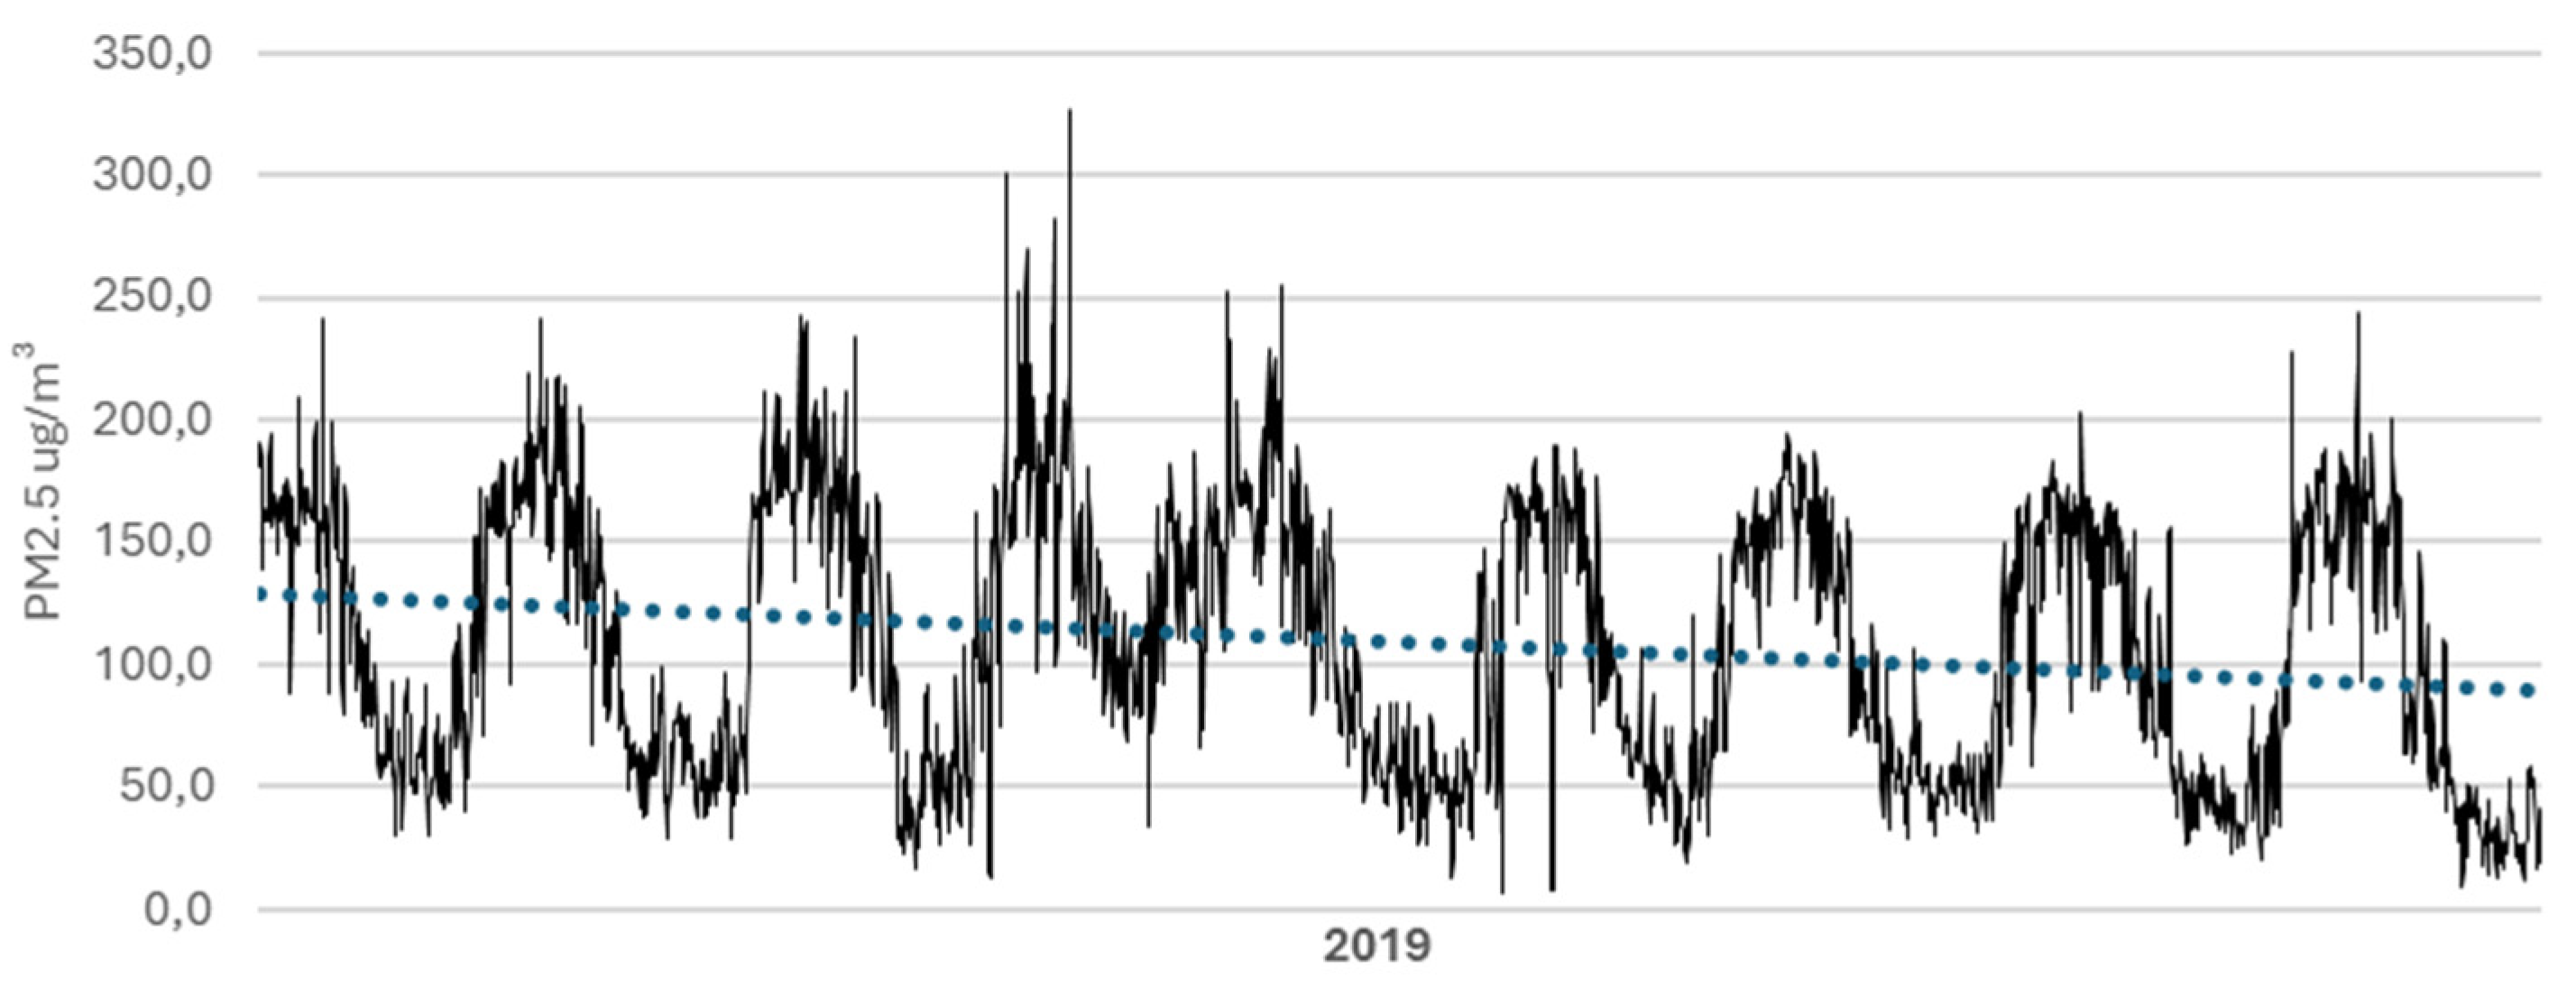
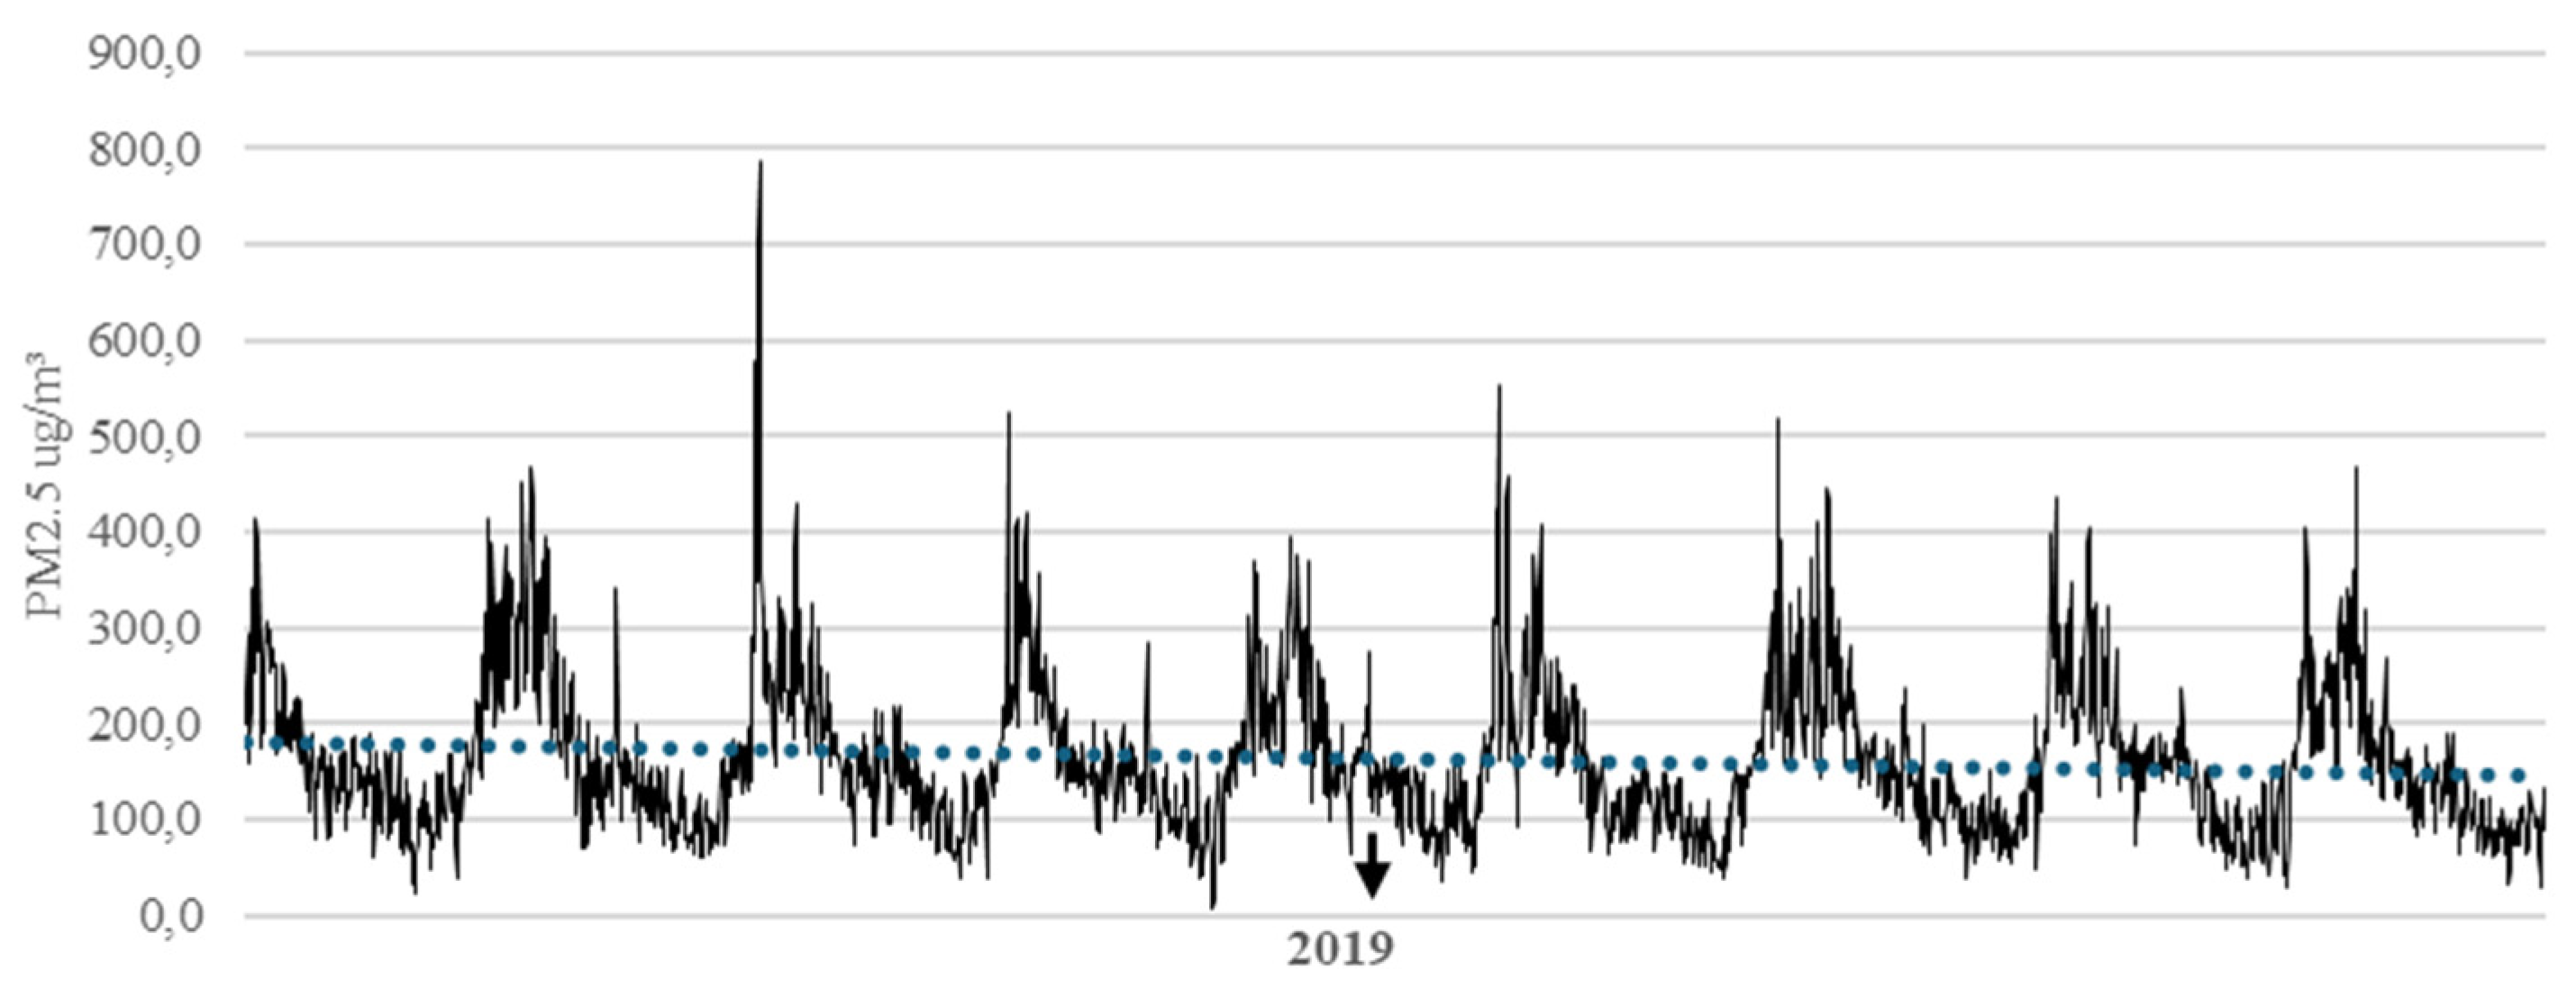
4. Methodology and Empirical Results
5. Conclusions
Author Contributions
Funding
Institutional Review Board Statement
Informed Consent Statement
Data Availability Statement
Conflicts of Interest
References
- WHO. WHO Global Air Quality Guidelines. 2021. Available online: https://www.who.int/es/news-room/questions-and-answers/item/who-global-air-quality-guidelines (accessed on 28 March 2025).
- National Clean Air Programme (NCAP). Ministry of Environment, Forest and Climate Change. Government of India. 2019. Available online: https://prana.cpcb.gov.in/#/about (accessed on 28 March 2025).
- Chafe, Z.; Chowdhury, S. A deadly double dose for India’s. Nat. Sustain. 2021, 4, 835–836. [Google Scholar] [CrossRef]
- Central Pollution Control Board (CPCB). Ministry of Environment, Forest and Climate Change Government of India. Available online: https://cpcb.nic.in/air-pollution/ (accessed on 28 March 2025).
- Health Effects Institute (HEI). Air Quality and Health. In Cities: A State of Global Air Report 2022; Health Effects Institute: Boston, MA, USA, 2022; Available online: https://www.stateofglobalair.org/sites/default/files/documents/2022-08/2022-soga-cities-report.pdf (accessed on 28 March 2025).
- IQAir World’s most Polluted Cities. 2022. Available online: https://www.iqair.com/world-most-polluted-cities (accessed on 28 March 2025).
- Rao, N.D.; Kiesewetter, G.; Min, J.; Pachauri, S.; Wagner, F. Household contributions to and impacts from air pollution in India. Nat. Sustain. 2021, 4, 859–867. [Google Scholar] [CrossRef]
- Stewart, G.J.; Nelson, B.S.; Acton, W.J.F.; Vaughan, A.R.; Farren, N.J.; Hopkins, J.R.; Ward, M.W.; Swift, S.J.; Arya, R.; Mondal, A.; et al. Emissions of intermediate-volatility and semi-volatile organic compounds from domestic fuels used in Delhi, India. Atmos. Chem. Phys. 2021, 21, 2407–2426. [Google Scholar] [CrossRef]
- Chakrabarti, M.; Khan, T.; Kishore, A.; Roy, D.; Scott, S.P. Risk of acute respiratory infection from crop burning in India: Estimating disease burden and economic welfare from satellite and national health survey data for 250 000 persons. Int. J. Epidemiol. 2019, 48, 1113–1124. [Google Scholar] [CrossRef]
- Cusworth, D.H.; Mickley, L.J.; Sulprizio, M.P.; Liu, T.; Marlier, M.E.; DeFries, R.S.; Guttikunda, S.K.; Gupta, P. Quantifying the influence of agricultural fires in northwest India on urban air pollution in Delhi, India. Environ. Res. Lett. 2018, 13, 044018. [Google Scholar] [CrossRef]
- The World Bank. What You Need to Know About Climate Change and Air Pollution. 2022. Available online: https://www.worldbank.org/en/news/feature/2022/09/01/what-you-need-to-know-about-climate-change-and-air-pollution (accessed on 28 March 2025).
- Smith, K.R. National burden of disease in India from indoor air pollution. Proc. Natl. Acad. Sci. USA 2000, 97, 13286–13293. [Google Scholar] [CrossRef]
- Balakrishnan, K.; Dey, S.; Gupta, T.; Dhaliwal, R.S.; Brauer, M.; Cohen, A.J.; Dandona, L. The impact of air pollution on deaths, disease burden, and life expectancy across the states of India: The Global Burden of Disease Study 2017. Lancet Planet Health 2018, 3, e26–e39. [Google Scholar] [CrossRef]
- Hang, Y.; Meng, X.; Li, T.; Wang, T.; Cao, J.; Fu, Q.; Dey, S.; Li, S.; Huang, K.; Liang, F.; et al. Assessment of long-term particulate nitrate air pollution and its health risk in China. iScience 2022, 25, 104899. [Google Scholar] [CrossRef]
- Shen, J.; Cai, W.; Chen, X.; Chen, X.; Zhao, Z.; Ma, Z.; Yang, F.; Zhang, S. Synergies of carbon neutrality, air pollution control, and health improvement a case study of China energy interconnection scenario. Glob. Energy Interconnect. 2022, 5, 531–542. [Google Scholar] [CrossRef]
- Badami, M.G. Transport and urban air pollution in India. Environ. Manag. 2005, 36, 195–204. [Google Scholar] [CrossRef]
- Puthussery, J.V.; Dave, J.; Shukla, A.; Gaddamidi, S.; Singh, A.; Vats, P.; Salana, S.; Ganguly, D.; Rastogi, N.; Tripathi, S.N.; et al. Effect of Biomass Burning, Diwali Fireworks, and Polluted Fog Events on the Oxidative Potential of Fine Ambient Particulate Matter in Delhi, India. Environ. Sci. Technol. 2022, 56, 14605–14616. [Google Scholar] [CrossRef]
- Ravindra, K.; Singh, T.; Singh, V.; Chintalapati, S.; Beig, G.; Mor, S. Understanding the influence of summer biomass burning on air quality in North India: Eight cities field campaign study. Sci. Total Environ. 2023, 861, 160361. [Google Scholar] [CrossRef]
- Cropper, M.L.; Guttikunda, S.; Jawahar, P.; Lazri, Z.; Malik, K.; Song, X.P.; Yao, X. Applying benefit-cost analysis to air pollution control in the Indian power sector. J. Benefit-Cost Anal. 2019, 10 (Suppl. S1), 185–205. [Google Scholar] [CrossRef] [PubMed]
- Pandey, A.; Brauer, M.; Cropper, M.L.; Balakrishnan, K.; Mathur, P.; Dey, S.; Dandona, L. Health and economic impact of air pollution in the states of India: The Global Burden of Disease Study 2019. Lancet Planet. Health 2021, 5, e25–e38. [Google Scholar] [CrossRef] [PubMed]
- Naveen, V.; Anu, N. Time series analysis to forecast air quality indices in Thiruvananthapuram District, Kerala, India. J. Eng. Res. Appl. 2017, 7, 66–84. [Google Scholar] [CrossRef]
- Abhilash, M.S.K.; Thakur, A.; Gupta, D.; Sreevidya, B. Time Series Analysis of Air Pollution in Bengaluru Using ARIMA Model. In Ambient Communications and Computer Systems. Advances in Intelligent Systems and Computing; Perez, G., Tiwari, S., Trivedi, M., Mishra, K., Eds.; Springer: Singapore, 2018; Volume 696. [Google Scholar] [CrossRef]
- Gopu, P.; Panda, R.R.; Nagwani, N.K. Time Series Analysis Using ARIMA Model for Air Pollution Prediction in Hyderabad City of India. In Soft Computing and Signal Processing; Reddy, V.S., Prasad, V.K., Wang, J., Reddy, K.T.V., Eds.; Advances in Intelligent Systems and Computing; Springer: Singapore, 2021; Volume 1325. [Google Scholar] [CrossRef]
- Kulkarni, G.E.; Muley, A.A.; Deshmukh, N.K.; Bhalchandra, P.U. Autoregressive integrated moving average time series model for forecasting air pollution in Nanded city, Maharashtra, India. Model. Earth Syst. Environ. 2018, 4, 1435–1444. [Google Scholar] [CrossRef]
- Chaudhuri, S.; Dutta, D. Mann–Kendall trend of pollutants, temperature and humidity over an urban station of India with forecast verification using different ARIMA models. Environ. Monit. Assess. 2014, 186, 4719–4742. [Google Scholar] [CrossRef]
- Gil-Alana, L.A.; Yaya, O.S.; Carmona-González, N. Air quality in London: Evidence of persistence, seasonality and trends. Theor. Appl. Climatol. 2020, 142, 103–115. [Google Scholar] [CrossRef]
- Gil-Alana, L.A.; Yaya, O.; Awolaja, O.; Cristofaro, L. Long memory and time trends in PM pollution in US states. J. Appl. Meteorol. Climatol. 2020, 59, 1351–1367. [Google Scholar] [CrossRef]
- Lin, G.-Y.; Lee, Y.-M.; Tsai, C.-J.; Lin, C.-Y. Spatial-temporal characterization of air pollutants using a hybrid deep learning/Kriging model incorporated with a weather normalization technique. Atmos. Environ. 2022, 289, 119304. [Google Scholar] [CrossRef]
- Chen, M.; Chen, Y.; Zhu, H.; Wang, Y.; Xie, Y. Analysis of pollutants transport in heavy air pollution processes using a new complex-network-based model. Atmos. Environ. 2023, 292, 19395. [Google Scholar] [CrossRef]
- Chen, Z.; Barros, C.P.; Gil-Alana, L.A. The persistence of air pollution in four mega-cities of China. Habitat Int. 2016, 56, 103–108. [Google Scholar] [CrossRef]
- Caporale, G.M.; Gil-Alana, L.A.; Carmona-González, N. Particulate matter 10 (PM10): Persistence and trends in eight European capitals. Air Quality. Atmos. Health 2021, 14, 1097–1102. [Google Scholar] [CrossRef]
- World Air Quality Index (WAQI). Available online: https://aqicn.org/map/world/es/ (accessed on 28 March 2025).
- US. Embassy & Consulates in India. Available online: https://in.usembassy.gov/embassy-consulates/new-delhi/air-quality-data/ (accessed on 28 March 2025).
- Granger, C.W.J. Long memory relationships and the aggregation of dynamic models. J. Econom. 1980, 14, 227–238. [Google Scholar] [CrossRef]
- Granger, C.W.J.; Joyeux, R. An Introduction to Long-Memory Time Series Models and Fractional Differencing. J. Time Ser. Anal. 1980, 1, 15–29. [Google Scholar] [CrossRef]
- Hosking, J.R. Fractional differencing. Biometrika 1981, 68, 165–176. [Google Scholar] [CrossRef]
- Bloomfield, P. An Exponential Model for the Spectrum of a Scalar Time Series. Biometrika 1973, 60, 217–226. [Google Scholar] [CrossRef]
- Gil-Alana, L.A. The use of the Bloomfield model as an approximation to ARMA processes in the context of fractional integration. Math. Comput. Model. 2004, 39, 429–436. [Google Scholar] [CrossRef]
- Gil-Alana, L.A. Fractional integration with Bloomfield exponential spectral disturbances. A Monte Carlo experiment and an application. Braz. J. Probab. Stat. 2008, 22, 69–93. [Google Scholar]
- Robinson, P.M. Efficient Tests of Nonstationary Hypotheses. J. Am. Stat. Assoc. 1994, 89, 1420–1437. [Google Scholar] [CrossRef]


| (i) Original Data | |||
|---|---|---|---|
| City | No Terms | With an Intercept | An Intercept and a Time Trend |
| Mumbai | 0.73 (0.70, 0.76) | 0.71 (0.68, 0.75) | 0.71 (0.68, 0.75) |
| New Delhi | 0.67 (0.64, 0.71) | 0.66 (0.63, 0.70) | 0.66 (0.63, 0.70) |
| Hyderabad | 0.76 (0.72, 0.80) | 0.74 (0.71, 0.78) | 0.74 (0.71, 0.78) |
| Chennai | 0.72 (0.68, 0.76) | 0.71 (0.67, 0.75) | 0.71 (0.67, 0.75) |
| Kolkata | 0.76 (0.72, 0.79) | 0.75 (0.72, 0.79) | 0.75 (0.72, 0.79) |
| (ii) Logged data | |||
| Mumbai | 0.77 (0.74, 0.81) | 0.69 (0.66, 0.73) | 0.69 (0.66, 0.73) |
| New Delhi | 0.78 (0.75, 0.82) | 0.64 (0.62, 0.68) | 0.64 (0.62, 0.68) |
| Hyderabad | 0.80 (0.77, 0.83) | 0.69 (0.66, 0.73) | 0.69 (0.66, 0.73) |
| Chennai | 0.77 (0.73, 0.80) | 0.68 (0.64, 0.72) | 0.68 (0.64, 0.72) |
| Kolkata | 0.78 (0.74, 0.82) | 0.70 (0.67, 0.74) | 0.70 (0.67, 0.74) |
| (i) Original Data | |||
|---|---|---|---|
| City | No Terms | With an Intercept | An Intercept and a Time Trend |
| Mumbai | 0.71 (0.68, 0.75) | 173.49 (10.34) | --- |
| New Delhi | 0.66 (0.63, 0.70) | 225.27 (7.32) | --- |
| Hyderabad | 0.74 (0.71, 0.78) | 166.14 (10.96) | --- |
| Chennai | 0.71 (0.67, 0.75) | 102.51 (6.07) | --- |
| Kolkata | 0.75 (0.72, 0.79) | 281.83 (11.92) | --- |
| (I) Logged data | |||
| Mumbai | 0.69 (0.66, 0.73) | 5.125 (26.73) | --- |
| New Delhi | 0.64 (0.62, 0.68) | 5.376 (30.50) | --- |
| Hyderabad | 0.69 (0.66, 0.73) | 5.086 (31.07) | --- |
| Chennai | 0.68 (0.64, 0.72) | 4.615 (21.29) | --- |
| Kolkata | 0.70 (0.67, 0.74) | 5.561 (23.31) | --- |
| (i) Original Data | |||
|---|---|---|---|
| City | No Terms | With an Intercept | An Intercept and a Time Trend |
| Mumbai | 0.61 (0.58, 0.64) | 0.59 (0.56, 0.62) | 0.59 (0.56, 0.63) |
| New Delhi | 0.55 (0.52, 0.58) | 0.52 (0.49, 0.56) | 0.52 (0.49, 0.56) |
| Hyderabad | 0.63 (0.60, 0.66) | 0.60 (0.55, 0.64) | 0.60 (0.55, 0.64) |
| Chennai | 0.51 (0.47, 0.54) | 0.46 (0.42, 0.50) | 0.46 (0.42, 0.50) |
| Kolkata | 0.62 (0.59, 0.65) | 0.60 (0.56, 0.64) | 0.60 (0.56, 0.64) |
| (i) Logged data | |||
| Mumbai | 0.69 (0.66, 0.72) | 0.55 (0.52, 0.59) | 0.55 (0.52, 0.59) |
| New Delhi | 0.73 (0.68, 0.76) | 0.53 (0.50, 0.56) | 0.53 (0.50, 0.56) |
| Hyderabad | 0.77 (0.74, 0.80) | 0.61 (0.57, 0.66) | 0.61 (0.57, 0.66) |
| Chennai | 0.65 (0.62, 0.68) | 0.43 (0.39, 0.47) | 0.43 (0.39, 0.47) |
| Kolkata | 0.70 (0.67, 0.74) | 0.53 (0.50, 0.56) | 0.53 (0.50, 0.56) |
| (i) Original data | |||
|---|---|---|---|
| City | No Terms | With an Intercept | An Intercept and a Time Trend |
| Mumbai | 0.59 (0.56, 0.62) | 166.81 (12.02) | −0.0325 (−2.01) |
| New Delhi | 0.52 (0.49, 0.56) | 206.26 (9.82) | --- |
| Hyderabad | 0.60 (0.55, 0.64) | 155.123 (12.18) | --- |
| Chennai | 0.46 (0.42, 0.50) | 97.935 (11.99) | --- |
| Kolkata | 0.60 (0.56, 0.64) | 248.35 (12.94) | −0.0452 (−1.91) |
| (i) Logged data | |||
| Mumbai | 0.55 (0.52, 0.59) | 5.071 (34.41) | −0.00035 (−2.50) |
| New Delhi | 0.53 (0.50, 0.56) | 5.268 (40.69) | --- |
| Hyderabad | 0.61 (0.57, 0.66) | 5.030 (35.53) | --- |
| Chennai | 0.43 (0.39, 0.47) | 4.495 (48.24) | --- |
| Kolkata | 0.53 (0.50, 0.56) | 5.234 (31.14) | −0.00026 (−1.69) |
Disclaimer/Publisher’s Note: The statements, opinions and data contained in all publications are solely those of the individual author(s) and contributor(s) and not of MDPI and/or the editor(s). MDPI and/or the editor(s) disclaim responsibility for any injury to people or property resulting from any ideas, methods, instructions or products referred to in the content. |
© 2025 by the authors. Licensee MDPI, Basel, Switzerland. This article is an open access article distributed under the terms and conditions of the Creative Commons Attribution (CC BY) license (https://creativecommons.org/licenses/by/4.0/).
Share and Cite
Gil-Alana, L.A.; Carmona-González, N. Particulate Matter 2.5 (PM2.5): Persistence and Trends in the Air Quality of Five India Cities. Atmosphere 2025, 16, 534. https://doi.org/10.3390/atmos16050534
Gil-Alana LA, Carmona-González N. Particulate Matter 2.5 (PM2.5): Persistence and Trends in the Air Quality of Five India Cities. Atmosphere. 2025; 16(5):534. https://doi.org/10.3390/atmos16050534
Chicago/Turabian StyleGil-Alana, Luis A., and Nieves Carmona-González. 2025. "Particulate Matter 2.5 (PM2.5): Persistence and Trends in the Air Quality of Five India Cities" Atmosphere 16, no. 5: 534. https://doi.org/10.3390/atmos16050534
APA StyleGil-Alana, L. A., & Carmona-González, N. (2025). Particulate Matter 2.5 (PM2.5): Persistence and Trends in the Air Quality of Five India Cities. Atmosphere, 16(5), 534. https://doi.org/10.3390/atmos16050534