Article

High-Resolution Analysis of Temporal Variation and Driving Factors of CO2 Concentration in Nanning City in Spring 2024

Scientific Research Academy of Guangxi Environmental Protection, Nanning 530022, China
*
Author to whom correspondence should be addressed.
Atmosphere 2025, 16(4), 449; https://doi.org/10.3390/atmos16040449
Submission received: 18 February 2025 / Revised: 2 April 2025 / Accepted: 8 April 2025 / Published: 12 April 2025
(This article belongs to the Section Air Pollution Control)

Abstract

:
In this study, based on high-resolution online monitoring data of CO2 concentration in Nanning City in the spring of 2024, we analyzed the characteristics of diurnal and monthly changes of CO2 concentration in Nanning City and explored the influencing factors through the background sieving method and Lagrangian Particle Dispersion Model (LPDM) traceability simulations combined with meteorological factor analysis. The results demonstrates that the diurnal variation of CO2 concentration in Nanning City exhibits a bimodal pattern of peak in the afternoon and trough in the early morning, with a mean concentration of 460 ± 15 ppm. Transportation emissions were identified as the dominant source of this variation. The trend of monthly concentration changes was first increasing and then decreasing, with an increase in February–March and a decrease in April, indicating that it was affected by the combined effect of vegetation photosynthesis and urban human activities. The results of the background sieving method and traceability simulation analysis showed that the CO2 concentration in Nanning City was more affected by local emission sources than sinks, and the industrial sources and transportation sources in the north–south direction had a significant effect on the CO2 concentration. This research provides critical data support for formulating carbon reduction strategies and coordinated atmospheric environment management in subtropical cities.

1. Introduction

Under the context of global warming, the increasing frequency of extreme weather and climate events poses significant threats to socioeconomic development and ecological systems. Climate change has become a shared challenge for humanity in the 21st century [1,2]. To address this issue, the Chinese government is committed to reducing carbon emissions and has explicitly set the goals of achieving “carbon peaking” by 2030 and “carbon neutrality” by 2060, thereby advancing sustainable development [3].
Urban areas, covering only 2% of the Earth’s surface, are home to 50% of the global population and contribute over 80% of global carbon dioxide (CO2) emissions [4]. Urban CO2 emissions are influenced not only by direct anthropogenic activities but also by meteorological conditions, boundary layer dynamics, and atmospheric transport processes. These emissions predominantly originate from anthropogenic sources such as fossil fuel combustion in transportation, industrial activities, and building energy consumption [5,6]. Therefore, it is essential to conduct quantitative studies on urban CO2 emissions. Currently, two primary approaches are employed for quantifying CO2 emissions: bottom-up and top-down methods [7,8,9]. Among these, the top-down online monitoring approach is more suitable for urban CO2 emission monitoring compared to the bottom-up emission factor method [10]. However, due to the complex interplay of local emissions, meteorological conditions, and atmospheric dispersion, a comprehensive assessment requires integrating multiple analytical techniques, including high temporal and spatial resolution measurements, data calibration, and atmospheric modeling.
Previous studies have investigated urban CO2 variations in different cities. Sun [11] analyzed the diurnal and monthly temporal variations in average CO2 concentrations and their correlations with meteorological factors using the observational data of major greenhouse gas concentrations and meteorological parameters in Shenyang’s ambient air in 2019. The study revealed that CO2 concentrations in Shenyang’s ambient air exhibit clear monthly variation patterns, with significantly higher concentrations during the heating season compared to the non-heating season. In urban areas, CO2 emissions primarily result from energy consumption in transportation, households, public buildings, and industrial activities [12]. As a dominant and rapidly growing sector, the transportation industry directly releases CO2 through the combustion of gasoline or diesel.
Ryoichi Imasu [13] conducted long-term studies on the diurnal and seasonal variations of CO2 concentrations in urban, suburban, and rural areas around Tokyo using NDIR technology. The research indicated that the highest CO2 concentrations in urban areas typically occur before midnight during winter, while suburban emissions peak before dawn, with the lowest daytime concentrations observed in summer, as they are influenced by vegetation respiration and photosynthesis. Similarly, Derek V. Mallia [14] monitored urban CO2 concentrations in Utah during the COVID-19 lockdown. Their findings showed a significant reduction in urban CO2 concentrations during the spring of 2020 compared to previous years, aligning with a 30% decrease in average traffic volume, suggesting that reduced traffic was the primary factor for the observed decline in CO2 concentrations during the lockdown. These studies highlight the importance of continuous CO2 monitoring to understand emission dynamics and assess the impact of mitigation measures.
As the capital of Guangxi Zhuang Autonomous Region, Nanning plays a pivotal role as a gateway to Southeast Asia and is a critical node for the Belt and Road Initiative. The city experiences significant seasonal and daily CO2 fluctuations due to the combined effects of human activities and meteorological factors. However, Nanning has yet to establish a comprehensive urban CO2 monitoring system, leading to insufficient data to support carbon emission warning systems and policymaking. This study addresses this gap by analyzing the diurnal and monthly variations of CO2 concentrations in Nanning during the spring of 2024 through high-resolution online monitoring data. By integrating background screening and source-tracing simulation methods with meteorological analysis, this research investigates key emission sources and atmospheric transport mechanisms that affect CO2 concentrations. The findings provide valuable insights for urban carbon reduction strategies, air quality management, and climate mitigation planning in subtropical cities.

2. Materials and Methods

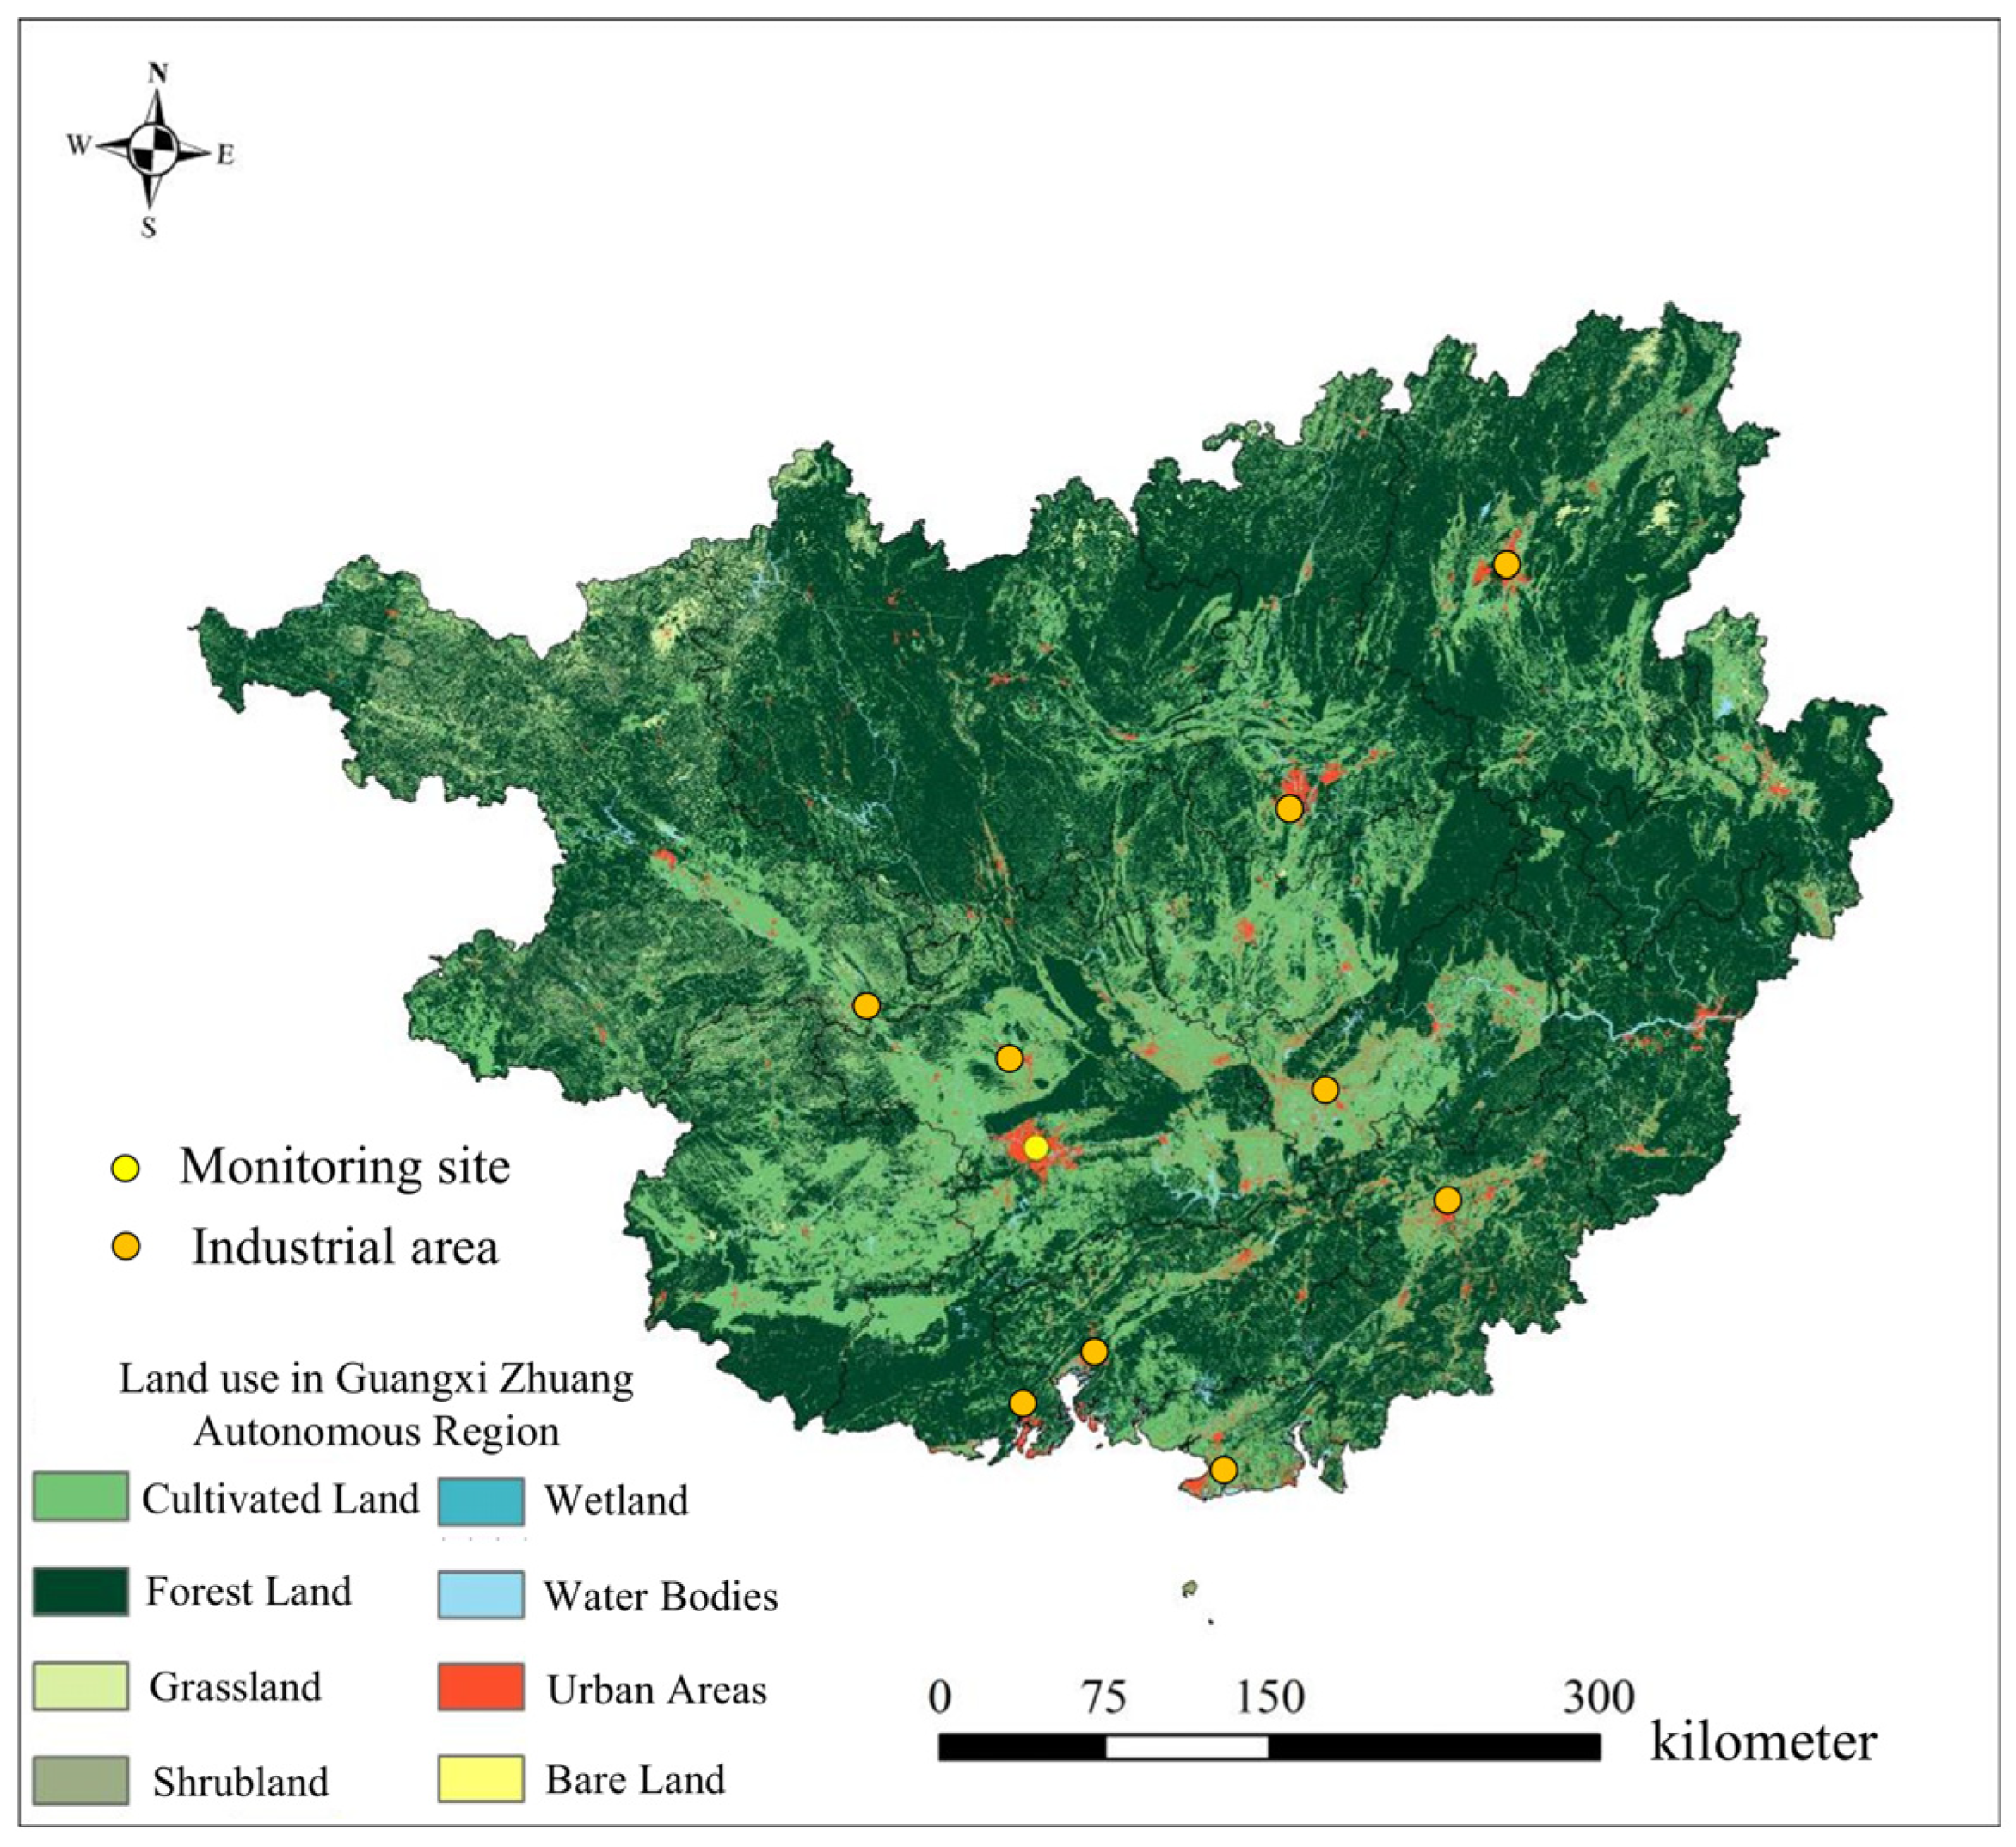
2.1. Monitoring Location

The monitoring site selected for this study is located at the Scientific Research Academy of Guangxi Environmental Protection, No. 5 Jiaoyu Road, Nanning City, Guangxi Zhuang Autonomous Region. The monitoring period spans from February to April 2024, and the monitoring area covers the main urban area of 20 km around the monitoring site. As shown in Figure 1, the monitoring site is situated in Nanning City (longitude: 108.337818, latitude: 22.803907), characterized primarily by urban land use and a relatively dense population. The area near the monitoring site includes traffic hubs and major urban roads with high vehicle flow, making it a typical urban location heavily influenced by traffic emissions; the monitoring site was primarily representative of emissions in urban transportation-intensive areas. Based on the available greenhouse gas inventory data for Nanning, the percentage contributions to total emissions are as follows: energy activities: 53.07%; industrial processes: 15.00%; agricultural activities: 25.45%; and waste management: 6.48%.
Climatic characteristics during the study period exhibited prevailing southeasterly winds (mean speed 1.8 m/s), urban boundary layer height ranging from 200 to 5000 m (lidar-measured), a mean temperature of 22.3 °C, and a relative humidity of 78%. Physical characteristics of the primary site (Guangxi Environmental Protection Academy) are as follows: located 20 m above ground level on a 10-story building, surrounded by mixed commercial–residential land use within a 500 m radius, and close to traffic arteries (<100 m to Jiaoyu Road interchange).
The atmospheric stability in Nanning exhibits distinct seasonal variations. During winter and spring, the boundary layer is lower with stable atmospheric conditions, creating unfavorable conditions for pollutant dispersion. The combination of a shallow boundary layer and high humidity (>80%) accelerates the transformation of particulate pollutants while suppressing vertical mixing, leading to enhanced near-surface pollutant accumulation.

2.2. Experimental Instruments

Instrument settings: in this study, real-time monitoring of CO2 concentrations in Nanning was conducted using a high-precision greenhouse gas analyzer (HGA-331) based on cavity ring-down spectroscopy (CRDS) technology. The key specifications are as follows: the temporal resolution is 1 min, and the spatial resolution is 20 km. Detection chamber volume: ≤30 mL, allowing for a low sample demand and a fast response time; flow rate: the sample inlet flow rate is 0.3 standard liters per minute (SLM) at 760 Torr, without the need for filtration; detection limits (5 min, 1σ):CO2: <25 ppb (range: 0–1000 ppm, optimal precision in 300–700 ppm); drift stability: the maximum drift for CO2 is <80 ppb over 24 h.
Date calibration and quality control: to ensure data accuracy, the instrument underwent biweekly calibration (every 14 days) using National Institute of Metrology (NIM)-certified standard gases (CO2: 400 ± 0.5 ppm, 500 ± 0.5 ppm, and 600 ± 0.5 ppm). The quality control procedures included routine zero and span calibration, which were conducted using zero air and standard gases. Outlier detection: a three-sigma method was applied to remove extreme values exceeding 3σ from the mean. Drift correction: if the calibration drift exceeded ±1% of the standard value, correction factors were applied.

2.3. Data Processing

Moving Average Filter: Data analysis was performed using a moving average filter (MAF) background screening method. A proportion of high and low values was excluded from the smoothing process. The two-week smoothing window was chosen through sensitivity analysis to balance noise reduction and temporal resolution preservation. This window size corresponds to 672 hourly data points (14 days × 48 measurements/day), exceeding the minimum statistical threshold (n > 500) required for robust moving average calculations. The first value in the window was compared with the fitting value, and if the difference was ≥2σ, the value was marked as a non-background value; otherwise, it was marked as a background value. This process was repeated for subsequent windows. High and low values excluded from smoothing were marked as background values if their residuals with the fitting line were <2σ within each smoothing window.
Lagrangian Particle Dispersion Model: The LPDM was configured using high-resolution meteorological data from atmospheric observatories, with a domain spanning approximately 500 km × 500 km at a 12 km horizontal resolution. The LPDM was employed to perform 3 h backward trajectory analysis for periods affected by emission sources. The resulting footprint represents the probability distribution of air masses arriving at the receptor site through atmospheric transport. This distribution is quantified by the residence time of air masses in each grid cell, where higher footprint values indicate a greater influence of that grid cell on air quality at the monitoring site.

3. Results and Discussion

3.1. Characteristics of CO2 Concentration Variations in Nanning

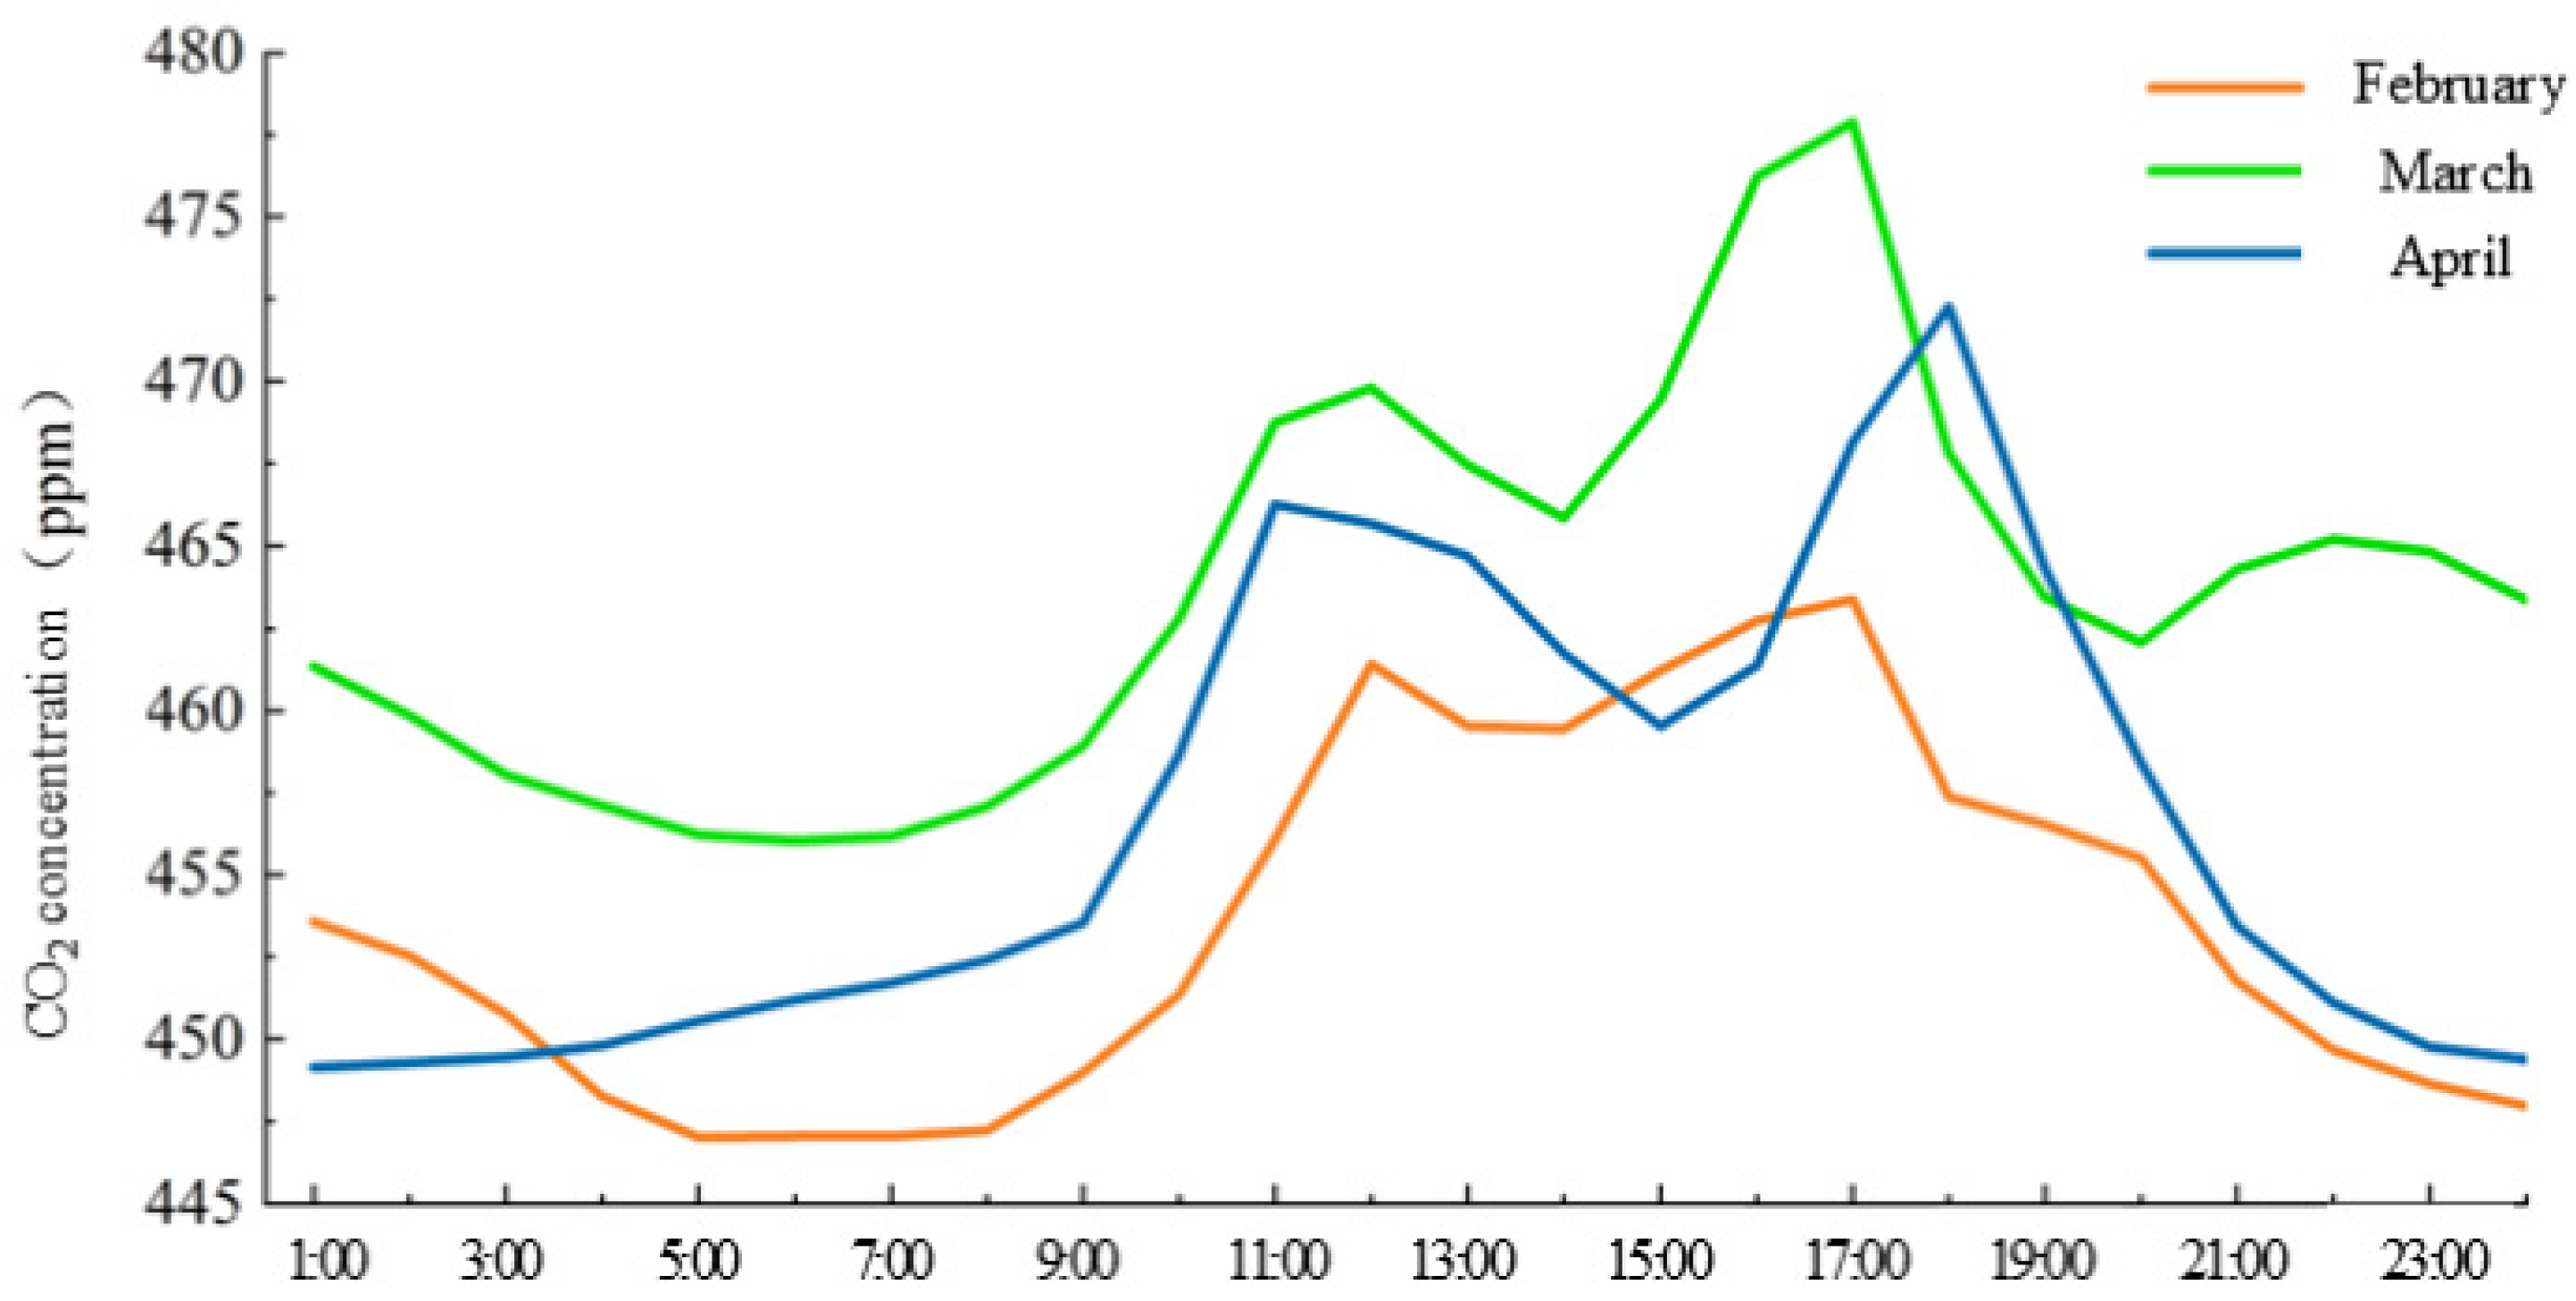
3.1.1. Diurnal Variation of CO2 Concentrations in Nanning

As shown in Figure 2, the diurnal variation of CO2 concentration in Nanning during the spring of 2024 fluctuates within the range of (460 ± 15) ppm. Compared to other economically developed and densely populated cities, such as Urumqi in 2018 (451 ± 25 ppm) [15], Nanjing in 2021 (452 ± 28 ppm) [16], and Hangzhou in 2020 (464 ± 2 ppm) [17], Nanning’s daily CO2 concentrations are relatively lower. However, the levels are significantly higher than those observed at background stations, such as Waliguan (412.07 ± 4.78 ppm) [18] and Lin’an (428.53 ppm) [19], indicating that Nanning’s CO2 concentration exhibits typical urban atmospheric characteristics. This pattern is primarily attributed to the rapid urbanization and accelerating industrial production in Nanning, which lead to increased CO2 emissions from industrial activities and human activities.
The diurnal CO2 concentration in Nanning exhibits a bimodal structure, with higher concentrations in the afternoon and lower concentrations in the early morning. Peak values are observed around 11:00–13:00, followed by a decline until a trough is reached at approximately 15:00. The concentrations then rise again, peaking around 18:00, before gradually decreasing. Notably, February, coinciding with the Chinese New Year holiday, shows a different diurnal variation pattern compared to March and April. During February, CO2 concentrations rise to 460 ppm by 11:00 and then stabilize, without the distinct bimodal structure seen in March and April. This phenomenon is primarily attributed to reduced urban traffic during holiday periods, which significantly decreases vehicle exhaust emissions from gasoline combustion. This indicates that demographic factors (e.g., population mobility patterns) play a critical role in influencing urban CO2 emissions [20].
The diurnal variation pattern observed in Nanning aligns with findings by He and Liu [21,22], who identified similar peak patterns in urban CO2 concentration diurnal curves, highlighting the significant influence of traffic emissions on CO2 concentrations in Nanning.

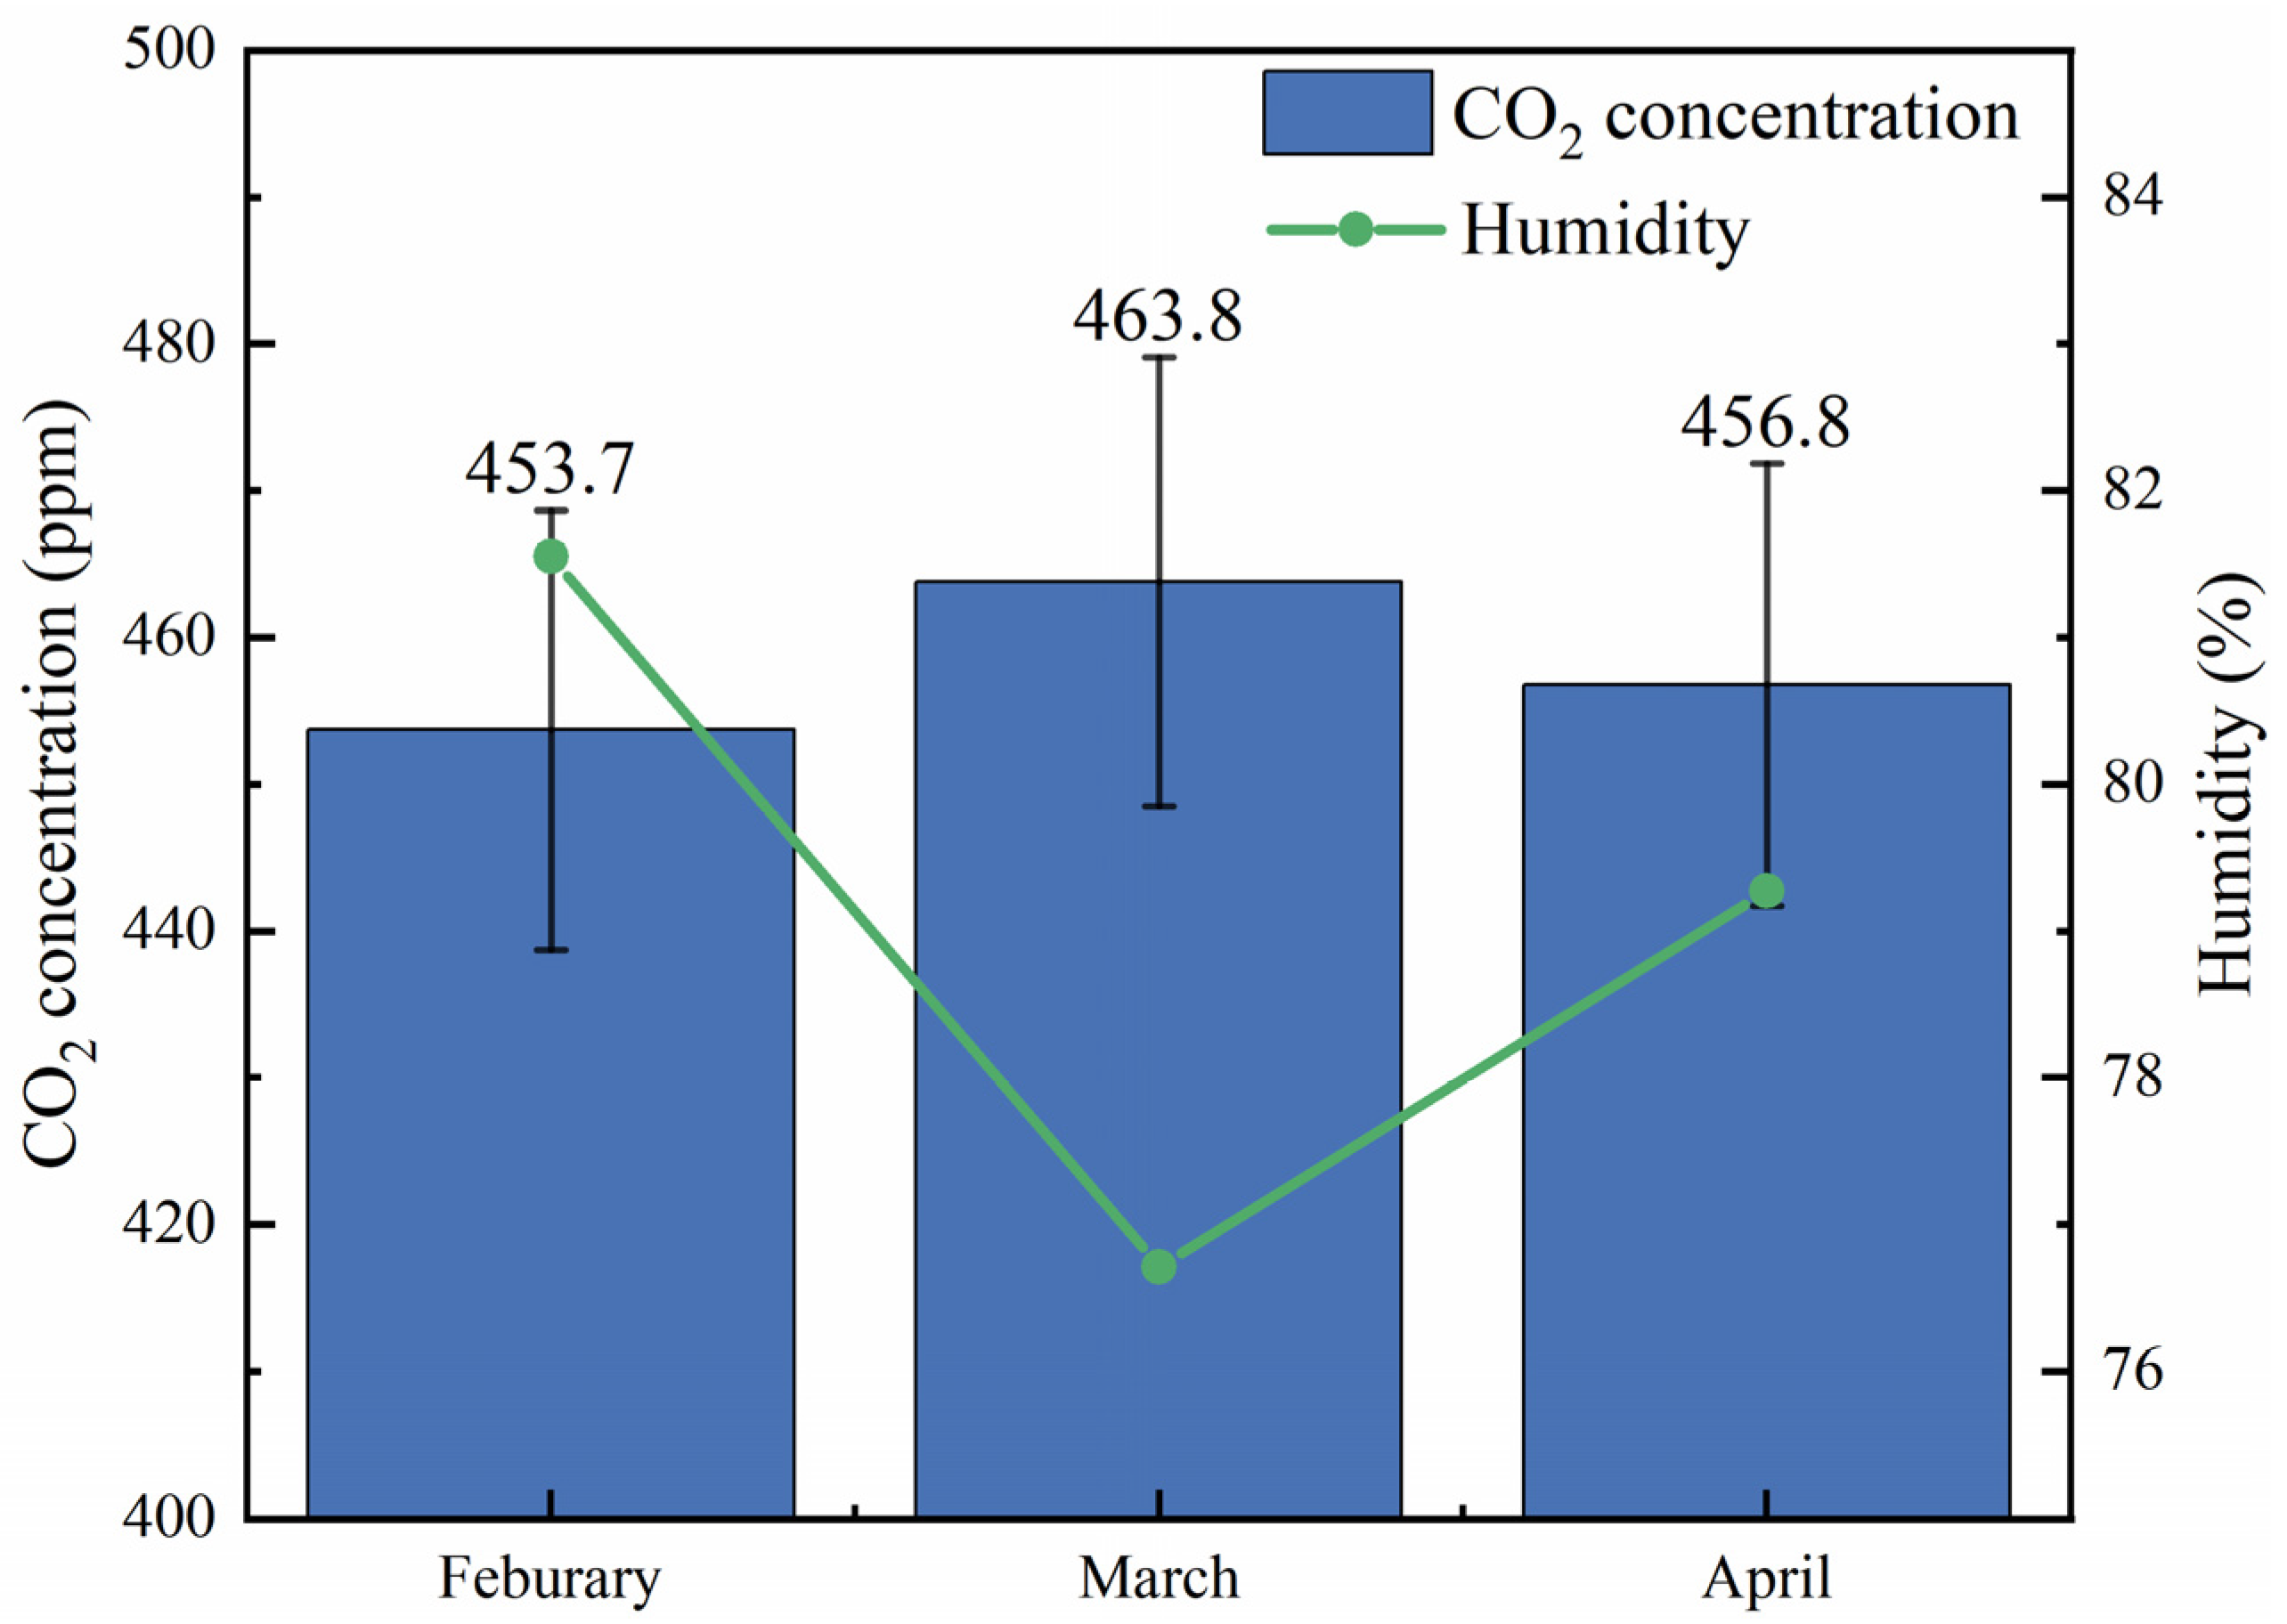
3.1.2. Monthly Variation of CO2 Concentrations in Nanning

The monthly average CO2 concentration in Nanning during the spring of 2024 reveals significant variations. February recorded the lowest monthly average concentration at 453.7 ppm, while March had the highest at 463.8 ppm, followed by April at 456.8 ppm, as shown in Figure 3. Nanning, located in south-central Guangxi, is characterized by a typical subtropical monsoon climate and a forest coverage rate of 43.81%, earning it the nickname “Green City” [23]. Vegetation growth in this region is minimally affected by temperature changes.
Weissert [24] pointed out that in urban areas, CO2 concentration variations are influenced by vegetation photosynthesis; however, even with extensive green spaces, CO2 concentration changes are primarily driven by human activities. February, coinciding with the Chinese New Year holiday, experienced significantly reduced traffic emissions, leading to the lowest CO2 concentration during this period.
In contrast, March saw a sharp increase in human activities as the holiday ended, and economic activities resumed. The resulting surge in traffic volume and associated emissions caused CO2 concentrations to peak [25]. By April, vegetation began to recover and actively photosynthesize, slightly lowering CO2 concentrations, although they remained at relatively high levels due to sustained urban activities [26].

3.2. Analysis of Influencing Factors

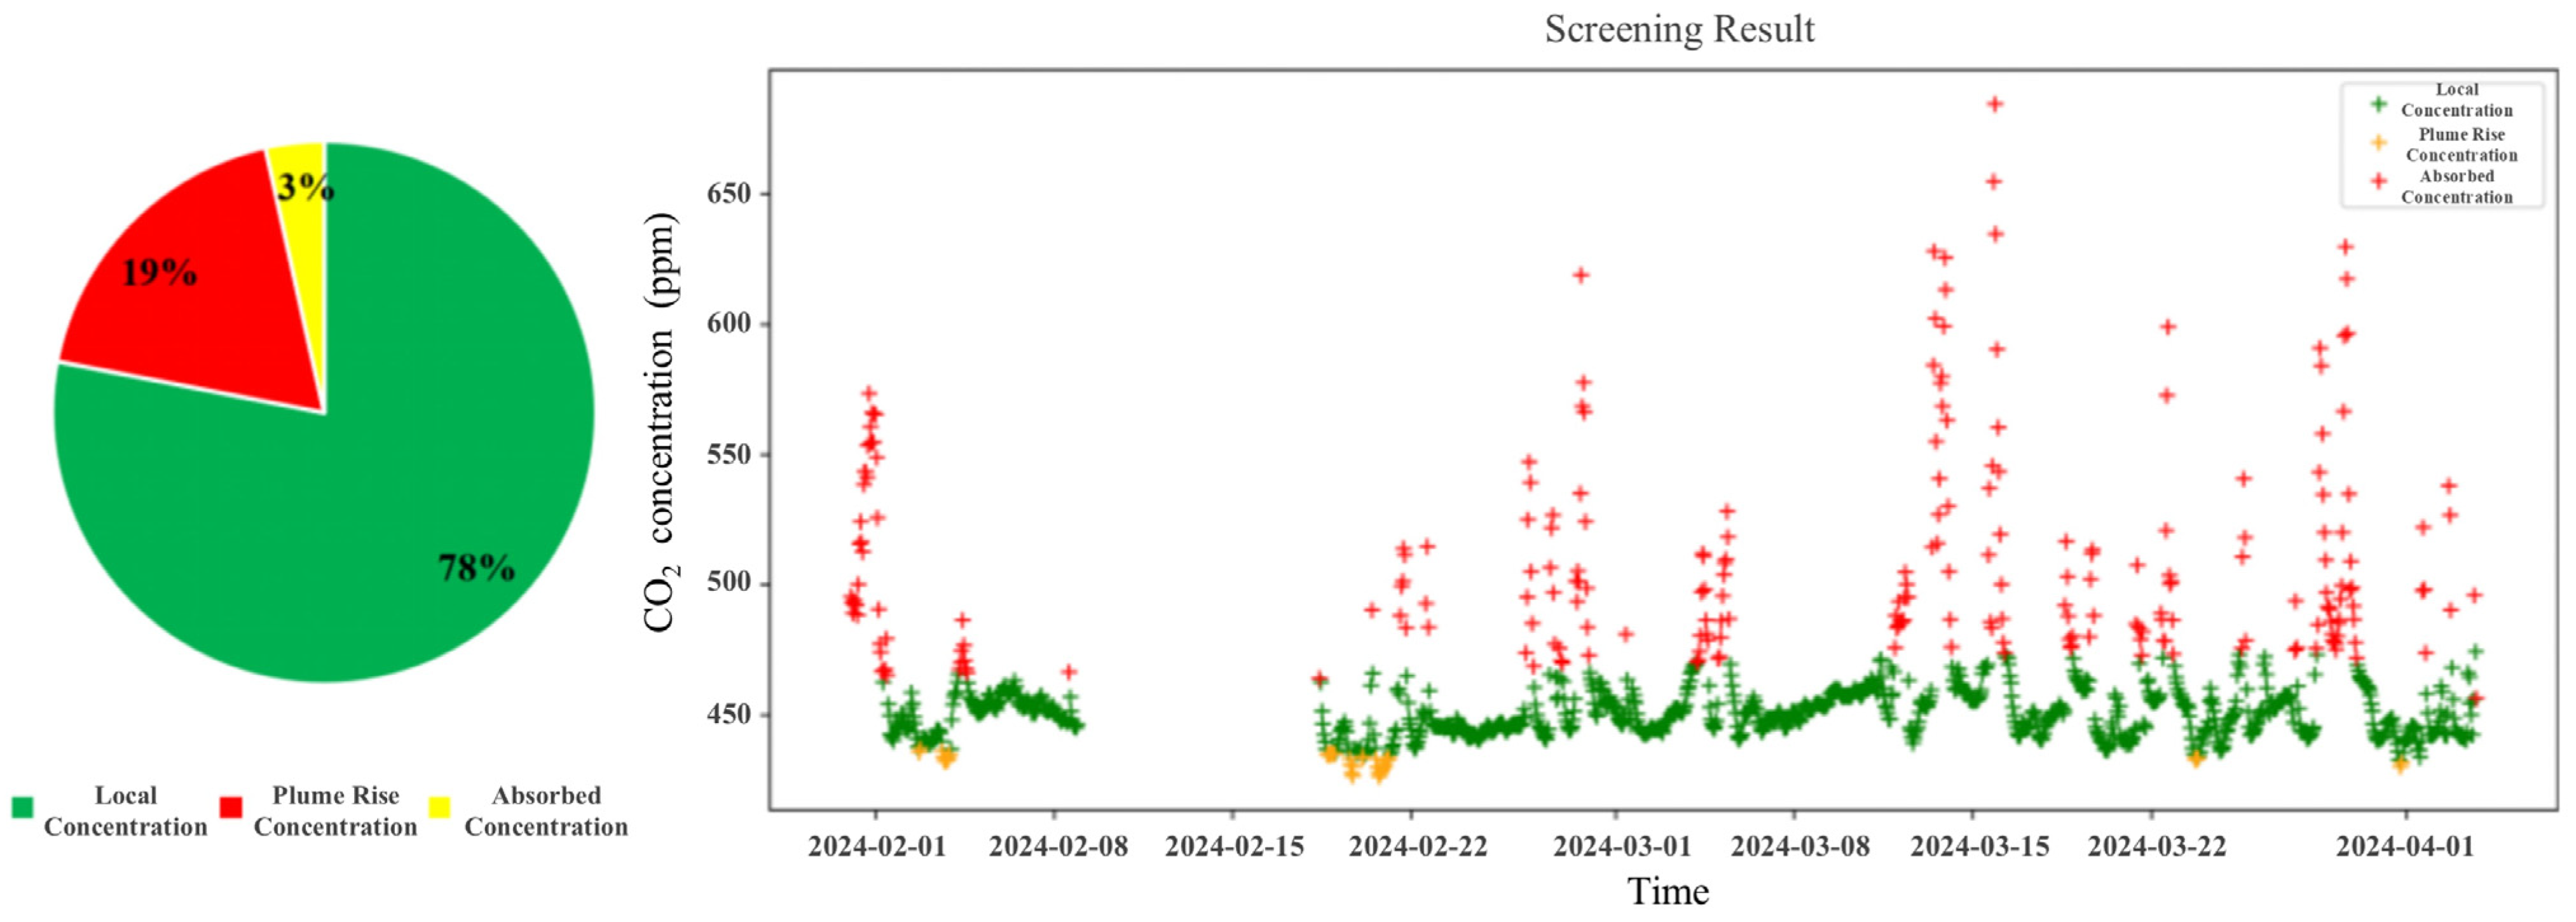
3.2.1. Screening Analysis of CO2 Concentrations

Using online monitoring data, reliable data were obtained through quality control methods such as time-series checks, the selection of stable data, and the removal of outliers. The background data were derived using the moving average filter (MAF) background screening method. The results, as shown in Figure 4, indicate that the proportions of CO2 background concentrations, sink-affected concentrations, and source-affected concentrations were 78%, 3%, and 19%, respectively. The source-affected concentration was 16% higher than the sink-affected concentration.
The findings reveal that CO2 background concentrations accounted for 78% of the total, suggesting that the majority of CO2 concentration variations during the observation period were attributable to natural background levels [27]. The sink-affected concentration was relatively small, at 3%. In contrast, the source-affected concentration (19%) was significantly higher than the sink-affected concentration, indicating that during the observation period, local emission sources (e.g., vehicular emissions) contributed more to atmospheric CO2 concentrations than local sinks (e.g., vegetation absorption and soil respiration). In Wuhan (2021 data), sink-affected concentrations reached 4.51% due to higher afforestation and cropland protection, underscoring the role of ecosystem-specific interventions [28].

3.2.2. Source Attribution of CO2 Concentrations via Back-Trajectory Simulation

Based on the background data screening results, time periods with source-affected CO2 concentrations were identified. These periods were predominantly concentrated between 14:00 and 18:00 in the afternoon, which coincides with peak hours for human activities such as transportation and industrial production, both of which generate significant CO2 emissions [29].
Using the Lagrangian Particle Dispersion Model (LPDM), a 3 h back-trajectory analysis was conducted for the time periods corresponding to source-affected concentrations. The air mass trajectories represent the probability distribution of air parcels transported through the atmosphere to the receptor site. The simulation results, as depicted in Figure 5 and Figure 6, indicate that the primary air mass sources affecting Nanning were from the north and south directions.
These findings suggest the presence of major transportation arteries or densely populated areas in the northern and southern regions, where emission activities significantly contribute to CO2 concentrations in Nanning’s atmosphere.

3.2.3. Meteorological Factor Correlation Analysis

(1)
Correlation Analysis Between CO2 and Wind Direction/Speed
As shown in Figure 7, based on the wind rose diagram for greenhouse gases in Nanning during the spring of 2024, the analysis indicates that high CO2 concentrations were primarily concentrated in the southeast direction. This distribution pattern is similar to the findings by Chen, Huang, and others, who observed that air pollution in Nanning exhibits a spatial distribution of higher pollution in the north, south, and east compared to the west [30,31]. This suggests the presence of significant emission sources in the southeast, such as the Jiangnan Industrial Park and the Liangqing Economic Development Zone, as well as traffic-intensive areas like Minzu Avenue, Zhuxi Avenue, and Baisha Avenue.
The analysis further shows that CO2 concentrations were higher when wind speeds were between 0 and 2 m/s. Under low wind speed conditions, air movement is slower, resulting in the accumulation of pollutants near the surface, which hampers their dispersion, thus increasing CO2 concentrations [32,33]. This suggests that local high emission sources, primarily from traffic, significantly influence CO2 concentration changes in Nanning, particularly under low wind speed and specific wind directions.
(2)
Correlation Analysis Between CO2 and Temperature/Humidity
A correlation analysis was conducted between hourly CO2 concentrations and hourly temperature and relative humidity data in Nanning during the spring of 2024. The results showed that during the day, CO2 concentrations were influenced not only by emissions and transport but also by vegetation absorption, leading to a weaker correlation with temperature and humidity. Thus, the analysis of nighttime correlations provides more valuable insights.
Figure 8 shows the relationship between CO2 concentrations and temperature and relative humidity during the nighttime (from 1:00 a.m. to 8:00 a.m.) in the spring of 2024. Using 460 ppm as the CO2 concentration threshold, the results indicate that when the temperature is between 15 °C and 25 °C, high CO2 concentrations tend to occur when relative humidity is between 70% and 100%. Specifically, when the temperature is between 15 °C and 20 °C and relative humidity exceeds 95%, CO2 concentrations are higher. Similarly, when the temperature is between 15 °C and 25 °C, CO2 concentrations peak at higher relative humidity levels (70–100%).
This suggests that within a certain temperature range, higher humidity levels contribute to increased CO2 concentrations in the atmosphere, possibly due to the increased water vapor content in the air. Water vapor itself can act as a greenhouse gas, affecting the absorption and release of CO2 [34]. Furthermore, at lower temperatures (15–20 °C), higher humidity levels (>95%) promote CO2 accumulation, likely due to increased atmospheric stability under high humidity, which reduces turbulent diffusion and leads to higher CO2 concentrations near the surface [35].

4. Conclusions

In the spring of 2024, the CO2 concentration in Nanning was measured at 460 ± 15 ppm. The daily variation in CO2 concentration exhibited a pattern of higher levels in the afternoon and lower levels in the early morning, with a generally bimodal structure. This indicates that CO2 concentrations in Nanning are strongly influenced by traffic-related emissions.
The monthly variation of CO2 concentrations in Nanning showed an initial increase followed by a decrease. CO2 concentrations rose in February and March, with April concentrations being lower than March but still higher than those in February. This suggests that CO2 concentrations in Nanning are influenced by both vegetation photosynthesis and urban human activities.
Background screening and back-trajectory simulations indicate that local emission sources, primarily from industrial and traffic activities in the north and south directions, contribute more significantly to CO2 concentrations in Nanning than local absorption sinks. These emissions are especially affected by low wind speeds from the southeast.
This study provides important insights into the sources and patterns of CO2 concentrations in an urban setting. It also offers practical implications for urban planning, air quality management, and public health. Future research should aim to expand the monitoring network, integrate more detailed meteorological data, and explore the effectiveness of mitigation measures for reducing traffic-related emissions.

Author Contributions

Conceptualization, J.F.; methodology, J.F. and H.L. (Huilin Liu); investigation, S.Y., H.L. (Hongjiao Li), H.L. (Hao Li), H.L. (Hui Liao) and J.L.; data curation, J.F.; writing—original draft preparation, J.F.; writing—review and editing, J.F., X.C., Z.M. and X.P.; visualization, Z.M., S.Y. and X.P.; supervision, X.C. and H.L. (Huilin Liu); project administration, X.C.; funding acquisition, X.C. and H.L. (Huilin Liu). All authors have read and agreed to the published version of the manuscript.

Funding

This research was funded by the Guangxi Natural Science Foundation (2022GXNSFBA035464), the Guangxi Science and Technology Program (AB24010248), and the Guangxi Academy of Environmental Sciences Scientific Research and Innovation Fund Program (HKY-HT-2023198).

Institutional Review Board Statement

Not applicable.

Informed Consent Statement

Not applicable.

Data Availability Statement

Data are contained within the article. The data presented in this study can be requested from the authors.

Conflicts of Interest

The authors declare no conflicts of interest.

References

  1. Wigley, T.M.L. The Kyoto Protocol: CO2 CH4 and climate implications. Geophys. Res. Lett. 1998, 25, 2285–2288. [Google Scholar] [CrossRef]
  2. Peters, G.P.; Marland, G.; Le Quéré, C.; Boden, T.; Canadell, J.G.; Raupach, M.R. Rapid growth in CO2 emissions after the 2008–2009 global financial crisis. Nat. Clim. Change 2012, 2, 2–4. [Google Scholar] [CrossRef]
  3. Jiang, H.; Yin, J.; Wei, D.; Luo, X.; Ding, Y.; Xia, R. Industrial carbon emission efficiency prediction and carbon emission reduction strategies based on multi-objective particle swarm optimization-backpropagation: A perspective from regional clustering. Sci. Total Environ. 2024, 906, 167692. [Google Scholar] [CrossRef] [PubMed]
  4. Li, L.; Lei, Y.; Wu, S.; He, C.; Chen, J.; Yan, D. Impacts of city size change and industrial structure change on CO2 emissions in Chinese cities. J. Clean. Prod. 2018, 195, 831–838. [Google Scholar] [CrossRef]
  5. Kordowski, K.; Kuttler, W. Carbon dioxide fluxes over an urban park area. Atmos. Environ. 2010, 44, 2722–2730. [Google Scholar] [CrossRef]
  6. Svirejeva-Hopkins, A.; Schellnhuber, H.J.; Pomaz, V.L. Urbanised territories as a specific component of the Global Carbon Cycle. Ecol. Model. 2004, 173, 295–312. [Google Scholar] [CrossRef]
  7. Nathan, B.; Lauvaux, T.; Turnbull, J.; Gurney, K. Investigations into the use of multi-species measurements for source apportionment of the Indianapolis fossil fuel CO2 signal. Elem. Sci. Anthr. 2018, 6, 21. [Google Scholar] [CrossRef]
  8. Lian, J.; Lauvaux, T.; Utard, H.; Bréon, F.M.; Broquet, G.; Ramonet, M.; Laurent, O.; Albarus, I.; Chariot, M.; Kotthaus, S.; et al. Can we use atmospheric CO2 measurements to verify emission trends reported by cities? Lessons from a 6-year atmospheric inversion over Paris. Atmos. Chem. Phys. 2023, 23, 8823–8835. [Google Scholar] [CrossRef]
  9. Lauvaux, T.; Gurney, K.R.; Miles, N.L.; Davis, K.J.; Richardson, S.J.; Deng, A.; Nathan, B.J.; Oda, T.; Wang, J.A.; Hutyra, L.; et al. Policy-Relevant Assessment of Urban CO2 Emissions. Environ. Sci. Technol. 2020, 54, 10237–10245. [Google Scholar] [CrossRef]
  10. Asimow, N.G.; Turner, A.J.; Cohen, R.C. Sustained Reductions of Bay Area CO2 Emissions 2018–2022. Environ. Sci. Technol. 2024, 58, 6586–6594. [Google Scholar] [CrossRef]
  11. Xuebin, S.; Le, H.; MIN, L. Time Series Variation of Ambient Air Carbon Dioxide Concentration in Shenyang City and Its Correlation With Meteorology. J. Green Sci. Technol. 2022, 24, 221–225. [Google Scholar]
  12. Glaeser, E.L.; Kahn, M.E. The greenness of cities: Carbon dioxide emissions and urban development. J. Urban Econ. 2010, 67, 404–418. [Google Scholar] [CrossRef]
  13. Imasu, R.; Tanabe, Y. Diurnal and Seasonal Variations of Carbon Dioxide (CO2) Concentration in Urban, Suburban, and Rural Areas around Tokyo. Atmosphere 2018, 9, 367. [Google Scholar] [CrossRef]
  14. Mallia, D.V.; Mitchell, L.E.; Gonzalez Vidal, A.E.; Wu, D.; Kunik, L.; Lin, J.C. Can We Detect Urban-Scale CO2 Emission Changes Within Medium-Sized Cities? J. Geophys. Res. Atmos. 2023, 128, e2023JD038686. [Google Scholar] [CrossRef]
  15. Yinchao, C.; Wei, H.; Wenke, G.; Bingqiang, F.; Xiaohua, M.; Yaling, D. Space Distribution Characteristics of Near-surface CO2: Concentration in Summer of Urumqi. Environ. Sci. Technol. 2018, 41, 22–27. [Google Scholar] [CrossRef]
  16. Chang, G.; Fang, C.; Feng, X.; Changliu, W.; Yuxian, Z.; Hanyu, L.; Yanlin, Z. Characteristics of atmospheric CO2 concentration and stable carbon isotopic composition in Nanjing in summer: Effects of anthropogenic emission changes. Trans. Atmos. Sci. 2024, 1–18. [Google Scholar] [CrossRef]
  17. Fang, S.; Du, R.; Qi, B.; Ma, Q.; Zhang, G.; Chen, B.; Li, J. Variation of carbon dioxide mole fraction at a typical urban area in the Yangtze River Delta, China. Atmos. Res. 2022, 265, 105884. [Google Scholar] [CrossRef]
  18. Ningzhang, W.; Ming, L.; Wenzhao, L.; Jianqiong, W.; Baoxin, L.; Lei, R. Variation Characteristics of CO2, and CH4 Concentrations in Waliguan Area in 2019 and Potential Source Analysis. Adv. Meteorol. Sci. Technol. 2023, 13, 17–23. [Google Scholar]
  19. Yuting, P.; Honghui, X.; Meng, S.; Jingjiao, P.; Yilei, D. Background characteristics and source analysis of CO2 concentration in the Yangtze River Delta. Acta Sci. Circumstantiae 2023, 43, 340–353. [Google Scholar] [CrossRef]
  20. Hong, W.; Ma, T.; Guo, R.; Yang, X.; Li, X.; Sun, M.; Chen, Y.; Zhong, Y. Carbon emission characteristics of urban trip based on multi-layer network modeling. Appl. Geogr. 2023, 159, 103091. [Google Scholar] [CrossRef]
  21. Wen, H.; Huizhi, L.; Feng, J.W. Characteristics of turbulent fluxes and carbon dioxide flux over urban surface layer. Clim. Environ. Res. 2010, 15, 21–33. [Google Scholar]
  22. Helfter, C.; Tremper, A.H.; Halios, C.H.; Kotthaus, S.; Bjorkegren, A.; Grimmond, C.S.B.; Barlow, J.F.; Nemitz, E. Spatial and temporal variability of urban fluxes of methane, carbon monoxide and carbon dioxide above London, UK. Atmos. Chem. Phys. 2016, 16, 10543–10557. [Google Scholar] [CrossRef]
  23. Yanhong, J.; Xiaoqian, S.; Heran, L. Characteristic analysis of climate change in Nanning from 1991 to 2020. J. Guangxi Norm. Univ. 2023, 41, 190–200. [Google Scholar] [CrossRef]
  24. Weissert, L.F.; Salmond, J.A.; Turnbull, J.C.; Schwendenmann, L. Temporal variability in the sources and fluxes of CO2 in a residential area in an evergreen subtropical city. Atmos. Environ. 2016, 143, 164–176. [Google Scholar] [CrossRef]
  25. Park, C.; Jeong, S.; Park, H.; Sim, S.; Hong, J.; Oh, E. Comprehensive assessment of vertical variations in urban atmospheric CO2 concentrations by using tall tower measurement and an atmospheric transport model. Urban Clim. 2022, 45, 101283. [Google Scholar] [CrossRef]
  26. Bezyk, Y.; Górka, M.; Sówka, I.; Nęcki, J.; Strąpoć, D. Temporal dynamics and controlling factors of CO2 and CH4 variability in the urban atmosphere of Wroclaw, Poland. Sci. Total Environ. 2023, 893, 164771. [Google Scholar] [CrossRef]
  27. Pu, J.-J.; Xu, H.-H.; He, J.; Fang, S.-X.; Zhou, L.-X. Estimation of regional background concentration of CO2 at Lin’an Station in Yangtze River Delta, China. Atmos. Environ. 2014, 94, 402–408. [Google Scholar] [CrossRef]
  28. Zhang, J.; Zhang, C.; Dong, H.; Zhang, L.; He, S. Spatial–Temporal Change Analysis and Multi-Scenario Simulation Prediction of Land-Use Carbon Emissions in the Wuhan Urban Agglomeration, China. Sustainability 2023, 15, 11021. [Google Scholar] [CrossRef]
  29. Gratani, L.; Varone, L. Daily and seasonal variation of CO2 in the city of Rome in relationship with the traffic volume. Atmos. Environ. 2005, 39, 2619–2624. [Google Scholar] [CrossRef]
  30. Yuanlai, H. Analysis of Spatiotemporal Changes in Environmental Air Quality in Nanning Urban Area From 2018 to 2022. J. Green Sci. Technol. 2023, 25, 139–143. (In Chinese) [Google Scholar] [CrossRef]
  31. Ping, C.; Xinying, Z.; Lisong, T.; Niyu, W.; Yufeng, W.; Benhao, Z. Tempo-spatial Distribution of Air Pollution Index of Nanning City. J. Guangxi Teach. Educ. Univ. Nat. Sci. Ed. 2016, 33, 66–72. (In Chinese) [Google Scholar] [CrossRef]
  32. Büns, C.; Kuttler, W. Path-integrated measurements of carbon dioxide in the urban canopy layer. Atmos. Environ. 2012, 46, 237–247. [Google Scholar] [CrossRef]
  33. Zhang, L.; Zhang, H.; Li, Q.; Wu, B.; Cai, X.; Song, Y.; Zhang, X. Complexity of carbon dioxide flux in urban areas: A comparison with natural surfaces. Sci. Total Environ. 2023, 895, 165115. [Google Scholar] [CrossRef] [PubMed]
  34. García, A.G.; Di Bella, C.M.; Houspanossian, J.; Magliano, P.N.; Jobbágy, E.G.; Posse, G.; Fernández, R.J.; Nosetto, M.D. Patterns and controls of carbon dioxide and water vapor fluxes in a dry forest of central Argentina. Agric. For. Meteorol. 2017, 247, 520–532. [Google Scholar] [CrossRef]
  35. Chen, L.; Xiao, W.; Yang, F.; Shan, M.; Wang, J.; Hu, N.; Li, R.; Cheng, K. Vertical variations of CO2/CH4 in winter based on observations at high-rise buildings in Shanghai. China Environ. Sci. 2024, 44, 4155–4166. [Google Scholar] [CrossRef]
Figure 1. Spatial distribution map of the greenhouse gas monitoring station at the Scientific Research Academy of Guangxi Environmental Protection.
Atmosphere 16 00449 g001
Figure 2. Diurnal variation of CO2 concentrations in Nanning during spring 2024.
Atmosphere 16 00449 g002
Figure 3. Monthly average CO2 concentration and humidity in Nanning during spring 2024.
Atmosphere 16 00449 g003
Figure 4. Concentration screening results for background values at monitoring sites.
Atmosphere 16 00449 g004
Figure 5. Frequency distribution of source-affected moments.
Atmosphere 16 00449 g005
Figure 6. LPDM air mass trajectory traceability map.
Atmosphere 16 00449 g006
Figure 7. Distribution of wind direction, wind speed, and CO2 concentration in Nanning City in spring 2024.
Atmosphere 16 00449 g007
Figure 8. Correlation of CO2 concentration with hourly values of air temperature and relative humidity.
Atmosphere 16 00449 g008
Disclaimer/Publisher’s Note: The statements, opinions and data contained in all publications are solely those of the individual author(s) and contributor(s) and not of MDPI and/or the editor(s). MDPI and/or the editor(s) disclaim responsibility for any injury to people or property resulting from any ideas, methods, instructions or products referred to in the content.

