Article

Research on the Mechanism and Source Changes of Urban O3 Formation Under the Background of Increased Industrial Activity Levels

1
MOE Key Laboratory of Resources and Environmental System Optimization, College of Environmental Science and Engineering, North China Electric Power University, Beijing 102206, China
2
Flight College, Shandong University of Aeronautics, Binzhou 256600, China
3
Jincheng Ecology and Environment Bureau, Jincheng 048000, China
*
Author to whom correspondence should be addressed.
Atmosphere 2025, 16(4), 432; https://doi.org/10.3390/atmos16040432
Submission received: 13 March 2025 / Revised: 30 March 2025 / Accepted: 3 April 2025 / Published: 8 April 2025
(This article belongs to the Section Air Quality)

Abstract

:
The increase in industrial production can lead to more complex emissions of O3 precursors, but the changes in the formation mechanism and source of O3 are still unclear. Taking Jincheng as the typical industrial city, an observation-based model (OBM) is explored to analyze the changes in O3 formation in 2022 and 2024. The results indicated that the concentration of NOx and VOCs in 2024 increased by 21.1% and 22.3%, respectively. And the concentrations of alkenes related to industrial processes increased significantly. RO2+NO is the main pathway for O3 formation (51.5~54.2%), while VOCs+OH· contributes most to the formation of RO2. VOC and NOx both play important roles in O3 formation, and the sensitivity of VOCs increased from 0.76 to 0.84 in 2022 and 2024, with alkenes increasing the most. Industrial processes and coal combustion are the important sources for O3 and its precursors, and the contribution of the industrial process increased significantly during 2022 and 2024. In summary, the increase in the industrial activity level has led to the increase in alkenes, which has a key impact on the formation of O3. Controlling the emission of alkene from the industrial process is the direction for the continuous control of O3 pollution in industrial cities.

1. Introduction

O3 is an important pollutant in the atmosphere, and the atmospheric O3 pollution has been more severe in recent years [1,2,3]. O3 is mainly generated by the reaction of precursors (VOCs and NOx) under light conditions [4,5], but there is a complex nonlinear relationship between the precursors and O3 [6,7,8]. The precursor sources of O3 generation in atmospheric environments are complex, among which VOCs come from vehicle emissions, industrial processes, fossil fuel volatilization, and solvent utilization, and NOx come from the emissions of vehicles, coal combustion, and heavy industries such as cement, iron and steel, and chemicals [9,10]. This study shows that industrial sources account for a relatively large proportion of VOCs emissions (30~80%) [11,12,13,14]. The complexity of industrial process emissions increases the difficulty of urban atmospheric O3 pollution control. The industrial production in China has risen in recent years, and the increase in the level of industrial activities has led to a change in the situation of precursors emissions. As the pollution source that contributes greatly to O3 formation, the influence of industrial processes on the mechanism and sensitivity of O3 formation is still unclear within the background of the change in the precursor emission situation. Therefore, it is of great significance to study the changing trend of precursors and their influence on the O3 formation process and O3 sources under the background of the increase in industrial production. This is an important scientific basis for industrial cities to adjust control measures in a timely manner and reduce atmospheric O3 pollution.
The current methods used to simulate atmospheric photochemical reaction mechanisms mainly include the air quality model system based on emission inventories and box models based on observed data. The air quality model system could be used to study the reaction mechanism and the source of pollutants. However, due to the uncertainty of the emission inventory, the simulation results in a lack of accuracy [15,16]. The box model focuses on simulating the local chemical formation process, including detailed chemical reactions, and can objectively reflect the actual atmospheric photochemical reaction characteristics in the local area [17,18]. There is a researcher who used the box model to analyze the important role of VOCs species and free radicals in the formation of O3 [19]. Zhang used the box model to analyze the O3 control scenarios, and the results showed that the ratio of VOCs/NOx should be no less than 0.72 to effectively control O3 [20]. Box models are often coupled with ozone formation potential (OFP) or receptor models for O3 source apportionment. The OFP is calculated based on ideal state parameters, and the results may deviate relatively from reality [21,22]. The box model coupled with the receptor model is based on the analysis of observed concentrations, which is more consistent with actual pollution source results. Lyu used this method to conclude that vehicle exhaust gas sources (27.8%) and coal combustion sources (21.8%) were the main contributors to O3 generation in Wuhan [23]. Li’s research results show that industrial processes (29%), vehicle emissions (27%), and coal combustion (24%) are the main contributing sources of O3 formation in Changzhi [24]. Therefore, the box model coupled with the receptor model approach was chosen in this study to explore the changes in the urban atmospheric O3 formation and source contributions within the background of increasing industrial production.
Jincheng is a typical industrial city with coal resources. In June 2022, the raw coal production was 13.924 million tons, the steel production was 851,000 tons, the pig iron production was 418,000 tons, and the cement production was 321,000 tons. With the increase in the industrial activity level, the industrial products in 2024 have significantly increased. The production of raw coal, steel, pig iron, and cement in June 2024 were 14.35 million tons, 1.159 million tons, 470,000 tons, and 332,000 tons, respectively [25]. However, the mechanism of O3 pollution caused by changes in industrial production is not clear. In this study, the observed concentrations of VOCs during the summer O3 pollution episodes in 2022 and 2024 were collected. An OBM was employed to analyze the atmospheric O3 formation, free radical reaction processes, and sensitive precursors in Jincheng. Additionally, the coupling of the OBM with positive matrix factorization (PMF) was used to identify the sources of O3 and compare the mechanisms of atmospheric O3 chemical formation before and after the increase in industrial production. The aim of this study is to provide a more accurate and effective basis for the prevention and control of air pollution in Jincheng.

2. Materials and Methods

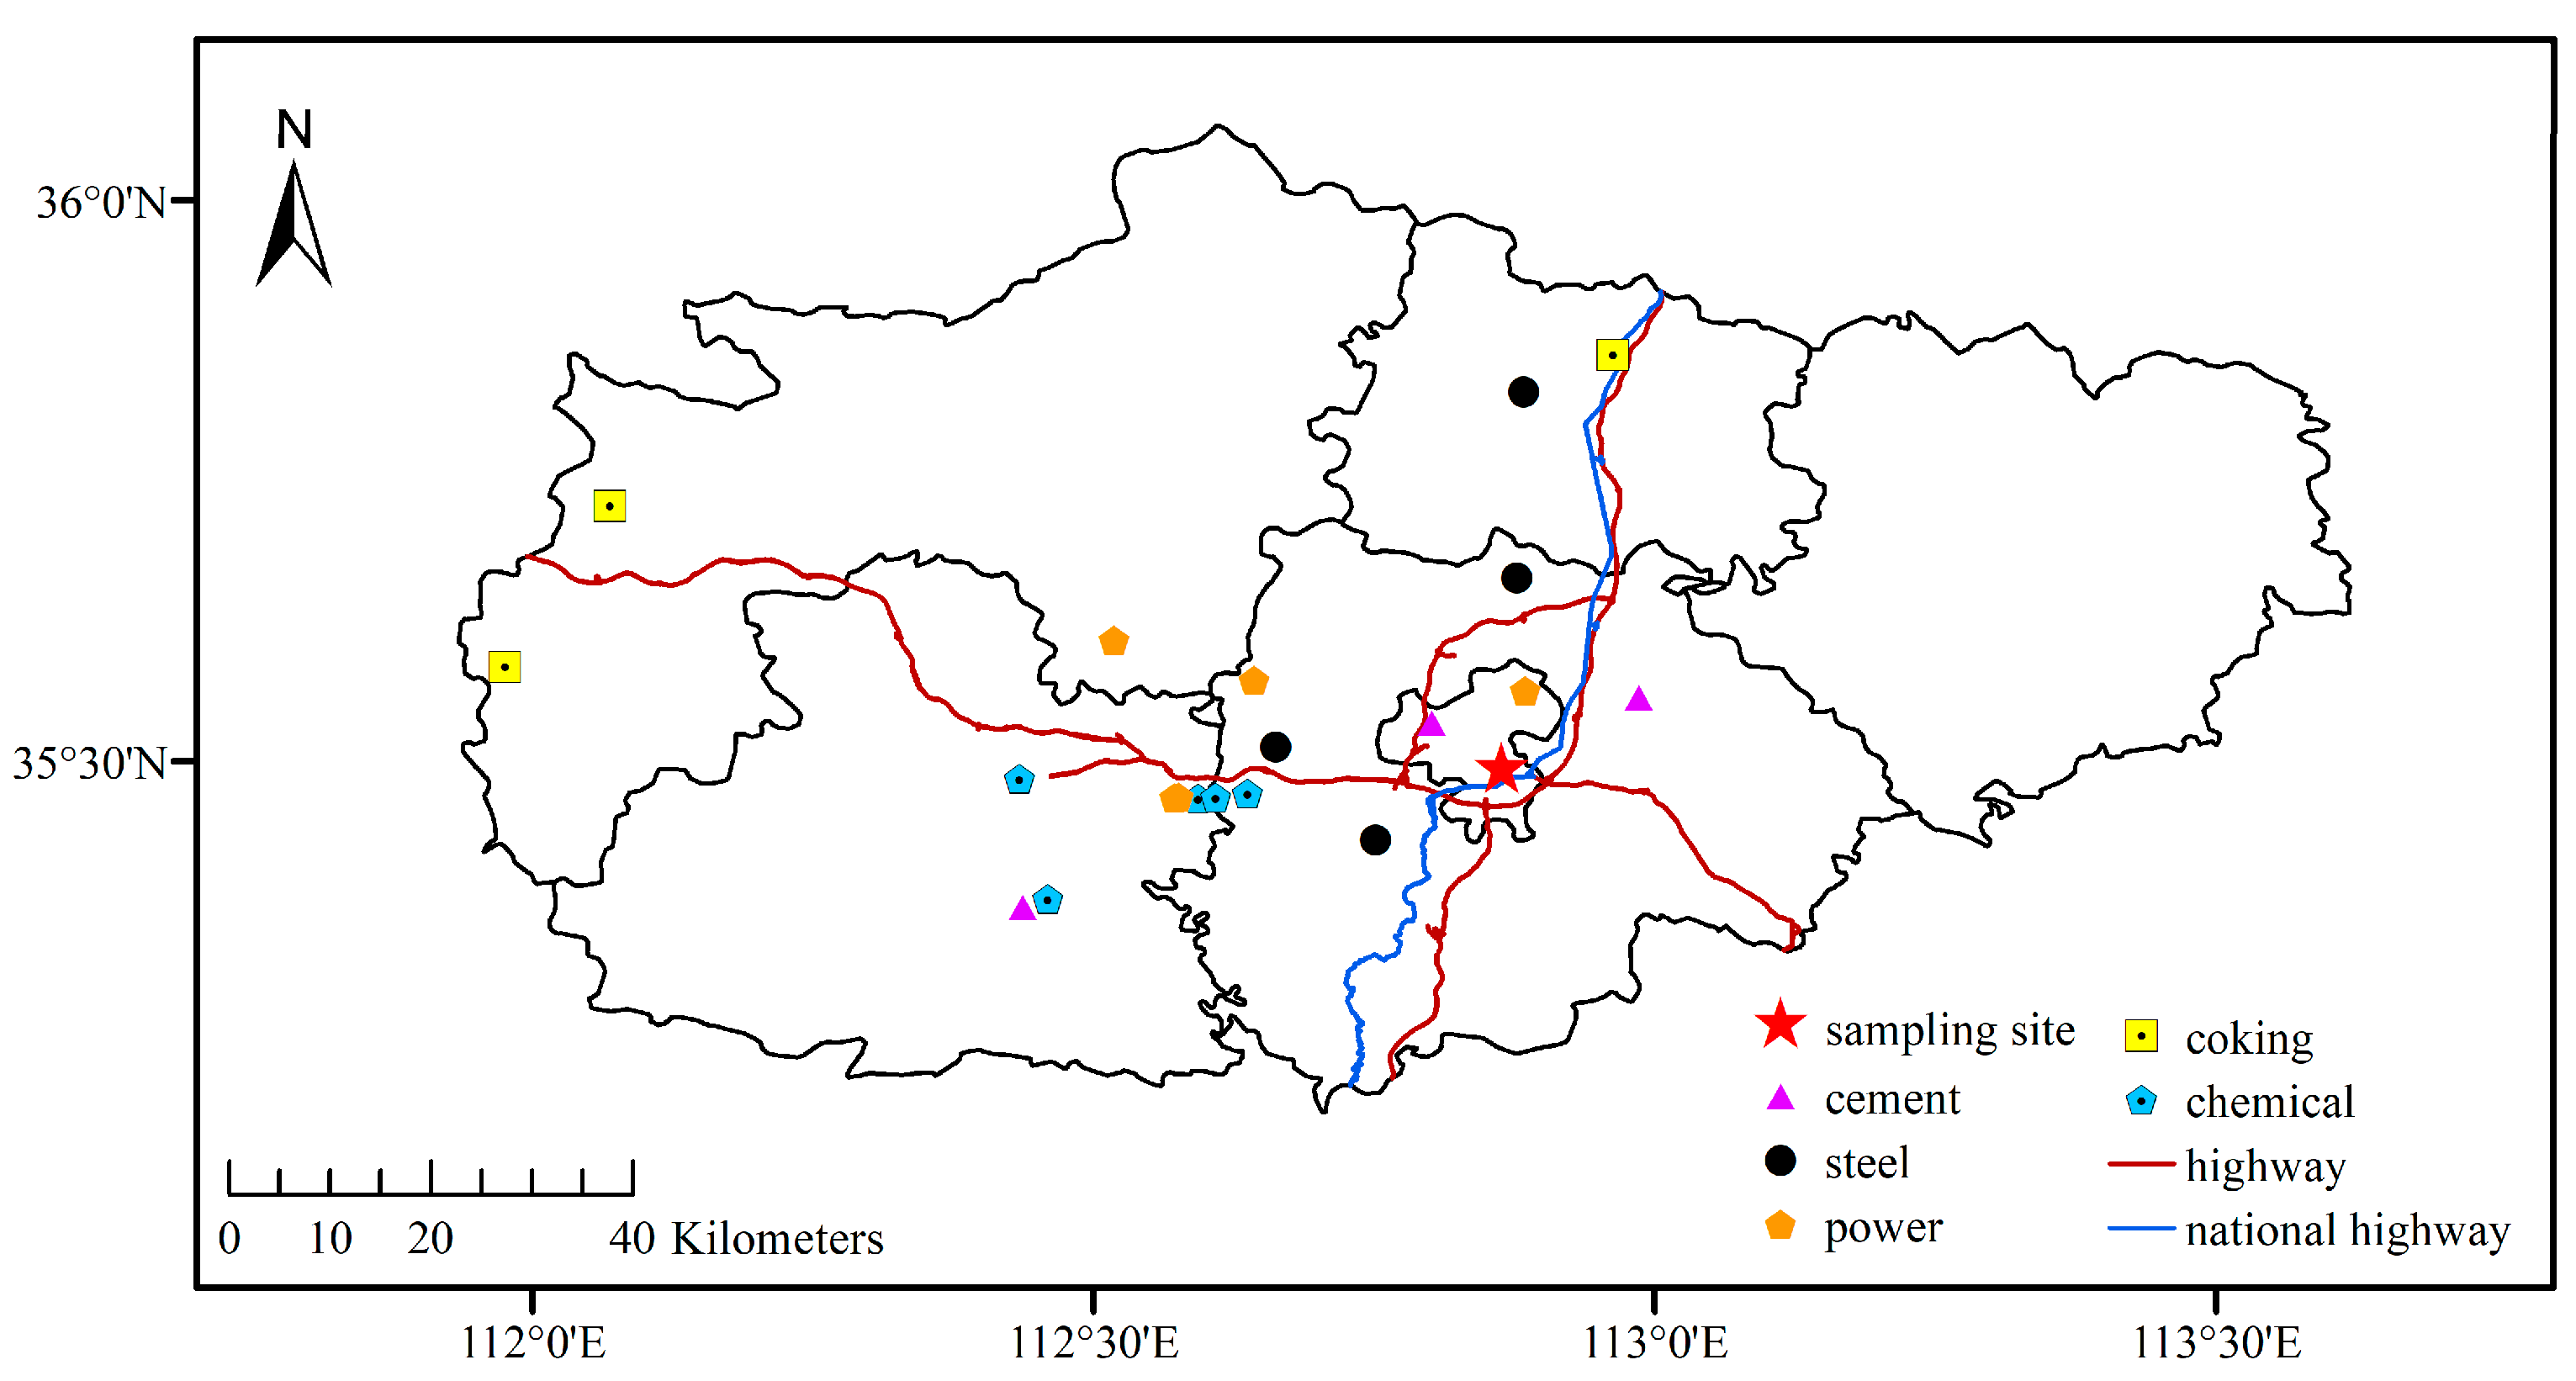
2.1. Sample Collection and Quality Control

The sampling site (Figure 1), located on the rooftop of the Environmental Monitoring Station of Jincheng, is adjacent to major transportation arteries and is surrounded by densely populated residential and commercial areas. This location can better reflect the characteristics of the urban air quality. According to the industrial production data, the production amounts of steel, pig iron, and crude steel in June 2024 increased by 36.2%, 20.3%, and 12.7% compared with those of June 2022. In order to better compare the changes in O3 formation mechanisms caused by changes in industrial production, the typical O3 pollution episode in June 2022 (from 12 June 2022 to 30 June 2022, OE1) was selected as the research period before the increase in industrial production, and the typical O3 pollution episode in June 2024 (from 8 June 2024 to 16 June 2024, OE2) was selected as the research period after the increase in industrial production. We collected the VOC concentrations during these two O3 pollution episodes and synchronously recorded meteorological parameters, such as the temperature (T), relative humidity (RH), and atmospheric pressure (P).
VOCs data were analyzed using an online gas chromatograph–mass spectrometer/flame ionization detector (GC-MS/FID, EXPEC 2000), which can continuously monitor over 100 VOCs with a 1-h time resolution, including PAMS, OVOCs, Haloalkane, etc. The system is mainly composed of a low-temperature preconcentration device and a GC-MS instrument. Firstly, the collected air samples were enriched in the preconcentrator with a three-stage cold hydrazine concentrator, which is used to remove impurities such as H2O, NO2, and CO2 from the samples. Subsequently, the samples were desorbed in the high-temperature environment of the thermal desorber [26,27]. After high-temperature thermal desorption, the samples entered the chromatographic separation section. C2–C5 VOCs were separated on the Plot (50 m × 0.32 mm × 8 μm) column and analyzed by the FID. Other VOCs species were separated on the DB-1 column (30 m × 0.25 mm × 1 μm) and analyzed by MS [28]. Finally, the concentration data of different species are obtained [29,30,31]. The sampling system adopts strict quality assurance and quality control procedures during the analysis process, meeting the requirements of the Specifications and Test Procedures for Ambient Air Quality Continuous Monitoring System with Gas Chromatography for Volatile Organic Compounds (HJ 1010-2018).

2.2. PMF

PMF is a multivariate statistical method for identifying and quantifying the sources of species based on the long time series of receptor site species component data [32], which has been widely applied to the source apportionment of VOCs in the atmosphere. The basic principle of the model is to use the weights to calculate the error of each volatile component in the sample, and to determine the main emission factors and their contributions by the least squares method [33]. The PMF model requires the input of pollutant concentration and uncertainty (U) data. If the species concentration is below the method detection limit (MDL), the 1/2 MDL is used as the input parameter for the species concentration, and the 5/6 MDL is the U [34]. If the species concentration is higher than the MDL, the corresponding U is calculated using the following equation:
U = ( E · c ) 2 + MDL 2 ,
where E is the error ratio; c is the concentration of the species involved in the PMF model.

2.3. OBM

The OBM is an observation-based chemical box model, which is widely used in atmospheric chemistry observation and simulation studies [35,36,37]. In this study, the OBM with a master chemical mechanism (MCM) was used to simulate the chemical processes in the atmosphere of Jincheng. Observed concentrations of pollutants (O3, NO2, CO, and VOCs), meteorological parameters (T, RH, and P), and photolysis rates were input into the model to calculate the production rates and loss rates of O3 and to assess the sensitivity of the O3 formation. The MCM (https://mcm.york.ac.uk/MCM; accessed on: 14 October 2024) provides a detailed chemical description of the atmospheric chemistry of 143 VOCs from emission to decomposition, containing 17,000 inorganic and organic reactions of about 6700 species, which can objectively reflect the actual atmospheric pollution conditions and the relationship between O3 and its precursors [38].

2.3.1. O3 Production Simulation

The O3 production rate P(O3) and the loss rate L(O3) were calculated from the results of the OBM simulation, and P(O3) can be quantified by the rate at which peroxyl radicals oxidize NO to NO2 [39], which is calculated as follows:
P O 3 = K HO 2 + NO HO 2 NO + K RO 2 + NO RO 2 NO ,
where [HO2] and [RO2] are the concentrations of HO2 and RO2 radicals, respectively. K HO 2 + NO and K RO 2 + NO are the reaction rates between the radicals and NO.
The L(O3) was calculated from the reaction of O3 photolysis reaction product O1D with H2O, the reaction between OH and NO2, and the reaction of O3 with OH, HO2, and alkenes, respectively.
L O 3 = K O 3 + OH O 3 OH + K O 3 + HO 2 O 3 HO 2 + K O 3 + alkenes O 3 alkenes + K NO 2 + OH NO 2 OH + K O 1 D + H 2 O O 1 D H 2 O ,
Finally, Net(O3) is the net O3 production rate calculated from the difference between P(O3) and L(O3).
Net O 3 = P O 3     L O 3

2.3.2. RIR

Relative incremental reactivity (RIR) can quantitatively evaluate the impact of precursors on O3 formation [18]. And in this study, the RIR was calculated based on the OBM to determine the sensitivity of different precursors to O3 formation. The RIR values of different O3 precursor fractions were calculated assuming 20% emission reduction, and the RIR was calculated as:
RIR = [ Net X     Net X     Δ X ] / Net X Δ S ( X ) / S ( X ) ,
where Net(X) is the net production rate of group X; Net(X − ΔX) is the net production rate after a change in emissions by ΔX; S(X) is the observed concentration of X; and ΔS(X) is the change in the observed concentration of X caused by the reduction. When the RIR is positive, it means that reducing X can lead to a decrease in O3, and the larger the value, the more effective the cuts are in controlling O3; when the RIR is negative, it means that reducing X will lead to an increase rather than a decrease in O3.
The formula for calculating the average RIR value for each source [40] is as follows:
RIR _ = 1 n [ RIR X × Net O 3 ] 1 n Net O 3 ,
contribution X = RIR _ ( X ) × con ( X ) 1 m [ RIR _ ( X ) × con ( X ) ]
where con(X) is the average concentration of source X originating from the PMF and m is the number of VOCs emission sources resolved by the PMF.

3. Results and Discussion

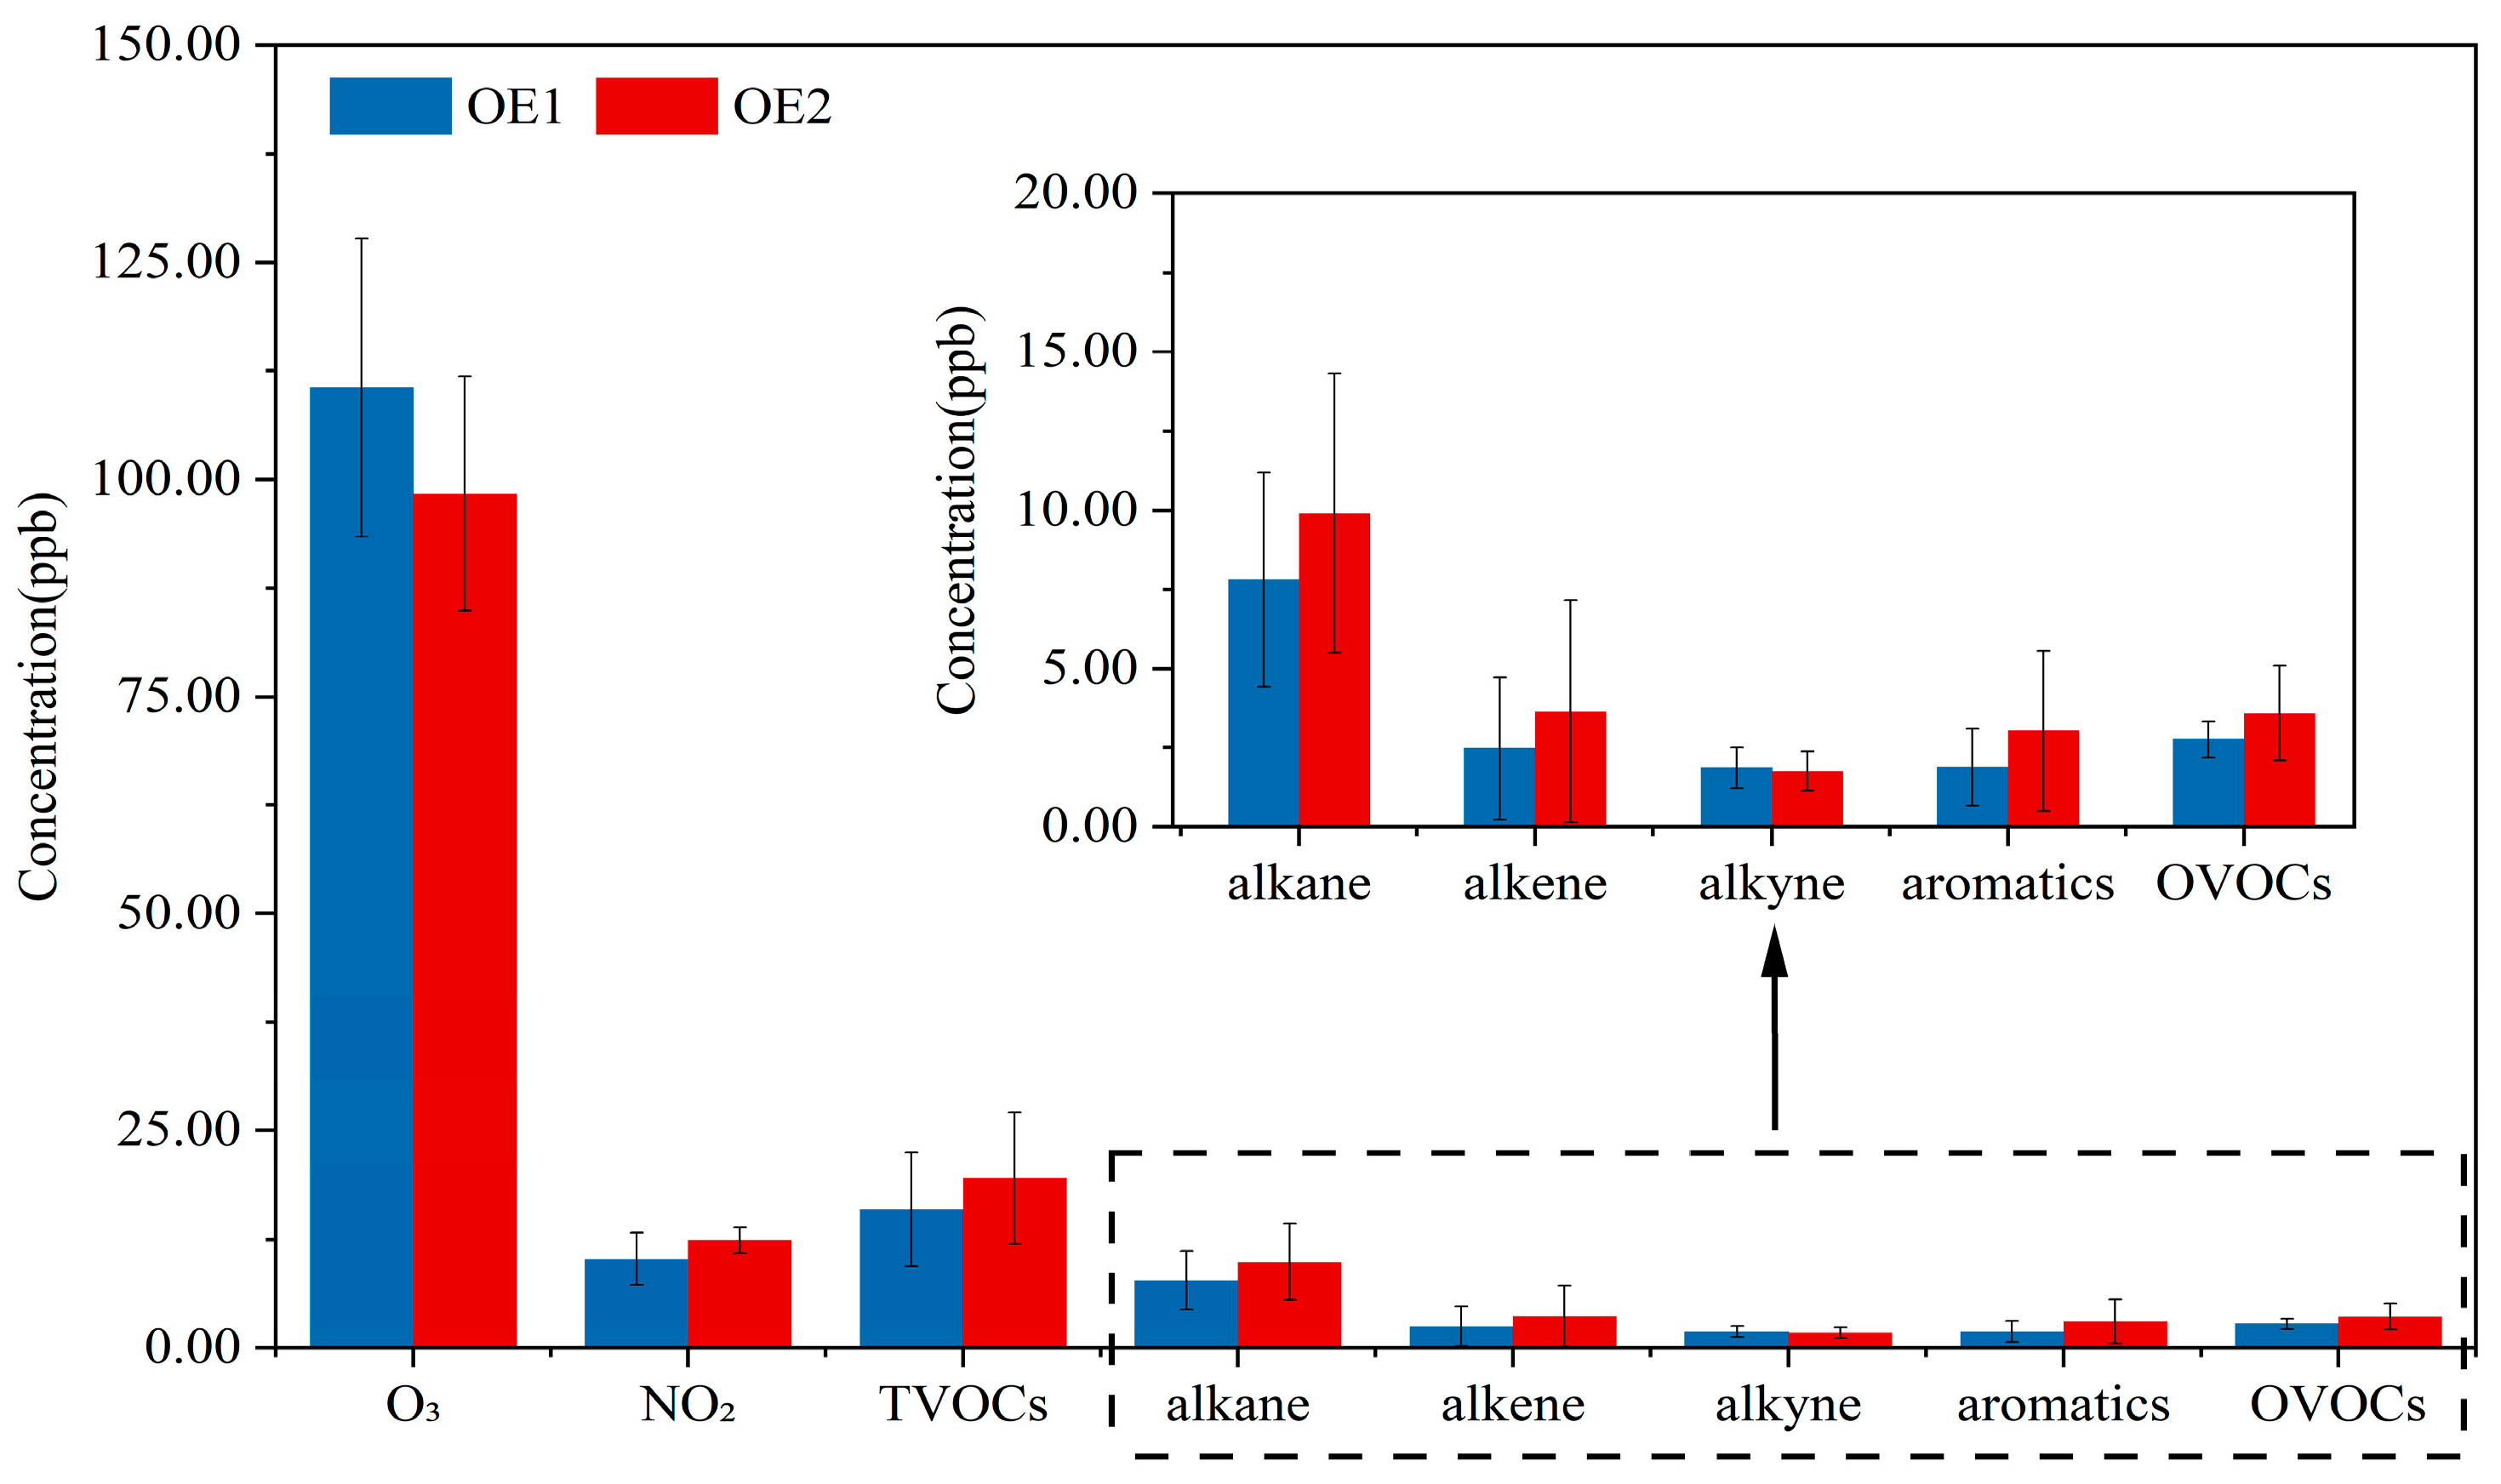
3.1. Characteristics of O3 and Its Precursors

Through the analysis of the continuous sampling data in Jincheng during the summer, it was found that the data quality during the periods of OE1 and OE2 was relatively good. We sorted the daily maximum concentration of O3-8H during the research period from small to large and took the value at the 90th percentile as the concentration of the 90th percentile of O3 (O3-8H90%). The O3-8H90% concentrations were 111 ppb and 98 ppb during OE1 and OE2, which can reflect the highest O3 pollution levels throughout the years 2022 and 2024 in Jincheng. Therefore, OE1 and OE2 were selected as representatives of the typical O3 pollution episodes in Jincheng. Figure 2 shows the comparison of O3 and its precursor concentrations during the observation period. Overall, the concentrations of NO2 and VOCs components have increased from OE1 to OE2. The average concentration of NO2 in OE2 (12.44 ± 1.48 ppb) during the period of increased industrial production is slightly higher than that in OE1 (10.28 ± 3.04 ppb). The average concentrations of TVOCs in Jincheng in OE1 and OE2 were 15.98 ± 6.52 ppb and 19.55 ± 7.54 ppb, which were lower than the concentrations of TVOCs in megacities, such as Nanjing [41], Zhengzhou [42], and Guangzhou [43], and slightly higher than those in the industrial areas of cities such as Linfen [44], Dalian [45], and Tianjin [46].
From the perspective of VOCs components, the concentrations of alkanes, alkenes, aromatics, and OVOCs in OE2 have all increased. The species with the largest concentration difference is propane (0.92 ppb). The emissions of aromatics and alkenes, such as m/p-xylene, acetaldehyde, cis-2-pentene, toluene, 1-hexene, and propylene, have increased in the context of the increased industrial production. Propane and propylene often come from combustion processes in industrial production [47], while m/p-xylene, acetaldehyde, cis-2-pentene, and 1-hexene are the main emission species in coal chemical, steel, and coking industries [48,49,50].

3.2. Simulation of Atmospheric Photochemical Reaction Process

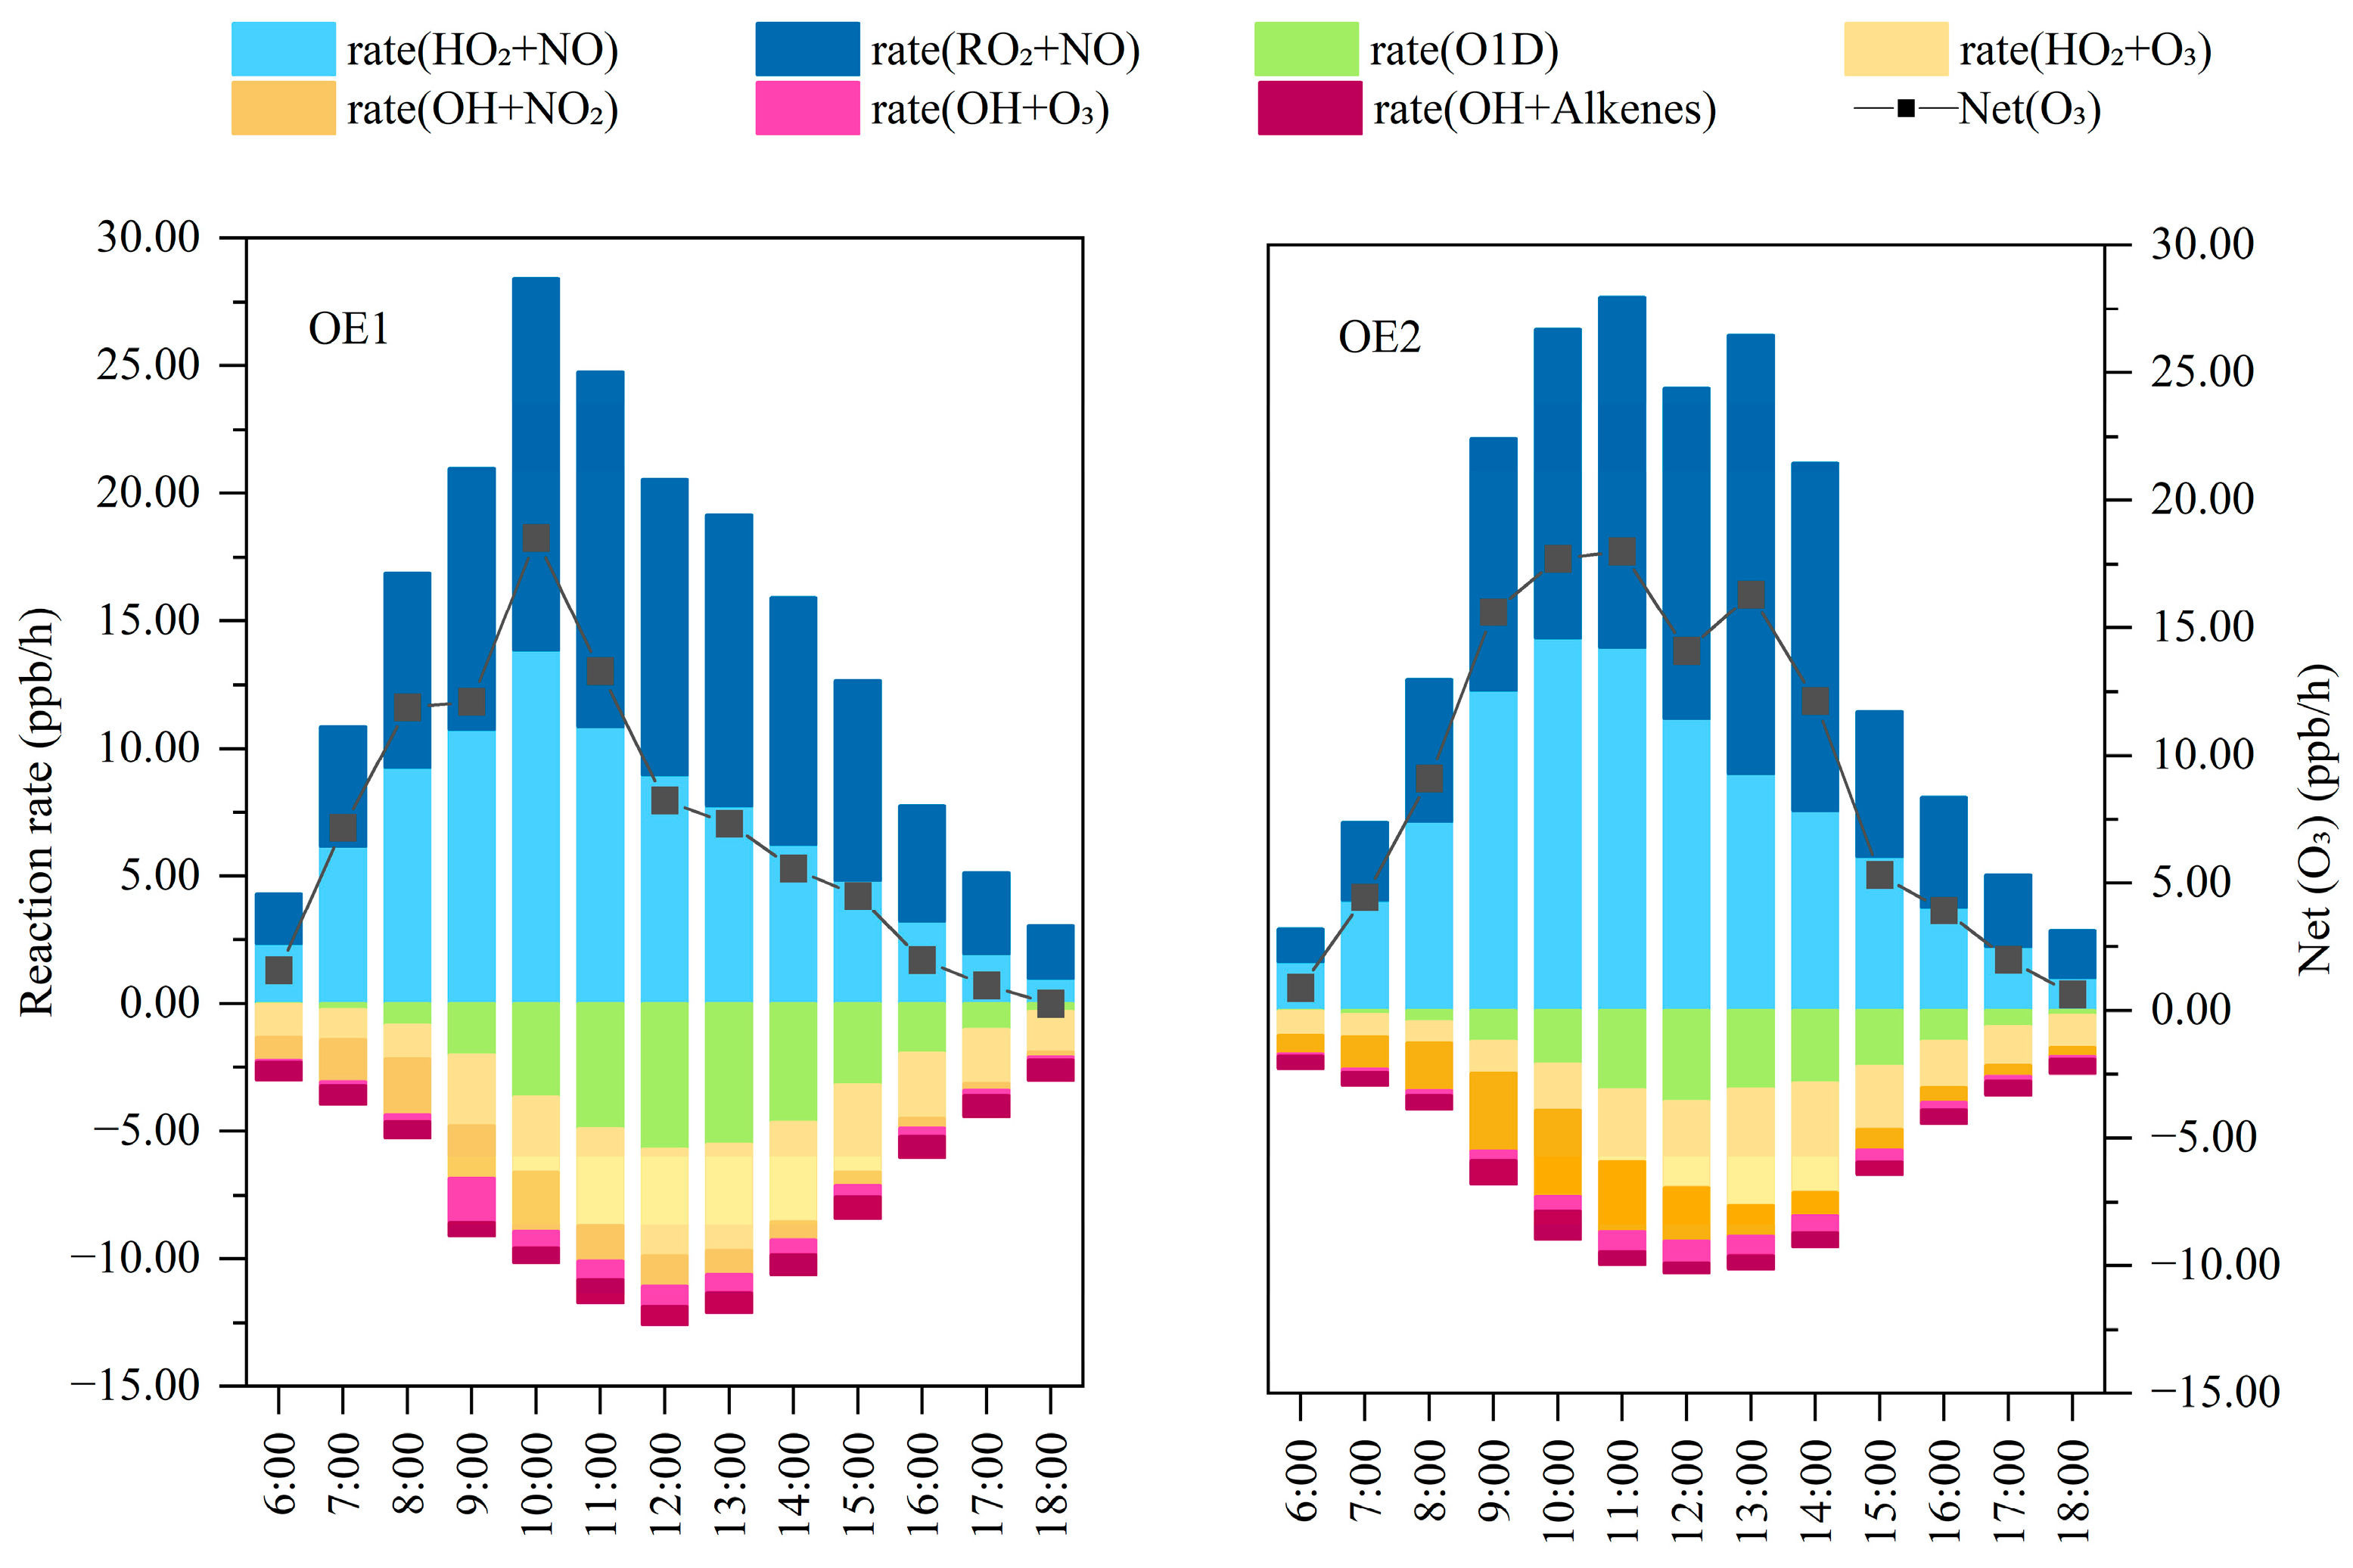
3.2.1. O3 Budget Analysis

Figure 3 demonstrates the diurnal variation in O3 production rates and loss rates on polluted days. The Net (O3) is determined by the difference between the production rates and loss rates. O1D+H2O, O3+OH, O3+HO2, NO2+OH, and O3+Alkenes were the main pathways of O3 loss, in which O3+HO2·accounted for a larger share of the total loss pathways (39.74%, 40.55%), with the reaction rates of 1.95 ppb/h and 1.54 ppb/h, respectively.
O3 is mainly produced through the reaction of NO with peroxyl radicals (HO2·and RO2·), and the O3 production rate can be calculated as the sum of HO2+NO and RO2+NO, in which RO2+NO dominated the production of O3, accounting for over 50% of the total O3 production rate, with peak rates of 14.56 ppb/h and 17.15 ppb/h. Higher reaction rates also mean that O3 cannot preferentially react with NO to eliminate it, leading to the accumulation of O3. The average rate of the daytime (6:00–18:00) Net (O3) of OE2 is 9.24 ppb/h, which is 25.2% higher than that of OE1 (6.91 ppb/h). The higher Net (O3) in Jincheng brought about severe O3 pollution, which is related to the high concentrations of NO, HO2·, and RO2 in the atmosphere, and thus mitigating O3 pollution requires focusing on the production of NO and peroxyl radicals.

3.2.2. Free Radical Cycle

In the OH-HO2-RO-RO2·radical cycling reaction pathway (Figure 4), the free radical budget and cycling reaction process during the OE1 and OE2 periods were comparatively demonstrated. The OH primary sources included H2O2+hv, O1D+H2O, and HONO+hv, among which O1D+H2O accounted for 2.15 ppb/h and 1.51 ppb/h. The reaction with NO and NO2 to produce HONO and HNO3 was the cycling reaction process to terminate OH. The primary source of HO2· was mainly the photolysis of HCHO and OVOCs, with reaction rates of 0.28 ppb/h and 0.20 ppb/h and 0.28 ppb/h and 0.31 ppb/h, respectively, for different conditions. And the termination reaction of HO2· was HO2+HO2 (1.74 ppb/h, 1.22 ppb/h) and HO2+RO2· (1.74 ppb/h, 1.59 ppb/h), respectively.
In the ROx cycle reaction process, the generation of HO2· mainly occurs through the reaction of RO+O2 and OH+HCHO pathways, and the termination process is mainly through the reaction with HO2·and RO2· to generate H2O2 and ROOH. The generation of OH· was mainly through the reaction of NO+HO2, and the reaction rate of OE2 (7.50 ppb/h) was 10.5% higher than that of OE1 (6.71 ppb/h), which was one of the important pathways for O3 formation. The loss process of OH· was mainly through the reaction with VOCs to generate RO2. This reaction is the beginning of the participation of VOCs in the free radical cycling process, and it is also an important pathway for the generation of RO2, a participant in the O3 production reaction. Alkenes with higher reactivity contribute more to the reaction of OH+VOCs. Compared with OE1, cis-2-butene, cis-2-pentene, and propylene, which have increased reaction rates in OE2, are also species with significant concentration changes. RO2+NO is an important reaction in free radical cycling reactions and one of the dominant reactions for O3 formation. The daytime average reaction rate of this reaction showed a small difference between the two typical O3 pollution episodes, but the peak reaction rate of OE2 (17.15 ppb/h) was significantly higher than that of OE1 (14.56 ppb/h). In general, the alkenes with larger reactivity in the reaction pathway of the free radical cycle are the focus of control. And these species not only play an important role in accelerating the free radical cycle but also promote the production of O3 to cause pollution.

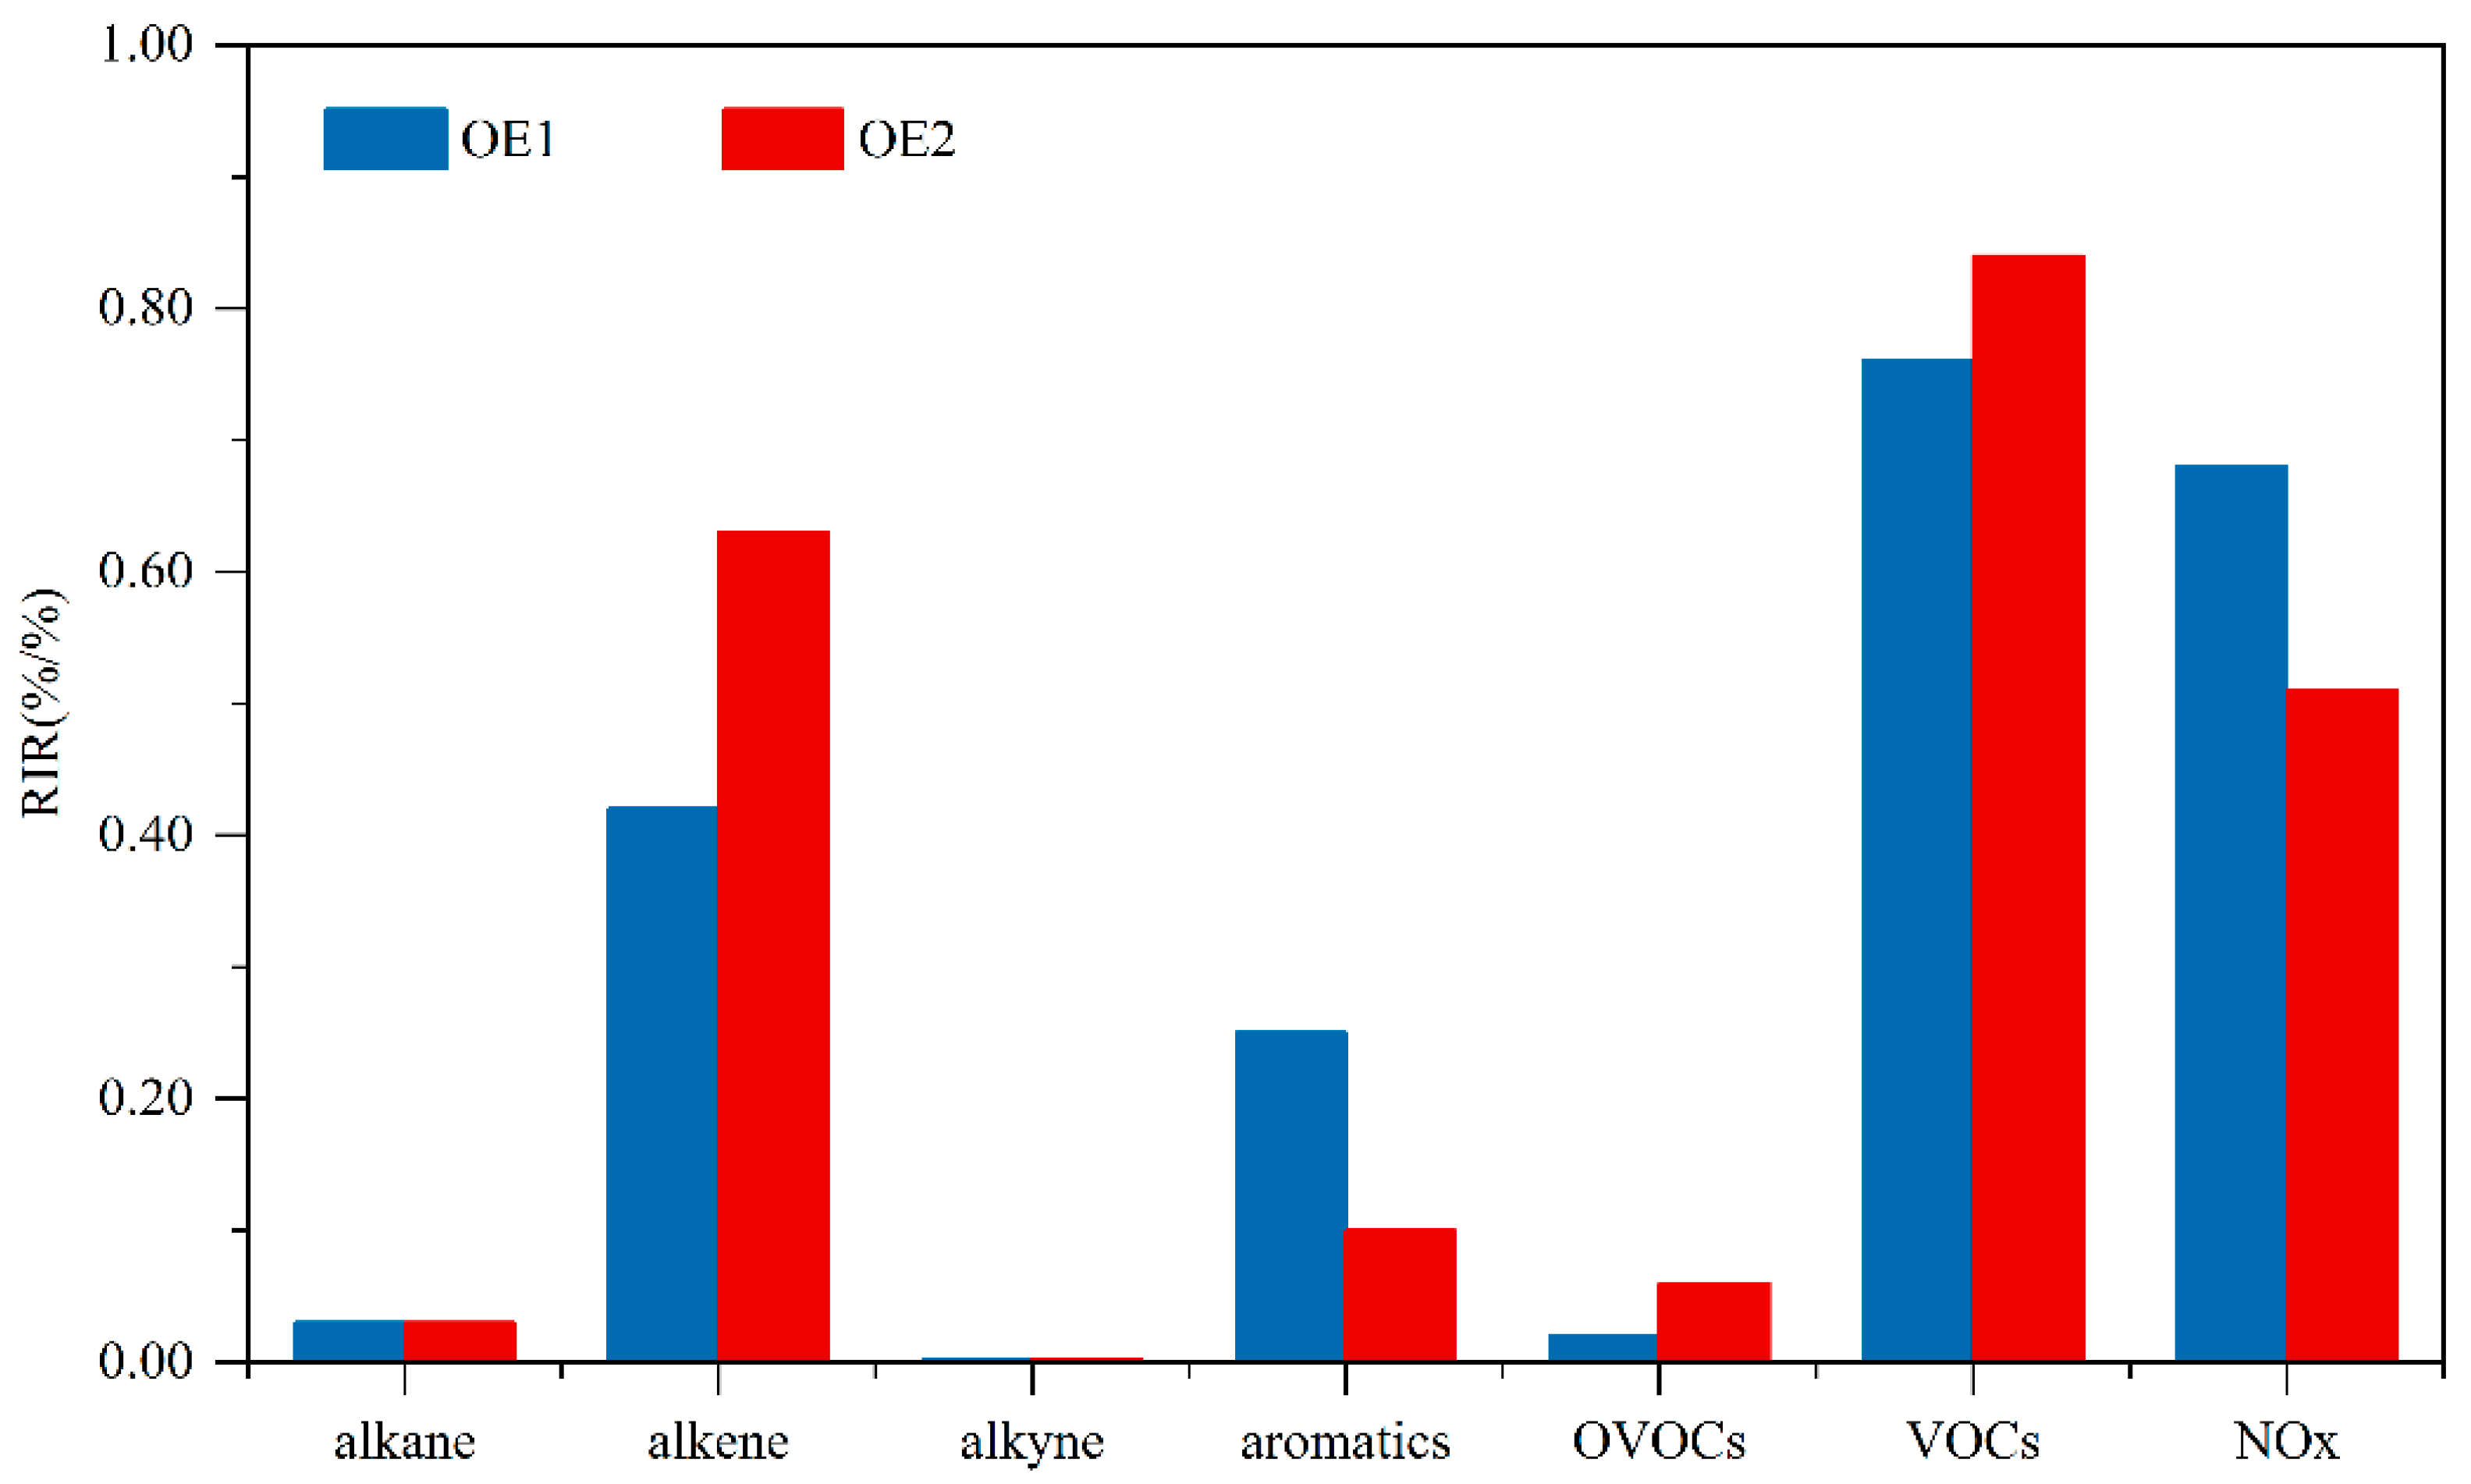
3.2.3. Sensitivity Analysis of O3 Formation

Figure 5 demonstrates the sensitivity results of the O3 generation to NOx, VOCs, and VOCs components (alkanes, alkenes, aromatics, alkynes, and OVOCs). The RIR values of each species component of VOCs and NOx are positive. Jincheng is in the O3-VOCs-NOx transition area, and the reduction in both VOCs and NOx can alleviate O3 pollution. Comparing OE1 to OE2 after the increase in industrial production, the RIR for VOCs increases from 0.76 to 0.84, and the RIR for alkenes increases from 0.42 to 0.63. NOx are important precursors that affect the O3 formation in both OE1 and OE2, with RIR values of 0.68 and 0.51, indicating strong sensitivity. The sources of NOx in industrial cities are complex, and in addition to emissions from vehicles and coal combustion, heavy industries represented by coking, iron and steel, cement, and other industries also emit large amounts of NOx [10,51]. And the comparison with industrial cities, such as Changzhi (0.35) [52], Zibo (0.4) [53], and Dongying (0.37) [54], shows that NOx in Jincheng play a more prominent role in the O3 formation process. Therefore, the control of O3 precursors in Jincheng should be aimed at the effective reduction in alkenes and NOx, and the prevention and control of NOx cannot be ignored.

3.3. Source Apportionment of O3 and Its Precursors

3.3.1. VOCs and NOx Source Apportionment

In this study, the PMF5.0 model was used to analyze the sources of O3 precursors and their contributions. A total of 43 species were selected to participate in the PMF simulation, including 16 alkanes, 8 alkenes, 1 alkyne, 13 aromatics, 4 OVOCs, and NOx. The six factors were identified as the industrial process, biogenic sources, coal combustion, solvent utilization, diesel vehicle emission, and gasoline vehicle emission. Aromatics, such as m/p-xylene, p-ethyltoluene, and 1,2,3-trimethyltoluene, had high contributions in Factor 1, and these species are related to the solvent utilization in paints and coatings. Therefore, Factor 1 was recognized as solvent utilization [49]. In Factor 2, n-heptane, n-octane, ethylbenzene, other high-carbon chain alkanes, aromatics, and NOx are the main pollutants emitted from diesel vehicles [55]. Therefore, Factor 2 was recognized as diesel vehicle emissions. In addition to the high contribution of C2-C5 low carbon chain alkanes, cis-2-butene, trans-2-pentene, acetaldehyde, and propanal in Factor 3, we identified this factor as industrial processes since these substances are emitted from production processes in the coal chemical and steel industries [48,50], thus identifying this factor as industrial processes. Ethane and propane, which are large contributors to Factor 4, are often from natural gas and LPG volatilization and combustion sources [56], and acetylene and ethene are characteristic species of coal combustion processes [57], so Factor 4 was identified as coal combustion. Factor 5 was identified as gasoline vehicle emissions; C4-C6 alkanes, such as isopentane, toluene, and acetone, are species emitted in large quantities from gasoline vehicles [58,59], and MTBE is also a typical emission tracer from gasoline vehicles [60]. The contribution of isoprene emitted by plants in Factor 6 was 82.9%, so the factor was judged to be biogenic sources [61].
Figure 6 shows the results of the contribution of the six factors identified by the model to VOCs and NOx. During OE2, industrial processes contributed the largest proportion to VOCs (33%), which was significantly higher than that of OE1 (20%), followed by coal combustion (29%), gasoline vehicle emissions (18%), biogenic sources (7%), solvent utilization (7%), and diesel vehicle emissions (4%). Gasoline vehicle emissions and coal combustion were significant contributors of VOCs during OE1. Among the NOx sources, diesel vehicle emissions contributed the largest proportion (53%, 45%), followed by coal combustion (26%, 28%), industrial processes (12%, 22%), and gasoline vehicle emissions (8%, 5%). After the increase in industrial production, its contribution to atmospheric VOCs and NOx was also significantly elevated. In addition, the contribution of diesel vehicles in Jincheng is also more prominent. Coal is the dominant industry in this industrial city, which has a greater demand for road transportation. Combined with the characteristics of high-speed roads around the city, diesel vehicles have a greater impact on the atmospheric environment in Jincheng. Therefore, in addition to pollutant emissions from industrial companies, attention should also be paid to the impact of diesel vehicles on O3 precursors in Jincheng.

3.3.2. O3 Source Apportionment

Combined with the O3 formation sensitivity results obtained in Section 3.2.3 for Jincheng, which is in the transition control area of VOCs and NOx, NOx are also quite important for O3 formation. It is necessary for this study to carry out the O3 source apportionment by considering VOCs and NOx together.
It has also been noted that for industrial cities in transition areas, NOx are very important in O3 formation and source apportionment. Only considering VOCs and ignoring NOx in the analysis process will lead to an inaccurate O3 source apportionment [62]. The results are shown in Figure 7, and diesel vehicle emissions are the first contributor to O3 formation in both OE1 and OE2. The contribution of industrial processes in OE2 (30.8%) is significantly higher than that in OE1 (15.2%), which is mainly due to the increase in industrial production and the consequent increase in the emissions of highly reactive VOCs species, which have a greater impact on O3 formation. The prominence of industrial processes and diesel vehicle emissions on VOCs and NOx in the comparison scenarios is also derived in Section 3.3.1. In general, diesel vehicle emissions and industrial processes were the focus of controlling O3 and its precursors in Jincheng.

4. Conclusions

This study comparatively analyzed the changes in atmospheric O3 precursors in a typical industrial city within the background of increasing industrial production in 2022 and 2024 and explored the changes in the atmospheric O3 formation mechanism and source apportionment using the OBM. By comparison, it was found that in the context of increasing industrial production, the concentrations of NOx and VOCs in 2024 have increased by 21.1% and 22.3%, respectively. Among them, the concentrations of cis-2-pentene, 1-hexene, and propylene related to industrial processes increased greatly. RO+NO is the main free radical chemical reaction pathway for atmospheric O3 formation, accounting for 51.5~54.2% of the total O3 formation. The reaction of VOCs with OH· is an important pathway for precursors to participate in the radical cycle to generate RO2·, with the peak reaction rate increasing from 7.58 ppb/h to 12.82 ppb/h, in which cis-2-pentene played an important role, and the daytime average reaction rate increased from 0.01 ppb/h to 0.18 ppb/h. VOCs and NOx both play important roles in the O3 formation process, and the sensitivity of VOCs increased from 0.76 to 0.84, with alkenes increasing most significantly (0.42~0.63). These results indicate that alkenes play an important role in the formation of O3 in the context of increased industrial activity. The comparative results of the precursors source apportionment indicated that the contribution of industrial processes to VOCs increased from 20% in 2022 to 33% in 2024. Diesel vehicles, the main transportation tool for industrial products, have also demonstrated an important emission contribution to NOx driven by industrial activities. Under the influence of industrial activities on precursors emissions, the contribution of industrial processes to O3 formation has increased from 15.2% to 30.8%, and diesel vehicle emissions also contribute significantly to O3 formation (30.6~34.8%). On the whole, the increase in the industrial activity level has led to a significant increase in alkenes emissions, which has a significant impact on the mechanism and sources of urban O3 formation. Controlling the emission of alkenes from the industrial process is the direction for the continuous control of O3 pollution in industrial cities, which is of great significance for reducing atmospheric O3 pollution.

Author Contributions

Conceptualization, D.H. and Y.N.; methodology, D.H.; software, W.Y.; validation, D.H. and W.Y.; formal analysis, W.Y.; investigation, Q.T.; resources, D.H.; data curation, Y.Z.; writing—original draft preparation, W.Y.; writing—review and editing, D.H., W.Y., Y.N., Y.Z. and Q.T.; visualization, W.Y.; supervision, D.H. and Y.N.; project administration, D.H.; funding acquisition, D.H. All authors have read and agreed to the published version of the manuscript.

Funding

This work was supported by the National Natural Science Foundation of China (NSFC) (Grant No. 42342022), the Fundamental Research Funds for the Central Universities (2024JG001), and Key Project of Heavy Air Pollution Cause and Control (Grant No. DQGG202109).

Institutional Review Board Statement

Not applicable.

Informed Consent Statement

Not applicable.

Data Availability Statement

Hourly data on trace gases (O3, NO2 and CO) and meteorological parameters (such as T, RH, and P) were obtained from the Jincheng Environmental Monitoring Station. The VOCs data used in this study can be downloaded from the online monitoring website of the National Platform for Data Integration and Comprehensive Analysis of Atmospheric Particulate Matter Composition and Photochemistry Monitoring (https://composition.cnemc.cn:30025; last access: 14 October 2024).

Conflicts of Interest

The authors declare no conflicts of interest.

References

  1. Lu, X.; Hong, J.Y.; Zhang, L.; Cooper, O.R.; Schultz, M.G.; Xu, X.B.; Wang, T.; Gao, M.; Zhao, Y.H.; Zhang, Y.H. Severe Surface Ozone Pollution in China: A Global Perspective. Environ. Sci. Technol. Let. 2018, 5, 487–494. [Google Scholar]
  2. Zhang, Q.J.; Sun, L.N.; Wei, N.; Wu, L.; Mao, H.J. The characteristics and source analysis of VOCs emissions at roadside: Assess the impact of ethanol-gasoline implementation. Atmos. Environ. 2021, 263, 118670. [Google Scholar]
  3. Ma, Y.X.; Ma, B.J.; Jiao, H.R.; Zhang, Y.F.; Xin, J.Y.; Yu, Z.A. An analysis of the effects of weather and air pollution on tropospheric ozone using a generalized additive model in Western China: Lanzhou, Gansu. Atmos. Environ. 2020, 224, 117342. [Google Scholar]
  4. Mcdonald, B.C.; Gouw, J.D.; Gilman, J.B.; Jathar, S.H.; Akherati, A.; Cappa, C.D.; Jimenez, J.L.; Taylor, J.L.; Hayes, P.L.; Mckeen, S.A.; et al. Volatile chemical products emerging as largest petrochemical source of urban organic emissions. Science 2018, 359, 760–764. [Google Scholar]
  5. Zavala, M.; Brune, W.H.; Velasco, E.; Retama, A.; Cruzalavez, L.A.; Molina, L.T. Changes in ozone production and VOC reactivity in the atmosphere of the Mexico City Metropolitan Area. Atmos. Environ. 2020, 238, 117747. [Google Scholar]
  6. Cohan, D.S.; Hakami, A.; Hu, Y.T.; Russell, A.G. Nonlinear Response of Ozone to Emissions:  Source Apportionment and Sensitivity Analysis. Environ. Sci. Technol. 2005, 39, 6739–6748. [Google Scholar]
  7. Wang, T.; Xue, L.K.; Brimblecombe, P.; Lam, Y.F.; Li, L.; Zhang, L. Ozone pollution in China: A review of concentrations, meteorological influences, chemical precursors, and effects. Sci. Total Environ. 2017, 575, 1582–1596. [Google Scholar]
  8. Wang, X.D.; Yin, S.S.; Zhang, R.Q.; Yuan, M.H.; Ying, Q. Assessment of summertime O3 formation and the O3-NOX-VOC sensitivity in Zhengzhou, China using an observation-based model. Sci. Total Environ. 2022, 813, 152449. [Google Scholar]
  9. Ling, Z.H.; Zhao, J.; Fan, S.J.; Wang, X.M. Sources of formaldehyde and their contributions to photochemical O3 formation at an urban site in the Pearl River Delta, southern China. Chemosphere 2011, 159, 2310–2319. [Google Scholar]
  10. Liu, H.J.; Wu, B.B.; Liu, S.H.; Shao, P.Y.; Liu, X.Y.; Zhu, C.Y.; Wang, Y.; Wu, Y.M.; Xue, Y.F.; Gao, J.J.; et al. A regional high-resolution emission inventory of primary air pollutants in 2012 for Beijing and the surrounding five provinces of North China. Atmos. Environ. 2018, 181, 20–33. [Google Scholar]
  11. Zou, Y.; Yan, X.L.; Flores, R.M.; Zhang, L.Y.; Yang, S.P.; Fan, L.Y.; Deng, T.; Deng, X.J.; Ye, D.Q. Source apportionment and ozone formation mechanism of VOCs considering photochemical loss in Guangzhou, China. Sci. Total Environ. 2023, 903, 166191. [Google Scholar] [PubMed]
  12. Li, Z.J.; Liu, T.T.; Zhang, H.; Wang, X.Q.; Zhang, J.; Qin, Z.Y.; Zhu, C.Z. Sensitivity analysis of ozone formation and source apportionment of VOCs in a typical industrial city in the Yangtze River Delta region during summer. Atmos. Pollut. Res. 2025, 16, 102424. [Google Scholar]
  13. Liu, Y.F.; Qiu, P.P.; Xu, K.; Li, C.L.; Yin, S.J.; Zhang, Y.J.; Ding, Y.; Zhang, C.; Wang, Z.; Zhai, R.X. Analysis of VOC emissions and O3 control strategies in the Fenhe Plain cities, China. J. Environ. Manag. 2023, 325, 116534. [Google Scholar]
  14. Lu, B.Q.; Zhang, Z.K.; Jiang, J.K.; Meng, X.; Liu, C.; Herrmann, H.; Chen, J.M.; Xue, L.K.; Li, X. Unraveling the O3-NOx-VOCs relationships induced by anomalous ozone in industrial regions during COVID-19 in Shanghai. Atmos. Pollut. 2023, 308, 119864. [Google Scholar]
  15. Romero, J.; Lupascu, A.; Lowe, D.; Badia, A.; Archer, S.; Dorlin, S.; Reeves, C.E.; Butler, T. Sources of surface O3 in the UK: Tagging O3 within WRF-Chem. Atmos. Chem. Phys. 2022, 22, 13797–13815. [Google Scholar]
  16. Beddows, A.V.; Kitwiroon, N.; Williams, M.L.; Beevers, S.D. Emulation and Sensitivity Analysis of the Community Multiscale Air Quality Model for a UK Ozone Pollution Episode. Environ. Sci. Technol. 2017, 51, 6229–6236. [Google Scholar]
  17. Cheng, H.R.; Guo, H.; Ho, K.F. Erratum to: On the relationship between ozone and its precursors in the Pearl River Delta: Application of an observation-based model (OBM). Environ. Sci. Pollut. Res. 2010, 17, 1491–1492. [Google Scholar]
  18. Cardelino, C.A.; Chameides, W.L. An Observation-Based Model for Analyzing Ozone Precursor Relationships in the Urban Atmosphere. J. Air Waste Manag. 1995, 45, 161–180. [Google Scholar]
  19. Chai, W.; Wang, M.; Li, J.Y.; Tang, G.G.; Zhang, G.H.; Chen, W.T. Pollution characteristics, sources, and photochemical roles of ambient carbonyl compounds in summer of Beijing, China. Environ. Pollut. 2023, 336, 122403. [Google Scholar]
  20. Zhang, K.; Li, L.; Huang, L.; Wang, Y.J.; Huo, Y.J.; Duan, Y.S.; Wang, Y.H.; Fu, Q.Y. The impact of volatile organic compounds on ozone formation in the suburban area of Shanghai. Atmos. Environ. 2020, 232, 117511. [Google Scholar]
  21. Wang, Z.Y.; Shi, Z.B.; Wang, F.; Liang, W.Q.; Shi, G.L.; Wang, W.C.; Chen, D.; Liang, D.N.; Feng, Y.C.; Russell, A.G. Implications for ozone control by understanding the survivor bias in observed ozone-volatile organic compounds system. npj Clim. Atmos. Sci. 2022, 5, 39. [Google Scholar]
  22. Liang, X.M.; Sun, X.B.; Xu, J.T.; Ye, D.Q. Improved emissions inventory and VOCs speciation for industrial OFP estimation in China. Sci. Total Environ. 2020, 745, 140838. [Google Scholar] [PubMed]
  23. Lyu, X.P.; Chen, N.; Guo, H.; Zhang, W.H.; Wang, N.; Wang, Y.; Liu, M. Ambient volatile organic compounds and their effect on ozone production in Wuhan, central China. Sci. Total Environ. 2016, 541, 200–209. [Google Scholar] [PubMed]
  24. Li, R.M. Source Apportionment of Surface Ozone Production Based on Field Observation; North China Electric Power University: Beijing, China, 2021. [Google Scholar]
  25. Jincheng Municipal Bureau of Statistics. Available online: http://tjj.jcgov.gov.cn/ (accessed on 15 February 2025).
  26. Song, Z.; Ji, Y.P.; Zhong, X.; Tang, Z.B.; Zhou, Y.Q.; Luo, H.Y.; Guo, Y.F. Determination of volatile organic pollutants in ambient airby thermal desorption-gas chromatography-mass spectrometry. Resour. Environ. Eng. 2021, 35, 914. [Google Scholar]
  27. Mu, S.; Zhou, C.H. Detemination of Volatile Organic Compounds (VOCs) in Car Air Using Theimal Desorption by Gas Chromatography/Mass Spectrometry (GC/MS). Environ. Sci. Manag. 2009, 34, 148–150. [Google Scholar]
  28. Yan, Y.L.; Niu, Y.Y.; Duan, X.L.; Yue, K.; Dong, J.Q.; Yang, C.; Hu, D.M.; Wang, Y.H.; Li, J.J.; Peng, L. Insight into carbonyl source based on improved source apportionment method: Alkene regulate secondary formation. J. Hazard. Mater. 2025, 489, 137649. [Google Scholar]
  29. Zhang, X.; Zhang, N.; Wei, R.; Su, W.K.; He, J.L.; Song, K.L.; Zhang, M.M.; Zhao, J.W.; Meng, K.; Zhang, Y.P. Characteristics and Source Apportionment of Ambient Volatile Organic Compounds in Shijiazhuang High-tech Industrial Development Zone in Autumn. Environ. Sci. 2024, 45, 7021–7030. [Google Scholar]
  30. Wang, F.; Li, L.X.; Wang, H.G.; Zhao, Z.S.; Zhang, J.P.; Zhang, D. Characteristics, Sources, and SOAP of VOCs During Winter in Jiyuan. Environ. Sci. 2022, 43, 3451–3462. [Google Scholar]
  31. Chen, J.; Gong, D.C.; Liao, T.; Zhou, Y.; Zhang, T.; Wang, R.W.; Wang, H.; Chen, D.H.; Wang, B.G. National Day effect and source analysis of atmospheric volatile organic compounds in the Pearl River Delta region. China Environ. Sci. 2023, 43, 3265–3280. [Google Scholar]
  32. United States Environmental Protection Agency. EPA Positive Matrix Factorization 5.0 Fundamentals and User Guide; United States Environmental Protection Agency: Washington, DC, USA, 2014. [Google Scholar]
  33. Gu, Y.X.; Li, K.; Xu, J.M.; Liao, H.; Zhou, G.Q. Observed dependence of surface ozone on increasing temperature in Shanghai, China. Atmos. Environ. 2020, 221, 117108. [Google Scholar]
  34. Li, W.Y.; Huang, H.Y.; Wang, Y.Z.; Zhu, Z.B.; Wang, Y.Q.; Gao, Y.S.; Peng, N.N.; Lun, X.X.; Huang, L.; Feng, R.F.; et al. Pollution Characteristics and Source Apportionment of VOCs in Urban Areas of Liaocheng in Summer. China Environ. Sci. 2023, 44, 6564–6575. [Google Scholar]
  35. Wang, W.J.; Fang, H.; Zhang, Y.; Ding, Y.Y.; Hua, F.; Wu, T.; Yan, Y.Z. Characterizing sources and ozone formations of summertime volatile organic compounds observed in a medium-sized city in Yangtze River Delta region. Chemosphere 2023, 328, 138609. [Google Scholar] [CrossRef] [PubMed]
  36. Yin, S.J.; Liu, Y.F.; Ma, W.; Zheng, C.; Zhang, Y.J.; Wang, Z.; Cheng, Q.; Liu, X.G. Formation mechanism, precursor sensitivity and control strategies of summertime ozone on the Fenwei Plain, China. Atmos. Environ. 2023, 309, 119908. [Google Scholar]
  37. Song, K.X.; Liu, R.; Wang, Y.; Liu, T.; Wei, L.Y.; Wu, Y.X.; Zheng, J.Y.; Wang, B.G.; Liu, S.C. Observation-based analysis of ozone production sensitivity for two persistent ozone episodes in Guangdong, China. Atmos. Chem. Phys. 2022, 22, 8403–8416. [Google Scholar]
  38. Zhang, Y.N.; Xue, L.K.; Chen, T.S.; Shen, H.Q.; Li, H.; Wang, W.X. Development history of observation-based model (OBM) and its application and prospect in atmospheric chemistry studies in China. Res. Environ. Sci. 2022, 35, 621632. [Google Scholar]
  39. Ma, W.; Feng, Z.M.; Zhan, J.L.; Liu, Y.C.; Liu, P.F.; Liu, C.T.; Ma, Q.X.; Yang, K.; Wang, Y.F.; He, H.; et al. Influence of photochemical loss of volatile organic compounds on understanding ozone formation mechanism. Atmos. Chem. Phys. 2022, 22, 4841–4851. [Google Scholar] [CrossRef]
  40. Zeng, P.; Lyu, X.P.; Guo, H.; Cheng, H.R.; Jiang, F.; Pan, W.Z.; Wang, Z.W.; Liang, S.W.; Hu, Y.Q. Causes of ozone pollution in summer in Wuhan, Central China. Environ. Pollut. 2018, 241, 852–861. [Google Scholar]
  41. Mozaffar, A.; Zhang, Y.L. Effects of VOC emission reduction on atmospheric photochemistry and ozone concentrations during high-ozone episodes. Atmos. Res. 2024, 308, 107538. [Google Scholar]
  42. Wang, T.T.; Tao, J.; Li, Z.; Lu, X.; Liu, Y.L.; Zhang, X.R.; Wang, B.; Zhang, D.; Yin, S.S. Characteristic, source apportionment and effect of photochemical loss of ambient VOCs in an emerging megacity of Central China. Atmos. Environ. 2024, 305, 107429. [Google Scholar]
  43. He, C.Q.; Zou, Y.; Lv, S.J.; Flores, R.M.; Yan, X.L.; Deng, T.; Deng, X.J. The importance of photochemical loss to source analysis and ozone formation potential: Implications from in-situ observations of volatile organic compounds (VOCs) in Guangzhou, China. Atmos. Environ. 2024, 320, 120320. [Google Scholar]
  44. Duan, L.Q.; Wu, Y.T.; Liu, B.S. Source apportionment of ambient VOCs during ozone pollution periods in Linfen. China Environ. Sci. 2025, 45, 78–92. [Google Scholar]
  45. Han, M.Z.; Huan, J.F.; Qiao, X.L.; Sun, C.; Xi, J.Y. Non-target screening of VOCs in the atmosphere of Dalian city and its potential for ozone generation. J. Dalian Univ. Technol. 2023, 63, 248–255. [Google Scholar]
  46. Luo, R.X.; Liu, B.S.; Liang, D.N.; Bi, X.H.; Zhang, Y.F.; Feng, Y.C. Characteristics of Ozone and Source Apportionment of the Precursor VOCs in Tianjin Suburbs in Summer. China Environ. Sci. 2021, 42, 75–87. [Google Scholar]
  47. Liu, Y.; Shao, M.; Fu, L.L.; Lu, S.H.; Zeng, L.M.; Tang, D.G. Source profiles of volatile organic compounds (VOCs) measured in China: Part I. Atmos. Environ. 2008, 42, 6247–6260. [Google Scholar]
  48. Gu, X.; Chen, K.T.; Cai, M.; Yin, Z.Y.; Liu, X.G.; Li, X.R. Study on the Fingerprint and Atmospheric Activity of Volatile Organic Compounds from Typical Industrial Emissions. Int. J. Environ. Res. Public Health 2023, 20, 3517. [Google Scholar] [CrossRef]
  49. Wang, Q.; Chen, C.H.; Wang, H.L.; Zhou, M.; Lou, S.R.; Qiao, L.P.; Huang, C.; Li, L.; Su, L.Y.; Mou, Y.Y. Forming Potential of Secondary Organic Aerosols and Sources Apportionment of VOCs in Autumn of Shanghai, China. China Environ. Sci. 2013, 34, 424–433. [Google Scholar]
  50. Wang, K.X.; Zhang, X.; Ji, Y.Y.; Li, H.; Fan, K.; Gao, R.; He, M. Characterization of Ambient VOCs in a Coal Chemical Industry Park and Their Contribution to Complex Air Pollution. Res. Environ. Sci. 2023, 36, 294–304. [Google Scholar]
  51. Cao, J.Y.; Liu, C.L.; Qiu, X.H.; Peng, L. Research on high-resolution emission inventory of air pollution sources in Changzhi. Environ. Pollut. Control 2022, 44, 618–624. [Google Scholar]
  52. Xing, Y.R.; Niu, Y.Y.; Yan, Y.L.; Peng, L.; Dong, J.Q.; Yue, K. Research on the sources of volatile organic compounds in the summer atmosphere and the contribution to ozone generation in Changzhi, a typical industrial city. China Environ. Sci. 2024, 44, 4202–4210. [Google Scholar]
  53. Zheng, Z.S.; Li, K.W.; Xu, B.; Dou, J.P.; Li, L.M.; Zhang, G.T.; Li, S.J.; Geng, C.M.; Yang, W.; Azzi, M.; et al. O3–precursor relationship over multiple patterns of timescale: A case study in Zibo, Shandong Province, China. Atmos. Chem. Phys. 2023, 23, 2649–2665. [Google Scholar] [CrossRef]
  54. Zhao, M.; Shen, H.Q.; Chen, T.S.; Li, J.D.; Sun, Z.Q.; Ji, Y.Y.; Xue, L.K.; Li, H.; Wang, W.X.; Shang, F.Y. Characteristics and Sensitivity Analysis of Ozone in the Representative City of the Yellow River Delta in Summer. Res. Environ. Sci. 2022, 35, 1351–1361. [Google Scholar]
  55. Gao, X.; Jin, B.Y.; Wu, L.; Liu, K.X.; Mao, H.J. Research progress on emission characteristics and influencing factors of VOCs from vehicle exhaust. Environ. Sci. Technol. 2023, 46, 69–78. [Google Scholar]
  56. Brown, S.G.; Frankel, A.; Hafner, H.R. Source apportionment of VOCs in the Los Angeles area using positive matrix factorization. Atmos. Environ. 2007, 41, 227–237. [Google Scholar]
  57. Niu, Y.Y.; Liu, Z.C.; Li, R.M.; Gao, Q.Z.; Deng, M.J.; Yan, Y.L.; Hu, D.M.; Wu, J.; Peng, L. Characteristics, Source Apportionment, and Environmental Impact of Volatile Organic Compounds in Summer in Yangquan. China Environ. Sci. 2020, 41, 3066–3075. [Google Scholar]
  58. Mo, Z.W.; Shao, M.; Lu, S.H. Compilation of a source profile database for hydrocarbon and OVOC emissions in China. Atmos. Environ. 2016, 143, 209–217. [Google Scholar] [CrossRef]
  59. Wang, S.H.; Yuan, B.; Wu, C.H.; Wang, C.M.; Li, T.G.; He, X.J.; Huangfu, Y.B.; Qi, J.P.; Li, X.B.; Sha, Q.E.; et al. Oxygenated volatile organic compounds (VOCs) as significant but varied contributors to VOC emissions from vehicles. Atmos. Chem. Phys. 2022, 22, 9703–9720. [Google Scholar]
  60. Song, C.L.; Zhang, W.M.; Pei, Y.Q.; Fan, G.L.; Xu, G.P. Comparative effects of MTBE and ethanol additions into gasoline on exhaust emissions. Atmos. Environ. 2006, 40, 1957–1970. [Google Scholar]
  61. Hui, L.R.; Liu, X.G.; Tan, Q.W.; Feng, M.; An, J.L.; Qu, Y.; Zhang, Y.H.; Jiang, M.Q. Characteristics, source apportionment and contribution of VOCs to ozone formation in Wuhan, Central China. Atmos. Environ. 2018, 192, 55–71. [Google Scholar]
  62. Niu, Y.Y.; Yan, Y.L.; Xing, Y.R.; Duan, X.L.; Yue, K.; Dong, J.Q.; Hu, D.M.; Wang, Y.H.; Peng, L. Analyzing ozone formation sensitivity in a typical industrial city in China: Implications for effective source control in the chemical transition regime. Sci. Total Environ. 2024, 919, 170559. [Google Scholar]
Figure 1. Online monitoring sampling site in Jincheng.
Atmosphere 16 00432 g001
Figure 2. Comparison of O3 and its precursor concentrations during observation period.
Atmosphere 16 00432 g002
Figure 3. Diurnal (06:00–18:00) variations in O3 production and loss rates on polluted days.
Atmosphere 16 00432 g003
Figure 4. Summary of daytime (6:00–18:00) average budgets of ROx (ppb/h) on polluted days. Reaction rates during OE1 and OE2 are represented by black and red fonts, respectively.
Atmosphere 16 00432 g004
Figure 5. The daytime (6:00–18:00) RIR values of O3 precursors.
Atmosphere 16 00432 g005
Figure 6. The source apportionment results of VOCs (a,b) represent the VOCs source apportionment results of OE1 and OE2 and NOx; (c,d) represent the NOx source apportionment results of OE1 and OE2 from the PMF.
Atmosphere 16 00432 g006
Figure 7. Source contribution of O3 simulated by PMF and OBM during OE1 (a) and OE2 (b).
Atmosphere 16 00432 g007
Disclaimer/Publisher’s Note: The statements, opinions and data contained in all publications are solely those of the individual author(s) and contributor(s) and not of MDPI and/or the editor(s). MDPI and/or the editor(s) disclaim responsibility for any injury to people or property resulting from any ideas, methods, instructions or products referred to in the content.

