Article

The Color and Magnetic Properties of Urban Dust to Identify Contaminated Samples by Heavy Metals in Mexico City Metropolitan Area

by
Alexandra Méndez-Sánchez
1,
Ángeles Gallegos
2,
Rafael García
3,
Rubén Cejudo
3,
Avto Goguitchaichvili
3 and
Francisco Bautista
2,*
1
Escuela Nacional de Estudios Superiores Unidad Morelia, Universidad Nacional Autónoma de México, Morelia 58190, Michoacán, Mexico
2
Laboratorio Universitario de Geofísica Ambiental, Centro de Investigaciones en Geografía Ambiental, Universidad Nacional Autónoma de México, Morelia 58190, Michoacán, Mexico
3
Laboratorio Universitario de Geofísica Ambiental, Instituto de Geofísica Unidad Michoacán, Universidad Nacional Autónoma de México, Morelia 58190, Michoacán, Mexico
*
Author to whom correspondence should be addressed.
Atmosphere 2025, 16(4), 374; https://doi.org/10.3390/atmos16040374
Submission received: 13 February 2025 / Revised: 2 March 2025 / Accepted: 14 March 2025 / Published: 25 March 2025
(This article belongs to the Section Air Pollution Control)

Abstract

:
Particles from gasoline-powered vehicle combustion often contain dark or black magnetic iron oxides. This work evaluates color variations and heavy metal concentrations in urban dust by separating magnetic particles. We used a high-power magnet to separate the magnetic particles of 30 urban dust samples from the Metropolitan Zone of the Valley of Mexico. In this way, we obtained three types of dust samples: complete particles (CPs), magnetic particles (MPs), and residual particles (RPs). The change in color with the CIE L*a*b* and RGB systems was estimated, while the concentrations of 18 heavy metals with XRF were measured. Results showed significant color differences between magnetic particles (MPs) and complete (CPs) or residual particles (RPs), with MPs exhibiting darker tones and higher concentrations of Cu, Fe, Mn, and V. The redness and saturation indices may help to identify urban dust samples contaminated with heavy metals and magnetic particles. Magnetism is a method that removes magnetic particles and some heavy metals from urban dust, partially reducing its toxicity.

1. Introduction

The World Health Organization (WHO) states that around seven million people die each year from exposure to environmental pollution [1,2]. Exposure to air pollution, for example, aggravates cardiovascular disease and is associated with cancer, respiratory diseases, malignant tumors, and chronic obstructive pulmonary diseases [1]. In addition to the damage to health, heavy metals are also a great danger to terrestrial and marine ecosystems [3].
Urban dust contamination with heavy metals is a high-risk factor for health, especially for children and adults. These particles can enter the human body through inhalation, ingestion, and even dermal contact, causing various diseases [4,5,6,7,8,9,10]. Some of the most common heavy metals (HMs) in everyday life are arsenic (As), chromium (Cr), cobalt (Co), cadmium (Cd), mercury (Hg), lead (Pb), silver (Ag), nickel (Ni), vanadium (V), molybdenum (Mo), zinc (Zn), manganese (Mn), iron (Fe), tin (Sn), and antimony (Sb) [11].
The origin of heavy metals that accumulate in urban dust is diverse. Heavy metals can come from vehicular sources, such as brake and tire wear, engine components or exhaust emissions [12], industrial activities [13], and even derivatives of internal processes in homes and the weathering of urban infrastructure [14,15]. Heavy metals can also come from natural sources, such as soil due to historical contamination, heavy metals from the weathering of rocks, and heavy metals contained in volcanic ash, among others. Dust pollution can also come from distant, natural sources, such as dust from the Sahara or emissions from large industries in nearby cities or countries [14,15,16]. In other words, urban dust, or street dust, is a mixture of natural sources, such as soil and volcanic ash, anthropogenic materials derived from emissions from cars, industry, and homes, plus the wear and tear of urban infrastructure [10,11,12,13,14,15,16,17,18].
Monitoring magnetic particles in urban dust is limited due to the relatively novel nature of this environmental matrix and the associated high costs and time required for analysis. Therefore, researchers have explored proxy methodologies, such as environmental magnetism and mineral color analysis, to provide rapid and cost-effective assessments [16,17]. Combustion, whether in industrial or company chimneys, in homes and restaurants, transforms iron minerals with a low magnetic signal and colors other than black into minerals with a high magnetic signal and dark colors, such as maghemite and magnetite [7,18]. Friction at high temperatures also generates high magnetic signals and black minerals, as happens in car braking systems [11,12].
This study considers two premises: Urban dust with a higher content of heavy metals has dark tones [18,19,20]. The first premise is based on the following examples: In Ensenada, Mexico, the dark gray urban dust had higher Pb, Cu, Zn, and N [18]. In Murcia, Spain, there were higher concentrations of dark-colored urban dust, Cu, Cr, and Ni [19]. In Merida, Yucatan, very dark gray urban dust had high concentrations of Pb, Cu, Zn, and Y [18]. The second premise is that magnetic particles contain higher concentrations of heavy metals than residual particles [7,21,22]. Magnetite is an omnipresent pollutant in urban dust, air, and soil [7]. Urban dust in Mexico City and many cities contains magnetic minerals [6,8]. Magnetic particles also are found in urban dust in many cities [16,17,22].
This work aimed to evaluate the color change in urban dust samples due to the removal of magnetic particles and compare the concentrations of heavy metals in magnetic and residual particles to evaluate the efficiency of magnetism as a new cleaning technique.

2. Materials and Methods

2.1. Study Area

The Metropolitan Zone of the Valley of Mexico (MZVM) has 21.8 million inhabitants, 5.5 million vehicles in Mexico City alone, and 36 industrial parks, making it the most populated federal entity in Mexico [23]. The study area has a temperate climate with variations in humidity levels from dry to humid [21]. The average annual temperature is 16 °C, with the highest temperature of 25 °C from March to May and the lowest of 5 °C in January [24]. The MZVM is between 2200 and 2400 MASL and is part of the Neovolcanic Axis, a basin surrounded by different mountain ranges. It has four hydrological and geological sub-basins [24]. The land use is urban, but it contains areas of irrigated agriculture, rain-fed agriculture, cultivated forests, coniferous forests, oak forests, arid zone scrublands, natural grasslands, and cultivated grasslands [25].

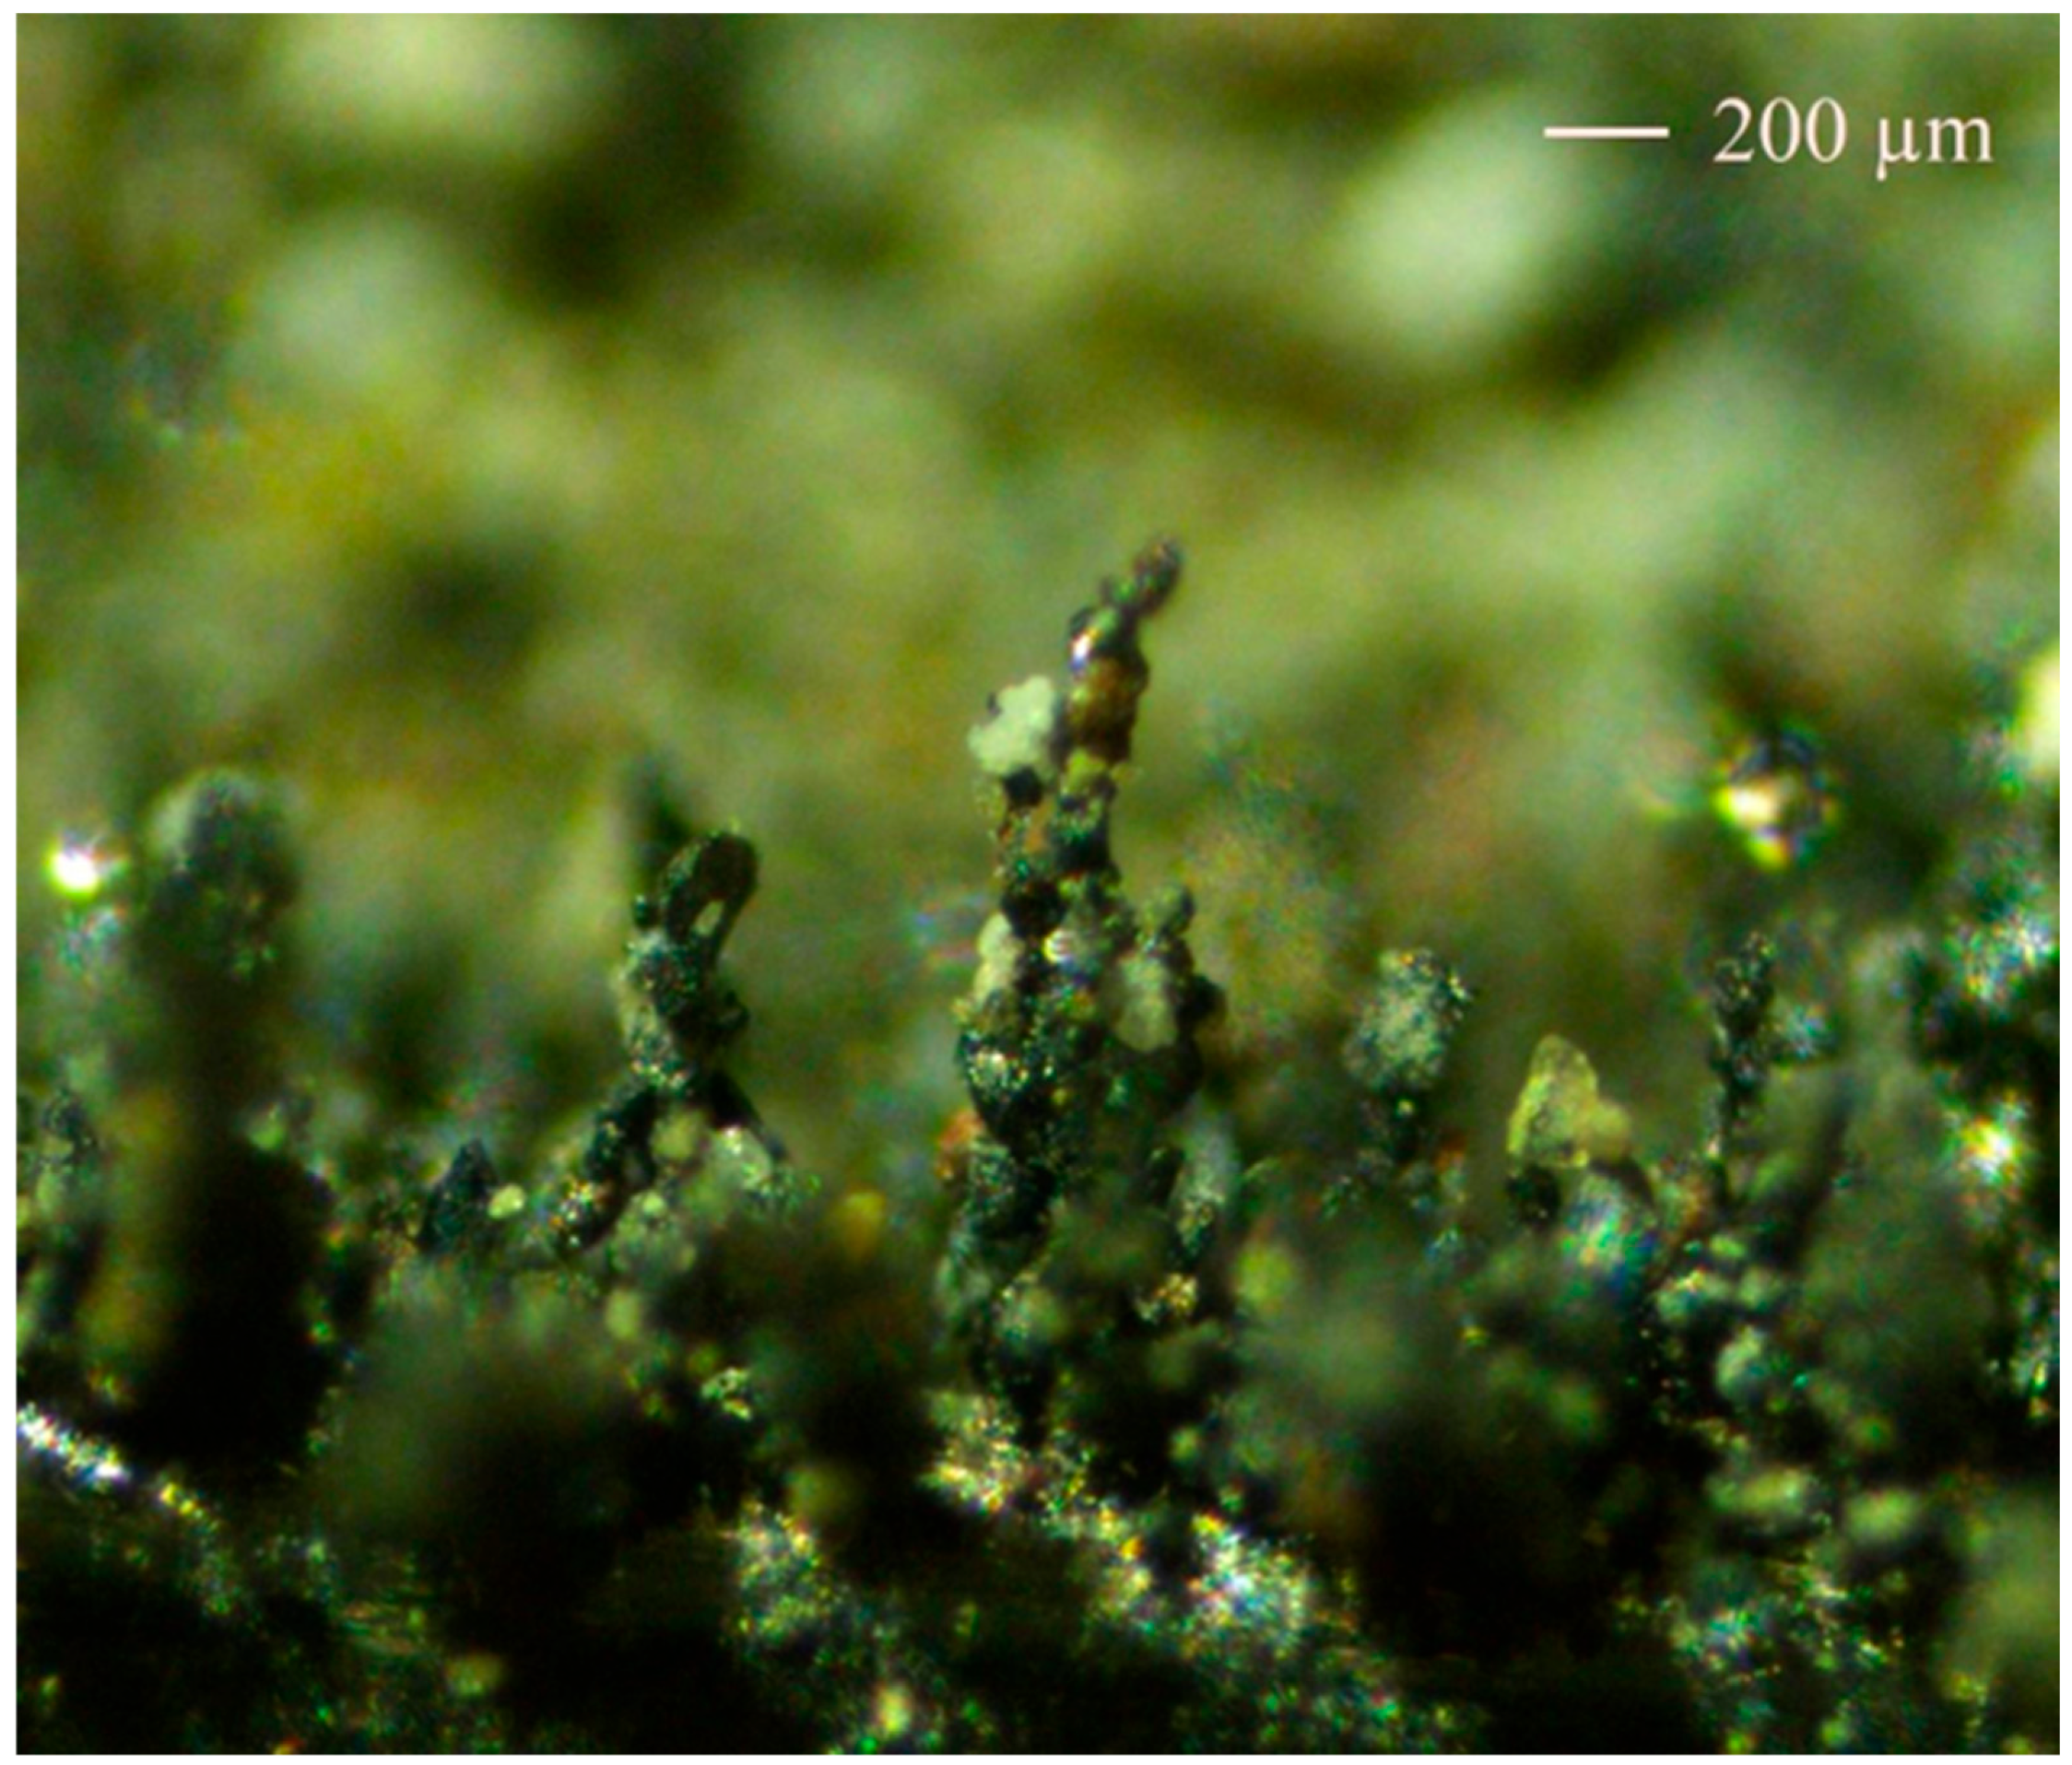
2.2. Sampling and Pretreatment of Urban Dust Samples

We collected 30 samples of urban dust (Figure 1). Rocks, branches, and leaves were manually removed from urban dust to eliminate material that was not interesting due to its large size. The samples were placed in labeled and georeferenced polyethylene bags. The dust samples were dried in the shade and sieved at mesh size 60 (250 µm).
R   G   B   = ( 3.240479 1.537150 0.498535 0.969256   1.875992   0.041556   0.055648   0.204043   1.057311   ) X   Y   Z  
The CIE L*a*b system is a mathematical model with octagonal axes, where a* = red/green coordinates, b* = yellow/blue, and an L* axis of luminosity. This model represents colors perceptible to the human eye and numerical values for exact measurement, which is why it was selected for color measurements.
The RGB system is produced by any additive or subtractive mixture of the spectra of the three primary colors: red (R), green (G), and blue (B). Their corresponding monochromatic primary stimuli occur at 700, 546, and 436 nm. On an 8-bit digital system, color is quantified by numeric tristimulus R, G, and B values that range from 0 (darkness) to 255 (whiteness) (Figure 2).
The gamut system color forms a cube comprising orthogonal RGB Cartesian coordinates. Each color is then represented by a point on or in the cube. All gray colors are in the main diagonal [26,27]. The RGB system was selected for color index calculations due to its straightforward numerical output, avoiding the alphanumeric classifications of the Munsell system and the potential for negative values in the CIE Lab* system.
Redness indices (RIs), saturation (SI), and hue (HI) have been used to predict each soil color component. These indices were obtained with the following equations [27,28].
Also, we take photographs of CPs, MPs, and RPs complete particles, residual particles, and magnetic particles using an AMSCOPE Triocular Microscope model T700A (United Scope LLC, Irvine, CA, USA), equipped with PL10X 22 mm and WH15X/16 high eyepiece points, flat eyepieces, and a 4X infinity plan objective. The microscope has a focusing range of 1–3/16″ (30 mm) and features a built-in Kohler illumination system with a 6 V/30 W LED. Due to the opacity of the particles, an additional light source from a smartphone flashlight, estimated to produce 20–50 lumens, was used to enhance the visibility of the samples.
MPs and RPs were photographed under the Olympus Bx60 Petrographic and Mineragraphic Microscope (Scientific Solutions de Olympus Corporation, Tokyo, Japan). These samples were prepared in 30-micron-thick, thin slices for visualization in parallel Nicols, crossed Nicols, and convergent light in the specific case of the classification of oxides.
Subsequently, three grams of CPs, MPs, and RPs were placed in a Teflon cup with a 3.6 μm thick Mylar (polyester) film bottom window to measure heavy metal concentrations using a Genius 7000 XRF portable spectrometer (Skyray Instruments, Jiangsu, China), 40 kV X-ray tube with a large area beryllium window silicon drift detector [29,30]. Three replicates (with an integration time of 60 s) were performed for each sample. The detection limits were 10 mg kg−1 for Ca, K, Ti, V, Cr, Sn, Sr, and Sb; 5 mg kg−1 for Mn, Fe, Cu, Pb, Ni, Nb, Y, and Zn; 2 mg kg−1 for Rb, and Zr. The values of the means of the XRF analysis replicates were used, and a standard deviation of 10% was accepted as a practical determination limit. We used an internal reference material called IGLs-1 of known composition [31], measured every 20 samples. The analyses were carried out at the Environmental Geophysics Laboratory (LUGA) of the National Autonomous University of Mexico (UNAM).
One hundred and eighty analyses were carried out: 60 subsamples and three replicates. The concentrations of 18 elements (Ca, Cr, Cu, Fe, K, Mn, Nb, Ni, Pb, Rb, Sb, Sn, Sr, Ti, V, Y, Zn, and Zr) were analyzed for a total of 3240 datapoints.
We compared the medians of the color indices with the Kruskal–Wallis (K-W) test by particle groups (CPs, MPs, and RPs). Box-and-whisker figures show the distribution of data within each group. The box represents the interquartile range (Q1 to Q3); the line inside the box is the median; and the whiskers extend to the minimum and maximum values that are not considered outliers. The circles beyond the lines or whiskers represent the outliers. If the group medians are aligned and the boxes have considerable overlap, there are probably no significant differences between the groups. Similarly, with the color indices and element concentrations measured with XRF, we performed an analysis of variance to compare magnetic and residual particles.

3. Results

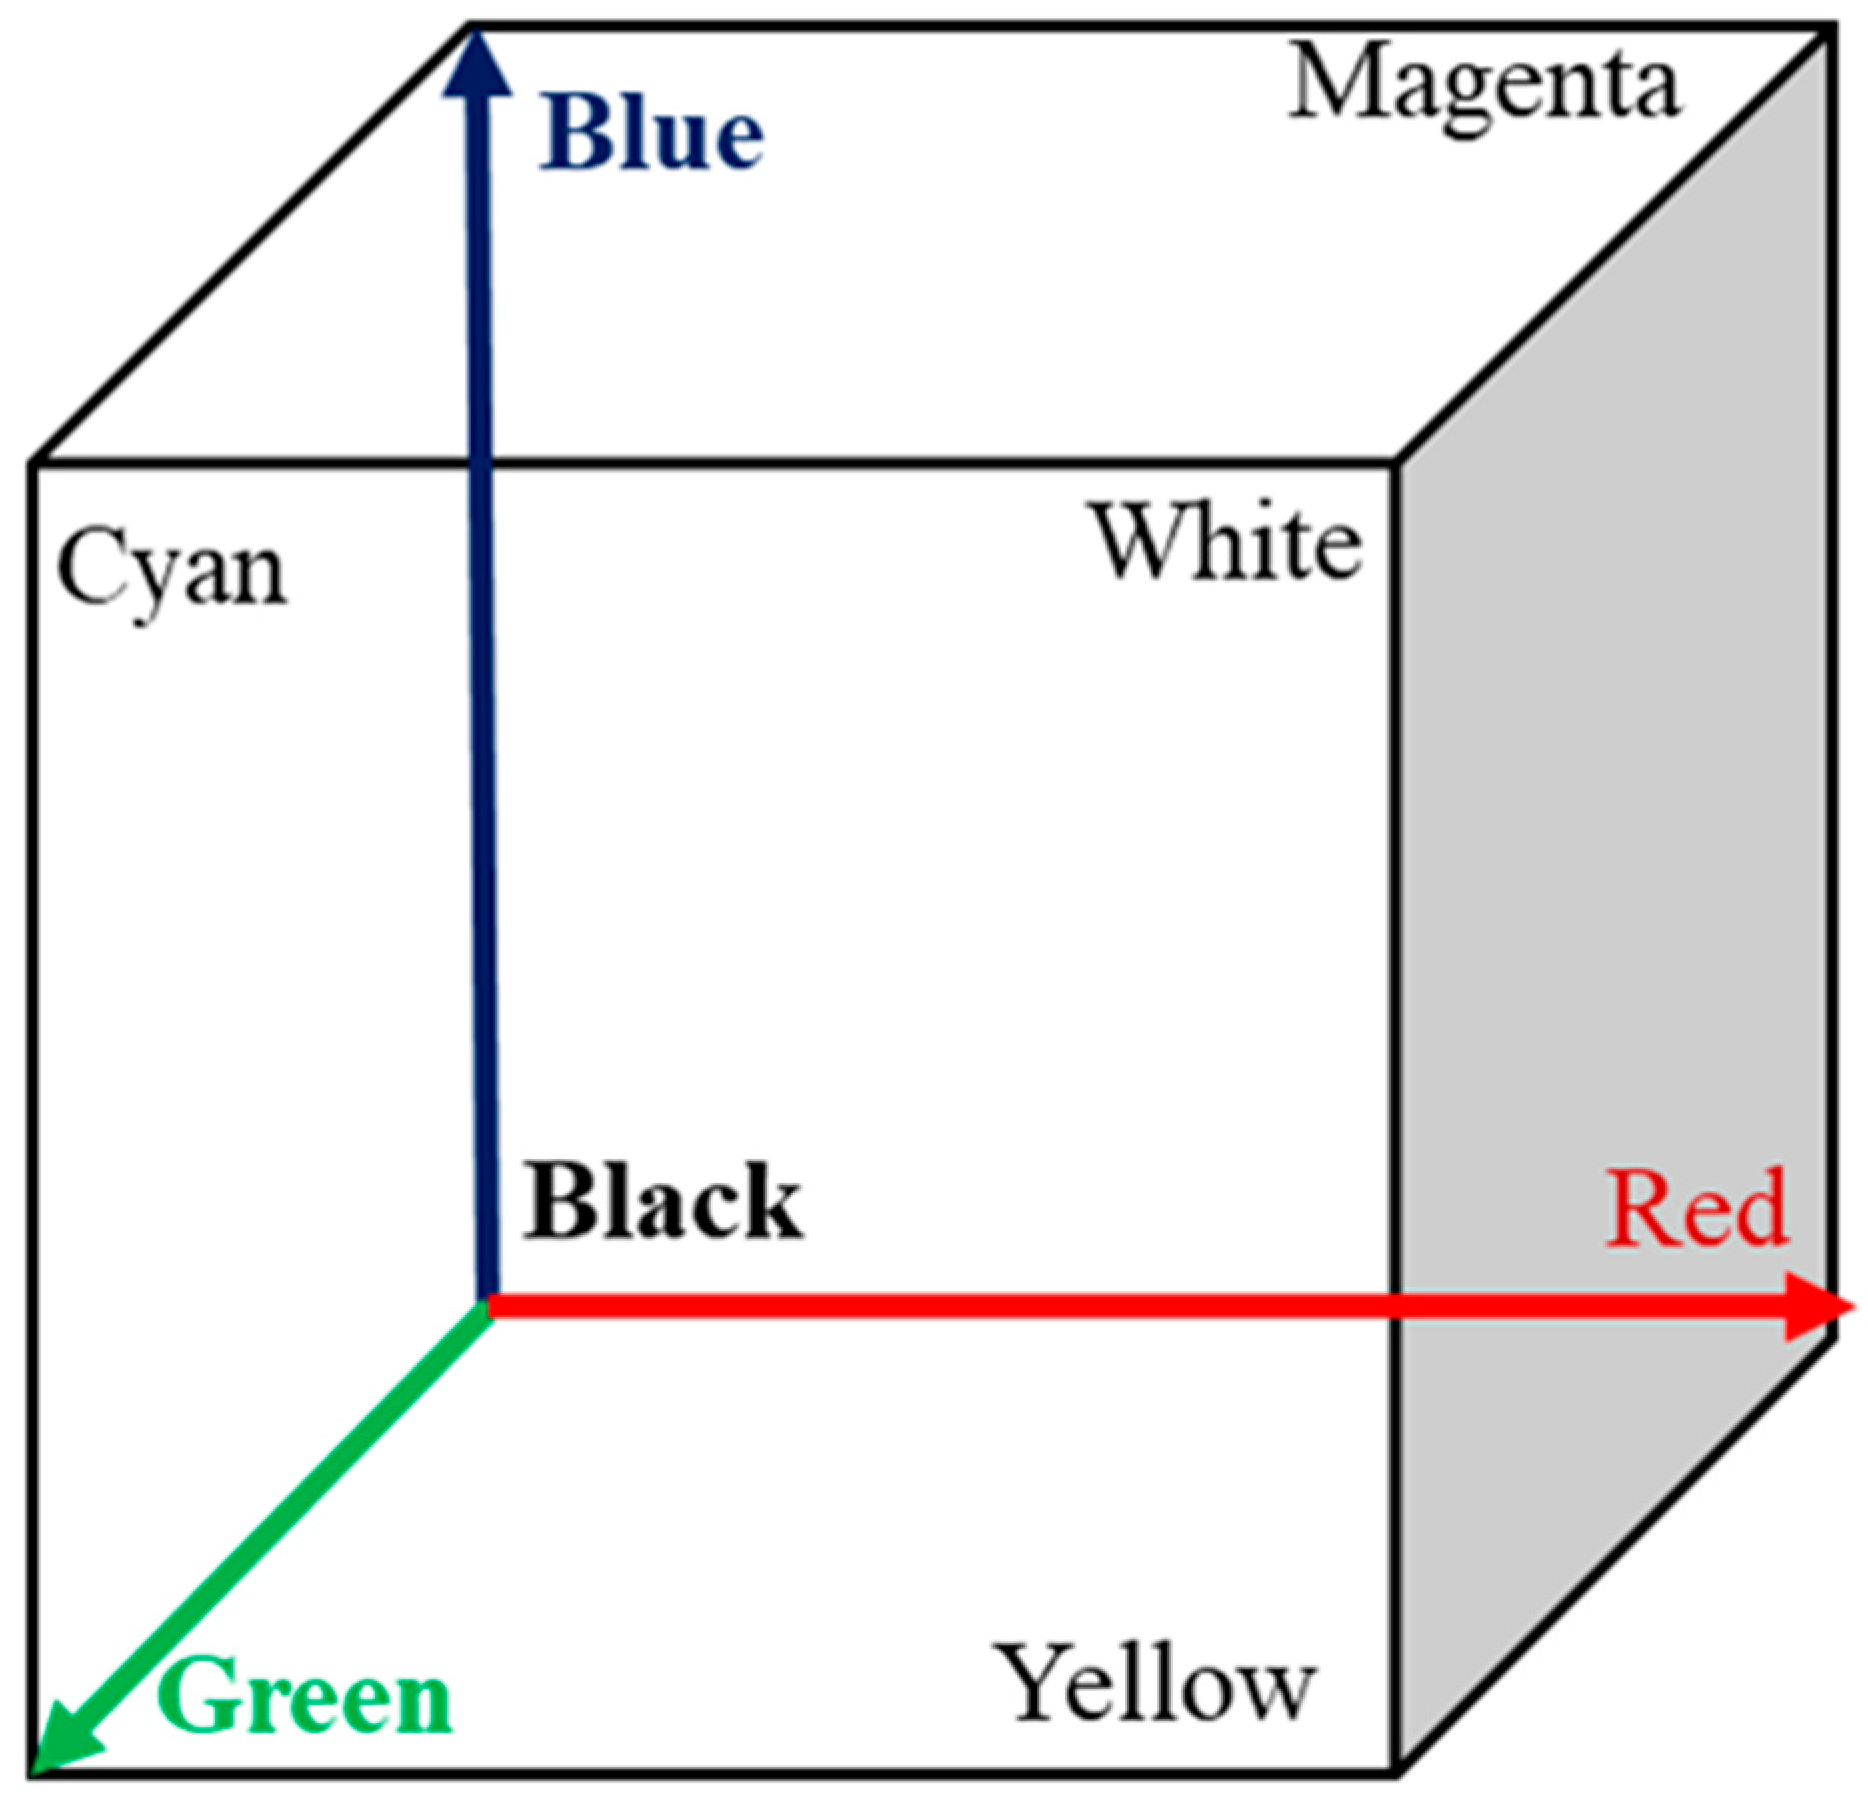
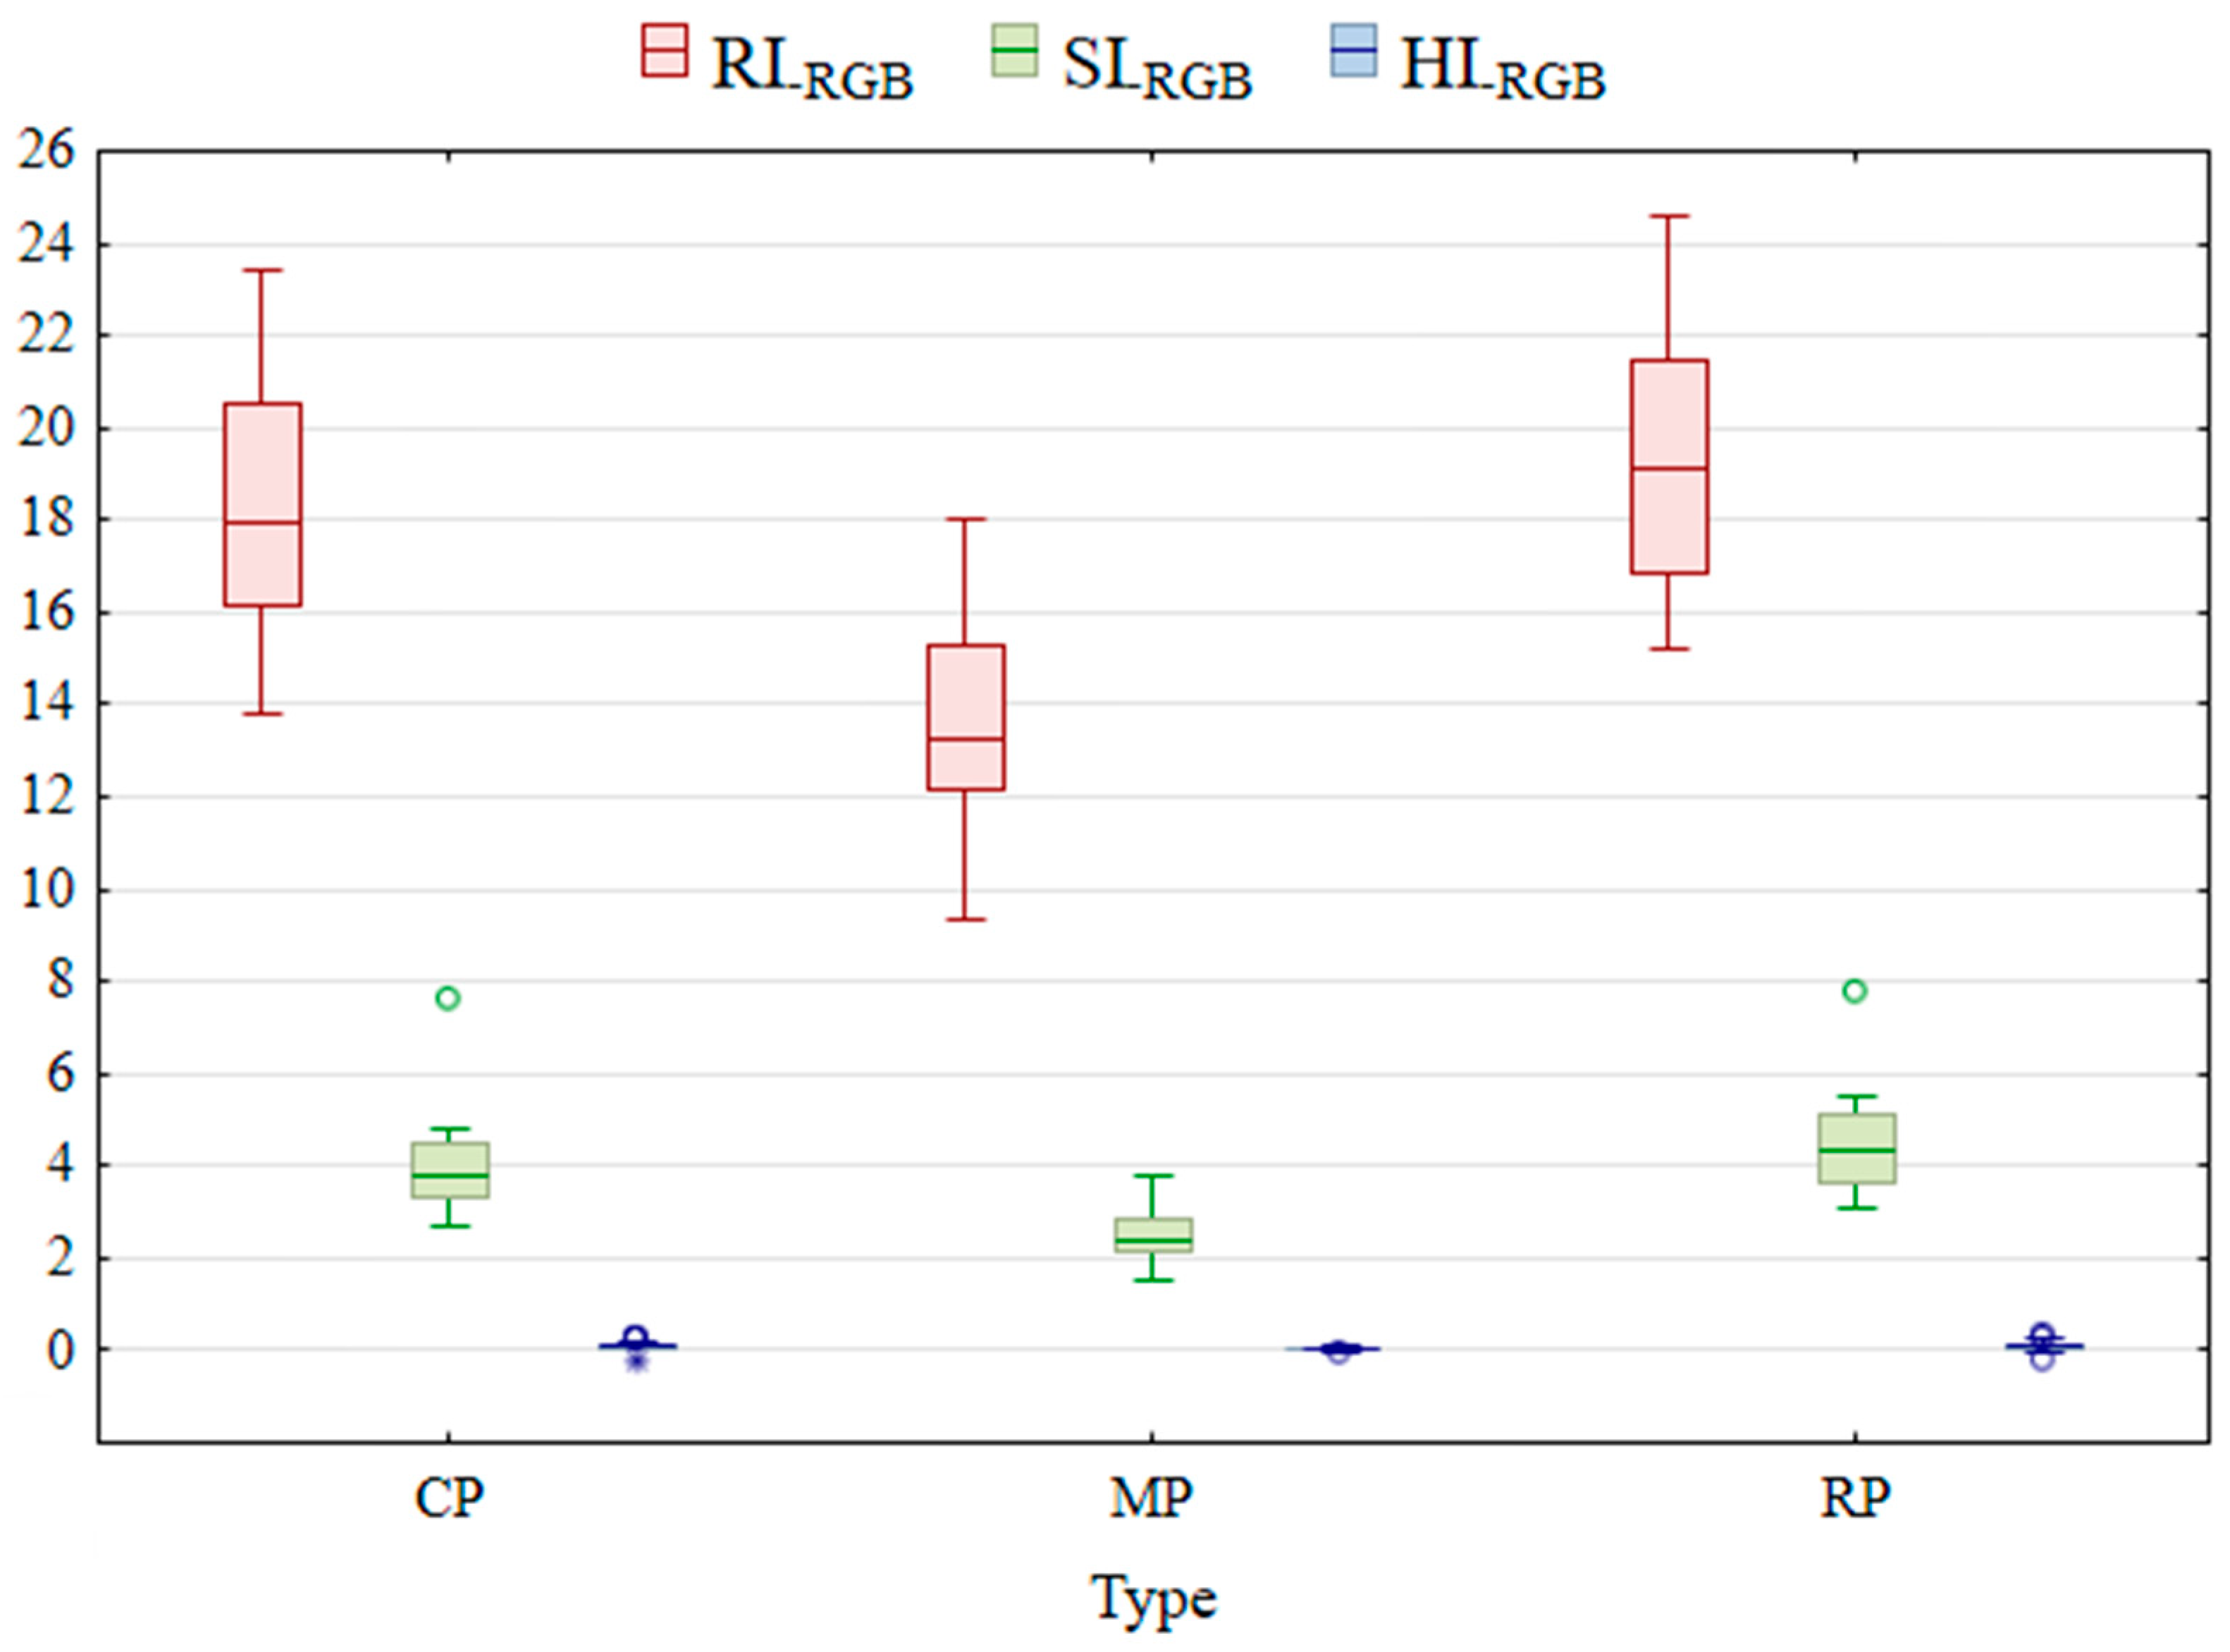
3.1. The Color of Urban Dust Particles

The lower values of the R and B parameters of the color on MPs compared to the CPs and RPs indicate darker colors, closer to black, and less red. The combination of RGB values of each sample also shows that the MPs are darker than the CPs and RPs (Figure 3). It was confirmed that the color of CPs, MPs, and RPs differed when separated with a magnet (Figure 4). In all cases, the MPs are dark, almost black, and oriented toward the applied magnetic field (Figure 5).
The MPs are perfectly oriented with the magnet; mainly spherical particles are observed, as well as particles of other shapes but to a lesser extent. The MPs are less than 50 microns in diameter (Figure 5).
The CPs had medians of 17.98, 3.78, and 0.11 for each one of the indices (RI, SI, and HI, respectively). Regarding standard deviation, RI had a value of 2.65, SI of 0.95, and HI had 0.08. Finally, the minimum and maximum values were 13.79 and 23.42 for RI, 2.71 and 7.60 for SI, and −0.17 and 0.26 for HI.
The RPs showed medians of 19.10, 4.37, and 0.13, with standard deviations of 2.74, 1.01, and 0.10, respectively. The minimum and maximum values were 15.20 and 24.58 for RI, 3.07 and 7.77 for SI, and lastly, −0.19 and 0.32 for HI.
The MPs were distinct, with medians of 13.28 for RI, 2.41 for SI, and 0.06 for HI. The standard deviations also showed notable differences, with values of 2.03, 0.49, and 0.04, respectively. More details can be found in the Supplementary Materials.
The K-W test indicates that MPs have a median RI value that differs from CPs and RPs. The median RI values are not different between complete particles and residual particles. MPs show a lower RI value between 9 and 19, indicating darker than CPs and RPs (Figure 6).
SI median comparison analysis indicates that the CPs and RPs are the same, but the MPs are statistically different and darker (Figure 6). Color saturation index, also known as saturation or color purity, is a measure of the intensity of a color. In simple terms, saturation describes how a color deviates from gray. A color with high saturation is very intense, while a color with low saturation appears more washed out or grayish.
The HI showed no significant differences between the mean values of the three particle types. This situation is logical, as the HI records the primary RGB colors, and the samples do not show chromatic variation. In other words, the HI represents the dominant color of the sample; when the dark or black MPs are separated, the dominant spectral color (hue) is not modified.

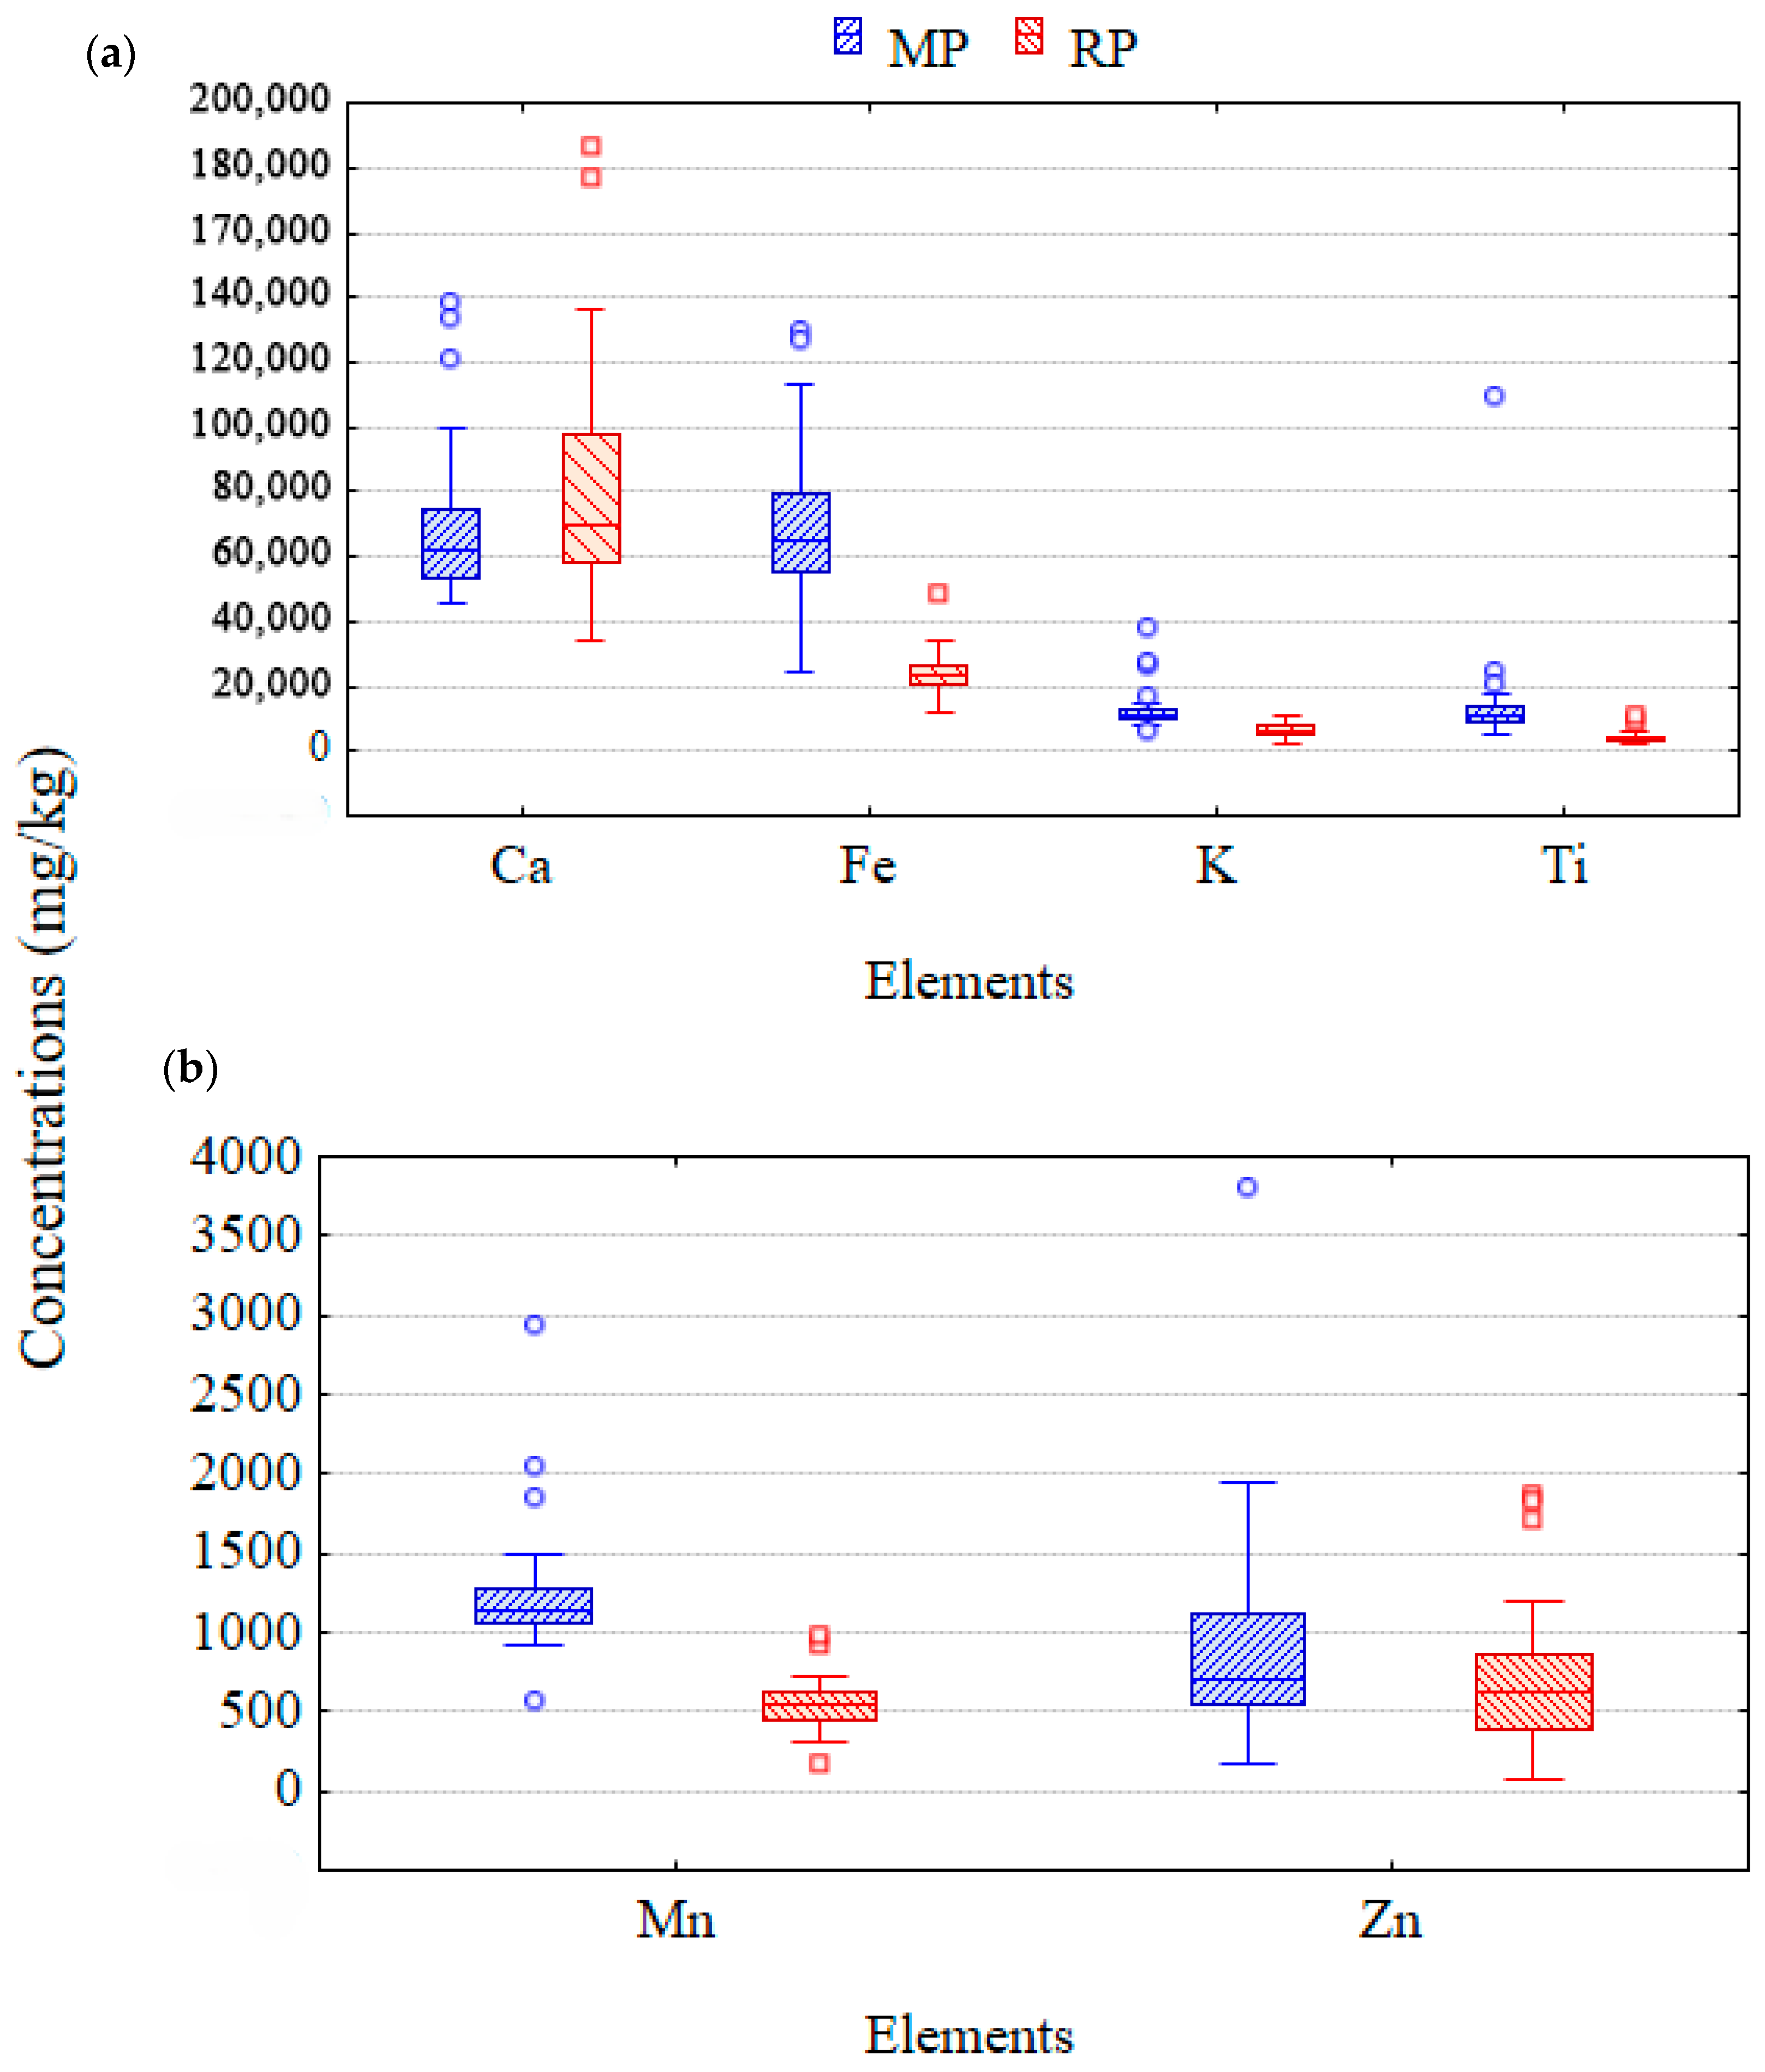
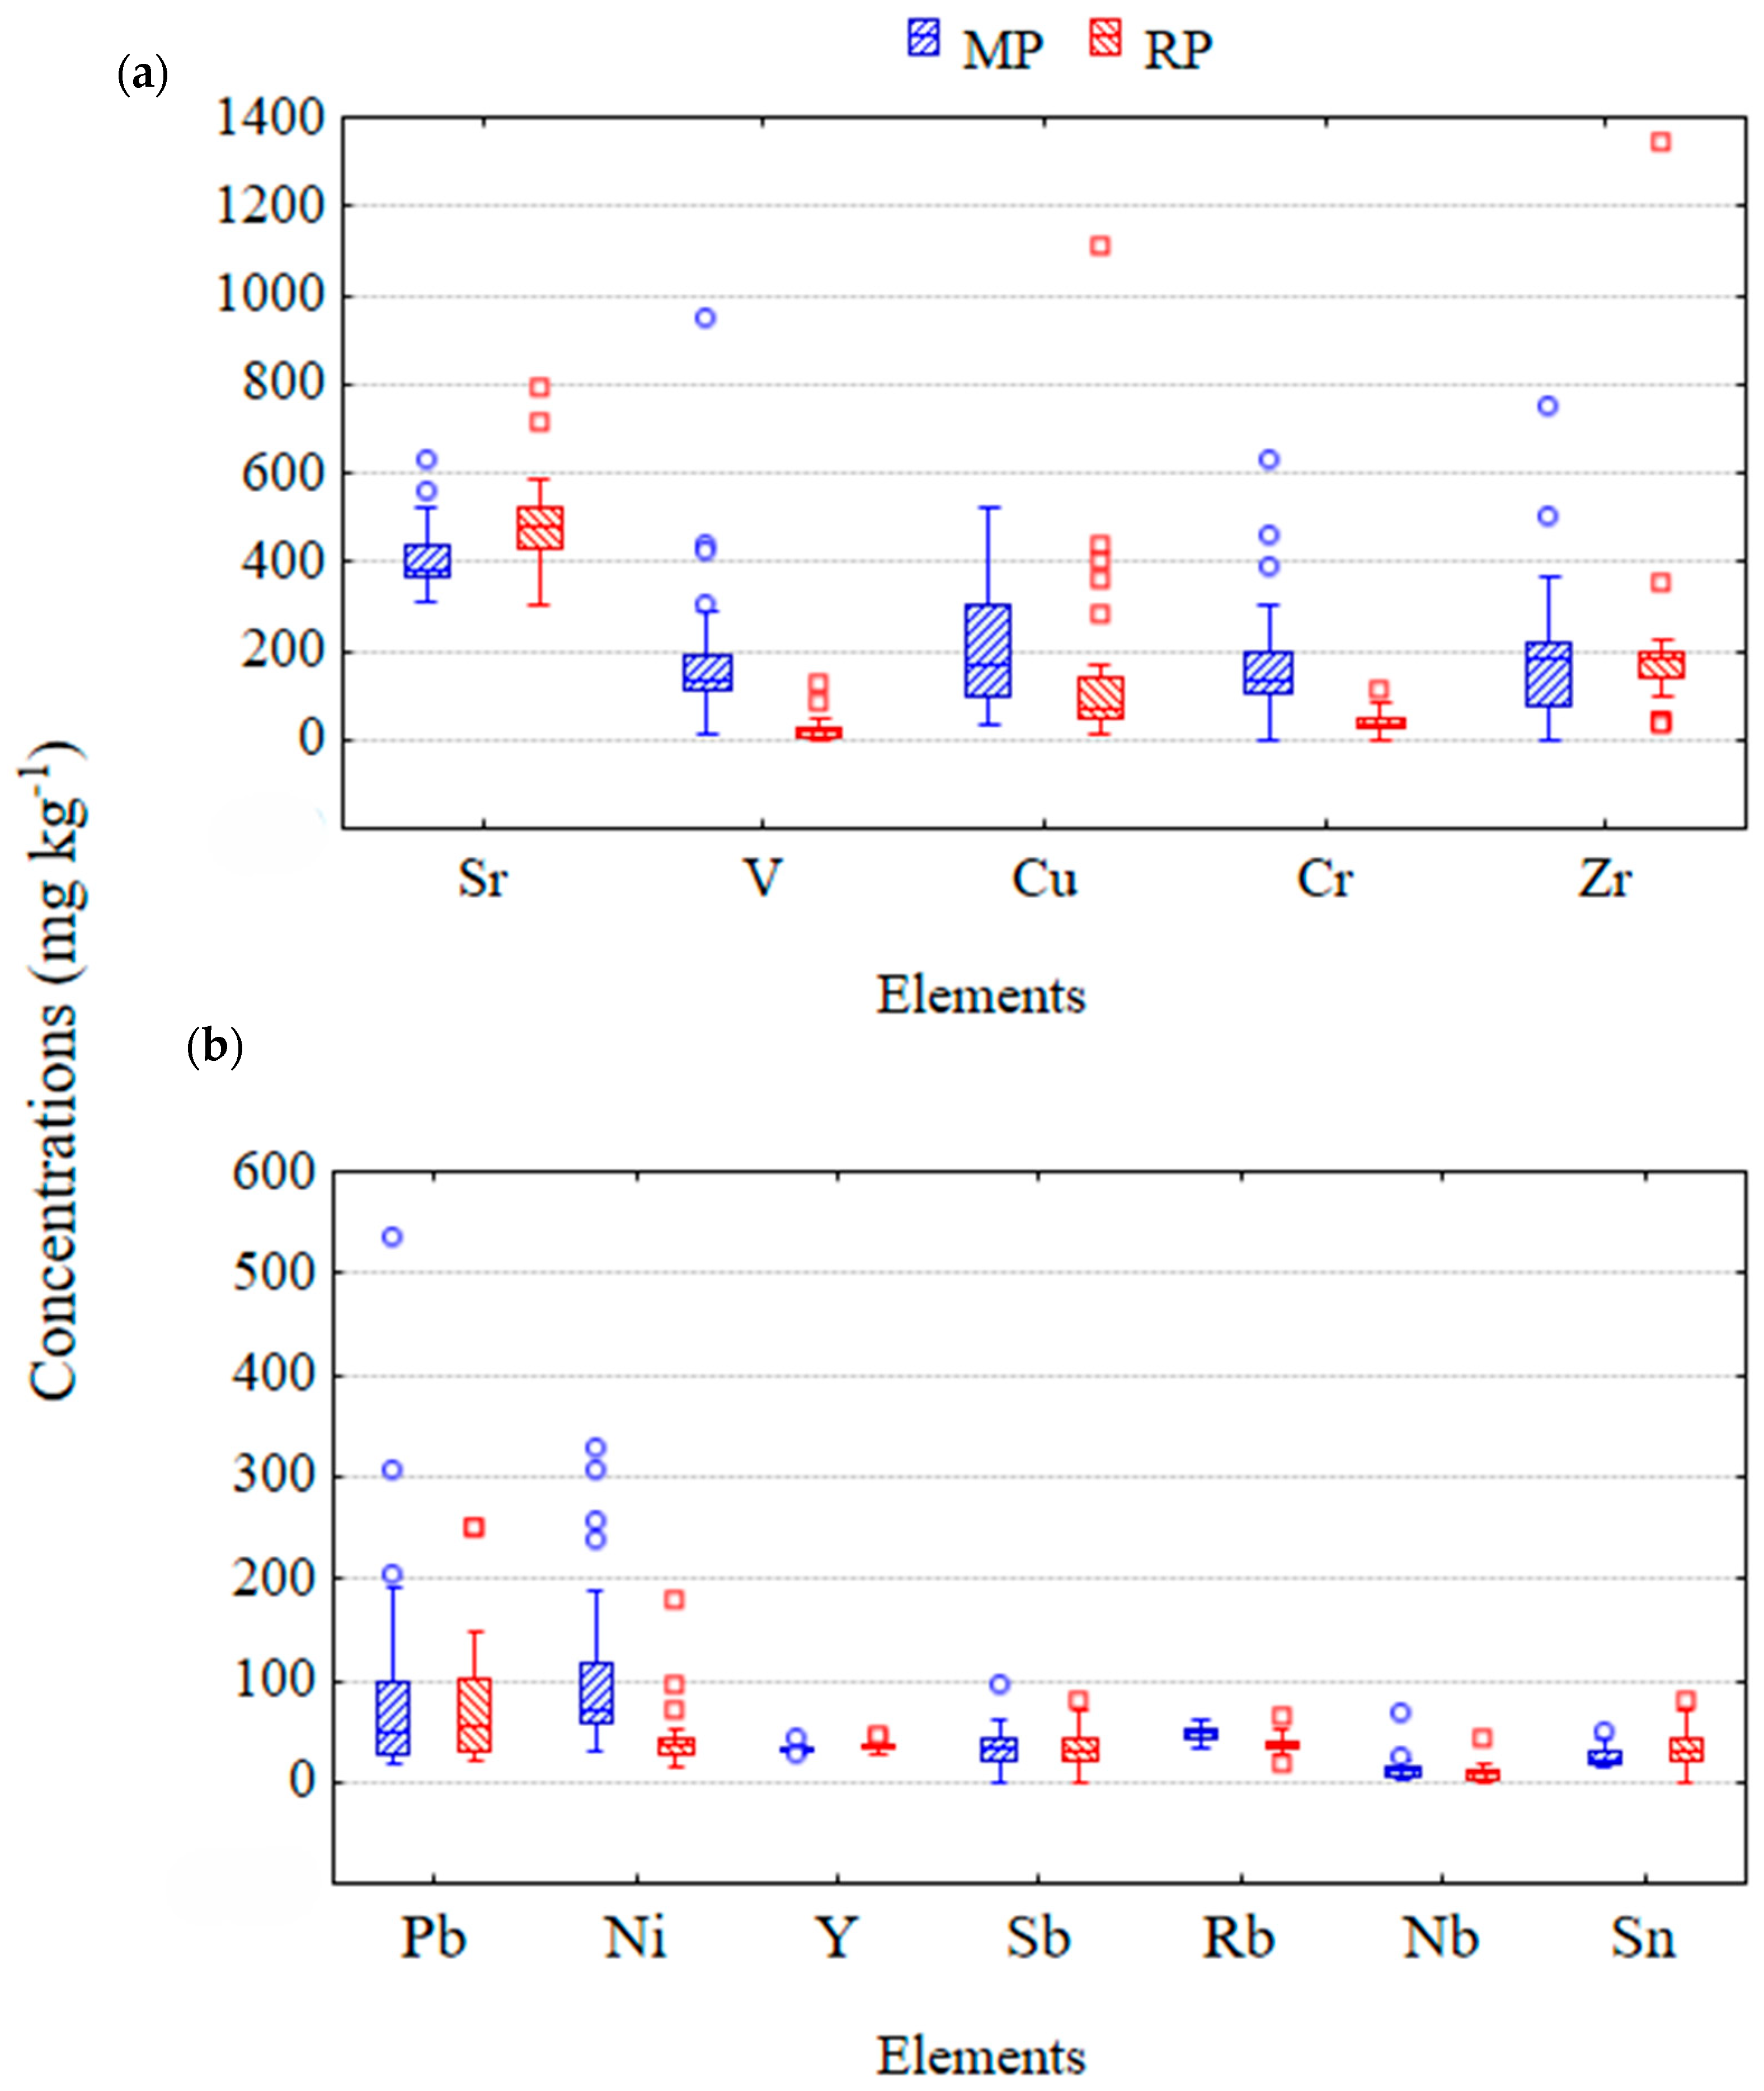
3.2. Concentrations of Potentially Toxic Elements in Magnetic and Residual Particles

No significant differences were found between MPs and RPs concerning Ca concentrations, but Fe, K, and Ti concentrations are higher in magnetic particles than in residual particles (Figure 7a). As expected, magnetic particles contain higher Fe concentrations, corresponding to darker colors due to the possible presence of magnetite and maghemite. Mn concentrations in the magnetic particles were also higher than in the residual particles, while zinc concentrations showed no significant differences (Figure 7b).
V and Cr concentrations were higher in MPs than in RPs, but this was not the case for Sr, Cu, and Zr (Figure 8a). We deduce that V and Cr come from anthropogenic particles related to combustion. Similarly, some samples of residual particles did not contain V and C, or their concentrations were lower than 116.8 mg kg−1.
Concentrations of Ni and Rb were higher in MPs than in RPs, more than double in the case of Ni (71.6 and 35.1 mg kg−1, respectively), and slightly higher in the case of Rb (48.8 and 37 mg kg−1, respectively). More details can be found in the Supplementary Materials.
The concentrations of Pb, Y, Sb, Nb, and Sn were not statistically different between the MPs and RPs. In several samples of both types of particles, some elements were below the practical detection limit (10 mg kg−1) (Figure 8b).

4. Discussion

The RI has been used to estimate the intensity of soil weathering and the contents of magnetite, maghemite, and dark colors in soil [15,18,32,33,34,35]; hematite in soils [32]; dark colors in urban dust [15]; dark colors and organic matter in soils [36]. The low IR values in this study appear to be associated with magnetic particles, probably magnetite and maghemite.
Color has already been studied as an indicator of heavy metal contamination in soils [35] and urban dust [17,18,19,20,34]; however, this is the first study in which magnetic particles are separated and changes in color and heavy metals associated with magnetic particles are reported. The Munsell table has been used successfully to group urban dust by color [18,19]. However, this method could be less precise than new electronic device techniques. Color systems such as the CIE L*a*b* [20,34] and RGB have also been used to group soil samples [37,38] and urban dust [19,33] by color; both have proven their effectiveness and reproducibility because they do not depend on the experience of the analyst.
The number and quantity of MP separated with the magnet were significant. These MPs are emerging contaminants because particles smaller than 10 microns can enter the human body by dermal contact, ingestion, or inhalation [4,5,6,7,8]. For example, respirable magnetite nanoparticles enter the human body through the respiratory tract and pass from the lung to the blood and from there to the brain, where they can cause various diseases and ailments [5,6,8,21].
In addition, MP contain higher concentrations of Fe, Mn, V, Cr, and Ni than RPs. V, Cr, and Ni are recognized as heavy metals toxic to human health [9,10,11], while Mn and Fe are considered emerging contaminants [39,40]. For example, when Mn enters the body in toxic quantities, it causes a disease called Manganism or manganic madness, an emerging disease in Mexico. Mn also causes postpartum depression and affects cognitive development in children [40,41].
Interestingly, Pb and Sb concentrations are not different between MPs and RPs because the sources of Pb and Sb are not exclusive to fossil fuel combustion; a significant source of Pb is paint, and a primary source of Sb is plastics. On the other hand, metals such as Fe, Mn, Cu, and Ni differ between MPs and RPs, with higher concentrations in MPs. This situation is probably related to the sources of contamination: Fe and Mn come primarily from automobile exhaust gases [16,18,20], Mn is used as a detonator in gasoline, Fe and Cu are in metals [16,17,21], and Cu and Ni are in automobile wear and brake pads [8,11,12]. However, this needs to be confirmed in future studies.
In this work, we have reported that MPs are found in urban dust from Mexico City with an increase in the magnetic signal, as other authors have noted; recent studies reveal that magnetic nanoparticles are damaging the health of young people living in Mexico City [42,43,44,45,46], one of the largest cities in the world.
This sentence is particularly alarming: “young urbanites from Mexico City have significant accumulation of magnetic subcortical nanoparticle, an issue of major concern because they inhale them, and they are massively exposed to magnetic fields” [6]. Given this prevailing situation in Mexico City and other cities in the country, it is urgent to implement a program to clean the streets and sidewalks of the town, considering that magnetic nanoparticles can be extracted using that same property, with high-power magnets adapted to cleaning trucks.

5. Conclusions

Urban dust is recognized as an environmental matrix of soil, water, and air. These elements usually contain contaminants, including heavy metals.
These contaminants in urban dust must be removed from the environment, and innovative management methods, such as magnetism, are currently being explored. The objective of this work was to evaluate whether the color of urban dust changes due to the removal of magnetic particles and, in turn, whether this separation process is efficient in the extraction of heavy metals. The potential of magnetism in this context is promising and could significantly contribute to environmental management.
The color variation in urban dust is associated with magnetic particles for both whole and residual particles. The saturation index <2.67 of magnetic particles in urban dust indicates contamination by heavy metals, such as Cr, Cu, Fe, Mn, Ni, Rb, Ti, V, and Zn. Other heavy metals, such as Pb and Sb, are in MPs and RPs. Color and magnetism of urban dust are the partiality-determining properties to identify samples contaminated with these toxic elements.
Magnetism proved efficient in removing MPs (ferrimagnetic, ferromagnetic, and paramagnetic particles) and some heavy metals, but other methods must be considered for the removal of Pb and Sb because these elements are found in MPs and RPs. However, due to the magnitude of the adverse effects of magnetic particles on human health, magnetism is a possible method of cleaning urban dust.

Supplementary Materials

The following supporting information can be downloaded at: https://www.mdpi.com/article/10.3390/atmos16040374/s1, Table S1: Concentrations of heavy metals in Complete Particles (CP); Table S2: Concentrations of heavy metals in Magnetic Particles (MP); Table S3: Concentrations of heavy metals in residual particles (RP); Table S4: RGB values and color index.

Author Contributions

F.B. and A.G. conceived the study design; A.M.-S., R.C., Á.G. and R.G. gathered and analyzed the data; A.M.-S. wrote the first draft of the paper; F.B. and A.G. provided input to the study; A.M.-S., Á.G. and F.B. designed and performed data analysis; F.B. and A.G. read the paper, revised it critically for important intellectual content, and gave their final approval for the version to be published. The guarantor of the paper is F.B. All authors have read and agreed to the published version of the manuscript.

Funding

This work was financed by the PAPIIT IN208621 project from Dirección General de Asuntos del Personal Académico (DGAPA) of the Universidad Nacional Autónoma de México (UNAM). A.M.-S. thanks DGAPA for the grant received.

Data Availability Statement

Data can be made available upon request.

Acknowledgments

We would like to express our sincere gratitude to Nancy Calderón Cortés Laboratory of Molecular Ecology of the ENES Morelia and to M. C. Felipe García Tenorio the Laboratory of Petrography (LPETRO) for allowing us to use their microscopes.

Conflicts of Interest

The authors declare no conflicts of interest.

Abbreviations

The following abbreviations are used in this manuscript:
CPsComplete Particles
MPsMagnetic Particles
RPsResidual Particles
RIRedness Index
SISaturation Index
HIHue Index

References

  1. WHO. Clean Air and Energy Access for Healthier Populations and Universal Health Coverage. 2023. Available online: https://cdn.who.int/media/docs/default-source/air-pollution-documents/air-quality-and-health/aqh_strategy_layout_v14_spreads.pdf?sfvrsn=918db48f_6&download=true (accessed on 7 August 2023).
  2. WHO. Air Pollution. 2023. Available online: https://www.who.int/health-topics/air-pollution#tab=tab_1 (accessed on 7 August 2023).
  3. Robledo Ardila, P.A.; Álvarez-Alonso, R.; Árcega-Cabrera, F.; Durán Valsero, J.J.; Morales García, R.; Lamas-Cosío, E.; Oceguera-Vargas, I.; DelValls, A. Assessment and Review of Heavy Metals Pollution in Sediments of the Mediterranean Sea. Appl. Sci. 2024, 14, 1435. [Google Scholar] [CrossRef]
  4. Briffa, J.; Sinagra, E.; Blundell, R. Heavy metal pollution in the environment and their toxicological effects on humans. Heliyon 2020, 6, e04691. [Google Scholar] [CrossRef] [PubMed]
  5. Calderón-Garcidueñas, L.; Ayala, A.; Mukherjee, P.S. United States Elections: Air Pollution, Neurodegeneration, Neuropsychiatric, and Neurodevelopmental Disorders. Who Cares? J. Alzheimer’s Dis. 2024, 98, 1277–1282. [Google Scholar]
  6. Calderón-Garcidueñas, L.; Cejudo-Ruiz, F.R.; Stommel, E.W.; González-Maciel, A.; Reynoso-Robles, R.; Torres-Jardón, R.; Tehuacanero-Cuapa, S.; Rodríguez-Gómez, A.; Bautista, F.; Goguitchaichvili, A.; et al. Single-domain magnetic particles with motion behavior under electromagnetic AC and DC fields are a fatal cargo in Metropolitan Mexico City pediatric and young adult early Alzheimer, Parkinson, frontotemporal lobar degeneration and amyotrophic lateral sclerosis and in ALS patients. Front. Hum. Neurosci. 2024, 18, 1411849. [Google Scholar] [CrossRef]
  7. Maher, B. Ubiquitous magnetite. Nat. Geosci. 2024, 17, 7. [Google Scholar]
  8. Calderón-Garcidueñas, L.; González-Maciel, A.; Mukherjee, P.S.; Reynoso-Robles, R.; Pérez-Guillé, B.; Gayosso-Chávez, C.; Torres-Jardón, R.; Cross, J.V.; Ahmed, I.A.; Karloukovski, V.V.; et al. Combustion-and friction-derived magnetic air pollution nanoparticles in human hearts. Environ. Res. 2019, 176, 108567. [Google Scholar]
  9. Jomova, K.; Alomar, S.Y.; Nepovimova, E.; Kuca, K.; Valko, M. Heavy metals: Toxicity and human health effects. Arch. Toxicol. 2024, 99, 153–209. [Google Scholar]
  10. Hammond, J.; Maher, B.A.; Gonet, T.; Bautista, F.; Allsop, D. Oxidative Stress, Cytotoxic and Inflammatory Effects of Urban Ultrafine Road-Deposited Dust from the UK and Mexico in Human Epithelial Lung (Calu-3) Cells. Antioxidants 2022, 11, 1814. [Google Scholar] [CrossRef]
  11. Aguilera, A.; Bautista, F.; Goguitchaichvili, A.; Garcia-Oliva, F. Health risk of heavy metals in street dust. Front. Biosci. 2021, 26, 327–345. [Google Scholar]
  12. Feißel, T.; Hesse, D.; Augustin, M.; Carl, D.; Kneisel, M.; Ritter, C. Regulation of brake particle emissions by Euro 7-requirements and trends in future chassis development. In International Munich Chassis Symposium; Springer: Berlin/Heidelberg, Germany, 2023; pp. 51–68. [Google Scholar]
  13. Xue, S.; Ke, W.; Zeng, J.; Tabelin, C.B.; Xie, Y.; Tang, L.; Xiang, C.; Jiang, J. Pollution prediction for heavy metals in soil-groundwater systems at smelting sites. Chem. Eng. J. 2023, 473, 145499. [Google Scholar]
  14. Roy, A.; Jha, A.K.; Kumar, A.; Bhattacharya, T.; Chakraborty, S.; Raval, N.P.; Kumar, M. Heavy metal pollution in indoor dust of residential, commercial, and industrial areas: A review of evolutionary trends. Air Qual. Atmos. Health 2024, 17, 891–918. [Google Scholar]
  15. Delgado-Iniesta, M.J.; Marín-Sanleandro, P.; Canca Pedraza, M.D.; Díaz-Pereira, E.; Sánchez-Navarro, A. Geoenvironmental and Health Indices to Assess the Hazardousness of Heavy Metals in Urban Dust in Schoolyards in Murcia, Spain. Toxics 2024, 12, 804. [Google Scholar] [CrossRef] [PubMed]
  16. Szczepaniak-Wnuk, I.; Górka-Kostrubiec, B. Magnetic particles in indoor dust as marker of pollution emitted by different outside sources. Stud. Geophys. Geod. 2016, 60, 297–315. [Google Scholar]
  17. Hu, X.F.; Li, M.; He, Z.C.; Cui, L.; Liu, R.; Wang, X.D.; Wang, Z.H. Magnetic responses to heavy metal pollution of the industrial soils in Shanghai: Implying the influences of anthropogenic magnetic dustfall on urban environment. J. Appl. Geophys. 2022, 197, 104544. [Google Scholar]
  18. Cortés, J.L.; Bautista, F.; Quintana, P.; Aguilar, D.; Goguichaishvili, A. The color of urban dust as an indicator of contamination by potentially toxic elements: The case of Ensenada, Baja California, Mexico. Rev. Chapingo Ser. Cienc. For. Ambiente 2015, 21, 255–266. [Google Scholar]
  19. Delgado-Iniesta, M.J.; Marín-Sanleandro, P.; Díaz-Pereira, E.; Bautista, F.; Romero-Muñoz, M.; Sánchez-Navarro, A. Assessment of Heavy Metals and Color as Indicators of Contamination in Street Dust of a City in SE Spain: Influence of Traffic Intensity and Sampling Location. Sustainability 2018, 10, 4105. [Google Scholar] [CrossRef]
  20. Aguilar, Y.; Bautista, F.; Quintana, P.; Aguilar, D.; Trejo-Tzab, R.; Goguitchaichvili, A.; Chan-Te, R. Color as a New Indirect Technique for the Identification of Road Dust Samples Contaminated with Potentially Toxic Elements: The Case of Mérida, Yucatán, Mexico. Atmosphere 2021, 12, 483. [Google Scholar] [CrossRef]
  21. Maher, B.A. Airborne magnetite-and iron-rich pollution nanoparticles: Potential neurotoxicants and environmental risk factors for neurodegenerative disease, including Alzheimer’s disease. J. Alzheimers Dis. 2019, 71, 361–375. [Google Scholar]
  22. Aguilera, A.; Morales, J.J.; Goguitchaichvili, A.; García-Oliva, F.; Armendariz-Arnez, C.; Quintana, P.; Bautista, F. Spatial distribution of magnetic material in urban road dust classified by land use and type of road in San Luis Potosí, Mexico. Air Qual. Atmos. Health 2020, 13, 951–963. [Google Scholar] [CrossRef]
  23. UN DESA. World Urbanization Prospects. The 2018 Revision. New York. 2019. Available online: http://www.demographicresearch.org/volumes/vol12/9/ (accessed on 8 February 2025).
  24. INEGI. Geología. Available online: https://www.inegi.org.mx/temas/geología (accessed on 8 February 2024).
  25. INEGI. Uso de Suelo y Vegetación. Available online: https://www.inegi.org.mx/temas/usosuelo/ (accessed on 8 February 2024).
  26. Viscarra-Rossel, R.A.; Fouad, Y.; Walter, C. Using a Digital Camera to Measure Soil Organic Carbon and Iron Contents. Biosyst. Eng. 2008, 100, 149–159. [Google Scholar] [CrossRef]
  27. Wyszecki, G.; Stiles, W.S. Color Science: Concepts and Methods, Quantitative Data and Formulae, 2nd ed.; Wiley: New York, NY, USA, 1982. [Google Scholar]
  28. Viscarra-Rossel, R.A.; Minasny, B.; Roudier, P.; McBratney, A.B. Colour Space Models for Soil Science. Geoderma 2006, 133, 320–337. [Google Scholar] [CrossRef]
  29. Method 6200: Field Portable X-Ray Fluorescence Spectrometry for the Determination of Element Concentration. US-EPA. Available online: https://www.epa.gov/sites/default/files/2015-12/documents/6200.pdf (accessed on 17 February 2024).
  30. Skyray Instruments. Genius 7000 XRF: Heavy Metals in Soil Handheld Analyzer, 1st ed.; Skyray Instruments: Jiangsu, China, 2019; pp. 15–16. [Google Scholar]
  31. Lozano, R.; Bernal, J.P. Characterization of a New Set of Eight Geochemical Reference Materials for XRF Major and Trace Element Analysis. Rev. Mex. Cienc. Geol. 2005, 22, 329–344. [Google Scholar]
  32. Torrent, J.; Barron, V.; Liu, Q. Magnetic Enhancement Is Linked to and Precedes Hematite Formation in Aerobic Soil. Geophys. Res. Lett. 2006, 33, 1–4. [Google Scholar] [CrossRef]
  33. Levin, N.; Ben-Dor, E.; Singer, A. A Digital Camera as a Tool to Measure Colour Indices and Related Properties of Sandy Soils in Semi-Arid Environments. Int. J. Remote Sens. 2005, 26, 5475–5492. [Google Scholar] [CrossRef]
  34. García, R.; Delgado, C.; Cejudo, R.; Aguilera, A.; Gogichaishvili, A.; Bautista, F. The color of urban dust as an indicator of heavy metal pollution. Rev. Chapingo Ser. Cienc. For. Ambiente 2020, 26, 3–15. [Google Scholar] [CrossRef]
  35. Bautista, F.; Goguitchaichvili, A.; Delgado, F.; Quintana, P.; Aguilar, D.; Cejudo, R.; Cortés, J. El color como indicador de contaminación por metales pesados en suelos de la Ciudad de México. Bol. Soc. Geol. Mex 2021, 73, A210920. [Google Scholar] [CrossRef]
  36. Schmidt, S.A.; Ahn, C. Predicting forested wetland soil carbon using quantitative color sensor measurements in the region of northern Virginia, USA. J. Environ. Manag. 2021, 300, 113823. [Google Scholar] [CrossRef]
  37. Morozzi, P.; Ballarin, B.; Arcozzi, S.; Brattich, E.; Lucarelli, F.; Nava, S.; Gómez-Cascales, P.J.; Orza, J.A.; Tositti, L. Ultraviolet–Visible Diffuse Reflectance Spectroscopy (UV–Vis DRS), a rapid and non-destructive analytical tool for the identification of Saharan dust events in particulate matter filters. Atmos. Environ. 2021, 252, 118297. [Google Scholar] [CrossRef]
  38. Guo, X.; Tian, Z.; Zhao, Y.; Su, X. Impact of urban air pollutants on the night sky brightness and color in Hohhot. Sustain. Cities Soc. 2023, 96, 104671. [Google Scholar] [CrossRef]
  39. McRae, N.; Bello, G.; Svensson, K.; Solano-González, M.; Wright, R.J.; Niedzwiecki, M.M.; Torres-Calapiz, M.; Amarasiriwardena, C.; Schnaas, L.; Tamayo-Ortiz, M.; et al. Blood manganese levels during pregnancy and postpartum depression: A cohort study among women in Mexico. NeuroToxicology 2020, 76, 83–190. [Google Scholar] [CrossRef]
  40. Hernández-Bonilla, D.; Schilmann, A.; Montes, S.; Rodríguez-Agudelo, Y.; Rodríguez-Dozal, S.; Solís-Vivanco, R.; Ríos, C.; Rojas-Rodríguez, H. Environmental exposure to manganese and motor function of children in Mexico. NeuroToxicology 2011, 32, 615–621. [Google Scholar] [CrossRef] [PubMed]
  41. Ramírez-Ayala, R.; Azcona-Cruz, M.I. Efectos tóxicos del manganeso. Rev. Esp. Med-Quir. 2017, 22, 71–75. Available online: https://www.medigraphic.com/pdfs/quirurgicas/rmq-2017/rmq172d.pdf (accessed on 8 February 2024).
  42. Aguilera, A.; Bautista, F.; Gogichaishvili, A.; Gutiérrez-Ruiz, M.E.; Ceniceros-Gómez, A.E.; López-Santiago, N.R. Spatial distribution of manganese concentration and load in street dust in Mexico City. Salud Publica Mex. 2020, 62, 147–155. [Google Scholar] [CrossRef] [PubMed]
  43. Ng, N.; Wan Ibrahim, W.A.; Sutirman, Z.A.; Sanagi, M.M.; Abdul Keyon, A.S. Magnetic nanomaterials for preconcentration and removal of emerging contaminants in the water environment. Nanotechnol. Environ. Eng. 2023, 8, 297–315. [Google Scholar] [CrossRef]
  44. Maher, B.A.; Ahmed, I.A.; Karloukovski, V.; MacLaren, D.A.; Foulds, P.G.; Allsop, D.; Mann, D.M.; Torres-Jardón, R.; Calderon-Garciduenas, L. Magnetite pollution nanoparticles in the human brain. Proc. Natl. Acad. Sci. USA 2016, 113, 10797–10801. [Google Scholar] [CrossRef]
  45. Coccini, T.; Caloni, F.; Ramirez Cando, L.J.; De Simone, U. Cytotoxicity and proliferative capacity impairment induced on human brain cell cultures after short-and long-term exposure to magnetite nanoparticles. J. Appl. Toxicol. 2017, 37, 361–373. [Google Scholar] [CrossRef]
  46. Collingwood, J.F.; Telling, N.D. Iron oxides in the human brain. In Iron Oxides: From Nature to Applications; Faivre, D., Ed.; John Wiley & Sons: Berlin, Germany, 2016; pp. 143–176. [Google Scholar]
Figure 1. Location of the study area. We collected two samples of urban dust at each sampling site of the MZVM.
Atmosphere 16 00374 g001
Figure 2. The RGB model, black (R = G = B = 0) to white (R = G = B = 255) (Modified from [26]). Where R corresponds to the red component, G is the green component, and B is the blue component from the RGB color model.
Atmosphere 16 00374 g002
Figure 3. Soil colors in particles from urban dust. The full name of the sample is the complete particles (CPs), RPs are the residual particles, and MPs are the magnetic particles.
Atmosphere 16 00374 g003
Figure 4. Examples of the subsamples: (a) complete particles; (b) residual particles; and (c) magnetic particles.
Atmosphere 16 00374 g004
Figure 5. Magnetic particles reacting to magnets. The particles exhibit a characteristic agglomeration of elongated structures or ‘spikes’ when subjected to a magnetic field.
Atmosphere 16 00374 g005
Figure 6. Comparison of color index among complete particles (CPs), magnetic particles (MPs), and residual particles (RPs).
Atmosphere 16 00374 g006
Figure 7. Comparison between concentrations in magnetic and residual particles: (a) Ca, Fe, K, and Ti; (b) Mn and Zn.
Atmosphere 16 00374 g007
Figure 8. Comparison between concentrations in magnetic and residual particles: (a) Sr, V, Cu, Cr, and Zr; (b) Pb, Ni, Y, Sb, Rb, Nb, and Sn.
Atmosphere 16 00374 g008
Disclaimer/Publisher’s Note: The statements, opinions and data contained in all publications are solely those of the individual author(s) and contributor(s) and not of MDPI and/or the editor(s). MDPI and/or the editor(s) disclaim responsibility for any injury to people or property resulting from any ideas, methods, instructions or products referred to in the content.

