Article

Reduction in Anthropogenic CO2 Emissions Detected Through Two Decades of Observation in the Tokyo Metropolitan Area

1
Center for Environmental Science in Saitama, 914 Kamitanadare, Kazo 347-0115, Saitama, Japan
2
Asia Center for Air Pollution Research, 1182 Sowa, Nishi-ku, Niigata 950-2144, Niigata, Japan
*
Author to whom correspondence should be addressed.
Atmosphere 2025, 16(4), 364; https://doi.org/10.3390/atmos16040364
Submission received: 30 January 2025 / Revised: 15 March 2025 / Accepted: 21 March 2025 / Published: 24 March 2025
(This article belongs to the Section Air Quality)

Abstract

:
Reducing CO2 emissions is a global goal aimed at mitigating climate change, but such reductions must be scientifically tracked and verified based on long-term observational data. We analyzed the long-term trend in CO2 concentration observed for a period of 19 years from 2002 to 2020 at two stations in the vicinity of Tokyo, one near a mountain summit and the other suburban. The CO2 concentration was higher at the suburban station than at the mountain station, while the annual rate of increase was lower at the suburban station than at the mountain station. The difference between the CO2 concentrations at the suburban and mountain stations (ΔCO2*) showed a significant decreasing trend over the two decades. The long-term trends (−1.39 ± 0.24% yr−1) of winter-nighttime ΔCO2* closely matched the trends (−1.54 ± 0.11% yr−1) of anthropogenic CO2 emissions in the region around the two stations. Based on this similarity, we conclude that the decreasing trend in ΔCO2* corresponds to a reduction in anthropogenic CO2 emissions around the Tokyo Metropolitan Area. This is the first evidence of two-decade-scale reductions in urban CO2 emissions from long-term continuous CO2 concentration monitoring.

1. Introduction

Long-term measurements of CO2 concentrations in the atmosphere show rapid increases due to human activity [1]. Urgent action to reduce CO2 emissions is crucial for mitigating climate change. Currently, global efforts are increasing to meet the goals of the 2015 Paris Agreement, which aims to limit global warming to well below 2.0 °C, preferably below 1.5 °C, compared to pre-industrial levels.
Urban emissions of greenhouse gases, including CO2 and CH4, were estimated to be about 67–72% of the global share in 2020 and continue to increase [2]. However, the emission inventories for fossil fuel CO2 in urban areas are considered to have large uncertainties because specific fuels and sources are omitted, and the estimation methods for transportation emissions differ [3]. Therefore, it is critical to better understand the characteristics of urban CO2 emissions and reduce the uncertainty in the emission inventories [4,5,6,7]. Additionally, better science-based information is necessary for tracking and verifying CO2 emission reduction in urban areas based on observation systems involving satellites, aircraft, and surface-based measurements, as well as modeling methods.
Recently, dense CO2 monitoring networks have been developed in some urban areas, such as the San Francisco Bay area [8]; Los Angeles [9]; Indianapolis [10]; Baltimore and Washington, DC [11]; and Paris [12]. Furthermore, some estimates of anthropogenic CO2 emissions in urban areas based on ground-based measurements and inversion modeling systems have been conducted over periods ranging from 1 to 6 years in cities such as Paris [12], Boston [13], Indianapolis [14], and Tokyo [15,16]. Among them, Lian et al. [12] conducted six-year atmospheric inversions to estimate the urban CO2 emissions in the Paris metropolitan area, revealing a long-term decreasing trend in annual CO2 emissions in the Paris region. However, to our knowledge, there are no research findings that have verified decadal-scale trends in CO2 emissions in cities based on long-term observational CO2 concentration data.
The Tokyo Metropolitan Area (TMA) is the most densely populated and most economically active urban region in the world. In the Kanto Plain (32,400 km2), including the TMA and its surrounding areas, the CO2 emissions for the year 2015 were estimated to be 321 Mt, accounting for 25% of Japan’s total emissions during that year [17]. In Japan, efforts are underway to achieve carbon neutrality (CN) by 2050. According to emission inventories, Japan’s anthropogenic CO2 emissions are decreasing [18], and this trend is similar to that in the TMA [17]. On the other hand, Luqman et al. [19] found that urban CO2 emissions are increasing in Tokyo. In this way, there are large uncertainties in estimating emission trends. Therefore, it is important to scientifically verify the long-term trend in CO2 emissions based on observational data.
Precise long-term continuous measurements of CO2 have been conducted by the Center for Environmental Science in Saitama (CESS) at two locations in Saitama Prefecture in the western part of the TMA, namely, the Dodaira Mountain (DDR) and Kisai (KIS) stations. Both stations belong to a long-term and continuous CO2 monitoring network consisting of 184 stations worldwide, and the CO2 concentration data measured at both stations are regularly reported to the World Data Centre for Greenhouse Gases of the World Meteorological Organization (WDCGG/WMO) [20]. Observations began in the DDR station in 1992 and in the KIS station in 2000. Stable measurements at the DDR and KIS stations were established in 1993 and 2002, respectively. Long-term monitoring at two stations, one in the nearby mountains and the other suburban, is considered rare, not only in Japan but also globally. Analyzing the observed concentrations at these stations, especially the long-term trend in their concentration difference, has the potential to answer questions about the long-term temporal changes in CO2 emissions, particularly whether urban emissions are indeed decreasing in this area.
This study aimed to detect the reduction in anthropogenic CO2 emissions in the urban area near Tokyo by analyzing approximately 20 years (2002 to 2020) of CO2 concentration monitoring data from the DDR and KIS stations, which are separated by approximately 34 km horizontally and 800 m vertically. Finally, this study demonstrated that long-term, continuous, and high-precision observations of CO2 concentrations at two stations can scientifically track and verify the effectiveness of decadal-scale reduction in CO2 emissions within an urban area.

2. Materials and Methods

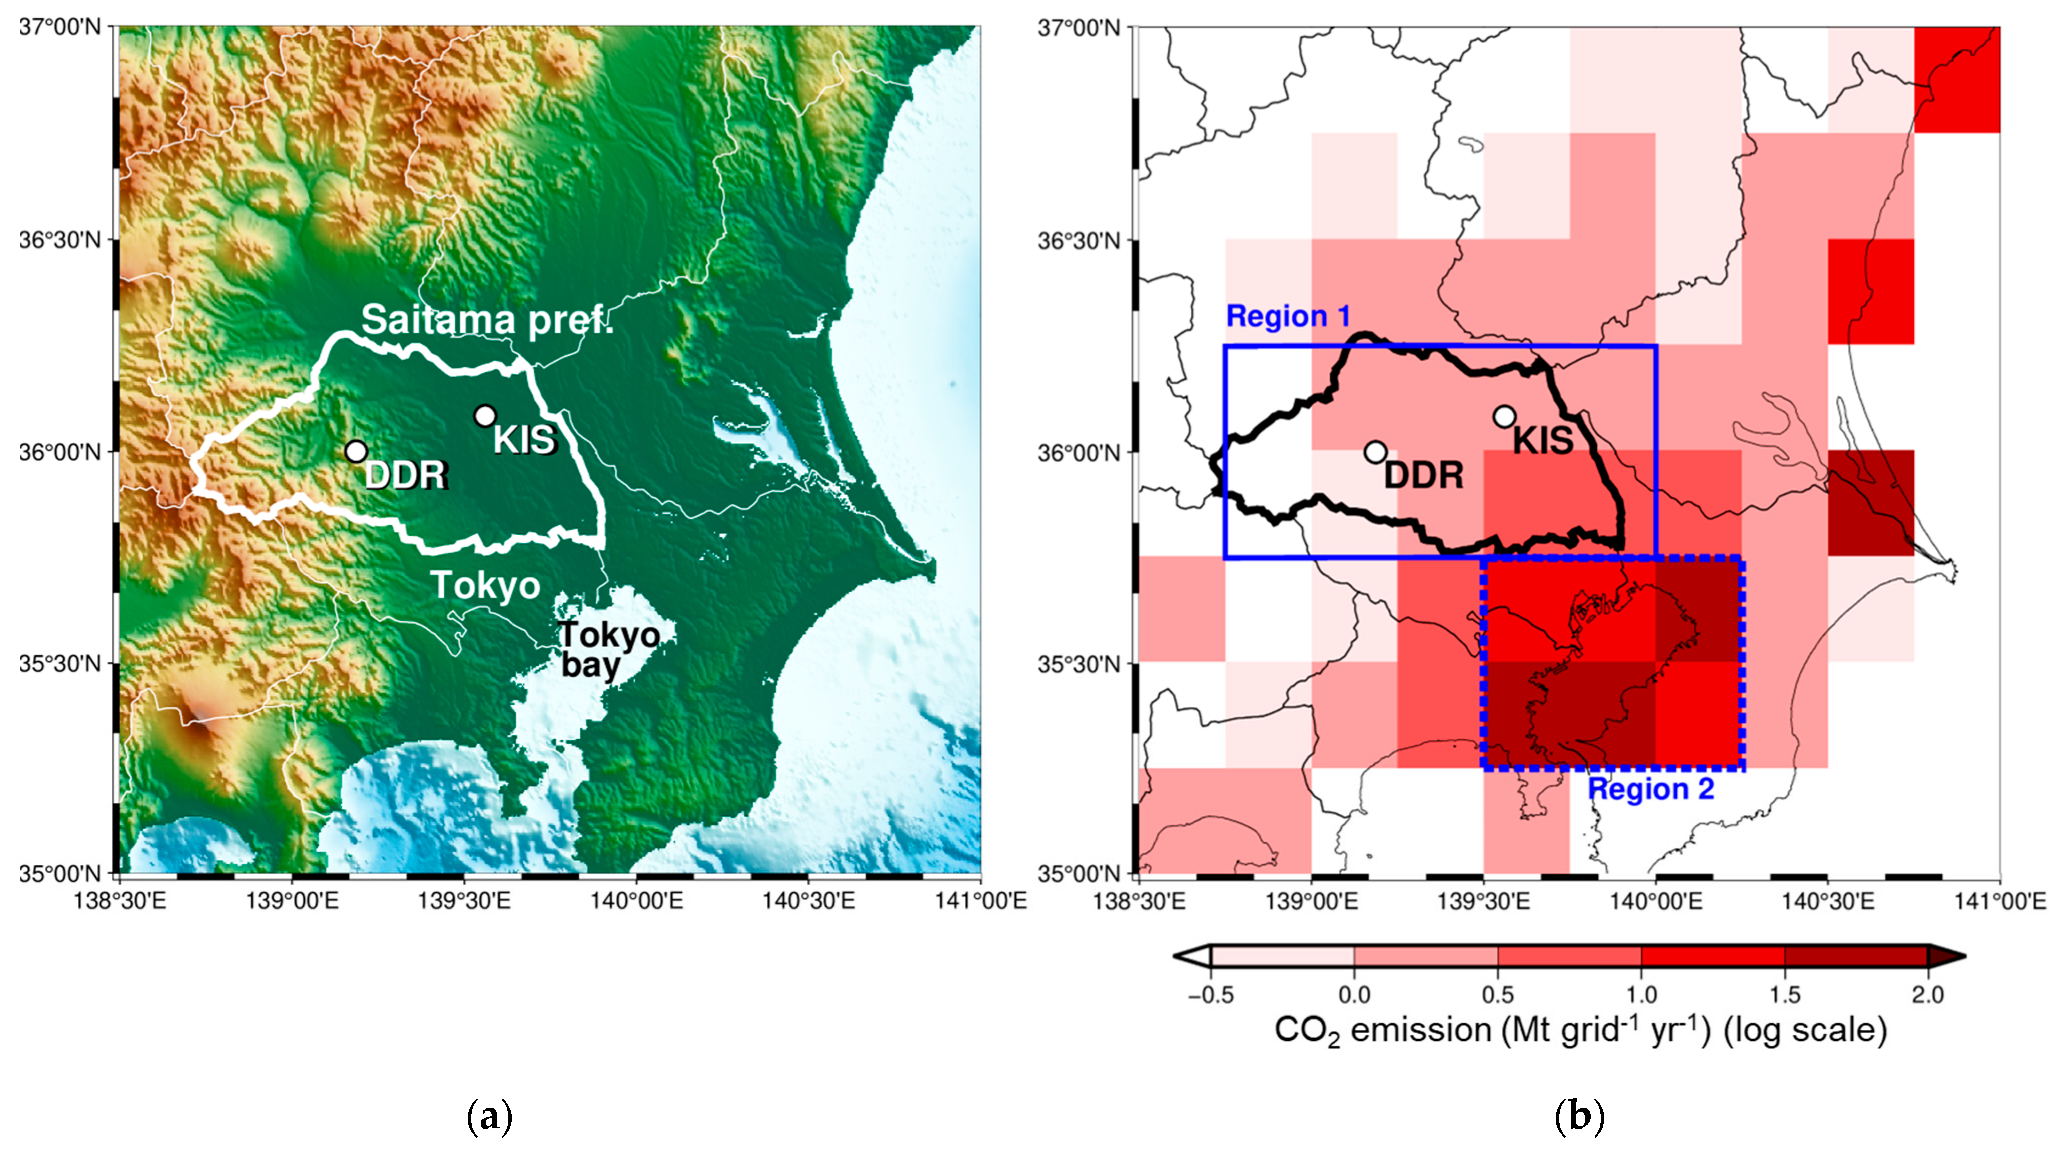
2.1. Observed CO2 Concentration Data

In this study, we measured CO2 concentrations simultaneously at two monitoring stations in the TMA over 20 years (Figure 1a). The DDR station (elevation 832 m) is near a summit at the west end of the Kanto Plain (Figure 1a). The KIS station (elevation 14 m) is approximately 34.4 km away from the DDR and is located in a suburban area mainly surrounded by rice paddies [21]. Both stations have been registered with the WDCGG/WMO, and DDR data were used in the global analysis of CO2 concentrations [22]. The CO2 measurement method was almost the same as that used by the Japan Meteorological Agency [23]. Non-dispersive infrared absorption (NDIR) systems were used to measure CO2 concentrations at both stations. The following automatic procedure was applied to introduce sample air into the system: (1) an air sample was collected through an intake at the top of a tower (20 m above ground), (2) the air was filtered to remove aerosols, (3) water vapor was removed from the air using three stages of dehumidifiers, and then (4) the air was introduced into the NDIR system. At both stations, the NDIR system was calibrated against four working standard gases (390, 410, 430, and 450 ppmv CO2) and a reference gas (380 ppmv) every 2 h. The working standard gases were calibrated with standard gases from the Japan Meteorological Agency (JMA), and the reproducibility of the calibration system for CO2 concentration, which is configured via NDIR as with the observation system, which was less than ±0.02 ppmv. The JMA manages CO2 standard gases calibrated with WMO standard gases to ensure the traceability of observed values. The accuracy of the CO2 measurements was subject to an error of within 0.2 ppmv. We used the CO2 concentration data (1 h averages of 1 s measurement data) for the 19-year period from 2002 to 2020. These hourly CO2 concentration data are obtainable from the WDCGG website [24,25]. At both observation sites, there were no missing data exceeding one month during the target period.

2.2. Anthropogenic CO2 Emission Data

In this study, we utilized two different datasets of anthropogenic CO2 emission inventories with varying spatial scales to compare with the trends in the observed CO2 concentrations. The first dataset is the Regional Emission Inventory in Asia (REAS) version 3.2.1, which provides sectoral emission data of air and climate pollutants from major anthropogenic sources in East, Southeast, and South Asia, covering the period from 1950 to 2005 [17]; this is a gridded inventory of fossil fuel CO2 emissions (Figure 1b) at a spatial resolution of 0.25° and a monthly temporal resolution. This dataset was extrapolated to the year 2020 for the Kanto area using the methodology of REAS version 3.2.1 [17]. The second dataset covers the period from 2007 to 2020 and includes annual anthropogenic CO2 emissions data (total emissions from energy-related and non-energy-related CO2 sources) for Saitama Prefecture (see Figure 1a), which is the prefectural government for the areas in which the KIS and DDR stations are located [26]. This dataset is compiled by the Saitama Prefectural Government and CESS. This dataset was extrapolated back to the year 2002 using regional statistical data on energy consumption by sectors (industry, residential, and road transport) as proxy indicators of the emissions.

2.3. Analysis Methods

We analyzed the long-term trend in CO2 concentration observed over a period of 19 years, from 2002 to 2020, at two stations (KIS and DDR). In particular, we focused on analyzing the difference in CO2 concentrations between the suburban (KIS) and mountain (DDR) stations (ΔCO2*). The CO2 concentration at KIS, located near the surface in a suburban area, is strongly influenced by CO2 emissions from surrounding urban areas, whereas the CO2 concentration at DDR, situated at an altitude of 832 m in a mountainous area, is less affected. Therefore, ΔCO2* is assumed to be sensitive to urban CO2 emissions. The long-term trends in ΔCO2* were compared with the trends in anthropogenic CO2 emissions for the period from 2002 to 2020. To compare the trends in ΔCO2* and anthropogenic CO2 emissions in the region around the two stations, we normalized their annual values by the average value over the entire period (19 years, from 2002 to 2020) and then analyzed their relationship. To investigate whether ΔCO2* corresponded to the anthropogenic CO2 emissions in the region around the two stations, we analyzed the relationship between ΔCO2* and the meteorological variables (wind speed and wind direction measured at KIS and temperature differences between DDR and KIS). The meteorological hourly data were obtained from the WDCGG website [24,25].

3. Results and Discussion

3.1. Long-Term Variations in CO2 Concentrations

The CO2 concentration was highest at KIS, followed by DDR and the global mean (Figure 2a). The CO2 concentration at KIS (CO2,KIS) was more influenced by anthropogenic CO2 emissions from TMA than those at DDR (CO2,DDR). Similar to the global mean (CO2,GLOBAL), both CO2,KIS and CO2,DDR showed a long-term increasing trend with seasonal variations (minimum in summer and maximum in winter), with rates of 2.06 ppmv yr−1 for KIS, 2.15 ppmv yr−1 for DDR, and 2.19 ppmv yr−1 for the global mean. These annual trends were estimated as slopes from simple linear regression analyses (Figure 2a). Compared to the global annual increase, the rise in CO2,DDR was slightly lower, and the rise in CO2,KIS, significantly influenced by the urban area, was even lower. This suggests the possibility of a reduction in anthropogenic CO2 emissions in the region around KIS.
We focused on the temporal changes in the CO2 concentration differences (ΔCO2) between the two stations, KIS and DDR, as well as with the global mean, and we analyzed their relationship with regional CO2 emissions. The long-term trend in the annual mean of the CO2 concentration difference between KIS and DDR (ΔCO2*) significantly decreased during the 2002–2020 period at an annual rate of −0.11 ± 0.024 ppmv yr−1 (p = 0.00026) (Figure 2b). The long-term trend in ΔCO2 between KIS and the global mean similarly and significantly decreased over these 19 years at an annual rate of −0.15 ± 0.033 ppmv yr−1 (p = 0.00031). Although the ΔCO2 between DDR and the global mean decreased over this period at an annual rate of −0.04 ± 0.029 ppmv yr−1, the trend was not significant (p = 0.21). Thus, while the concentration difference between DDR and the global mean did not significantly change over this period, the differences between KIS and the global level, as well as between KIS and DDR, significantly decreased. The implication is that the CO2 emitted from the urban area substantially influences the CO2 concentrations observed at KIS, which have decreased over these 19 years. Additionally, the interannual variations in ΔCO2 between the two observations, as well as with the global mean, are considered to be caused by interannual variations in regional meteorological fields, regional CO2 emissions, and other factors.

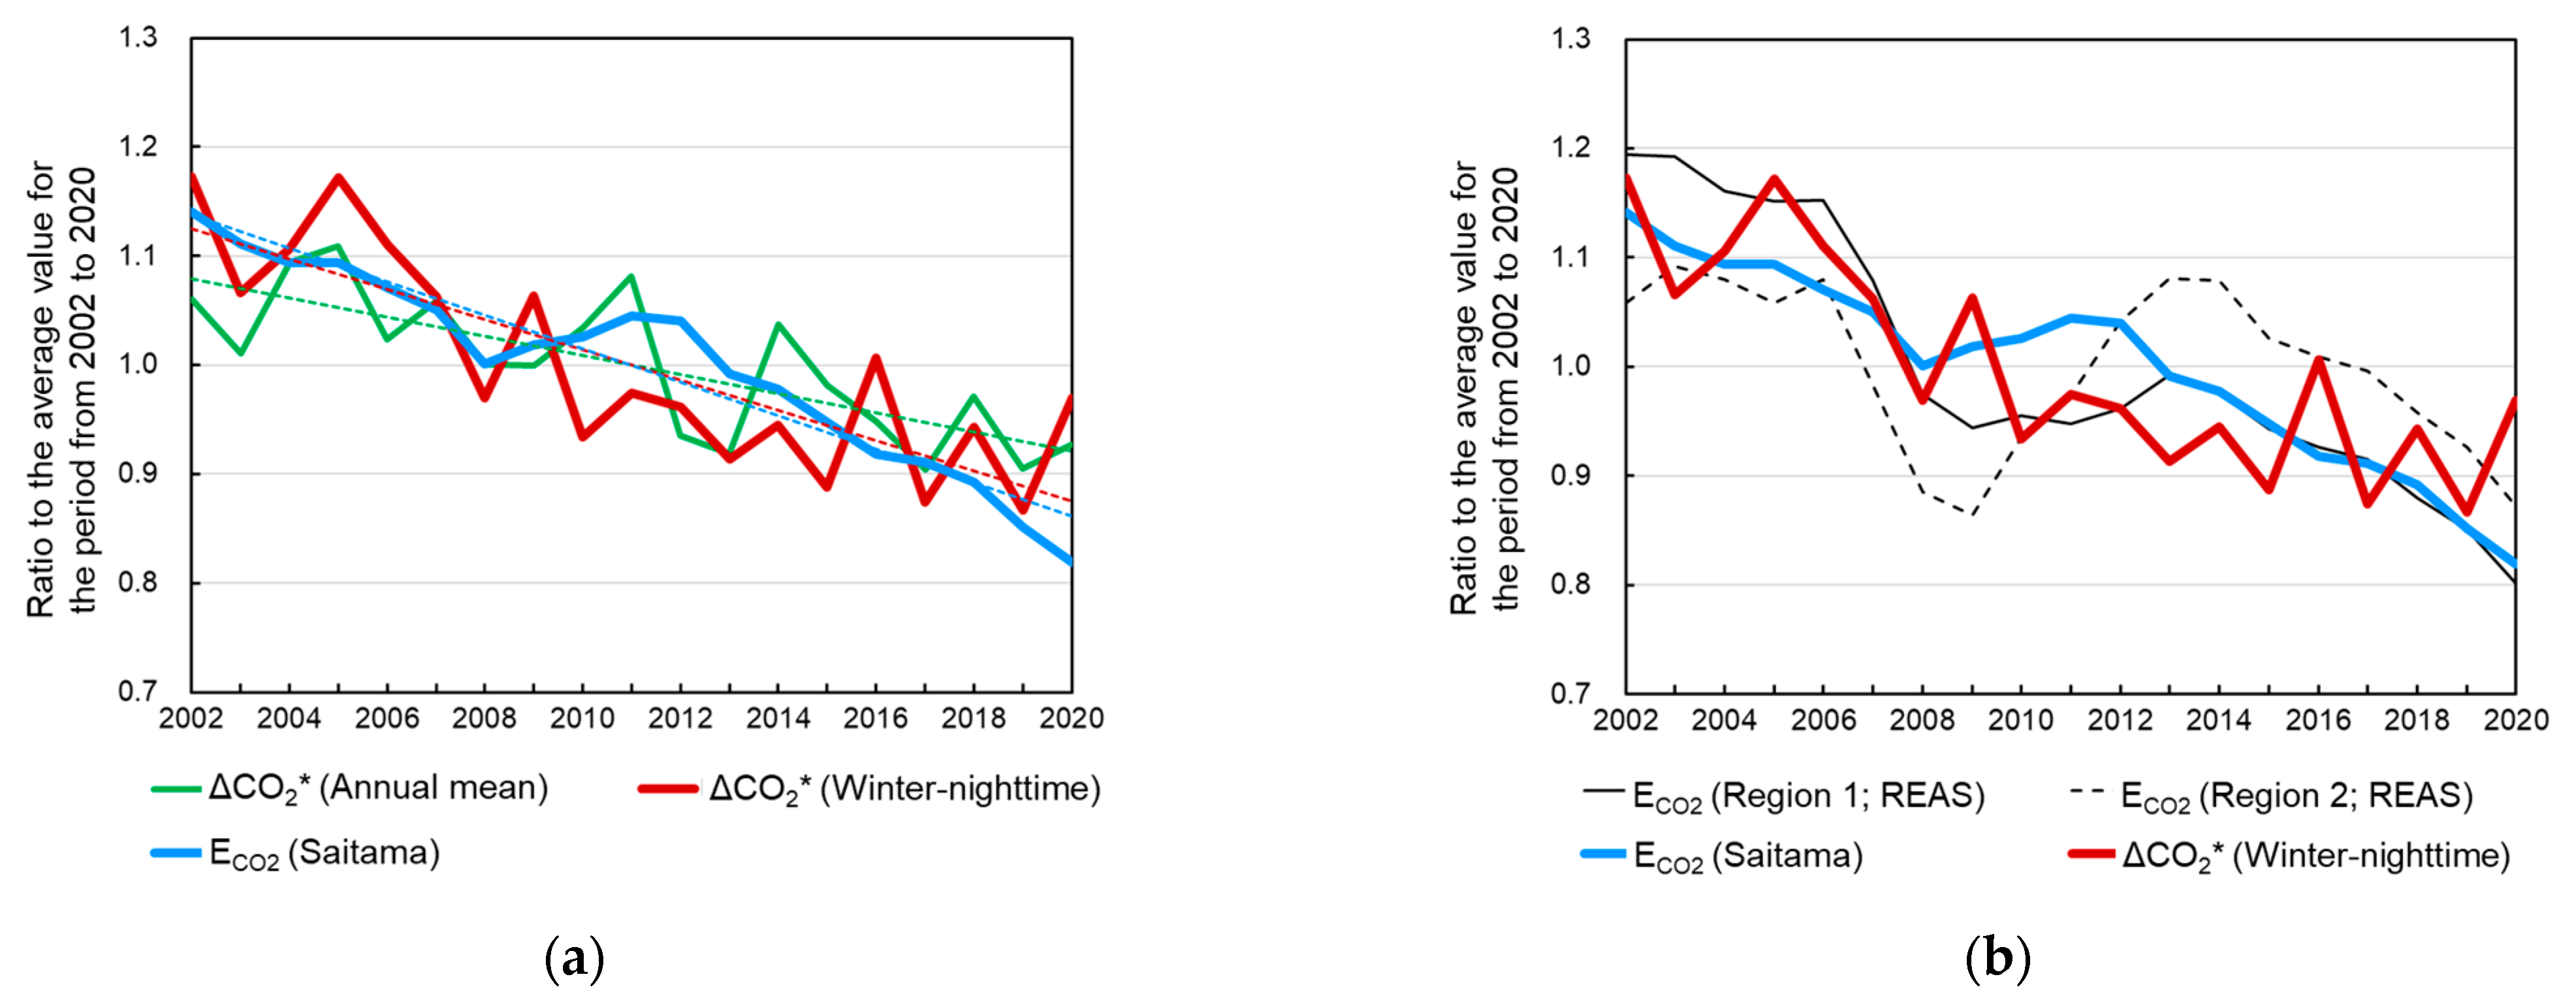
3.2. Annual Trends in ΔCO2* and Anthropogenic CO2 Emissions

We compared the long-term normalized trend in the annual mean and winter-nighttime (2200–0300 JST during November–March) ΔCO2* levels with the anthropogenic CO2 annual emissions (ECO2) in Saitama Prefecture, using the dataset compiled by the Saitama Prefectural Government and CESS (Figure 3a). The long-term trend in the annual mean ΔCO2* (annual change rate: −0.87 ± 0.18% yr–1; p = 0.00018) was similar to the ECO2 in Saitama Prefecture (−1.54 ± 0.11% yr–1; p < 0.00001). In contrast, the winter-nighttime ΔCO2* (annual change rate: −1.39 ± 0.24% yr–1; p = 0.000017) was much more similar to the ECO2. Because of the prevalence of westerly winds in winter, DDR is upwind of KIS. By taking the concentration difference between the two stations (KIS—DDR), the effects of long-range transport from the Asian continent and western Japan were reduced. Additionally, during winter nighttime, the development of stable stratification led to atmospheric stagnation and the suppression of vertical transport of CO2 emitted from local sources. As a result, the winter-nighttime ΔCO2* is more susceptible to the influence of regional emission sources. In addition, the impact of plant absorption/release is relatively lower during winter nighttime. Because of these factors, the winter-nighttime ΔCO2* is more likely to reflect changes in the anthropogenic CO2 emissions in the region around the two stations.
Let us consider ECO2 in Regions 1 and 2 in the Kanto Plain (Figure 1b) from REAS. The temporal variations in the ECO2 in Region 1 (covering Saitama Prefecture) were similar to those of Saitama Prefecture (Figure 3b). In contrast, the ECO2 in Region 2 (covering the Tokyo Bay area) exhibited a sinusoidal variation, with a minimum in 2009 and a maximum in 2014, which was superimposed on the long-term trend. This sinusoidal change is caused by emissions from power plants and industries in the Tokyo Bay area [17] (Figure 4). Hence, the pattern of temporal variations in ECO2 in Region 2 differs significantly from that in Region 1, as well as the winter-nighttime ΔCO2*. Both of the stations in Saitama Prefecture, located several tens of kilometers away from the Tokyo Bay area, suggest that ΔCO2* is less influenced by the variations in CO2 emissions from the high-density emission sources in that area.

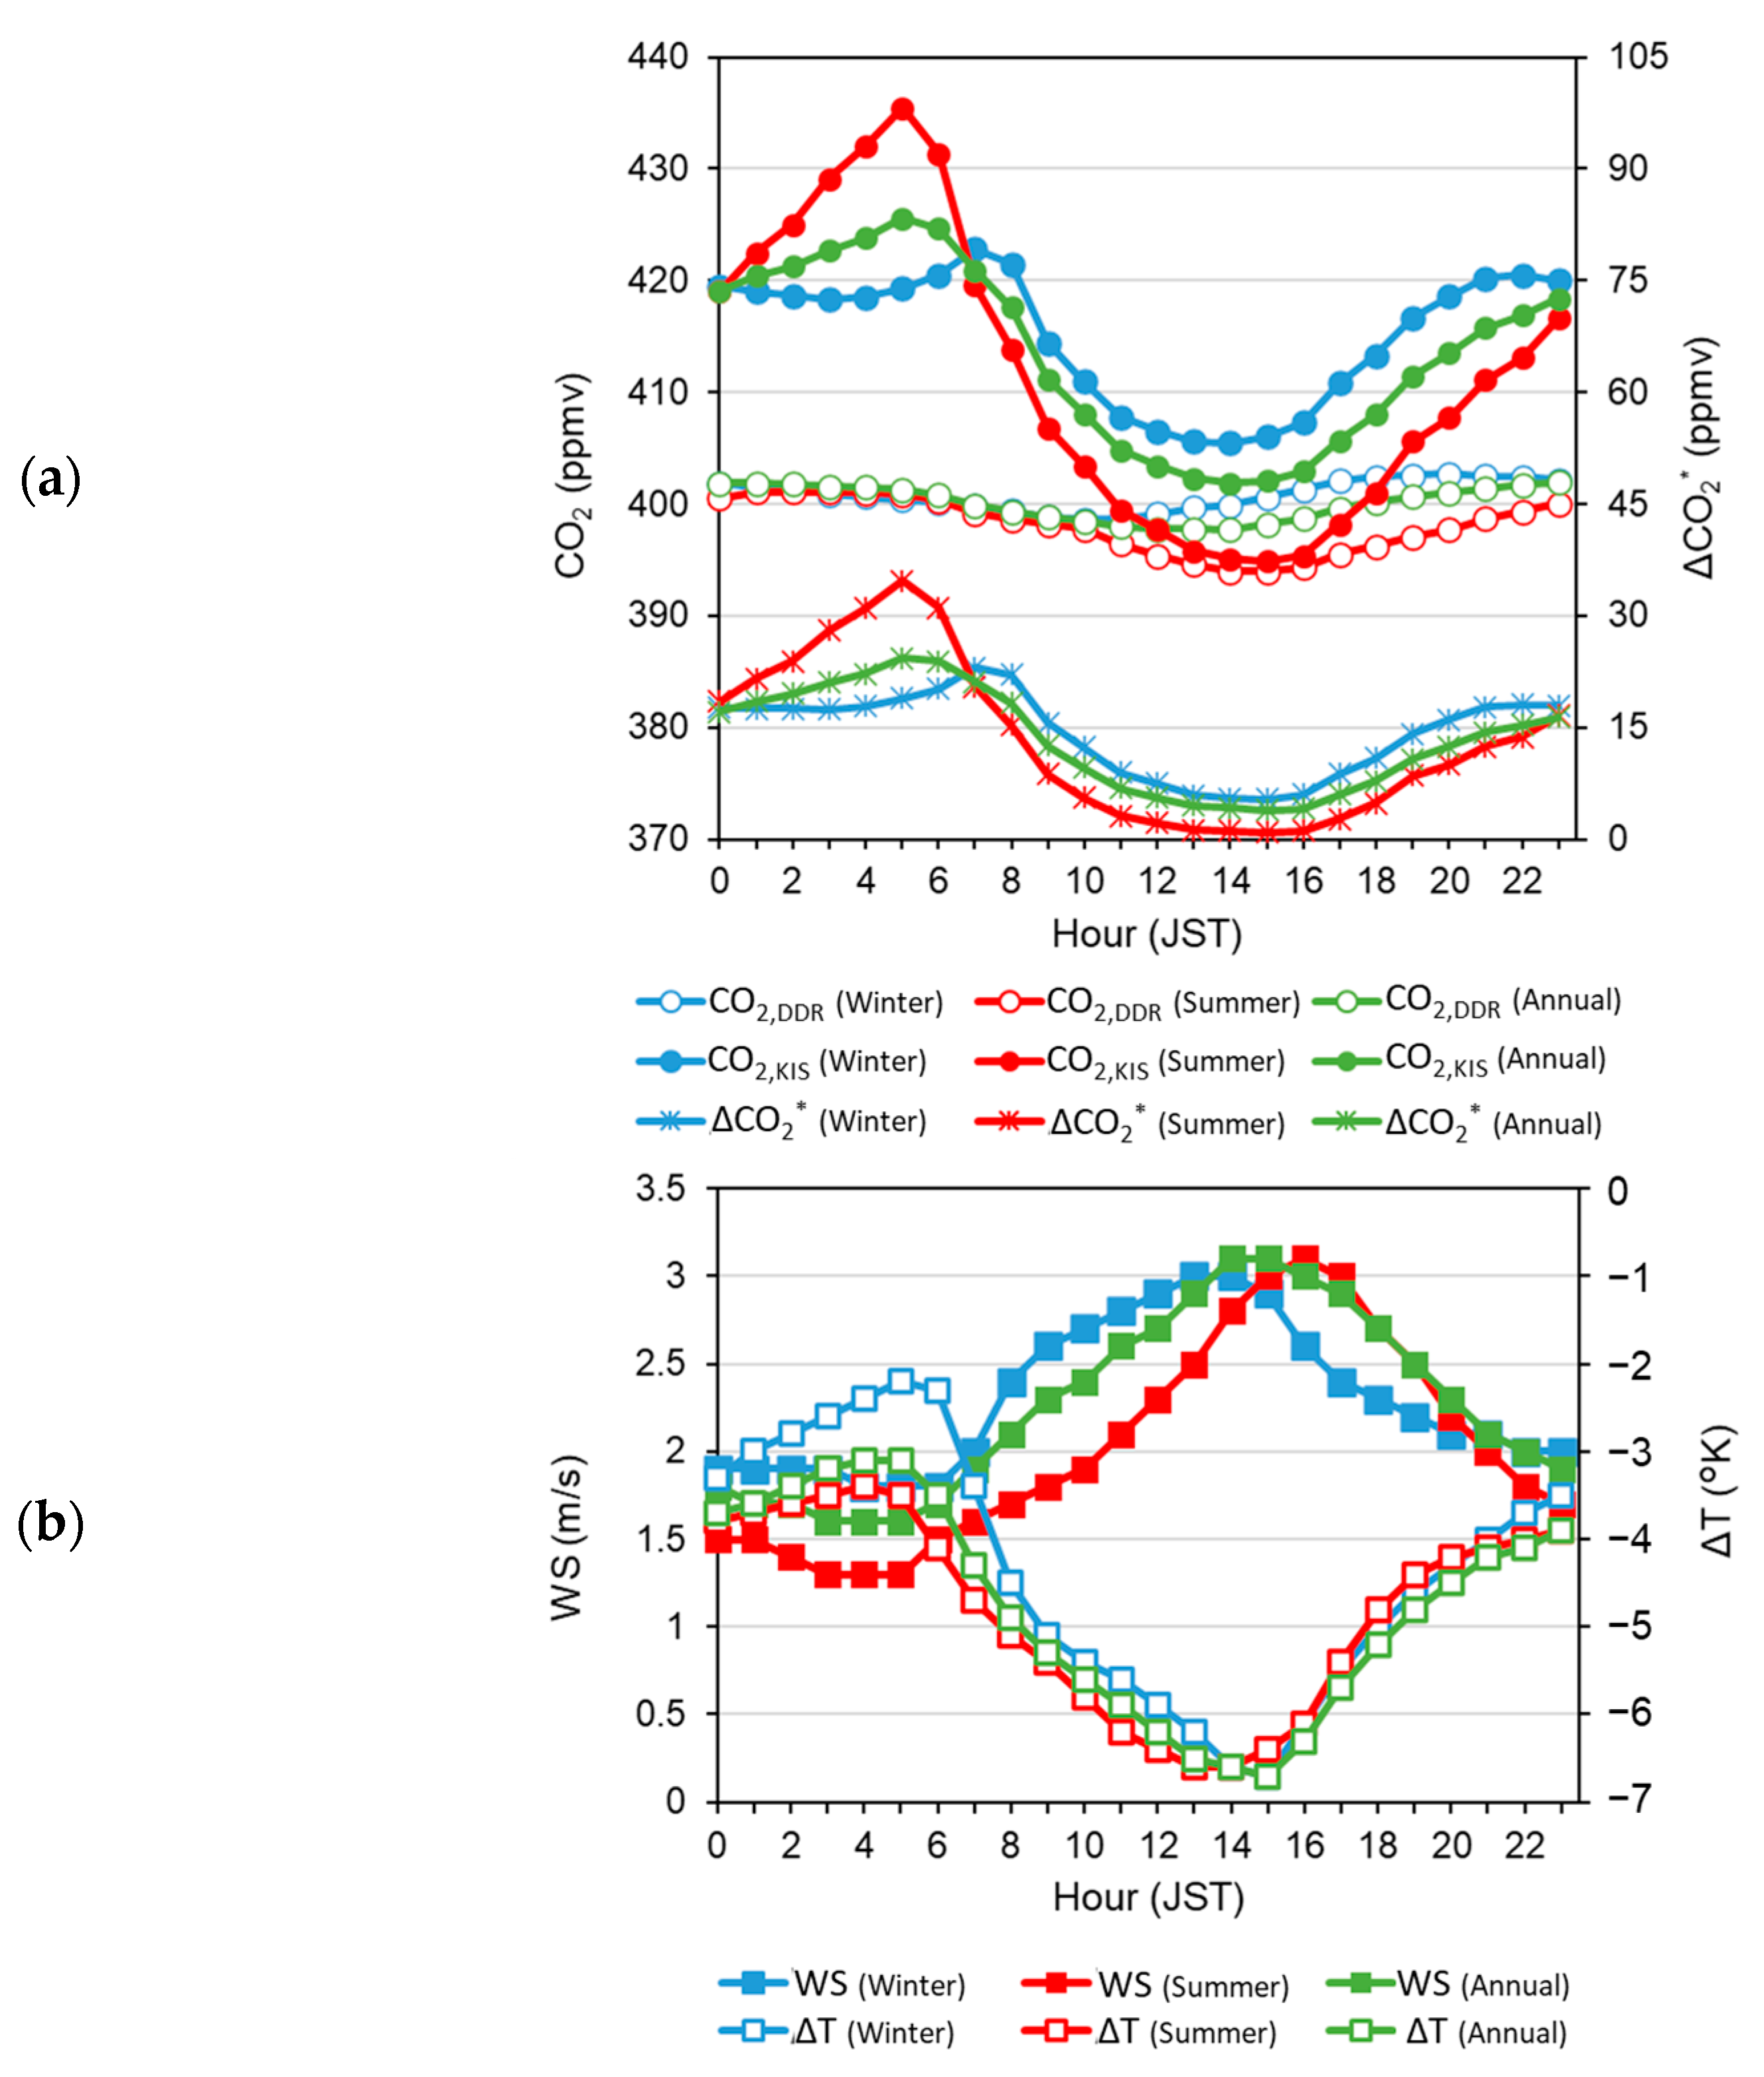
3.3. Relationship Between ΔCO2* and Meteorological Variables

To investigate whether ΔCO2* corresponds to the anthropogenic CO2 emissions in the region around the two stations, we analyzed the relationship between ΔCO2* and the meteorological variables.
The averaged ΔCO2* data (hourly values), stratified by wind direction measured at the KIS station from 2002 to 2020, are shown in Figure 5. All data associated with wind speeds less than 2.0 m/s were excluded from this analysis to minimize possible contaminations from local sources of CO2 emissions near the monitoring station. The total number of hourly data used for the analysis was 158,484; the number varied by wind direction, ranging from 460 (at SW) to 11,092 (at WNW). The averaged ΔCO2* was higher in cases of westerly winds (SW to W), in which case, DDR is located upwind of KIS. This indicates that ΔCO2* is strongly influenced by CO2 emissions from the area between the two stations.
The CO2,KIS exhibited a clear diurnal variation, with a maximum of around 0600 JST and a minimum of around 1400 JST, whereas the CO2,DDR showed a very small diurnal variation, creating a distinct contrast in the variations between the two stations (Figure 6a). The diurnal variation in CO2,KIS means that it is strongly influenced by the diurnal variation in anthropogenic CO2 emissions and the meteorological field at the regional scale. As shown in Figure 6b, the wind speed (measured at KIS) exhibits a diurnal variation that is inversely correlated with the CO2,KIS, with a minimum of around 0600 JST and a maximum of around 1400 JST. In addition, the vertical temperature difference (temperature difference between DDR and KIS; DDR−KIS) showed a pattern opposite to that of the wind speed, with a maximum (stable stratification) at 0500–0700 JST and a minimum (unstable stratification) of around 1400 JST, mirroring the diurnal variation in CO2,KIS. The implication is that CO2,KIS undergoes diurnal variation due to temporal changes in the horizontal transport and vertical diffusion of regional CO2 emissions, caused by diurnal variations in wind speed and vertical thermal stratification (mixing layer), respectively. Similar characteristics of diurnal variation in CO2,KIS have been reported in many previous studies. Imasu and Tanabe [21] showed that urban areas are characterized by high CO2 concentrations before midnight in winter and in the morning during all seasons. Other similar studies in urban areas showed similar features [27,28]. Imasu and Tanabe [21] concluded that the increase in CO2 concentration before midnight and in the morning is mainly attributable to the increase in CO2 emissions in this area. However, the results of this study demonstrated that the diurnal variations in CO2,KIS are derived not only from diurnal variations in CO2 emission in this area but also from local meteorological conditions, such as wind speed and vertical thermal stratification.
In contrast, CO2,DDR showed very little diurnal variation due to less influence from CO2 emissions in the surrounding area. As a result, ΔCO2* (and CO2,KIS) exhibited a clear diurnal variation, which was strongly influenced by the regional emissions. From these relationships, we conclude that the ΔCO2* is closely related to CO2 emissions in the area (i.e., Saitama Prefecture) around the KIS station. However, to more accurately detect regional CO2 emissions, analyses using transport models and inverse models will be necessary [12,15,16,29], which will be addressed as a future challenge of this study. Integrating long-term observations with model analysis to quantitatively evaluate the interannual trends in CO2 emissions, and verifying more recent changes in CO2 emissions using CO2 observation data, are the future goals of this study.

4. Conclusions

We analyzed long-term, continuous, and high-precision observation data of CO2 concentrations at a mountain station and a suburban station, both located in the western part of the TMA. We compared the long-term trends in CO2 concentration differences (ΔCO2*) between the two stations for the period 2002–2020 with the temporal variations in regional CO2 emissions from anthropogenic emission inventories. Long-term trends in the winter-nighttime ΔCO2* closely matched the trends in regional CO2 emissions with normalized growth rates of −1.39% yr−1 and −1.54% yr−1, respectively, providing evidence that supports the decreasing trend in anthropogenic CO2 emissions in the region around the TMA. The analysis results of the relationship between ΔCO2* and the meteorological parameters bolster our conclusions. This study is the first to demonstrate the use of long-term continuous observations of CO2 concentrations at multiple stations to confirm decadal-scale reductions in CO2 emissions within an urban area.

Author Contributions

Conceptualization, T.O. and M.U.; field research, Y.M.; methodology and analysis, T.O.; drafting, reviewing, and editing, T.O., Y.M., J.K., T.S., and M.U. All authors have read and agreed to the published version of the manuscript.

Funding

REASv3 has been supported by the Environmental Research and Technology Development Fund (grant nos. S-12 and S-20, JPMEERF21S12012) of the Environmental Restoration and Conservation Agency of Japan, and the Japan Society for the Promotion of Science, KAKENHI (grant no. 19K12303).

Institutional Review Board Statement

Not applicable.

Informed Consent Statement

Not applicable.

Data Availability Statement

The data presented in this study are available from the first author upon request.

Acknowledgments

We thank the staff of the Japan Meteorological Agency for their support in the CO2 measurements. We also thank Tetsushi Yonekura of the Center for Environmental Science in Saitama for discussing data analysis.

Conflicts of Interest

The authors declare no conflicts of interest.

References

  1. Gulev, S.K.; Thorne, P.W.; Ahn, J.; Dentener, F.J.; Domingues, C.M.; Gerland, S.; Gong, D.; Kaufman, D.S.; Nnamchi, H.C.; Quaas, J.; et al. In Climate Change 2021: The Physical Science Basis. In Contribution of Working Group I to the Sixth Assessment Report of the Intergovernmental Panel on Climate Change; Masson-Delmotte, V., Zhai, P., Pirani, A., Connors, S.L., Péan, C., Berger, S., Caud, N., Chen, Y., Goldfarb, L., Gomis, M.I., et al., Eds.; Cambridge University Press: Cambridge, UK; New York, NY, USA, 2021; Chapter 2; pp. 287–422. [Google Scholar]
  2. Lwasa, S.; Seto, K.C.; Bai, X.; Blanco, H.; Gurney, K.R.; Kılkış, S.; Lucon, O.; Murakami, J.; Pan, J.; Sharifi, A.; et al. Climate Change 2022: Mitigation of Climate Change. In Contribution of Working Group III to the Sixth Assessment Report of the Intergovernmental Panel on Climate Change; Urban systems and other settlements; Shukla, P.R., Skea, J., Slade, R., Al Khourdajie, A., van Diemen, R., McCollum, D., Pathak, M., Some, S., Vyas, P., Fradera, R., et al., Eds.; Cambridge University Press: Cambridge, UK; New York, NY, USA, 2022; Chapter 8. [Google Scholar]
  3. Gurney, K.R.; Liang, J.; Roest, G.; Song, Y.; Mueller, K.; Lauvaux, T. Under-reporting of greenhouse gas emissions in U.S. cities. Nat. Commun. 2021, 12, 53. [Google Scholar] [CrossRef]
  4. Wang, H.; Shi, W.; He, W.; Xue, H.; Zeng, W. Simulation of urban transport carbon dioxide emission reduction environment economic policy in China: An integrated approach using agent-based modelling and system dynamics. J. Clean. Prod. 2023, 392, 136221. [Google Scholar] [CrossRef]
  5. Labzovskii, L.D.; Mak, H.W.L.; Kenea, S.T.; Rhee, J.-S.; Lashkari, A.; Li, S.; Goo, T.-Y.; Oh, Y.-S.; Byun, Y.-H. What can we learn about effectiveness of carbon reduction policies from interannual variability of fossil fuel CO2 emissions in East Asia? Environ. Sci. Policy 2019, 96, 132–140. [Google Scholar] [CrossRef]
  6. Wang, G.; Peng, W.; Xiang, J.; Ning, L.; Yu, Y. Modelling spatiotemporal carbon dioxide emission at the urban scale based on DMSP-OLS and NPP-VIIRS data: A case study in China. Urban Clim. 2022, 46, 101326. [Google Scholar] [CrossRef]
  7. Zhu, X.-H.; Lu, K.-F.; Peng, Z.-R.; He, H.-D.; Xu, S.-Q. Spatiotemporal variations of carbon dioxide (CO2) at Urban neighborhood scale: Characterization of distribution patterns and contributions of emission sources. Sustain. Cities Soc. 2022, 78, 103646. [Google Scholar] [CrossRef]
  8. Shusterman, A.A.; Teige, V.E.; Turner, A.J.; Newman, C.; Kim, J.; Cohen, R.C. The BErkeley Atmospheric CO2 Observation Network: Initial evaluation. Atmos. Meas. Tech. 2016, 16, 13449–13463. [Google Scholar] [CrossRef]
  9. Verhulst, K.R.; Karion, A.; Kim, J.; Salameh, P.K.; Keeling, R.F.; Newman, S.; Miller, J.; Sloop, C.; Pongetti, T.; Rao, P.; et al. Carbon dioxide and methane measurements from the Los Angeles Megacity Carbon Project—Part 1: Calibration, urban enhancements, and uncertainty estimates. Atmos. Chem. Phys. 2017, 17, 8313–8341. [Google Scholar]
  10. Davis, K.J.; Deng, A.; Lauvaux, T.; Miles, N.L.; Richardson, S.J.; Sarmiento, D.P.; Gurney, K.R.; Hardesty, R.M.; Bonin, T.A.; Brewer, W.A.; et al. The Indianapolis Flux Experiment (INFLUX): A test-bed for developing urban greenhouse gas emission measurements. Elem. Sci. Anthr. 2017, 5, 21. [Google Scholar] [CrossRef]
  11. Karion, A.; Callahan, W.; Stock, M.; Prinzivalli, S.; Verhulst, K.R.; Kim, J.; Salameh, P.K.; Lopez-Coto, I.; Whetstone, J. Greenhouse gas observations from the Northeast Corridor tower network. Earth Syst. Sci. Data 2020, 12, 699–717. [Google Scholar] [CrossRef]
  12. Lian, J.; Lauvaux, T.; Utard, H.; Bréon, F.-M.; Broquet, G.; Ramonet, M.; Laurent, O.; Albarus, I.; Chariot, M.; Kotthaus, S.; et al. Can we use atmospheric CO2 measurements to verify emission trends reported by cities? Lessons from a 6-year atmospheric inversion over Paris. Atmos. Meas. Tech. 2023, 23, 8823–8835. [Google Scholar] [CrossRef]
  13. Sargent, M.; Barrera, Y.; Nehrkorn, T.; Hutyra, L.R.; Gately, C.K.; Jones, T.; McKain, K.; Sweeney, C.; Hegarty, J.; Hardiman, B.; et al. Anthropogenic and biogenic CO 2 fluxes in the Boston urban region. Proc. Natl. Acad. Sci. USA 2018, 115, 7491–7496. [Google Scholar] [CrossRef] [PubMed]
  14. Lauvaux, T.; Gurney, K.R.; Miles, N.L.; Davis, K.J.; Richardson, S.J.; Deng, A.; Nathan, B.J.; Oda, T.; Wang, J.A.; Hutyra, L.; et al. Policy-relevant assessment of urban CO2 emissions. Environ. Sci. Technol. 2020, 54, 10237–10245. [Google Scholar]
  15. Pisso, I.; Patra, P.; Takigawa, M.; Machida, T.; Matsueda, H.; Sawa, Y. Assessing Lagrangian inverse modelling of urban anthropogenic CO2 fluxes using in situ aircraft and ground-based measurements in the Tokyo area. Carbon Balance Manag. 2019, 14, 6. [Google Scholar] [CrossRef] [PubMed]
  16. Ohyama, H.; Frey, M.M.; Morino, I.; Shiomi, K.; Nishihashi, M.; Miyauchi, T.; Yamada, H.; Saito, M.; Wakasa, M.; Blumenstock, T.; et al. Anthropogenic CO2 emission estimates in the Tokyo metropolitan area from ground-based CO2 column observations. Atmos. Meas. Tech. 2023, 23, 15097–15119. [Google Scholar] [CrossRef]
  17. Kurokawa, J.; Ohara, T. Long-term historical trends in air pollutant emissions in Asia: Regional Emission inventory in ASia (REAS) version 3. Atmos. Meas. Tech. 2020, 20, 12761–12793. [Google Scholar] [CrossRef]
  18. National Greenhouse Gas Inventory Report of JAPAN 2023. Available online: https://cger.nies.go.jp/publications/report/i164/i164.pdf (accessed on 3 March 2025).
  19. Luqman, M.; Rayner, P.J.; Gurney, K.R. On the impact of urbanisation on CO2 emissions. Urban Sustain. 2023, 3, 6. [Google Scholar] [CrossRef]
  20. WMO WDCGG Data Summary, WDCGG No. 47, GAW Data, Volume IV-Greenhouse and Related Gases. Available online: https://gaw.kishou.go.jp/static/publications/summary/sum47/sum47.pdf (accessed on 3 March 2025).
  21. Imasu, R.; Tanabe, Y. Diurnal and seasonal variations of carbon dioxide (CO2) concentration in urban, suburban, and rural areas around Tokyo. Atmosphere 2018, 9, 367. [Google Scholar] [CrossRef]
  22. WMO Greenhouse Gas Bulletin, No. 19. Available online: https://library.wmo.int/idurl/4/68532 (accessed on 3 March 2025).
  23. Watanabe, F.; Uchino, O.; Joo, Y.; Aono, M.; Higashijima, K.; Yoshiaki, H.; Kazuhiro, T.; Kazuto, S. Interannual variation of growth rate of atmospheric carbon dioxide concentration observed at the JMA’s three monitoring stations: Large increase in concentration of atmospheric carbon dioxide in 1998. J. Meteor. Soc. Japan. 2000, 78, 673–682. [Google Scholar]
  24. WDCGG. Available online: https://gaw.kishou.go.jp/search/file/0065-2017-1001-01-01-9999 (accessed on 3 March 2025).
  25. WDCGG. Available online: https://gaw.kishou.go.jp/search/file/0065-2019-1001-01-01-9999 (accessed on 3 March 2025).
  26. Greenhouse Gas Emissions Report in Saitama Prefecture for the Fiscal Year 2022. Available online: https://www.pref.saitama.lg.jp/documents/25672/2022prefghgresult.pdf (accessed on 3 March 2025). (In Japanese).
  27. George, K.; Ziska, L.; Bunce, J.; Quebedeaux, B. Elevated atmospheric CO2 concentration and temperature across an urban–rural transect. Atmos. Environ. 2007, 41, 7654–7665. [Google Scholar] [CrossRef]
  28. Coutts, A.M.; Beringer, J.; Tapper, N.J. Characteristics influencing the variability of urban CO2 fluxes in Melbourne, Australia. Atmos. Environ. 2007, 41, 51–62. [Google Scholar] [CrossRef]
  29. Newman, S.; Xu, X.; Gurney, K.R.; Hsu, Y.K.; Li, K.F.; Jiang, X.; Keeling, R.; Feng, S.; O’Keefe, D.; Patarasuk, R.; et al. Toward consistency between trends in bottom-up CO2 emissions and top-down atmospheric measurements in the Los Angeles megacity. Atmos. Meas. Tech. 2016, 16, 3843–3863. [Google Scholar] [CrossRef]
Figure 1. Map of CO2 monitoring stations in mountainous Dodaira (DDR) and suburban Kisai (KIS) in the Tokyo Metropolitan Area based on (a) topography and (b) gridded CO2 emissions for the year 2015 from REAS version 3.2.1. The blue colored rectangles represent Regions 1 and 2 of REAS (see Section 3.2).
Atmosphere 16 00364 g001
Figure 2. Time courses during 2002–2020 of (a) monthly average CO2 concentrations observed at Dodaira Mountain and Kisai (DDR and KIS) and the global mean and (b) annual differences (ΔCO2) in mean values between those stations (KIS—DDR) and between those stations and the global average. The dotted lines show linear regressions.
Atmosphere 16 00364 g002
Figure 3. Time courses of (a) the annual average and winter-nighttime average of ΔCO2* and the annual emissions of CO2 (ECO2) in Saitama Prefecture from the dataset compiled by the Saitama Prefectural Government and CESS and (b) the winter-nighttime average of ΔCO2* and the annual emissions of CO2 (ECO2) in Regions 1 and 2 (blue colored rectangles in Figure 1b), as well as in Saitama Prefecture, during 2002–2020. Both ΔCO2* and ECO2 were normalized to their respective averages for the analysis period (2002–2020). The dotted lines in panel (a) show the results of the linear regression.
Atmosphere 16 00364 g003
Figure 4. Time courses of CO2 emissions by emission sector in Region 2 are shown in Figure 1b. The bar colors represent the emission sectors (PP: power plant, IND: industry, ROAD: road transport, OTRA: other road transport, RESI: residential, ODOM: other domestic).
Atmosphere 16 00364 g004
Figure 5. Averaged ΔCO2* (hourly values) by wind direction measured at the KIS station from 2002 to 2020.
Atmosphere 16 00364 g005
Figure 6. Diurnal variations in (a) CO2,DDR, CO2,KIS, and ΔCO2* and (b) WS (wind speed measured at KIS station) and ΔT (temperature difference between DDR and KIS stations; DDR−KIS) in the annual average, as well as summer (July–September) and winter (November–March) seasonal averages.
Atmosphere 16 00364 g006
Disclaimer/Publisher’s Note: The statements, opinions and data contained in all publications are solely those of the individual author(s) and contributor(s) and not of MDPI and/or the editor(s). MDPI and/or the editor(s) disclaim responsibility for any injury to people or property resulting from any ideas, methods, instructions or products referred to in the content.

