Article

An Investigation of Benzene, Toluene, Ethylbenzene, m,p-xylene; Biogenic Volatile Organic Compounds; and Carbonyl Compounds in Chiang Mai’s Atmosphere and Estimation of Their Emission Sources During the Episode Period

1
Department of Civil and Environmental Engineering, Konkuk University, Seoul 05029, Republic of Korea
2
Department of Earth and Environmental Sciences, Korea University, Seoul 02841, Republic of Korea
3
Department of Environment, Hankuk University of Foreign Study, Seoul 17035, Republic of Korea
4
Department of Chemistry, Faculty of Science and Technology, Chiang Mai Rajabhat University, Chiang Mai 50300, Thailand
*
Authors to whom correspondence should be addressed.
Atmosphere 2025, 16(3), 342; https://doi.org/10.3390/atmos16030342
Submission received: 14 February 2025 / Revised: 9 March 2025 / Accepted: 14 March 2025 / Published: 18 March 2025
(This article belongs to the Section Air Quality)

Abstract

:
Air pollution in Chiang Mai during the dry winter season is extremely severe. During this period, high levels of fine particles are primarily generated by open biomass burning in Thailand and neighboring countries. In this study, ambient VOC(Volatile Organic Compounds) samples were collected using an adsorbent tube from 13 March to 26 March 2024, with careful consideration of sampling uncertainties to ensure data reliability. Furthermore, while interannual variability exists, the findings reflect atmospheric conditions during this specific period, allowing for an in-depth VOC assessment. A comprehensive approach to VOCs was undertaken, including benzene, toluene, ethylbenzene, m,p-xylene (BTEX); biogenic volatile organic compounds (BVOCs); and carbonyl compounds. Regression analysis was performed to analyze the correlation between isoprene concentrations and wind direction. The results showed a significant variation in isoprene levels, indicating their high concentrations due to biomass burning originating from northern areas of Chiang Mai. The emission sources of BTEX and carbonyl compounds were inferred through their ratio analysis. Additionally, correlation analyses between PM2.5, BTEX, and carbonyl compounds were conducted to identify common emission pathways. The ratio of BTEX among compounds suggested that long-range pollutant transport contributed more significantly than local traffic emissions. Carbonyl compounds were higher during the episode period, which was likely due to local photochemical reactions and biological contributions. Previous studies in Chiang Mai have primarily focused on PM2.5, whereas this study examined individual VOC species, their temporal trends, and their interrelationships to identify emission sources.

1. Introduction

During the episode period, Thailand, particularly Chiang Mai, experienced some of the highest concentrations of PM2.5, often exceeding 200 µg/m3 [1]. Chiang Mai, located in northern Thailand, borders Myanmar and Laos. From February to April, biomass burning is usually prevalent across northern Thailand, Myanmar, and Laos. The dry climate further exacerbates the situation, with frequent wildfires and the common practice of burning agricultural residues for land clearing [2,3,4,5,6,7]. Chiang Mai’s geographical location in a valley surrounded by mountains contributes to the accumulation of air pollutants, as the topography traps polluted air and prevents its dispersion, resulting in severe air pollution [8,9]. Furthermore, during this period, fine particles and other pollutants from biomass burning in Southeast Asia can travel across borders and even across oceans, impacting extensive regions [10,11,12]. This can cause adverse effects on human health and ecosystems.
Volatile organic compounds (VOCs) are hazardous pollutants, with some exhibiting inherent toxicity [13,14,15,16]. In addition, VOCs undergo photochemical reactions in the atmosphere, leading to the formation of ozone and secondary organic aerosols, making their management crucial. Benzene, toluene, ethylbenzene, and xylene (BTEX) are well-known VOCs primarily emitted from industrial processes and vehicle exhaust but are also significantly released from the incomplete combustion of biomass [17,18,19]. Biogenic VOCs (BVOCs), such as isoprene and monoterpenes, are also important contributors from biomass burning. Plants emit these compounds, which are more abundant globally than anthropogenic VOCs [13,20,21,22]. The warm, wooded environment of Southeast Asia, combined with biomass burning, exacerbates the release of these compounds [22,23]. The impact of BVOCs is growing due to climate change and rising global temperatures [24,25].
VOCs include carbonyl compounds, which possess carbon–oxygen double bonds. They are more reactive than hydrocarbons, making them significant precursors to particulate matter [26,27,28,29]. Carbonyl compounds, such as formaldehyde, acetaldehyde, and acrolein, can cause serious health issues and are generated either directly or through the oxidation of hydrocarbons. Phenolic carbonyl compounds from biomass burning undergo aqueous-phase and interfacial oxidation, leading to secondary organic aerosol (SOA) formation through heterogeneous reactions at air–solid and air–water interfaces [30,31,32]. Similarly, isoprene produces carbonyls like formaldehyde, methacrolein, and methyl vinyl ketone, which persist for a long time in the atmosphere and contribute to SOA formation [26,33]. Plants also emit carbonyl compounds, which can be released during biomass burning or wildfires.
Ref. [34] reported that the contribution of biomass burning to PM10 and PM2.5 was approximately 85% and 89%, respectively. Ref. [35] revealed that a chemical composition analysis of PM2.5 in Bangkok showed that secondary PM2.5 primarily originates from biomass burning and vehicle exhaust. Although there are many research findings on air pollution caused by biomass burning in Thailand and Southeast Asia, most studies primarily focus on particulate matter and its composition [36,37,38]. However, air quality in Chiang Mai is also severely impacted by biomass burning, yet in-depth studies on VOCs have been largely absent in the region.
Considering this, this study adopted a comprehensive approach by investigating VOCs, including BTEX, BVOCs, and carbonyl compounds. These species are strongly linked to biomass burning, play key roles in atmospheric chemistry, and contribute to SOA formation. It is hypothesized that biomass burning serves as a dominant source of these VOCs, contributing to SOA and PM2.5 formation. Instead of focusing solely on particulate matter, the concentration patterns of these individual VOCs during biomass burning events are analyzed. Detailed correlation analyses are conducted to infer the potential sources of these compounds, providing valuable insights into their role in air quality and pollutant dynamics in Chiang Mai.

2. Materials and Methods

2.1. Sampling

Chiang Mai is the second-largest city in Thailand. Chiang Mai falls under the tropical monsoon climate and is situated in a basin surrounded by mountains. This topography results in weak wind flow and the accumulation of stagnant air. The sampling was conducted from 13 March to 26 March 2024. This period was chosen because it coincides with the peak of biomass burning, including slash-and-burn agriculture and wildfires. These activities are most intense during this time due to the dry climate, just before the start of the new farming season [2,4,7].
Air sampling took place on the fourth-floor terrace of Rajabhat University, situated in the heart of Chiang Mai’s urban area (Figure 1). The university is surrounded by a mix of commercial districts, residential neighborhoods, and major roadways, providing a comprehensive representation of the city’s ambient air quality. The elevated sampling location minimizes direct interference from immediate roadside emissions, ensuring that the collected samples reflect the general urban background conditions influenced by typical urban activities and regional pollutant transport [39]. For the collection of VOCs, samples were collected continuously for 24 h during the first week and during daylight hours from 9 a.m. to 9 p.m. in the second week. VOC sampling was continuously conducted for 24 h per day, allowing us to capture both daytime and nighttime VOC variations. This provided valuable insights into diurnal patterns, including potential nocturnal emissions and nighttime chemical processes. However, heavy overnight rainfall occurred at the end of the first week, causing equipment instability and raising concerns about data quality. Therefore, VOC sampling during the first week was conducted continuously for 24 h per day. In the second week, the sampling period was from 9 a.m. to 9 p.m. This adjustment was taken into account specifically on daytime photochemical processes, which are particularly important during the biomass burning season, while ensuring a more stable instrument operation and data quality control.
The target compounds included isoprene and eight monoterpenes (α-pinene, 3-carene, β-pinene, camphene, α-terpinene, d-limonene, p-cymene, and γ-terpinene) among biogenic VOCs, as well as BTEX.
Stainless steel adsorption tubes, containing Tenax TA and Carbopack B (60/80 mesh; Supelco, Bellefonte, PA, USA), were connected to a VOC sampler (MP-∑30 KNII; SIBATA Scientific Technology, Soka, Saitama, Japan) operating at a flow rate of 50 mL/min for 4 h per sample, resulting in a total air volume of 12 L.
For carbonyl compounds, daily sampling was conducted from 5 a.m. to 1 a.m. over the two-week period. DNPH cartridges (54075-U; Supelco, Bellefonte, PA, USA) were attached to an aldehyde sampling pump (MP-∑100 KNII; SIBATA Scientific Technology, Soka, Saitama, Japan). To prevent the effects of atmospheric ozone, an ozone scrubber (505285; Supelco, Bellefonte, PA, USA) was attached at the inlet of the cartridge. Sampling was operated at a flow rate of 100 mL/min for 4 h per sample, resulting in a total air volume of 24 L.
To minimize inherent errors in sorbent tube sampling, such as those caused by humidity and flow rate variations, duplicate sampling was conducted once a week.
Throughout the sampling period, photosynthetically active radiation (PAR) was measured every 30 min using a PAR sensor (MQ-200; Apogee Instruments, Logan, UT, USA) placed in an area without shade, close to the air sampler. Additionally, meteorological data, including temperature and wind, were obtained from the Thailand Pollution Control Department (PCD). The VOCs concentrations were normalized to account for temperature variations.
All collected samples were stored and transported under refrigeration at temperatures below 5 °C, being subsequently analyzed in the Republic of Korea.

2.2. Analysis

The VOCs were quantified and qualitatively analyzed using a thermal desorption (UNITY-xr; Markes international; Bridgend, Wales, UK) followed by a gas chromatography–mass spectrometer (GC/MS; GC model: 6890 N, MS model: 5975; Agilent Technologies, Englewood, CO, USA). The SCAN mode was employed for the analysis, with the details of the analytical method provided below (Table 1). Carbonyl compounds were extracted with 5 mL of acetonitrile and analyzed by injection into high-performance liquid chromatography (HPLC; YL9100; YOUNG IN Chromass, Gyeong-gi, Anyang, Republic of Korea). The analytical method for carbonyl compounds is detailed below (Table 1).

2.3. QA/QC

Before sampling, calibration curves were established using standard substances. For isoprene and BTEX, a mixed gas standard (ozone precursor, PAMs mix, model: 41975-U, Supelco, Bellefonte, PA, USA) with a concentration of 10 ppbv was used, and a working standard was prepared based on different volumes to create a five-point calibration curve. Monoterpenes (α-pinene, 3-carene, β-pinene, camphene, α-terpinene, d-limonene, p-cymene, and γ-terpinene; ≥90% purity, Sigma Aldrich, Burlington, MA, USA) were mixed and diluted with methanol to prepare five calibration points. For carbonyl compounds, a total of 13 aldehydes and ketones were targeted (formaldehyde (FA), acetaldehyde (AA), acetone (ACT), acrolein (ACR), propionaldehyde (PA), crotonaldehyde (CA), 2-butanone (2-BUT), methacrolein (MACT), n-butyraldehyde (n-BA), benzaldehyde (BA), valeraldehyde (VA), m-tolualdehyde (M-TA), hexaldehyde (HA)). DNPH Stock Standard (ERA-028, Supelco, Bellefonte, PA, USA) was used for calibration.
As a result, the calibration curves for all compounds had a good correlation coefficient (r2 values ≥ 0.997), confirming the reliability and accuracy of the calibration process. The relative standard deviation (RSD) values for all compounds were below 5%, indicating good precision and repeatability in the measurements. The method detection limits (MDL) were all below 0.5 ng, ensuring high sensitivity. Measurement uncertainties and detection limits for each compound are summarized in Table 2.
To assess the reproducibility of adsorbent tube sampling, duplicate sampling was conducted once a week. Duplicate samples showed an average percentage difference of 3.25 (±0.33)%, indicating good reproducibility.

3. Results and Discussion

3.1. Measurement of BVOC Concentrations and Identification of Emission Sources

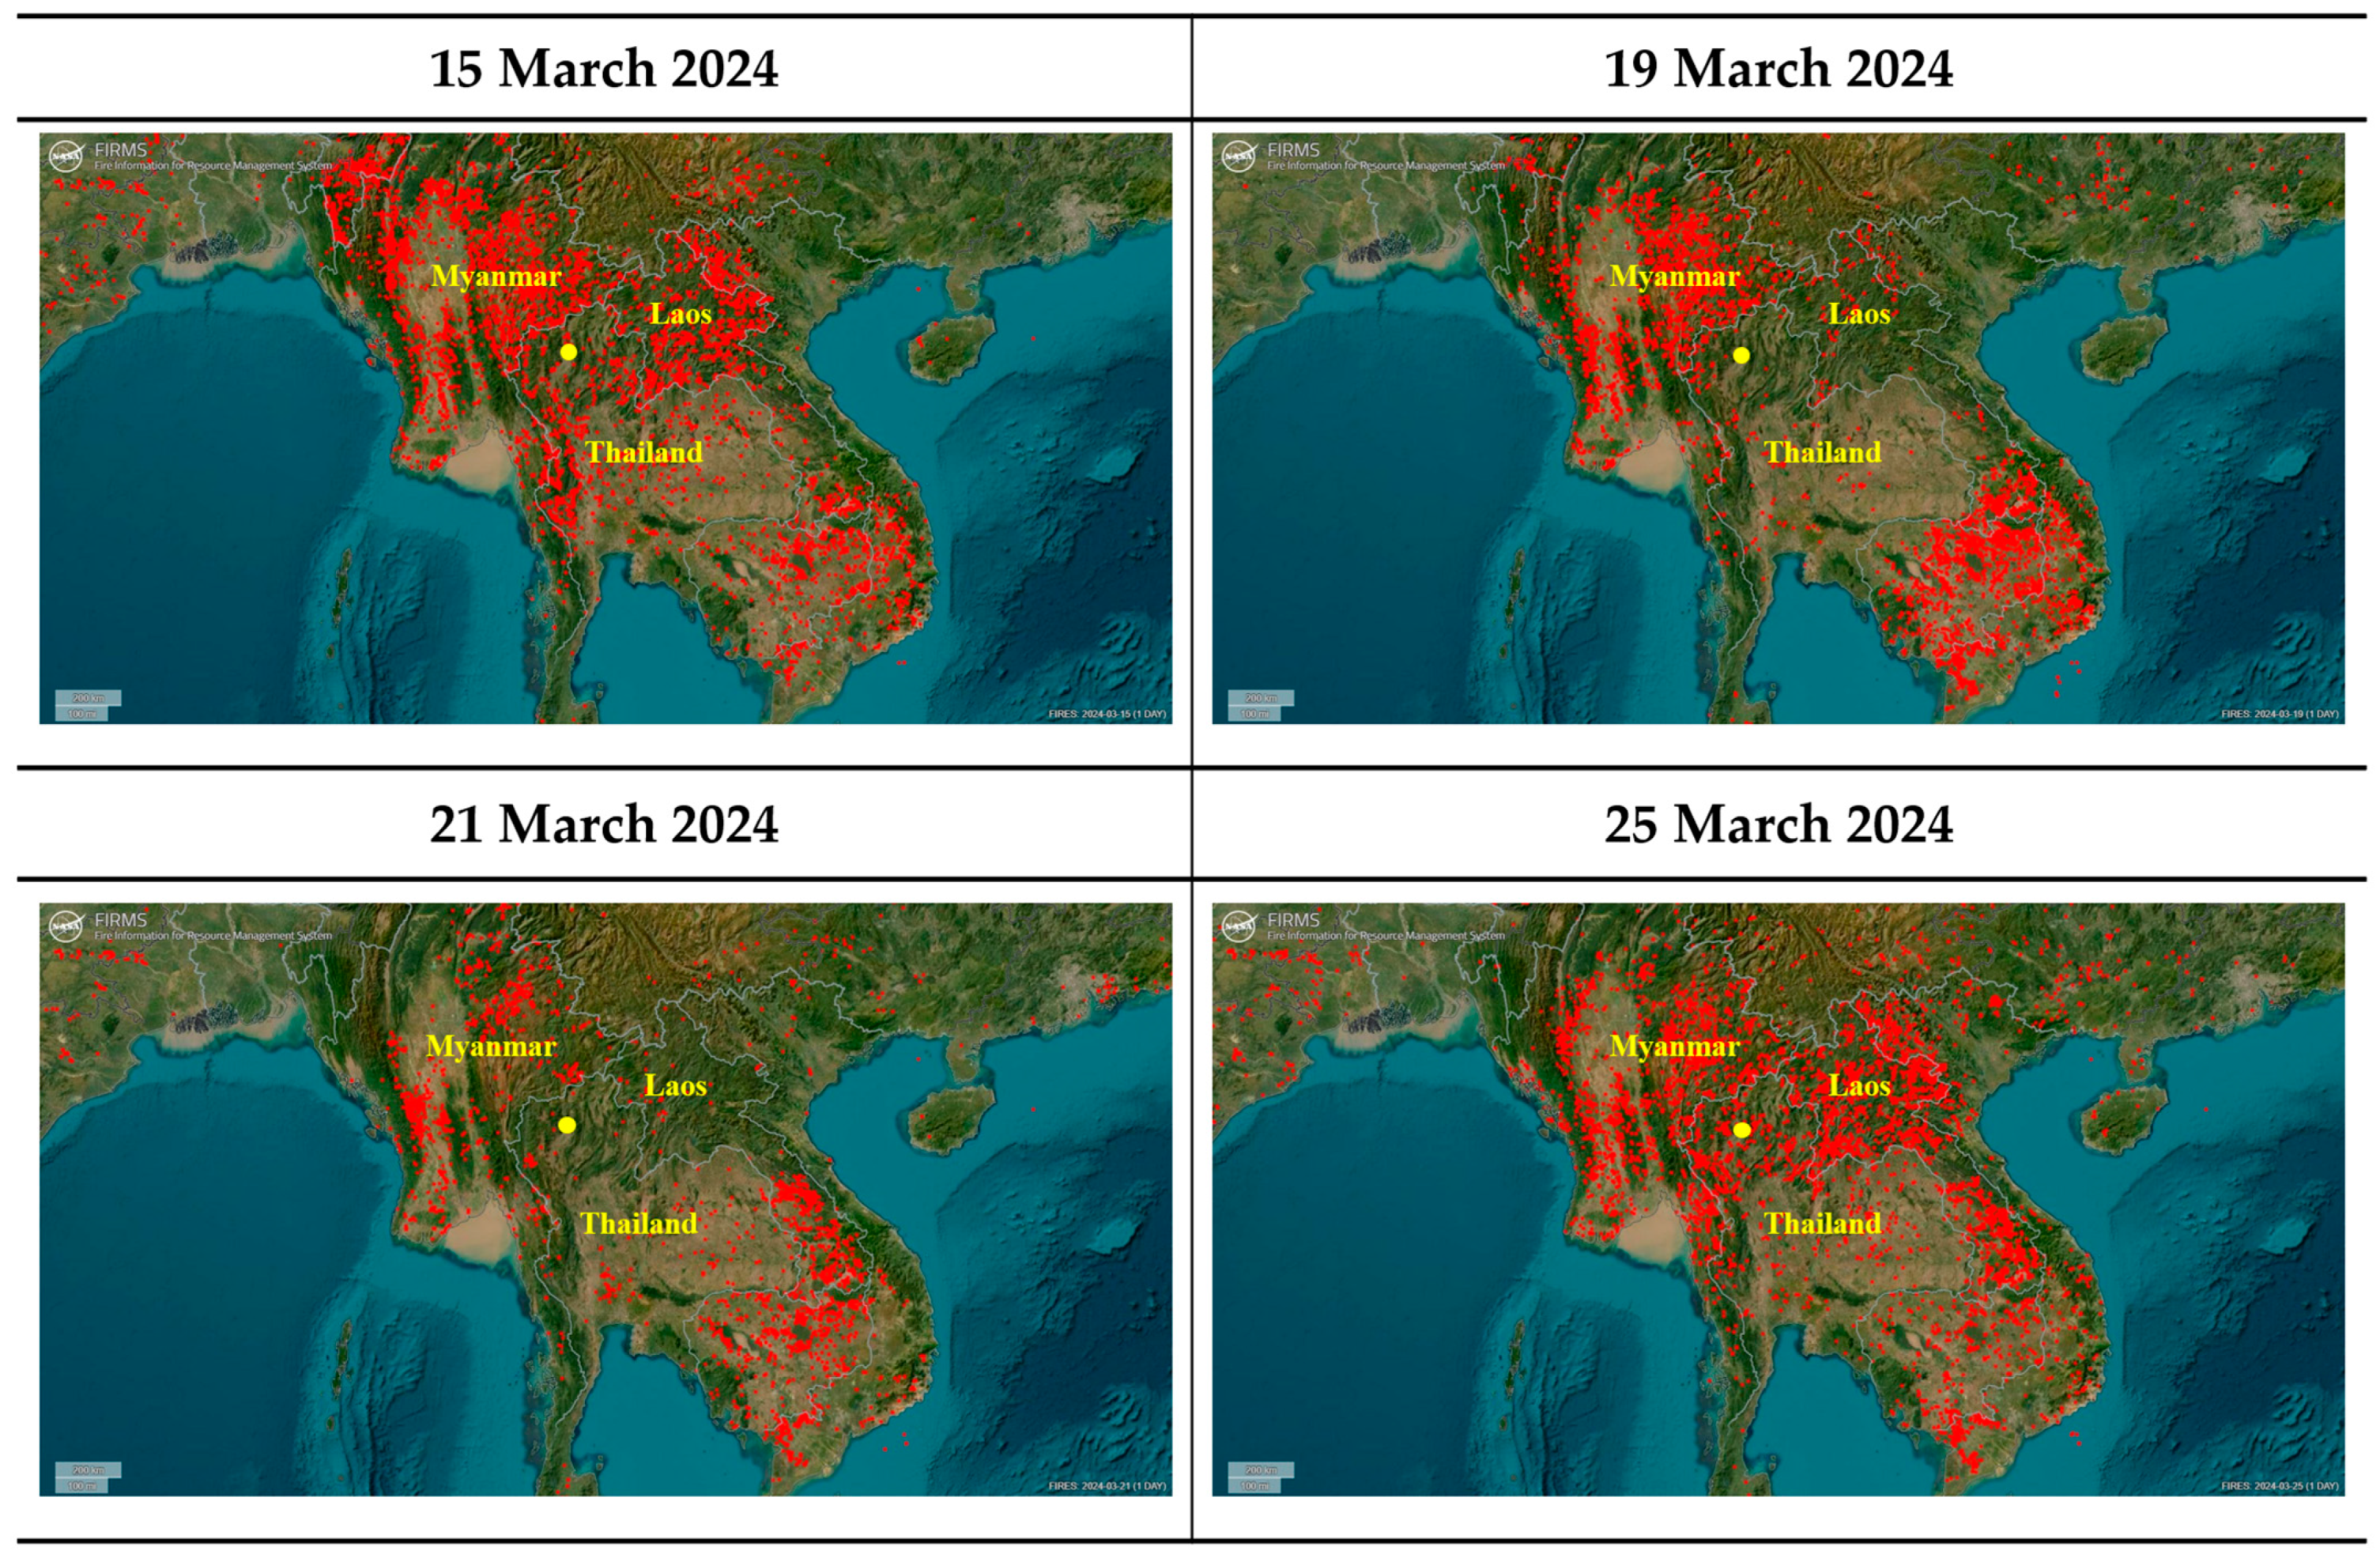
The concentrations of isoprene and monoterpenes measured during the episode period are presented in Figure 2. The distribution of fire incidents in Chiang Mai and its surrounding areas is shown in Figure 3 and detailed in Table 3. Fire distribution data shown in Figure 3 were obtained from NASA FIRMS [40] and represent fire occurrences during March 2024, corresponding to the study period. Among the monoterpenes, only α-pinene, camphene, β-pinene, and d-limonene were detected. Camphene was not detected after the 14th. The monoterpenes exhibited a trend opposite that of isoprene. Unlike isoprene, which showed a sharp increase in concentration from the middle to the later stages of sampling, the concentration of monoterpenes dropped significantly from the third day of sampling, with only trace amounts detected thereafter. It has been found that when wildfires occur, monoterpenes are rapidly released from the resin pool and other materials in trees and plants [41,42,43]. Initially, large amounts of monoterpenes can be released as plant fuel is consumed by the fire, but after the fire subsides, there are no further sources of emission, leading to a sharp decrease in monoterpene release. The physiological response of plants changes after the burning, preventing the continuous release of monoterpenes. Monoterpene emissions are expected to resume after the plants regrow and resin pools accumulate. During the campaign period, fire incidents in areas adjacent to the sampling site peaked on the 13th. These fires likely occurred in coniferous forests, which are a major source of monoterpene emissions. Monoterpenes are predominantly emitted from coniferous trees, whereas isoprene is largely emitted from broadleaf trees [44,45]. Additionally, agricultural burning is known to produce more isoprene than monoterpenes [46]. Since most street trees in Chiang Mai are broadleaf species, the initially high monoterpene concentrations observed are more likely attributable to emissions from burning coniferous forests rather than from agricultural fires or nearby vegetation.
From 13 March to 15 March, the concentration of isoprene was relatively low, particularly remaining below 1 ppbv until the afternoon of 15 March. From the evening of 15 March onward, concentrations exceeded 1 ppbv and were generally high except during dawn. This drop during dawn hours can likely be attributed to the absence of sunlight and relatively lower temperatures, which significantly reduce biological isoprene emissions during this time. Starting from the evening of 18 March, concentrations spiked and reached levels between 5.28 and 10.84 ppbv even during early morning hours without strong sunlight. However, contrary to the increasing trend, there was a sudden drop in concentrations to below 1 ppbv from 1 p.m. to 5 p.m. on 19 March, coinciding with southeast winds. In Chiang Mai, southeasterly winds originate from the Thai mainland. During this study period, the fire data indicate that there was very little fire activity in inland Thailand, which likely explains the sharp decrease in concentrations. However, the samples taken between 5 p.m. and 9 p.m. showed a sudden increase, coinciding with a shift to northwesterly winds. Northwest of Chiang Mai lies Myanmar, where burning was severe. This suggests that the northwesterly winds caused the sharp increase in concentrations. Rainfall occurred from the evening of 19 March to the daytime of 20 March, resulting in relatively low concentrations of isoprene, ranging from 2.70 to 6.87 ppbv. On 21 March, the weather was clear and sunny with weak southwest and southeast winds. Fire activity was minimal, not only in the Thai interior but also in Myanmar and Laos during this period. It suggests that high isoprene concentrations were likely due to local biogenic or anthropogenic sources near the sampling site, rather than long-range transport. After the rain, the temperature slightly dropped, creating favorable conditions for isoprene emissions from the broadleaf trees in the urban area. When the temperature is too high, BVOC emissions from tree leaves tend to decrease [47,48]. Therefore, despite the low levels of biomass burning in the vicinity, the isoprene emitted from the nearby broadleaf trees likely accounted for a significant portion of the ambient concentrations during this time. On 22 March, high concentrations of 15 ppbv were observed from 9 a.m. to 1 p.m., but the levels dropped to below 0.5 ppbv from 1 p.m. to 9 p.m. On 23 March, except for a midday concentration of 1.33 ppbv between 1 p.m. and 5 p.m., isoprene levels were high with 7.89 ppbv from 9 a.m. to 1 p.m. and 15.21 ppbv from 5 p.m. to 9 p.m. On 24 March, the highest concentration was only 2.69 ppbv during midday, while at other times, it showed levels below 1 ppbv. Fire activity gradually increased after the rain on the 19th, leading to significant biomass burning by the 24th. However, the low isoprene levels observed on the 24th suggest that the southerly wind may have minimized the influx from the biomass burning. On 25 March, concentrations were low in the morning but peaked at 6.39 ppbv from 1 p.m. to 5 p.m. and reached the maximum concentration of 25.29 ppbv from 5 p.m. to 9 p.m. Wind data for this day indicated that there was little wind after 1 p.m. The accumulation of isoprene due to the northerly winds in the morning and the westerly winds in the afternoon likely led to a peak in isoprene concentrations between 5 p.m. and 9 p.m. On 26 March, isoprene concentrations were high in the morning at 13.67 ppbv but subsequently decreased to 6.75 ppbv and 3.76 ppbv later in the day. On the 26th, fire activity decreased compared to the 25th, and a southeasterly wind was observed, coming from an area with fewer fire incidents.
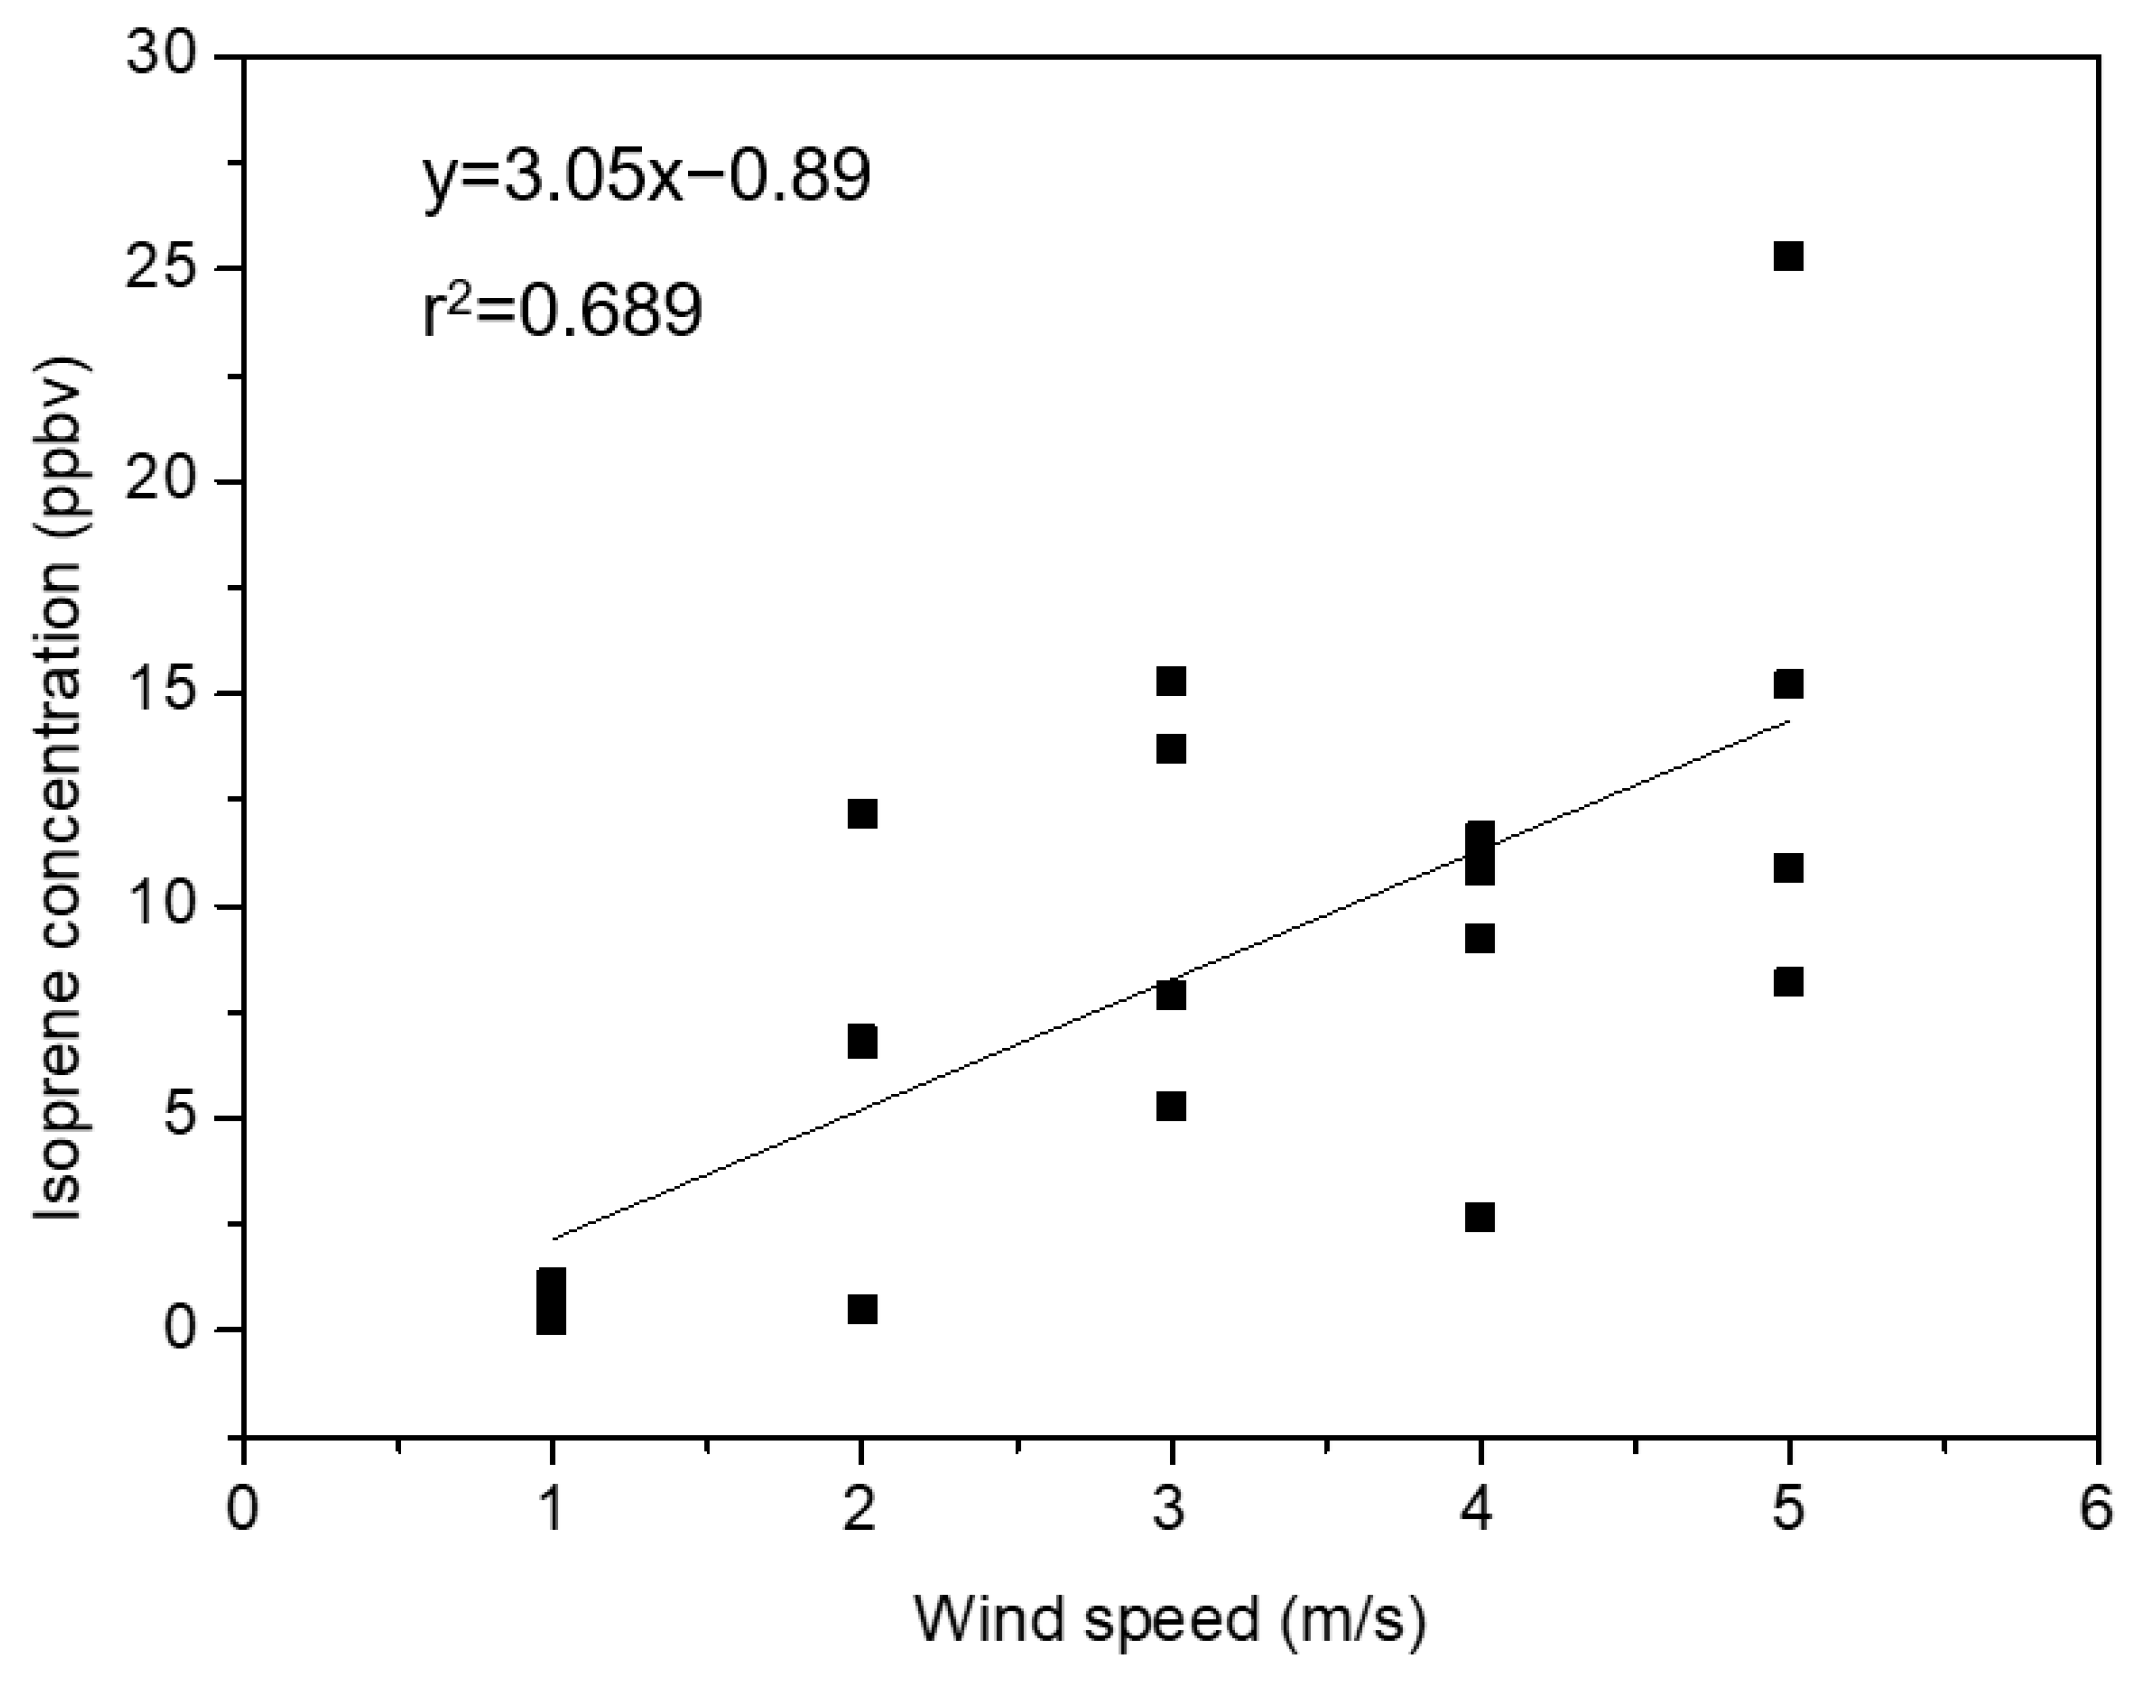
A regression analysis was performed to examine the relationship between isoprene concentrations and wind speed on days with northerly winds (Figure 4). The wind speed on these days was plotted on the x-axis, with isoprene concentrations on the y-axis. The analysis yielded an r2 value of 0.689, indicating a moderate correlation between wind speed and isoprene concentrations. In contrast, the factors most commonly associated with isoprene emissions, such as temperature and PAR, showed much weaker correlations, with r2 values of less than 0.3 for both variables. Therefore, it can be inferred that isoprene concentrations are more likely influenced by biomass burning originating from northern areas of Chiang Mai, rather than by the local vegetation affected by PAR and temperature.
In summary, isoprene concentrations were closely linked to wind patterns. The highest levels were observed when northerly winds subsided, leading to a period of atmospheric stagnation. This was due to isoprene from fires in Myanmar being transported and accumulating in the stagnant air. This is consistent with previous studies reporting that biomass burning-related BVOC emissions predominantly originate from areas near the Thailand–Myanmar border, particularly under the influence of northerly winds [2]. Meanwhile, when southerly winds blew, except for the southwest winds (which were influenced by fires in Myanmar to the west), isoprene concentrations were relatively low. Consequently, the isoprene levels in Chiang Mai are significantly impacted by the long-range transport of biomass burning.
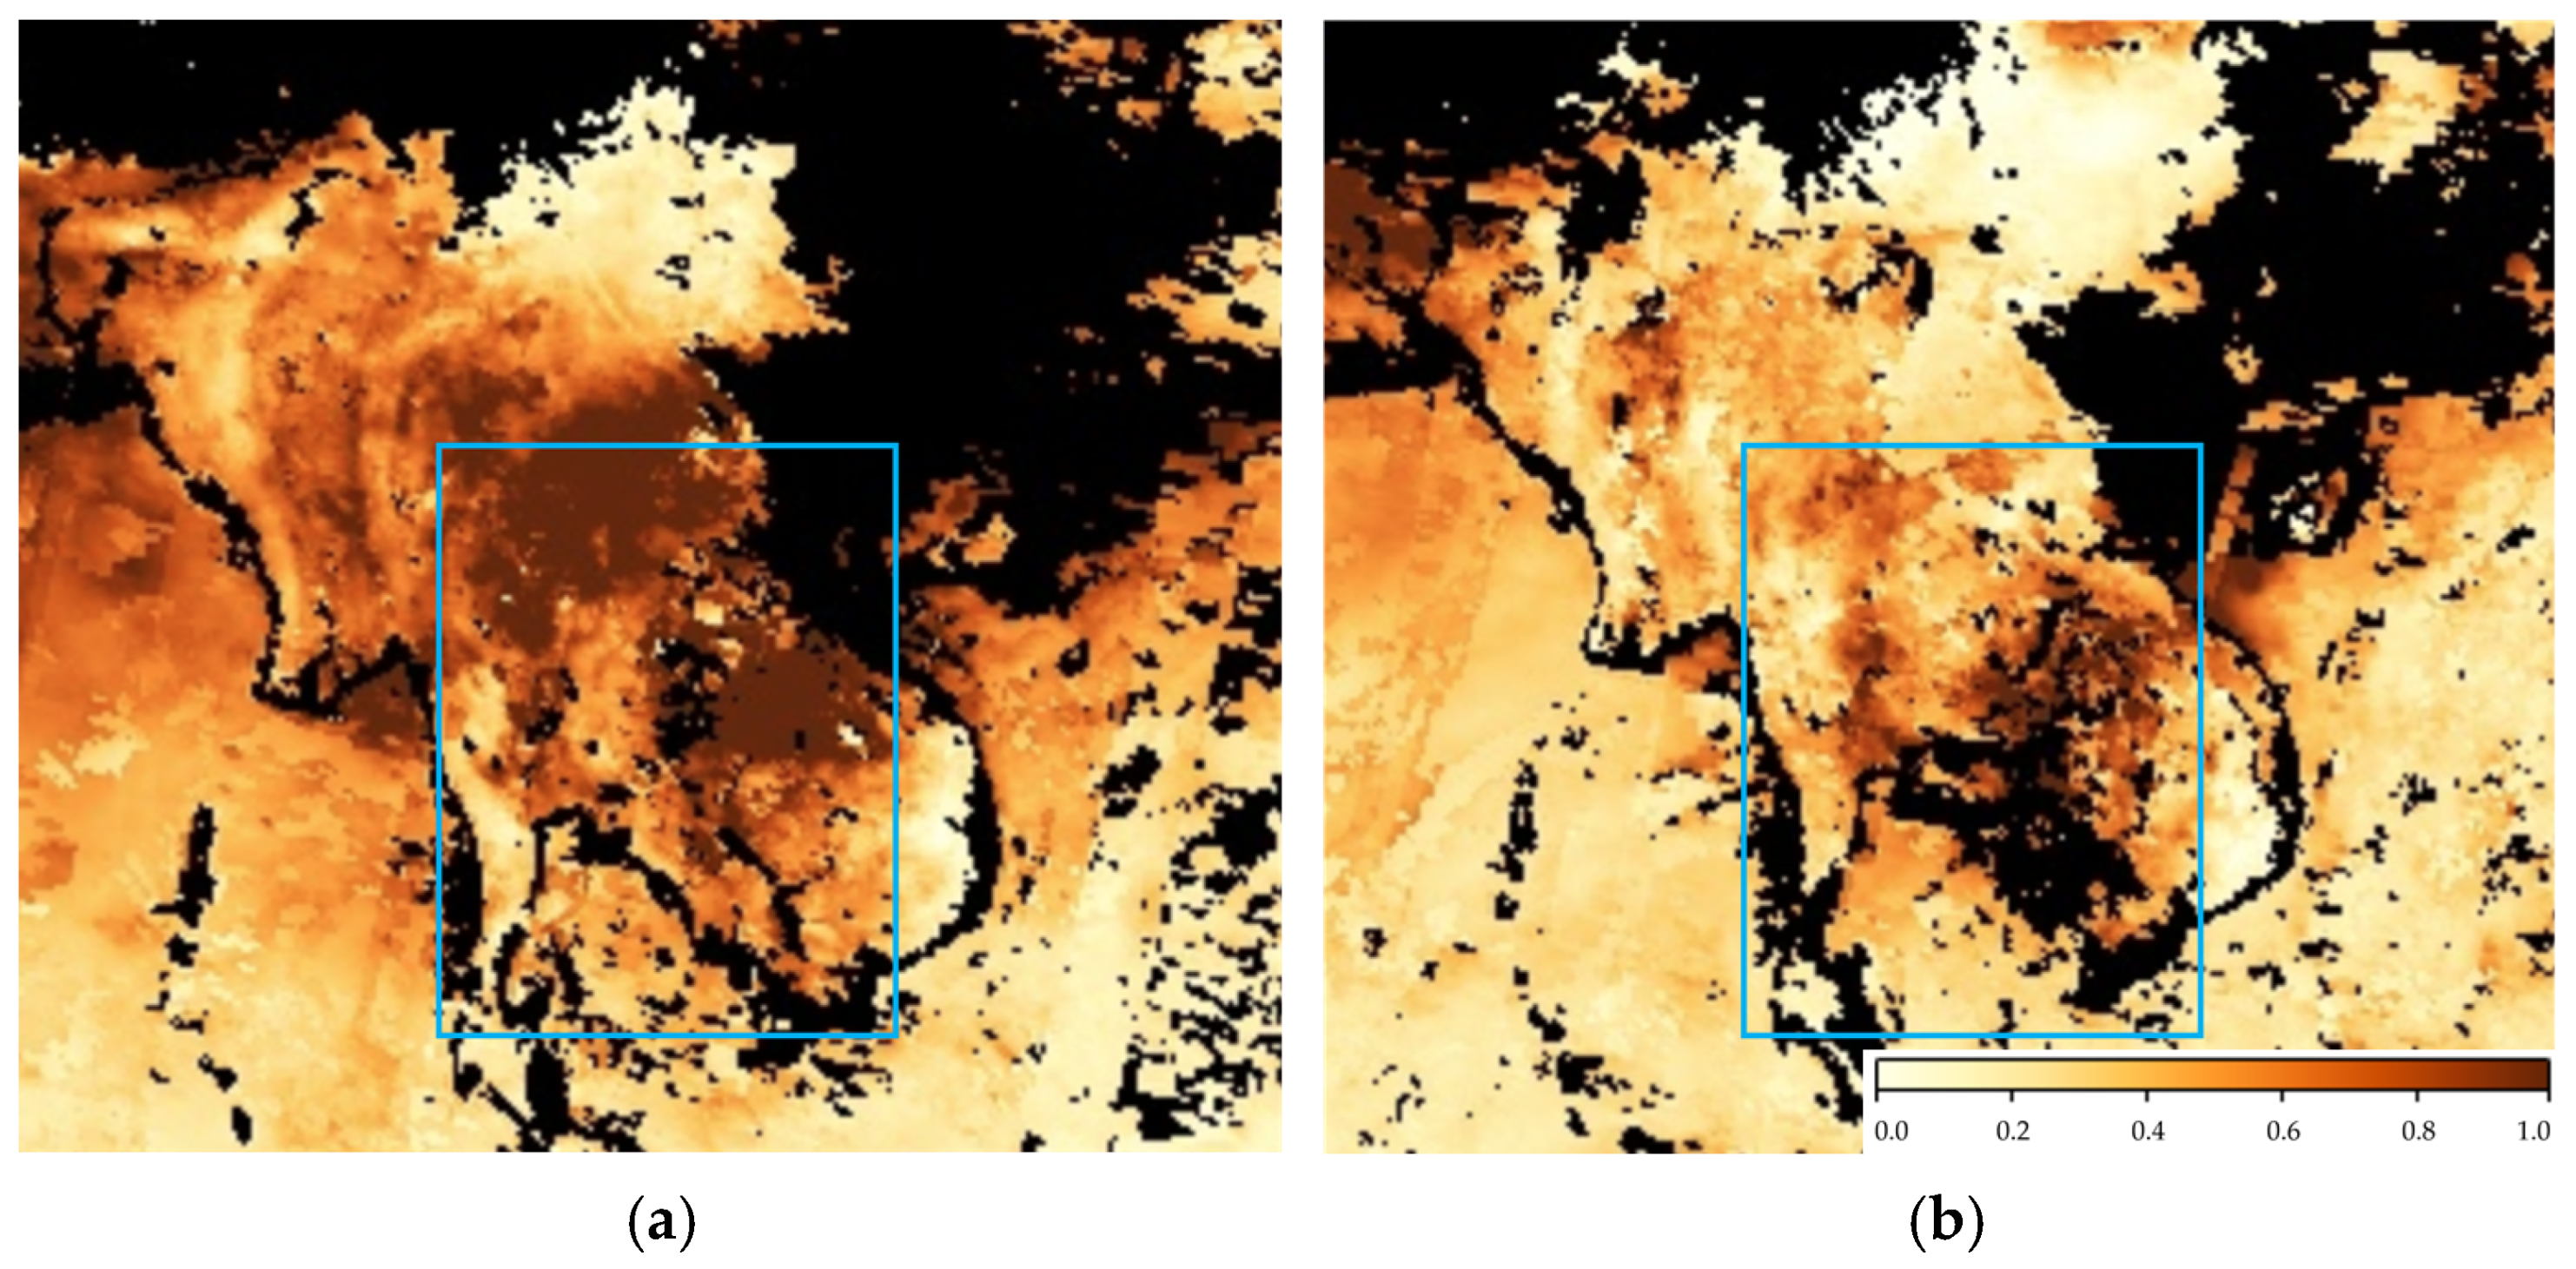
Eight-day interval AOD data were obtained, as shown in Figure 5, where the blue box highlights Thailand and its neighboring regions. An optical thickness of less than 0.1 (palest yellow) indicates a crystal clear sky with maximum visibility, whereas a value of 1 (reddish brown) indicates very hazy conditions. The air quality during the first week (14–21 March) was significantly worse than during the second week (22–29 March). This indicates that more fire events occurred during the first week than during the second week. However, isoprene concentrations were much lower during the first week compared to the second week, which is in contrast with the AOD and overall air quality trend.
Upon reviewing the fire incidents, it was found that during the second week, there was a significant increase in biomass burning activity not only in Myanmar, near Chiang Mai, but also within Chiang Mai itself (Figure 3). While isoprene levels were generally higher due to the influence of northwesterly winds, the local biomass burning in Chiang Mai during the second week also contributed significantly to the increase in isoprene concentrations. Given that isoprene has a short atmospheric lifetime, it responds immediately to local emissions [49]. Therefore, while the northwesterly winds were bringing isoprene from Myanmar’s biomass burning, the local biomass burning in Chiang Mai had an immediate and direct effect on isoprene concentrations in the study area, resulting in the observed peak during the second week.

3.2. Measurement of Carbonyl Compound Concentrations and Emission Characteristics

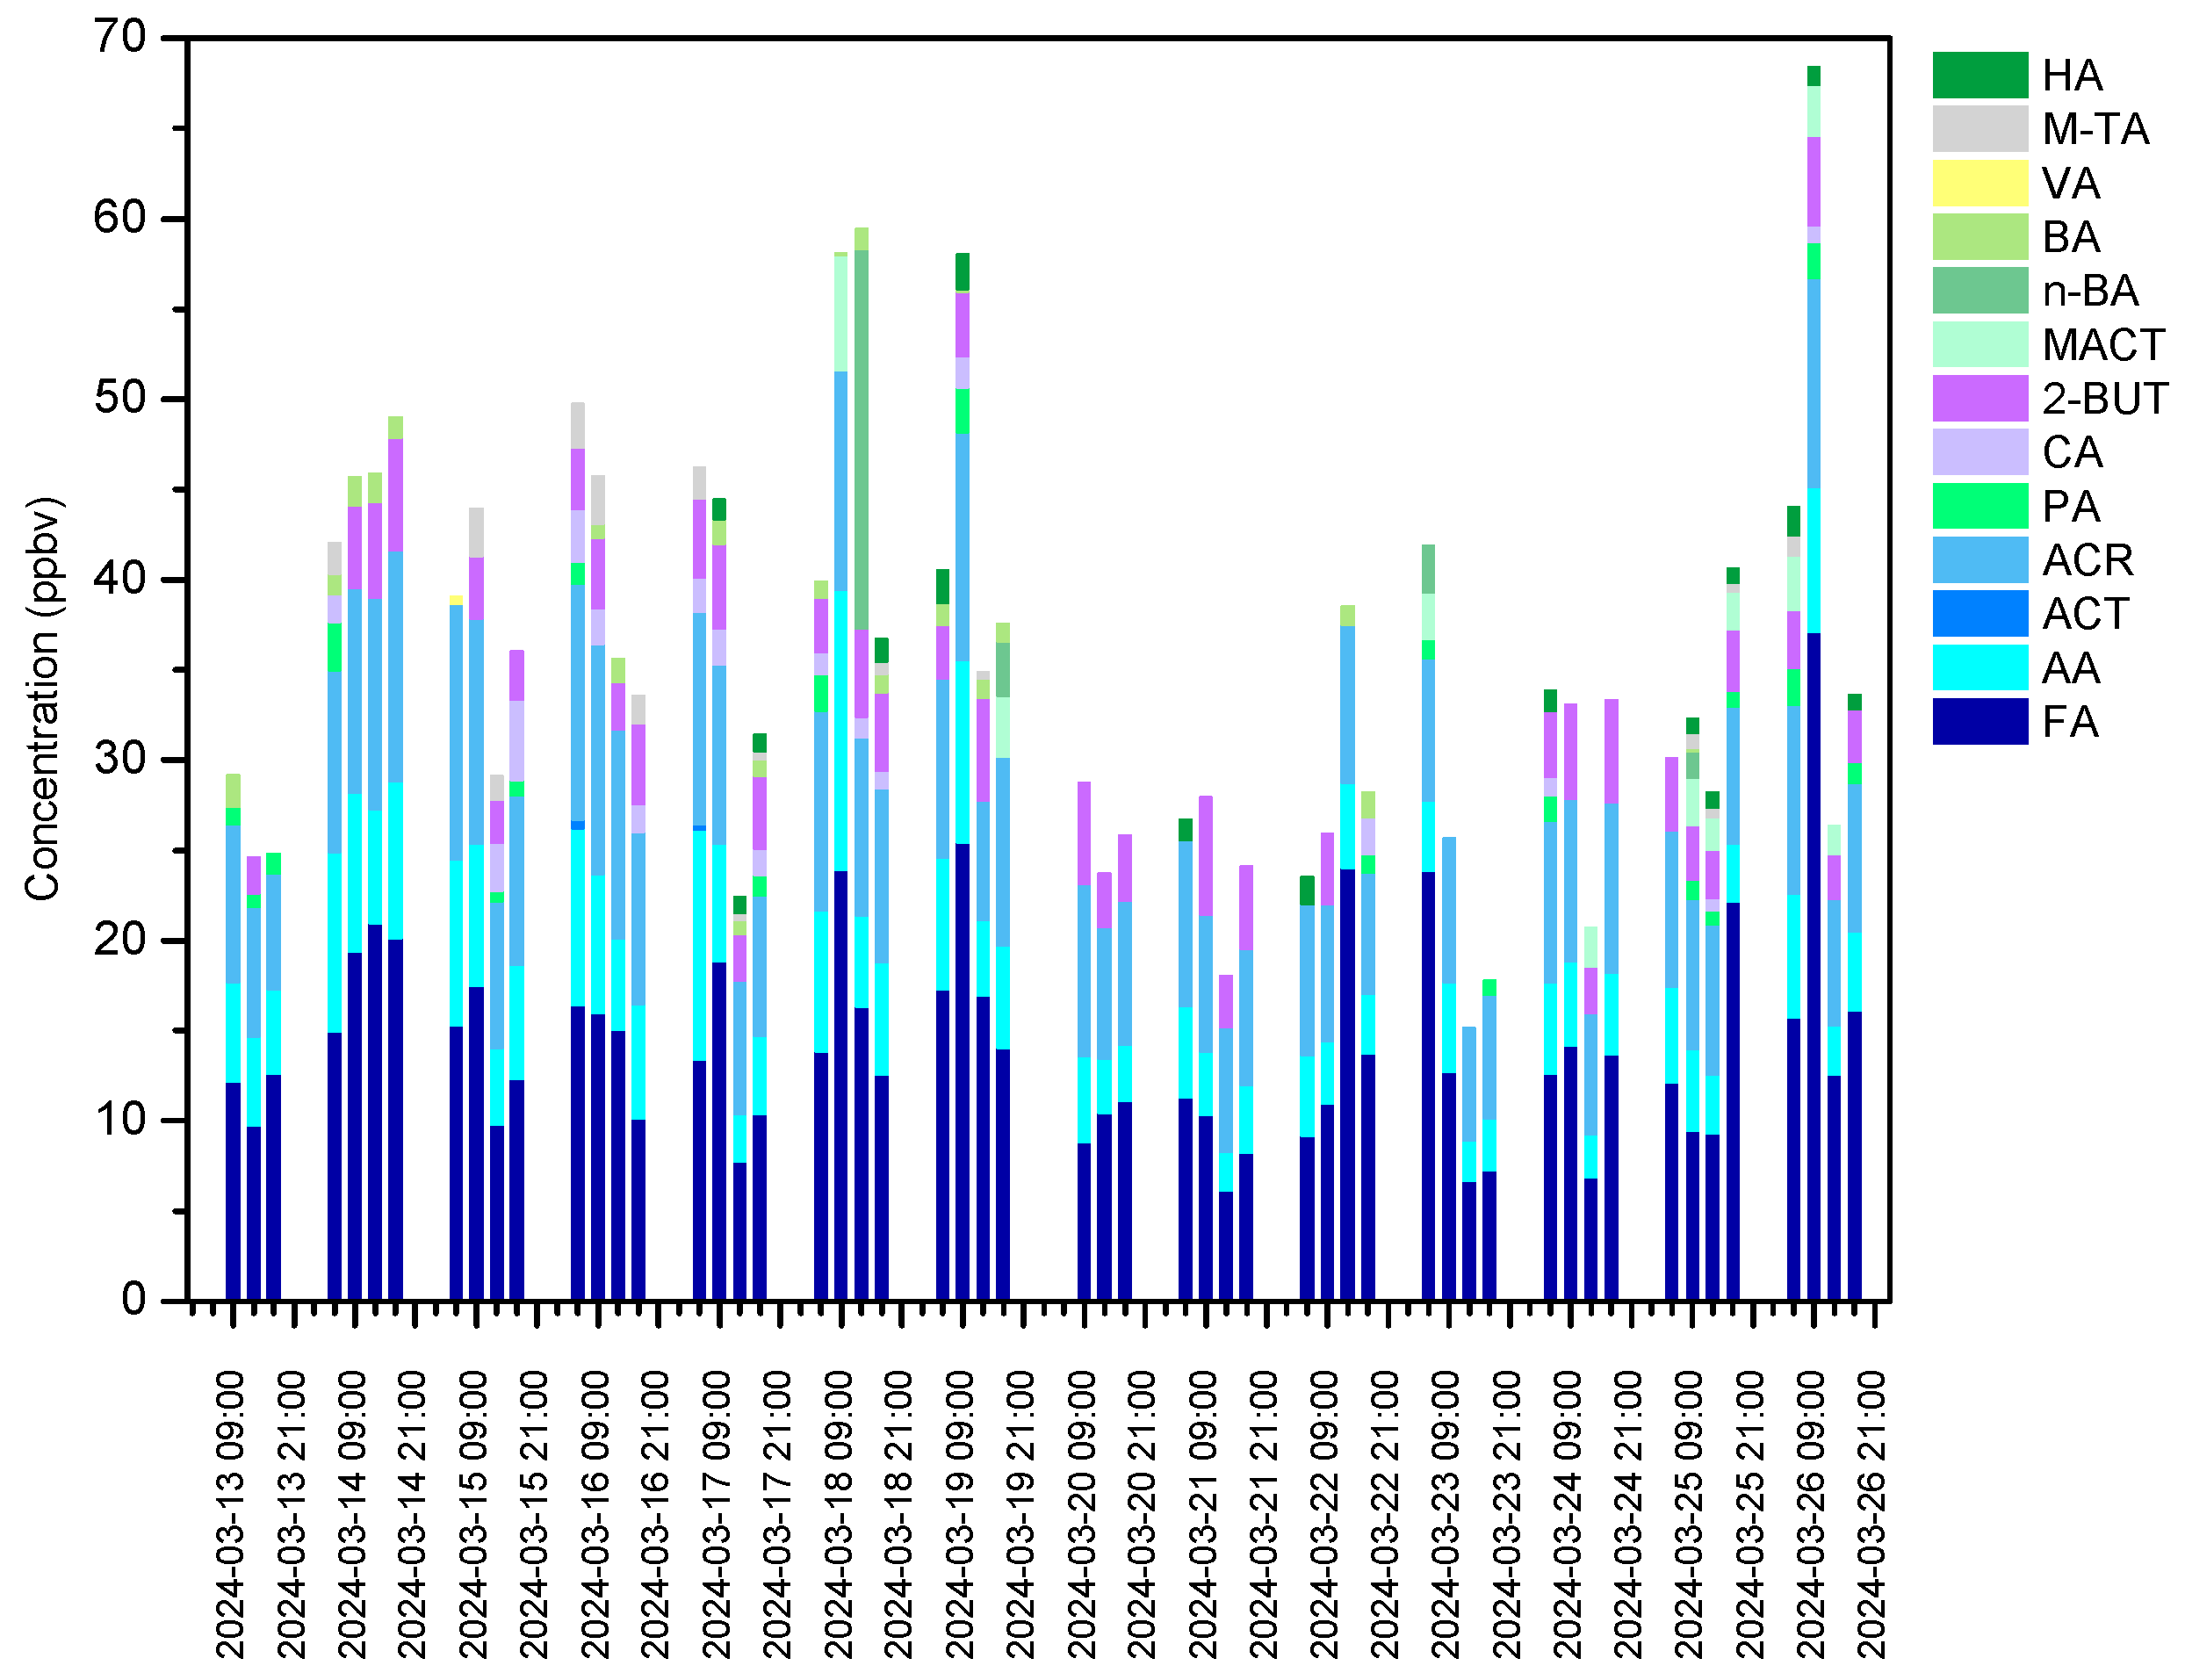
Among the carbonyl compounds, FA, AC, and ACR were continuously detected (Figure 6). 2-BUT was detected almost every hour except for one day. BA, CA, M-TA, and HA were detected intermittently. ACT, PA, MACT, and n-BA were detected only occasionally. The concentration of total carbonyl compounds measured during the sampling period ranged from 15.15 to 79.15 ppbv. The concentration of FA ranged from 6.12 to 37.07 ppbv. The lowest concentration for total carbonyl compounds, 15.15 ppbv, was observed from 1 p.m. to 5 p.m. on 23 March. Although lower traffic on the weekend (Saturday) might have contributed to this, high concentrations were observed on the preceding Saturday and Sunday. It is believed that the rainfall on 20 March and the subsequent reduction in biomass burning contributed to the significant decrease in carbonyl compound concentrations starting from 20 March.
A notable observation was that n-BA, which was not detected at all, was detected at over 20 ppbv only during the period from 9 a.m. to 1 p.m. on 18 March. n-BA can be produced from the incomplete combustion of fuels, and its presence in high concentrations on 18 March may be attributed to severe biomass burning and northeast winds on that day. Meanwhile, at the same time on 26 March, FA was detected at a very high concentration of 37.07 ppbv. This may be related to a significant spike in isoprene concentration, which surged to around 25 ppbv the previous evening because isoprene is a precursor of FA [50,51]. In addition, biomass burning and broadleaf vegetation, which are common sources of both FA and isoprene, are likely responsible.
The diurnal patterns of the most frequently detected carbonyl compounds—formaldehyde (FA), acetaldehyde (AA), and acrolein (AC)—are illustrated (Figure 7). All showed a common pattern of decreasing from 1 p.m. to 5 p.m. and increasing from 5 p.m. to 9 p.m. During this time, solar radiation intensity peaked, leading to increased production of ozone and hydroxyl radicals (OH) in the atmosphere. Carbonyl compounds can react with these radicals, being broken down into smaller molecules. The reaction rates of these carbonyl compounds with OH radicals are known to be fast. For instance, the reaction rate coefficient of acetaldehyde at 25 °C has been reported to be (1.45 ± 0.25) × 10⁻11 cm3 molecule⁻1 s⁻1 [52]. The high concentrations of OH radicals during peak sunlight hours likely result in the photochemical breakdown of carbonyl compounds, contributing to their lower concentrations during the daytime.

3.3. Measurement of BTEX Concentrations and Identification of Emission Sources

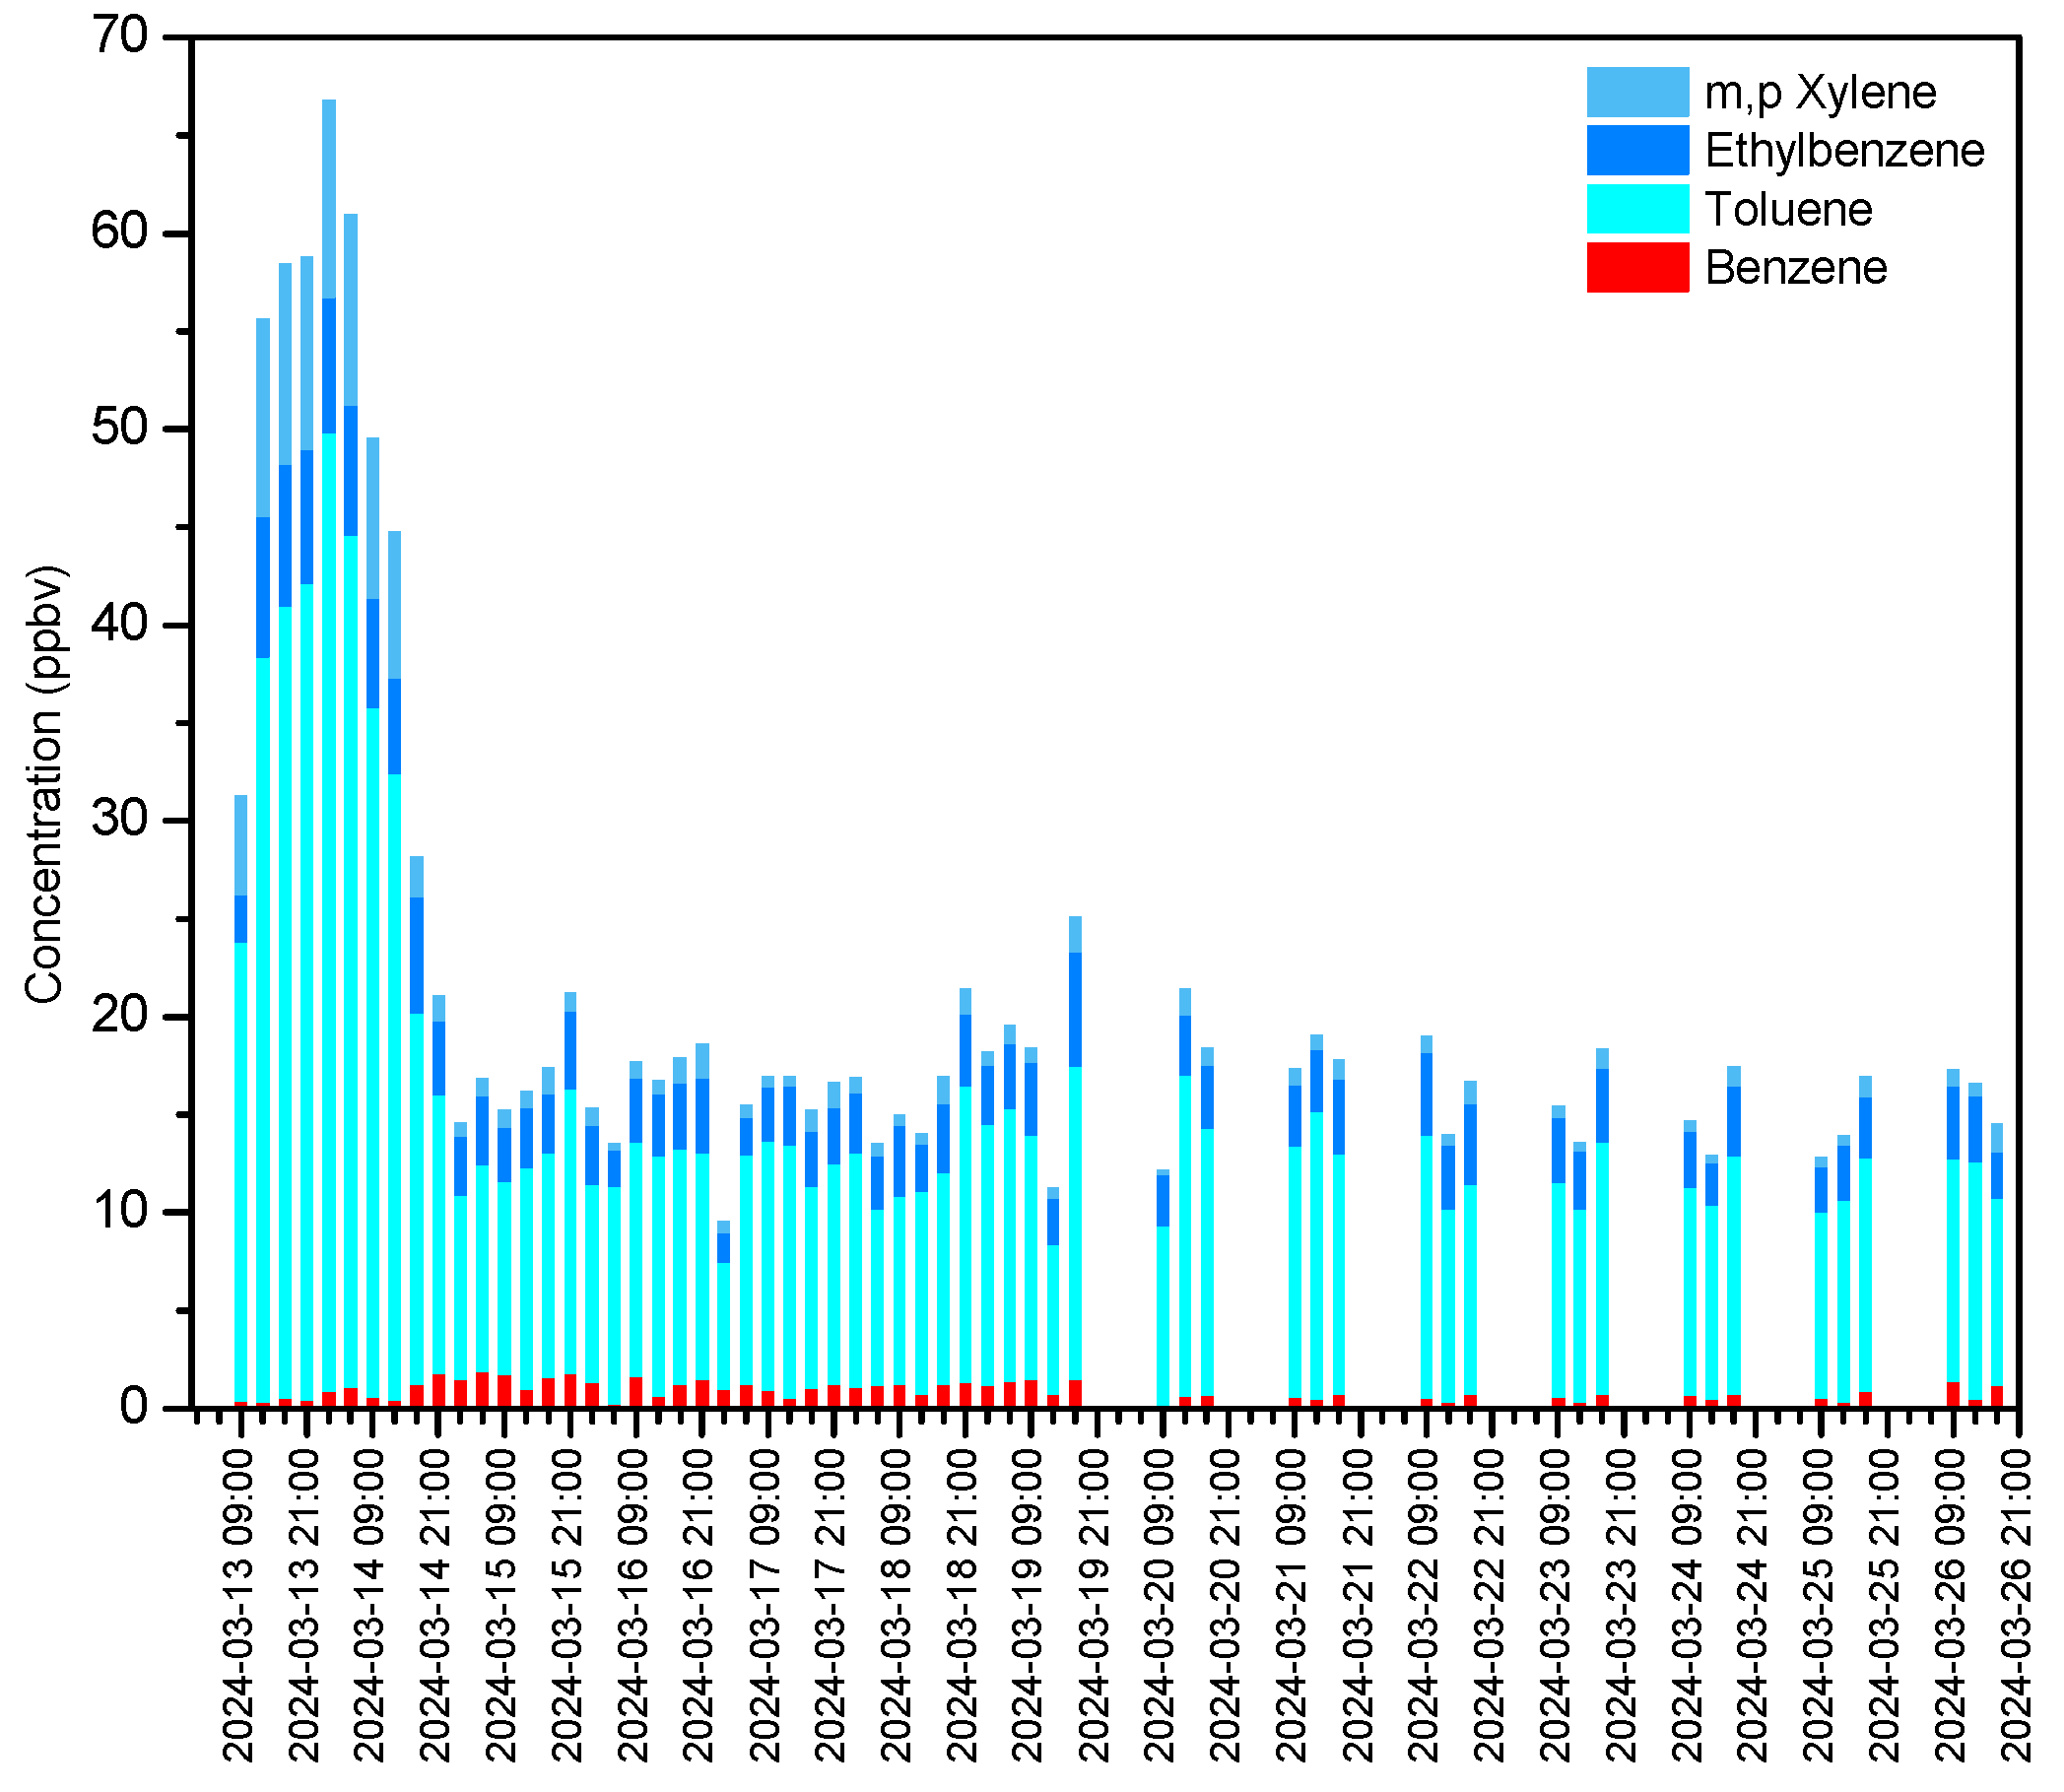
The total concentration of BTEX ranged from 9.57 to 66.57 ppbv (Figure 8). Toluene consistently had the highest proportion among the BTEX compounds, with concentrations approaching 50 ppbv on 14 March before rapidly declining to levels between 6.49 and 16.38 ppbv. Xylene ranged from 0.23 to 10.27 ppbv, initially showing higher concentrations than ethylbenzene but decreasing over time. Benzene, with concentrations ranging from 0.21 to 1.88 ppbv, had the smallest proportion. Compared to roadside locations in Bangkok and Udon Thani, where traffic emissions are a significant factor, the concentration was relatively low [53,54]. In contrast, our measurements were taken from the terrace of the 4th floor of the school, away from direct traffic sources, which likely resulted in lower concentrations. Ref. [55] reported that the benzene concentration at Chiang Mai City Hall and Yupparaj Wittayalai School was 0.7 ppb and 1.0 ppb, respectively. These results suggest that benzene concentrations observed at non-roadside locations, such as the city hall and schools, were consistent with the findings of this study.
The concentration of benzene remained steady at around 1.5 ppbv before dropping below 1.0 ppbv after the evening of the 19th. It then increased again on the 26th, following a similar rise in isoprene and formaldehyde during the same period. This could be attributed to the atmospheric cleansing after the rain and the reduction in biomass burning caused by the rainfall.
According to previous research [56,57], benzene and toluene are the most frequently emitted VOCs during biomass burning. Particularly, benzene is often cited as one of the major volatile organic compounds produced from the incomplete combustion of biomass. Ref. [57] reported that biomass burning contributed 9.5% of atmospheric benzene and 9.7% of toluene. Biomass burning also contributed approximately 14% of acetaldehyde emissions; however, direct comparisons between these contributions are challenging due to differences in overall emission levels among compounds. For instance, benzene has significant industrial sources, which may result in its biomass burning contribution appearing relatively small.
Despite the known contribution of biomass burning to benzene and toluene emissions, this study did not observe clear temporal patterns between the two. Furthermore, neither compound showed a significant correlation with wind direction or biomass burning activity. This aligns with findings from a study in northern Thailand, which reported that biomass burning had a much stronger influence on ethylbenzene and xylenes than on benzene and toluene [58]. This suggests that the weaker biomass burning signal for benzene and toluene observed in this study may be due to their lower source specificity to biomass burning compared to other BTEX compounds.

3.4. Correlation Between Gaseous Compounds and PM2.5

In this study, linear regression was performed to analyze the correlations between the VOCs and PM2.5. The correlation coefficient (r2) values are shown in Table 4. It was found that toluene, ethylbenzene, and xylene showed no correlation with benzene. In contrast, toluene, ethylbenzene, and xylene exhibited a strong correlation with each other. This suggests that benzene may be influenced by different sources or may have different atmospheric pathways compared to the other VOC compounds of concern.
No correlation was observed between isoprene and monoterpenes. Isoprene, with its high volatility and low boiling point, tends to disperse easily in its gaseous state and is capable of long-range transport in the atmosphere. Additionally, due to its high reactivity, isoprene tends to be oxidized more quickly than monoterpenes. Monoterpenes, on the other hand, have lower volatility compared to isoprene and, thus, may have a shorter atmospheric transport range. Consequently, their concentration patterns in urban areas differ due to their distinct transport pathways. While isoprene showed little correlation with other substances, monoterpenes exhibited a concentration trend similar to that of BTEX. All these compounds were observed to be high initially and then sharply decrease. Therefore, it appears that the burning of coniferous trees due to wildfires at that time resulted in the simultaneous release of monoterpenes and BTEX.
Although monoterpenes exhibited a high correlation with toluene, ethylbenzene, and m,p-xylene, the correlation with benzene was low. This discrepancy suggests that biomass burning alone may not fully explain the observed patterns. Given that benzene is considered a representative marker for biomass burning, it is expected that if biomass burning were the primary cause for the concentrations of monoterpenes and toluene, benzene would also show a similar correlation. The low correlation of benzene, however, indicates that it may have originated from distant sources or followed a different atmospheric pathway. The sampling site was located at a university in Chiang Mai’s urban area, not in an industrial area where benzene emissions would be more prevalent. Consequently, benzene may have been transported from distant sources. Benzene has a long atmospheric lifetime and is relatively stable with low reactivity towards OH radicals, whereas toluene’s reactivity with OH radicals is about five times higher than that of benzene (Table 5). The high correlation between benzene and PM2.5, compared to other BTEX compounds, suggests that both may have originated from biomass burning. In contrast, monoterpenes, ethylbenzene, toluene, and m,p-xylene are likely to have come from common local emission sources or, at the very least, followed similar atmospheric transformation pathways.
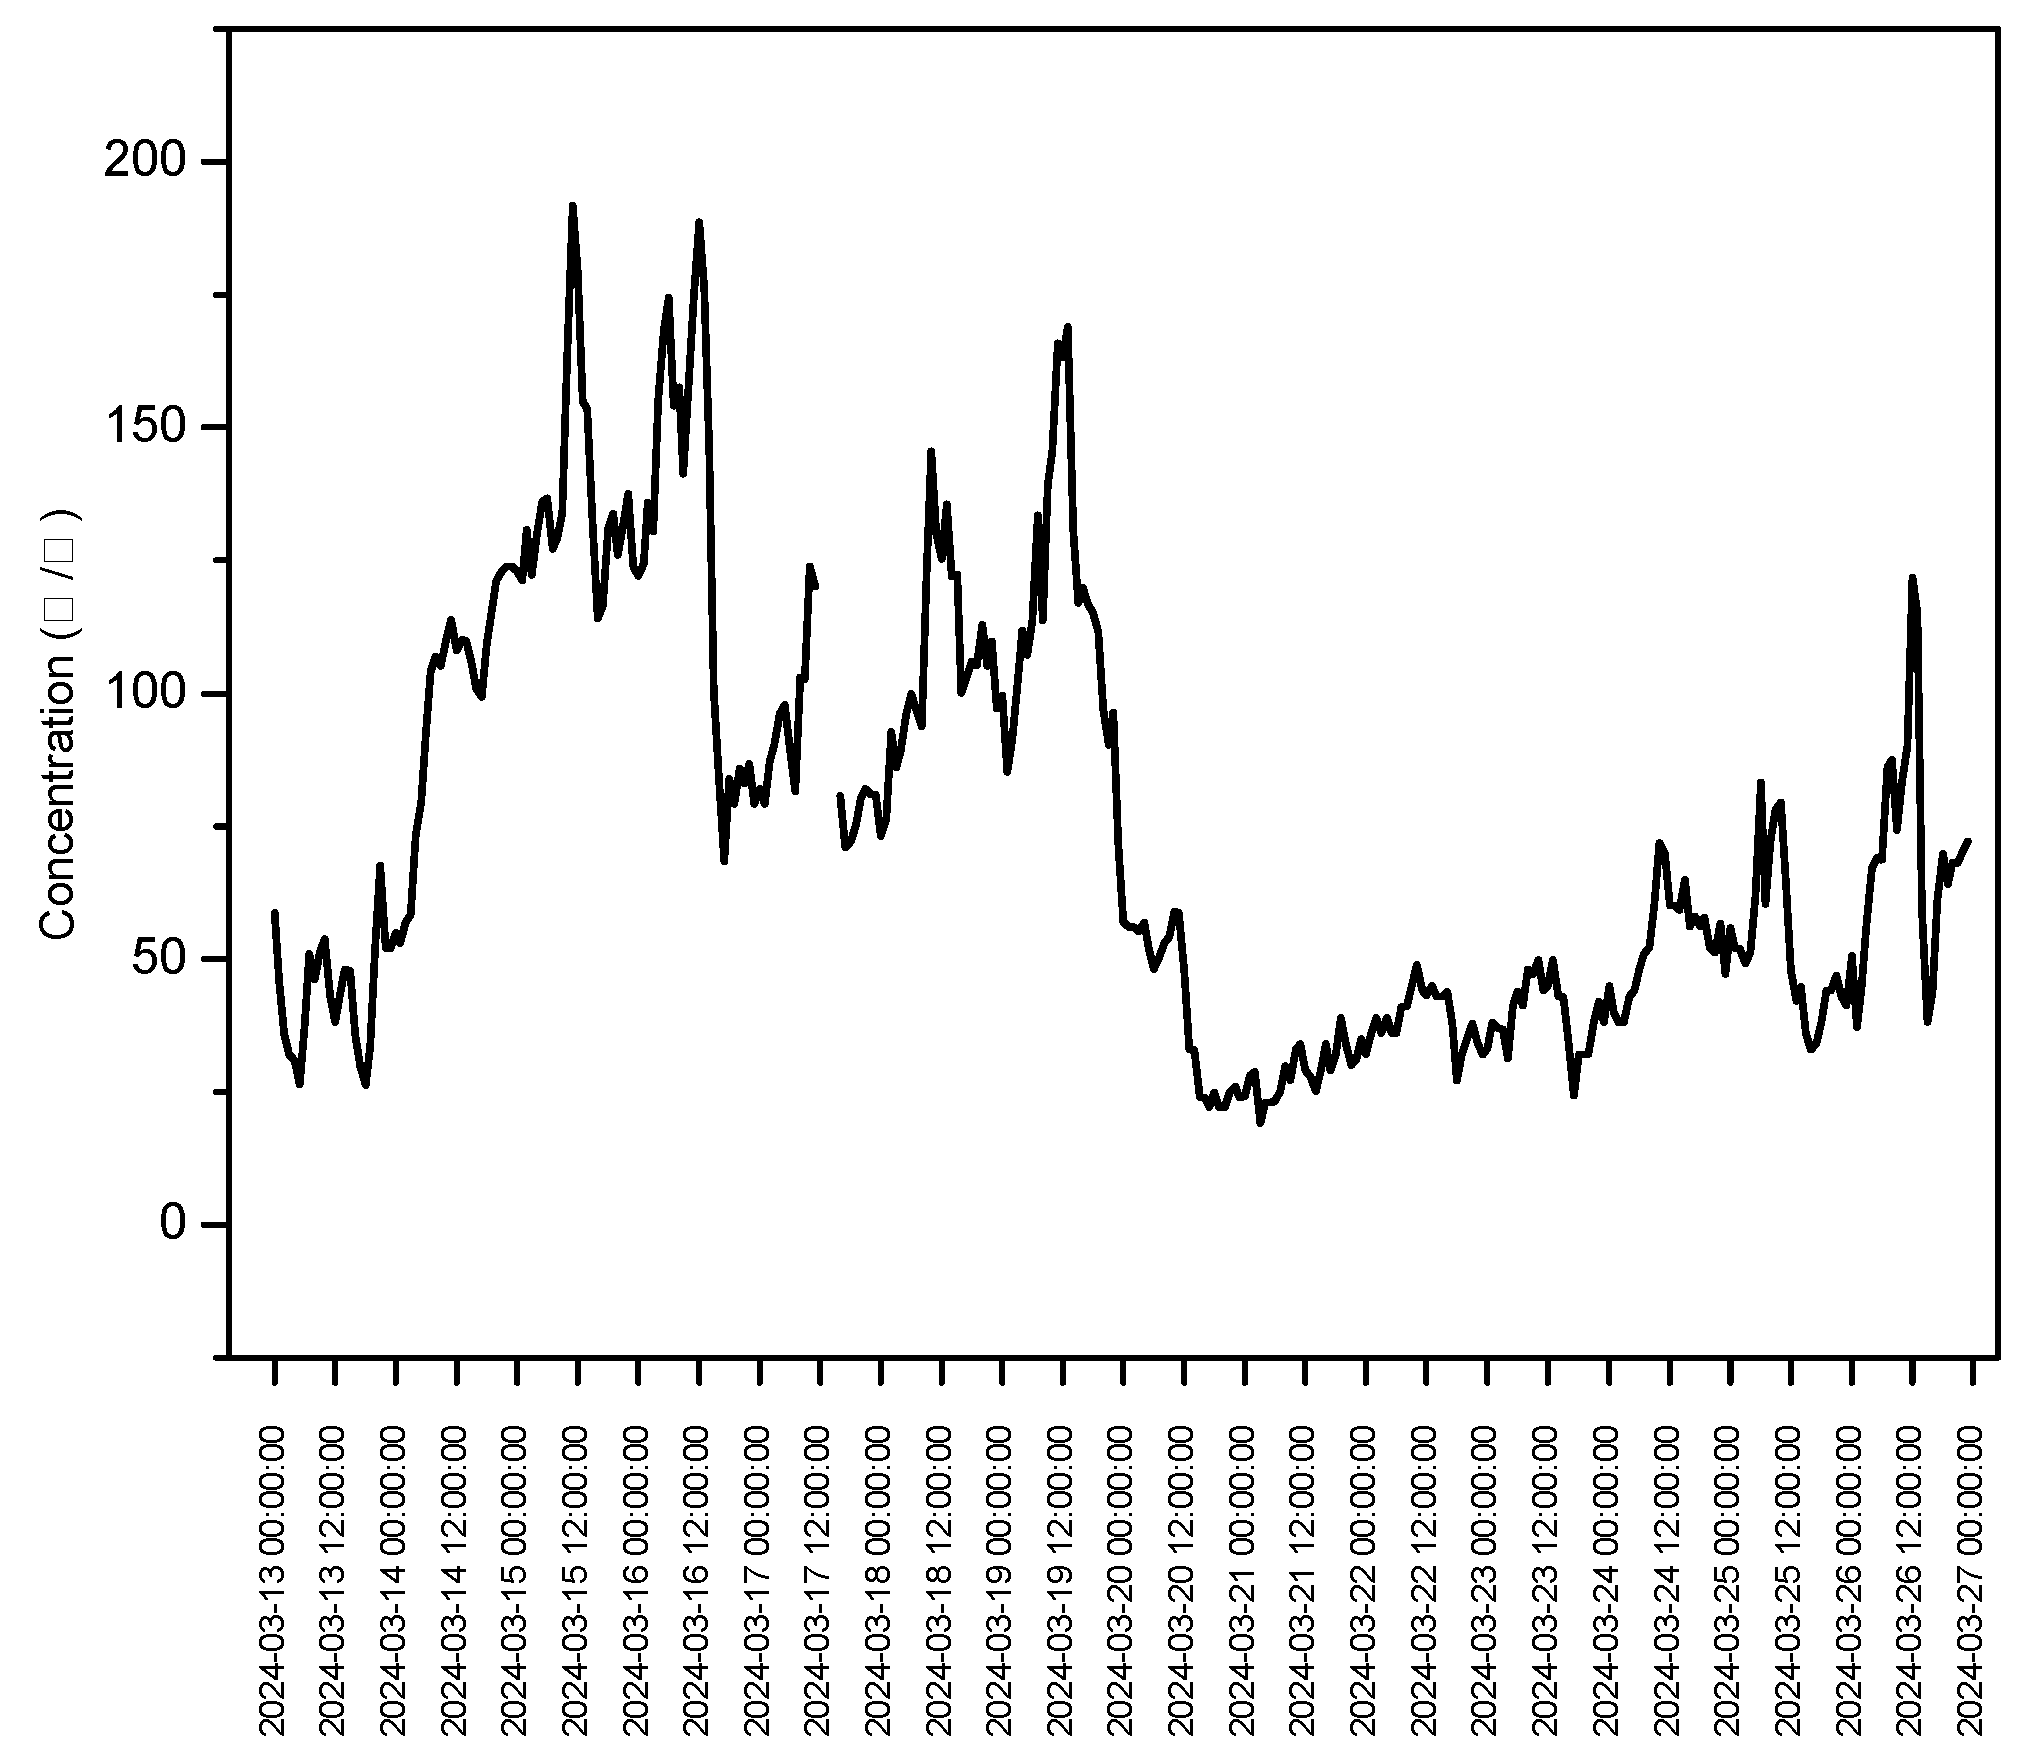
The concentration of PM2.5 during this period was obtained from the Thailand Pollution Control Department (PCD) (Figure 9). Among the VOCs analyzed, benzene, acetaldehyde, and acrolein showed particularly high correlations with PM2.5 concentrations. This is attributed to their well-documented potential to form SOA through atmospheric oxidation processes. Benzene readily undergoes photochemical oxidation in the presence of OH radicals, leading to the formation of low-volatility organic compounds that contribute to SOA growth [60]. Acetaldehyde, a common carbonyl compound, is not only a primary emission product from biomass burning but also a secondary product formed through VOC oxidation. It can further react to produce organic acids and water-soluble organic compounds, facilitating aerosol formation under humid conditions [60,61]. Acrolein, a reactive unsaturated carbonyl compound, is similarly emitted from biomass combustion and is prone to atmospheric oxidation, promoting particle-phase partitioning under the region’s dry and stagnant conditions [62,63]. These processes are particularly important in Chiang Mai during the dry season, when intense solar radiation, strong photochemistry, and widespread biomass burning create favorable conditions for enhanced SOA formation.
A ratio analysis among compounds was conducted to identify their emission sources (Table 6). Although diagnostic ratios are widely used for source identification, they may be affected by atmospheric processes such as photochemical aging and mixing of multiple emission sources, potentially leading to variability in their interpretation. Nevertheless, this approach was utilized alongside correlation analysis as a preliminary assessment method.
The toluene-to-benzene (T/B) ratios ranging from 0.5 to 4.3 suggest vehicular emissions. A T/B ratio of less than 3 is indicative of vehicular emissions as the predominant source [64,65,66]. In our study, the lowest observed T/B ratio was 7.49, indicating that vehicular emissions were not the primary source.
Both the xylene-to-benzene (X/B) ratio and the m,p-xylene-to-ethylbenzene (m-,p-X/E) ratio exceeding 1.8 suggest emissions from local sources [65,67,68]. If these ratios were below 1.8, it would indicate contributions from long-range transported air masses mixed with predominant vehicular emissions. In our study, with the exception of the first two days, all the ratios were below 1.8, suggesting that the pollutants were likely transported over long distances.
The formaldehyde-to-acetaldehyde (FA/AA) ratio being greater than 1 indicates the dominance of in situ formation through photochemical reactions. When the FA/AA ratio exceeds 2, it suggests additional contributions from biogenic emissions [62,63]. In our study, the FA/AA ratio was consistently above 1, indicating that formaldehyde and acetaldehyde were primarily generated through photochemical reactions at the sampling location. Additionally, except for one day (18 March), where the FA/AA ratio was 1.97, all other values exceeded 2, suggesting significant contributions from biogenic sources. During this period in Chiang Mai, the sunlight was intense, which likely caused photochemical reactions of other VOCs and BVOCs, leading to the formation of carbonyl compounds. Therefore, the ratio analysis results indicate a high contribution from local photochemical reactions in the formation of FA and AA [69].
In summary, it was found that BTEX compounds were predominantly derived from long-range transported pollutants. These BTEX compounds contributed to the formation of SOA, thereby worsening air quality. This is consistent with the air mass trajectory analysis [70], which also addressed air quality in northern Thailand during this period. The study identified that the majority of pollutants in this region were linked to long-range transported biomass burning. In contrast to BTEX, which primarily contributed to SOA formation, formaldehyde and acetaldehyde appear to be products of local photochemical reactions, with additional contributions from biogenic sources associated with biomass burning.

4. Conclusions

During the episode season in Chiang Mai, samples of BTEX, BVOCs, and carbonyl compounds were collected and analyzed to determine the emission characteristics of VOCs. When winds transported from the severe side of biomass burning, a marked increase in atmospheric isoprene concentrations was observed. At its peak, concentrations exceeded 25 ppbv. In contrast, monoterpene concentrations were high only during the first two days (~9.15 ppbv), which is believed to have resulted from fires in the adjacent coniferous forests.
The ratio comparison of the various compounds suggests that, in terms of BTEX concentrations, the long-range transport of air pollutants was more pronounced than that of local vehicle emissions. Consequently, it is believed that biomass burning near the borders of Thailand, Myanmar, and Laos constitutes the primary source of emissions. Among the BTEX, benzene exhibited a strong correlation with PM2.5 concentrations. Additionally, carbonyl compounds were detected at particularly high levels during the episode period compared to normal times. Acetaldehyde and acrolein showed a significant correlation with PM2.5, while formaldehyde had a low correlation but reached a remarkably high maximum concentration of 37 ppbv. Based on the ratio with acetaldehyde, it appears that formaldehyde is primarily influenced by nearby photochemical reactions, with additional contributions from biological emissions.
During the episode period, VOC concentrations in Chiang Mai increased significantly, with fire activity serving as a primary contributor. The elevated levels of VOCs in the atmosphere likely reacted to form additional VOCs, which can subsequently contribute to the formation of SOA and PM2.5. Therefore, it is imperative to exercise caution regarding open biomass burning during this period. To effectively mitigate air pollution during such high-pollution episodes, a comprehensive air quality management strategy is required. This should include strengthened regulations on biomass burning, enhanced monitoring of VOC emissions, and improved public awareness and participation in pollution control efforts. In addition, the adoption of emerging air pollution control technologies could support these efforts by improving the removal of particulate matter and VOC precursors from key emission sources. By combining stricter emission controls with real-time air quality monitoring, public engagement, and appropriate technological measures, it may be possible to reduce the formation of secondary pollutants and alleviate severe air pollution events in Chiang Mai and other regions experiencing similar environmental challenges.
Nonetheless, a limitation of this study was the absence of air mass trajectory modelling to clearly identify the sources of the target compounds. Therefore, future research should incorporate air mass trajectory analysis to better understand the origins of these compounds.

Author Contributions

Conceptualization, J.-C.K., T.-V.D. and D.-H.B.; Methodology, T.-V.D. and D.-H.B.; Investigation, D.-H.B., Y.-B.S., J.-S.G. and J.-S.L.; Resources, D.-H.B., D.T., S.-W.L. and I.-Y.C.; Data Curation, D.-H.B. and Y.-B.S.; Project Administration, J.-C.K., G.-W.L. and M.-H.L.; Writing—Original Draft Preparation, D.-H.B.; Writing—Review and Editing, T.-V.D. and J.-C.K.; Supervision, T.-V.D. and J.-C.K. All authors have read and agreed to the published version of the manuscript.

Funding

This research received no external funding.

Institutional Review Board Statement

Not applicable.

Informed Consent Statement

Not applicable.

Data Availability Statement

The data are contained in the article. The detailed data are available from the corresponding author upon reasonable request.

Acknowledgments

This work was supported by a grant from the National Institute of Environmental Research (NIER), funded by the Ministry of Environment (ME) of the Republic of Korea (NIER-2023-04-02-089). This work was supported by a National Research Foundation of Korea (NRF) grant funded by the Korea government (MSIT) (No. 2023R1A2C2002956).

Conflicts of Interest

The authors declare no conflicts of interest.

References

  1. Amnuaylojaroen, T.; Parasin, N.; Limsakul, A. Health Risk Assessment of Exposure Near-Future PM2.5 in Northern Thailand. Air Qual. Atmos. Health 2022, 15, 1963–1979. [Google Scholar] [CrossRef]
  2. Chansuebsri, S.; Kolar, P.; Kraisitnitikul, P.; Kantarawilawan, N.; Yabueng, N.; Wiriya, W.; Thepnuan, D.; Chantara, S. Chemical Composition and Origins of PM2.5 in Chiang Mai (Thailand) by Integrated Source Apportionment and Potential Source Areas. Atmos. Environ. 2024, 327, 120517. [Google Scholar] [CrossRef]
  3. Amnuaylojaroen, T.; Macatangay, R.C.; Khodmanee, S. Modeling the Effect of VOCs from Biomass Burning Emissions on Ozone Pollution in Upper Southeast Asia. Heliyon 2019, 5, e02661. [Google Scholar] [CrossRef] [PubMed]
  4. Phairuang, W.; Suwattiga, P.; Chetiyanukornkul, T.; Hongtieab, S.; Limpaseni, W.; Ikemori, F.; Hata, M.; Furuuchi, M. The Influence of the Open Burning of Agricultural Biomass and Forest Fires in Thailand on the Carbonaceous Components in Size-Fractionated Particles. Environ. Pollut. 2019, 247, 238–247. [Google Scholar] [CrossRef]
  5. Yadav, I.C.; Linthoingambi Devi, N.; Li, J.; Syed, J.H.; Zhang, G.; Watanabe, H. Biomass Burning in Indo-China Peninsula and Its Impacts on Regional Air Quality and Global Climate Change-a Review. Environ. Pollut. 2017, 227, 414–427. [Google Scholar] [CrossRef]
  6. Pasukphun, N. Environmental Health Burden of Open Burning in Northern Thailand: A Review. PSRU J. Sci. Technol. 2018, 3, 11–28. [Google Scholar]
  7. Narita, D.; Oanh, N.T.K.; Sato, K.; Huo, M.; Permadi, D.A.; Chi, N.N.H.; Ratanajaratroj, T.; Pawarmart, I. Pollution Characteristics and Policy Actions on Fine Particulate Matter in a Growing Asian Economy: The Case of Bangkok Metropolitan Region. Atmosphere 2019, 10, 227. [Google Scholar] [CrossRef]
  8. Weger, M.; Heinold, B. Air Pollution Trapping in the Dresden Basin from Gray-Zone Scale Urban Modeling. Atmos. Chem. Phys. 2023, 23, 13769–13790. [Google Scholar] [CrossRef]
  9. Wang, Y.; Liu, H.; Liu, Y.; Wang, S.; Wang, L.; Li, X. Effect of Land–Atmosphere Process Parameterizations on the PM Simulation of a River Valley City with Complex Topography. Atmos. Res. 2023, 281, 106505. [Google Scholar] [CrossRef]
  10. Johnson, M.S.; Strawbridge, K.; Knowland, K.E.; Keller, C.; Travis, M. Long-Range Transport of Siberian Biomass Burning Emissions to North America during FIREX-AQ. Atmos. Environ. 2021, 252, 118241. [Google Scholar] [CrossRef]
  11. Reid, J.S.; Hyer, E.J.; Johnson, R.S.; Holben, B.N.; Yokelson, R.J.; Zhang, J.; Campbell, J.R.; Christopher, S.A.; Di Girolamo, L.; Giglio, L.; et al. Observing and Understanding the Southeast Asian Aerosol System by Remote Sensing: An Initial Review and Analysis for the Seven Southeast Asian Studies (7SEAS) Program. Atmos. Res. 2013, 122, 403–468. [Google Scholar] [CrossRef]
  12. Liu, M.; Chen, L.; Xie, D.; Sun, J.; He, Q.; Cai, L.; Gao, Z.; Zhang, Y. Monsoon-Driven Transport of Atmospheric Mercury to the South China Sea from the Chinese Mainland and Southeast Asia—Observation of Gaseous Elemental Mercury at a Background Station in South China. Environ. Sci. Pollut. Res. 2016, 23, 21631–21640. [Google Scholar] [CrossRef]
  13. Cao, J.; Situ, S.; Hao, Y.; Xie, S.; Li, L. Enhanced Summertime Ozone and SOA from Biogenic Volatile Organic Compound (BVOC) Emissions Due to Vegetation Biomass Variability during 1981-2018 in China. Atmos. Chem. Phys. 2022, 22, 2351–2364. [Google Scholar] [CrossRef]
  14. Zhang, H.; Yee, L.D.; Lee, B.H.; Curtis, M.P.; Worton, D.R.; Isaacman-VanWertz, G.; Offenberg, J.H.; Lewandowski, M.; Kleindienst, T.E.; Beaver, M.R.; et al. Monoterpenes Are the Largest Source of Summertime Organic Aerosol in the Southeastern United States. Proc. Natl. Acad. Sci. USA 2018, 115, 2038–2043. [Google Scholar] [CrossRef] [PubMed]
  15. Li, Q.; Su, G.; Li, C.; Liu, P.; Zhao, X.; Zhang, C.; Sun, X.; Mu, Y.; Wu, M.; Wang, Q.; et al. An Investigation into the Role of VOCs in SOA and Ozone Production in Beijing, China. Sci. Total Environ. 2020, 720, 137536. [Google Scholar] [CrossRef] [PubMed]
  16. Wu, K.; Yang, X.; Chen, D.; Gu, S.; Lu, Y.; Jiang, Q.; Wang, K.; Ou, Y.; Qian, Y.; Shao, P.; et al. Estimation of Biogenic VOC Emissions and Their Corresponding Impact on Ozone and Secondary Organic Aerosol Formation in China. Atmos. Res. 2020, 231, 104656. [Google Scholar] [CrossRef]
  17. Paris, A.; Gaillard, J.L.; Ledauphin, J. Impact of Biomass Combustion on Occurrence and Distribution of Aromatic Hydrocarbons in Apples. Environ. Sci. Pollut. Res. 2020, 27, 3165–3172. [Google Scholar] [CrossRef]
  18. Han, T.; Ma, Z.; Xu, W.; Qiao, L.; Li, Y.; He, D.; Wang, Y. Characteristics and Source Implications of Aromatic Hydrocarbons at Urban and Background Areas in Beijing, China. Sci. Total Environ. 2020, 707, 136083. [Google Scholar] [CrossRef]
  19. Shen, H.; Huang, Y.; Wang, R.; Zhu, D.; Li, W.; Shen, G.; Wang, B.; Zhang, Y.; Chen, Y.; Lu, Y.; et al. Global Atmospheric Emissions of Polycyclic Aromatic Hydrocarbons from 1960 to 2008 and Future Predictions. Environ. Sci. Technol. 2013, 47, 6415–6424. [Google Scholar] [CrossRef]
  20. Guenther, A.; Hewitt, C.N.; Erickson, D.; Fall, R.; Geron, C.; Graedel, T.; Harley, P.; Klinger, L.; Lerdau, M.; Mckay, W.A.; et al. A Global Model of Natural Volatile Organic Compound Emissions. J. Geophys. Res. 1995, 100, 8873. [Google Scholar] [CrossRef]
  21. Sindelarova, K.; Granier, C.; Bouarar, I.; Guenther, A.; Tilmes, S.; Stavrakou, T.; Müller, J.-F.; Kuhn, U.; Stefani, P.; Knorr, W. Global Data Set of Biogenic VOC Emissions Calculated by the MEGAN Model over the Last 30 Years. Atmos. Chem. Phys. 2014, 14, 9317–9341. [Google Scholar] [CrossRef]
  22. Wang, H.; Liu, X.; Wu, C.; Lin, G. Regional to Global Distributions, Trends, and Drivers of Biogenic Volatile Organic Compound Emission from 2001 to 2020. Atmos. Chem. Phys. 2024, 24, 3309–3328. [Google Scholar] [CrossRef]
  23. Verma, S.K.; Kawamura, K.; Deshmukh, D.K.; Haque, M.M.; Pavuluri, C.M. Seasonal Characteristics of Biogenic Secondary Organic Aerosols Over Chichijima Island in the Western North Pacific: Impact of Biomass Burning Activity in East Asia. J. Geophys. Res. Atmos. 2021, 126, e2020JD032987. [Google Scholar] [CrossRef]
  24. Herman, F.; Sentian, J.; Kong, V.; Yee, W.; Ooi, M.; Gee, C.; Sharul, M.; Nad-Zir, M. Isoprene Emission under Climate Change Scenario in Southeast Asia. Preprints 2023, 2023030394. [Google Scholar] [CrossRef]
  25. Vella, R.; Pozzer, A.; Forrest, M.; Lelieveld, J.; Hickler, T.; Tost, H. Changes in Biogenic Volatile Organic Compound Emissions in Response to the El Niño-Southern Oscillation. Biogeosciences 2023, 20, 4391–4412. [Google Scholar] [CrossRef]
  26. Liu, Q.; Gao, Y.; Huang, W.; Ling, Z.; Wang, Z.; Wang, X. Carbonyl Compounds in the Atmosphere: A Review of Abundance, Source and Their Contributions to O3 and SOA Formation. Atmos. Res. 2022, 274, 106184. [Google Scholar] [CrossRef]
  27. Xia, H.; Huang, D.; Bao, F.; Li, M.; Zhang, Y.; Chen, C.; Zhao, J. Photochemical Aging of Beijing Urban PM2.5: Production of Oxygenated Volatile Organic Compounds. Sci. Total Environ. 2020, 743, 140751. [Google Scholar] [CrossRef]
  28. Shen, H.; Chen, Z.; Li, H.; Qian, X.; Qin, X.; Shi, W. Gas-Particle Partitioning of Carbonyl Compounds in the Ambient Atmosphere. Environ. Sci. Technol. 2018, 52, 10997–11006. [Google Scholar] [CrossRef]
  29. Pillar-Little, E.A.; Guzman, M.I. An Overview of Dynamic Heterogeneous Oxidations in the Troposphere. Environments 2018, 5, 104. [Google Scholar] [CrossRef]
  30. Huang, D.D.; Zhang, Q.; Cheung, H.H.Y.; Yu, L.; Zhou, S.; Anastasio, C.; Smith, J.D.; Chan, C.K. Formation and Evolution of AqSOA from Aqueous-Phase Reactions of Phenolic Carbonyls: Comparison between Ammonium Sulfate and Ammonium Nitrate Solutions. Environ. Sci. Technol. 2018, 52, 9215–9224. [Google Scholar] [CrossRef]
  31. Smith, J.D.; Sio, V.; Yu, L.; Zhang, Q.; Anastasio, C. Secondary Organic Aerosol Production from Aqueous Reactions of Atmospheric Phenols with an Organic Triplet Excited State. Environ. Sci. Technol. 2014, 48, 1049–1057. [Google Scholar] [CrossRef]
  32. Rana, M.S.; Guzman, M.I. Oxidation of Phenolic Aldehydes by Ozone and Hydroxyl Radicals at the Air-Water Interface. J. Phys. Chem. A 2020, 124, 8822–8833. [Google Scholar] [CrossRef]
  33. Wells, K.C.; Millet, D.B.; Payne, V.H.; Deventer, M.J.; Bates, K.H.; de Gouw, J.A.; Graus, M.; Warneke, C.; Wisthaler, A.; Fuentes, J.D. Satellite Isoprene Retrievals Constrain Emissions and Atmospheric Oxidation. Nature 2020, 585, 225–233. [Google Scholar] [CrossRef] [PubMed]
  34. Pimonsree, S.; Vongruang, P. Impact of Biomass Burning and Its Control on Particulate Matter over a City in Mainland Southeast Asia during a Smog Episode. Atmos. Environ. 2018, 195, 196–209. [Google Scholar] [CrossRef]
  35. Rattanapotanan, T.; Thongyen, T.; Bualert, S.; Choomanee, P.; Suwattiga, P.; Rungrattanaubon, T.; Utavong, T.; Phupijit, J.; Changplaiy, N. Secondary Sources of PM2.5 Based on the Vertical Distribution of Organic Carbon, Elemental Carbon, and Water-Soluble Ions in Bangkok. Environ. Adv. 2023, 11, 100337. [Google Scholar] [CrossRef]
  36. Vongruang, P.; Pimonsree, S. Biomass Burning Sources and Their Contributions to PM10 Concentrations over Countries in Mainland Southeast Asia during a Smog Episode. Atmos. Environ. 2020, 228, 117414. [Google Scholar] [CrossRef]
  37. Bran, S.H.; Macatangay, R.; Surapipith, V.; Chotamonsak, C.; Chantara, S.; Han, Z.; Li, J. Surface PM2.5 Mass Concentrations during the Dry Season over Northern Thailand: Sensitivity to Model Aerosol Chemical Schemes and the Effects on Regional Meteorology. Atmos. Res. 2022, 277, 106303. [Google Scholar] [CrossRef]
  38. Thepnuan, D.; Chantara, S.; Lee, C.T.; Lin, N.H.; Tsai, Y.I. Molecular Markers for Biomass Burning Associated with the Characterization of PM2.5 and Component Sources during Dry Season Haze Episodes in Upper South East Asia. Sci. Total Environ. 2019, 658, 708–722. [Google Scholar] [CrossRef]
  39. Bayraktar, H.; Turalioglu, F.S. A Kriging-Based Approach for Locating a Sampling Site—In the Assessment of Air Quality. Stoch. Environ. Res. Risk Assess. 2005, 19, 301–305. [Google Scholar] [CrossRef]
  40. NASA FIRMS. Fire Information for Resource Management System. Available online: https://firms.modaps.eosdis.nasa.gov (accessed on 20 August 2024).
  41. Riches, M.; Berg, T.C.; Vermeuel, M.P.; Millet, D.B.; Farmer, D.K. Wildfire Smoke Directly Changes Biogenic Volatile Organic Emissions and Photosynthesis of Ponderosa Pines. Geophys. Res. Lett. 2024, 51, e2023GL106667. [Google Scholar] [CrossRef]
  42. Kleist, E.; Mentel, T.F.; Andres, S.; Bohne, A.; Folkers, A.; Kiendler-Scharr, A.; Rudich, Y.; Springer, M.; Tillmann, R.; Wildt, J. Irreversible Impacts of Heat on the Emissions of Monoterpenes, Sesquiterpenes, Phenolic BVOC and Green Leaf Volatiles from Several Tree Species. Biogeosciences 2012, 9, 5111–5123. [Google Scholar] [CrossRef]
  43. Loreto, F.; Förster, A.; Dürr, M.; Csiky, O.; Seufert, G. On the Monoterpene Emission under Heat Stress and on the Increased Thermotolerance of Leaves of Quercus Ilex L. Fumigated with Selected Monoterpenes. Plant Cell Environ. 1998, 21, 101–107. [Google Scholar] [CrossRef]
  44. Lim, Y.J.; Armendariz, A.; Son, Y.S.; Kim, J.C. Seasonal Variations of Isoprene Emissions from Five Oak Tree Species in East Asia. Atmos. Environ. 2011, 45, 2202–2210. [Google Scholar] [CrossRef]
  45. Yuan, X.; Xu, Y.; Calatayud, V.; Li, Z.; Feng, Z.; Loreto, F. Emissions of Isoprene and Monoterpenes from Urban Tree Species in China and Relationships with Their Driving Factors. Atmos. Environ. 2023, 314, 120096. [Google Scholar] [CrossRef]
  46. Niu, X.; Li, J.; Wang, Q.; Ho, S.S.H.; Sun, J.; Li, L.; Cao, J.; Ho, K.F. Characteristics of Fresh and Aged Volatile Organic Compounds from Open Burning of Crop Residues. Sci. Total Environ. 2020, 726, 138545. [Google Scholar] [CrossRef]
  47. Guenther, A.B.; Zimmerman, P.R.; Harley, P.C.; Monson, R.K.; Fall, R. Isoprene and Monoterpene Emission Rate Variability: Model Evaluations and Sensitivity Analyses. J. Geophys. Res. 1993, 98, 12609. [Google Scholar] [CrossRef]
  48. Guenther, A.B.; Monson, R.K.; Fall, R. Isoprene and Monoterpene Emission Rate Variability: Observations with Eucalyptus and Emission Rate Algorithm Development. J. Geophys. Res. 1991, 96, 10799. [Google Scholar] [CrossRef]
  49. Koppmann, R. Chemistry of Volatile Organic Compounds in the Atmosphere. In Handbook of Hydrocarbon and Lipid Microbiology; Timmis, K.N., Ed.; Springer: Berlin/Heidelberg, Germany, 2010; pp. 267–277. [Google Scholar]
  50. Wolfe, G.M.; Kaiser, J.; Hanisco, T.F.; Keutsch, F.N.; De Gouw, J.A.; Gilman, J.B.; Graus, M.; Hatch, C.D.; Holloway, J.; Horowitz, L.W.; et al. Formaldehyde Production from Isoprene Oxidation across NOx Regimes. Atmos. Chem. Phys. 2016, 16, 2597–2610. [Google Scholar] [CrossRef]
  51. Lv, S.Y.; Liu, Q.Y.; Zhao, Y.X.; Zhang, M.Q.; Jiang, L.X.; He, S.G. Formaldehyde Generation in Photooxidation of Isoprene on Iron Oxide Nanoclusters. J. Phys. Chem. C 2019, 123, 5120–5127. [Google Scholar] [CrossRef]
  52. Tyndall, G.S.; Staffelbach, T.A.; Orlando, J.J.; Calvert, J.G. Rate Coefficients for the Reactions of OH Radicals with Methylglyoxal and Acetaldehyde. Int. J. Chem. Kinet. 1995, 27, 1009–1020. [Google Scholar] [CrossRef]
  53. Kanjanasiranont, N.; Prueksasit, T.; Morknoy, D.; Tunsaringkarn, T.; Sematong, S.; Siriwong, W.; Zapaung, K.; Rungsiyothin, A. Determination of Ambient Air Concentrations and Personal Exposure Risk Levels of Outdoor Workers to Carbonyl Compounds and BTEX in the Inner City of Bangkok, Thailand. Atmos. Pollut. Res. 2016, 7, 268–277. [Google Scholar] [CrossRef]
  54. Wongaree, M.; Choo-In, S. Monitoring of Benzene in an Ambient Air on the Roadside at Udon Thani of Thailand. IOP Conf. Ser. Earth Environ. Sci. 2019, 281, 012007. [Google Scholar] [CrossRef]
  55. Thongkum, W.; Wibuloutai, J.; Thitisutthi, S. Benzene and 1, 3 butadiene concentration and its potential health impact in Chiang Mai, Thailand. Eur. J. Sustain. Dev. 2017, 6, 2. [Google Scholar] [CrossRef]
  56. Lewis, A.C.; Evans, M.J.; Hopkins, J.R.; Punjabi, S.; Read, K.A.; Purvis, R.M.; Andrews, S.J.; Moller, S.J.; Carpenter, L.J.; Lee, J.D.; et al. The Influence of Biomass Burning on the Global Distribution of Selected Non-Methane Organic Compounds. Atmos. Chem. Phys. 2013, 13, 851–867. [Google Scholar] [CrossRef]
  57. Yuan, B.; Liu, Y.; Shao, M.; Lu, S.; Streets, D.G. Biomass Burning Contributions to Ambient VOCs Species at a Receptor Site in the Pearl River Delta (PRD), China. Environ. Sci. Technol. 2010, 44, 4577–4582. [Google Scholar] [CrossRef]
  58. Sirithian, D.; Thepanondh, S.; Sattler, M.L.; Laowagul, W. Emissions of Volatile Organic Compounds from Maize Residue Open Burning in the Northern Region of Thailand. Atmos. Environ. 2018, 176, 179–187. [Google Scholar] [CrossRef]
  59. Monod, A.; Monod, A.; Sive, B.C.; Avino, P.; Chen, T.; Blake, D.R.; Rowland, F.S. Monoaromatic Compounds in Ambient Air of Various Cities: A Focus on Correlations between the Xylenes and Ethylbenzene. Atmos. Environ. 2001, 35, 135–149. [Google Scholar] [CrossRef]
  60. Hallquist, M.; Wenger, J.C.; Baltensperger, U.; Rudich, Y.; Simpson, D.; Claeys, M.; Dommen, J.; Donahue, N.M.; George, C.; Goldstein, A.H.; et al. The Formation, Properties and Impact of Secondary Organic Aerosol: Current and Emerging Issues. Atmos. Chem. Phys. 2009, 9, 5155–5236. [Google Scholar] [CrossRef]
  61. Li, L.; Chen, Y.; Zeng, L.; Shao, M.; Xie, S.; Chen, W.; Lu, S.; Wu, Y.; Cao, W. Biomass Burning Contribution to Ambient Volatile Organic Compounds (VOCs) in the Chengdu-Chongqing Region (CCR), China. Atmos. Environ. 2014, 99, 403–410. [Google Scholar] [CrossRef]
  62. Pun, B.K.; Seigneur, C.; Grosjean, D.; Saxena, P. Gas-Phase Formation of Water-Soluble Organic Compounds in the Atmosphere: A Retrosynthetic Analysis. J. Atmos. Chem. 2000, 35, 199–223. [Google Scholar] [CrossRef]
  63. Stockwell, C.E.; Veres, P.R.; Williams, J.; Yokelson, R.J. Characterization of Biomass Burning Emissions from Cooking Fires, Peat, Crop Residue, and Other Fuels with High-Resolution Proton-Transfer-Reaction Time-of-Flight Mass Spectrometry. Atmos. Chem. Phys. 2015, 15, 845–865. [Google Scholar] [CrossRef]
  64. Miri, M.; Rostami Aghdam Shendi, M.; Ghaffari, H.R.; Ebrahimi Aval, H.; Ahmadi, E.; Taban, E.; Gholizadeh, A.; Yazdani Aval, M.; Mohammadi, A.; Azari, A. Investigation of Outdoor BTEX: Concentration, Variations, Sources, Spatial Distribution, and Risk Assessment. Chemosphere 2016, 163, 601–609. [Google Scholar] [CrossRef] [PubMed]
  65. Kumar, A.; Singh, D.; Kumar, K.; Singh, B.B.; Jain, V.K. Distribution of VOCs in Urban and Rural Atmospheres of Subtropical India: Temporal Variation, Source Attribution, Ratios, OFP and Risk Assessment. Sci. Total Environ. 2018, 613–614, 492–501. [Google Scholar] [CrossRef]
  66. Rad, H.D.; Babaei, A.A.; Goudarzi, G.; Angali, K.A.; Ramezani, Z.; Mohammadi, M.M. Levels and Sources of BTEX in Ambient Air of Ahvaz Metropolitan City. Air Qual. Atmos. Health 2014, 7, 515–524. [Google Scholar] [CrossRef]
  67. da Rocha, F.O.C.; Campos, V.P.; da Rocha, G.O.; Brito, A.V.S.; dos Santos Sampaio, I. Characterization of Airborne Gaseous BTEX and Aldehydes from Populated Brazilian Cities as Representative Atmospheres of Typical Urban Areas from the Southern Hemisphere. Air Qual. Atmos. Health 2023, 16, 1271–1289. [Google Scholar] [CrossRef]
  68. Hajizadeh, Y.; Mokhtari, M.; Faraji, M.; Mohammadi, A.; Nemati, S.; Ghanbari, R.; Abdolahnejad, A.; Fard, R.F.; Nikoonahad, A.; Jafari, N.; et al. Trends of BTEX in the Central Urban Area of Iran: A Preliminary Study of Photochemical Ozone Pollution and Health Risk Assessment. Atmos. Pollut. Res. 2018, 9, 220–229. [Google Scholar] [CrossRef]
  69. Wang, N.; Edtbauer, A.; Stönner, C.; Pozzer, A.; Bourtsoukidis, E.; Ernle, L.; Dienhart, D.; Hottmann, B.; Fischer, H.; Schuladen, J.; et al. Measurements of Carbonyl Compounds around the Arabian Peninsula: Overview and Model Comparison. Atmos. Chem. Phys. 2020, 20, 10807–10829. [Google Scholar] [CrossRef]
  70. Punsompong, P.; Chantara, S. Identification of Potential Sources of PM10 Pollution from Biomass Burning in Northern Thailand Using Statistical Analysis of Trajectories. Atmos. Pollut. Res. 2018, 9, 1038–1051. [Google Scholar] [CrossRef]
Figure 1. Location of study area (source: Google Maps and Google Earth (©2024 Google)).
Atmosphere 16 00342 g001
Figure 2. Concentration of isoprene and monoterpenes.
Atmosphere 16 00342 g002
Figure 3. Daily distribution of fire incidents in Chiang Mai (the yellow dot) and surrounding areas during the sampling period (March 2024). The red dots represent fire incidents. (Source: NASA FIRMS, Earth Data.)
Atmosphere 16 00342 g003
Figure 4. Correlation analysis between northerly winds speed and isoprene concentrations.
Atmosphere 16 00342 g004
Figure 5. Aerosol optical depth (AOD) for the periods (a) 14–21 March 2024 and (b) 22–29 March 2024. The blue box indicates Thailand and its surrounding areas. (Source: NASA Earth Observations.)
Atmosphere 16 00342 g005
Figure 6. Concentration of carbonyl compounds.
Atmosphere 16 00342 g006
Figure 7. The diurnal patterns of formaldehyde (FA), acetaldehyde (AA), and acrolein (AC).
Atmosphere 16 00342 g007
Figure 8. Concentration of benzene, toluene, ethylbenzene, and m,p-xylene.
Atmosphere 16 00342 g008
Figure 9. Concentration of PM2.5 in Chiang Mai during the episode period.
Atmosphere 16 00342 g009
Table 1. GC/MS and HPLC analytical methods.
GC/MSHPLC
Initial Temp20 °C (7 min hold)GradientTimeAC
AcetonitrileD.I water:ACN:Tetrahydrofuran = 50:49:1
Oven rate 11 °C min−1Initial0100
Oven Temp30 °C14060
Oven rate 210 °C min−1104060
Oven Temp200 °C111000
Oven rate 315 °C min−1140100
Oven Temp250 °C (5 min hold)210100
Total Time42.33 minFlow rate1 mL/min
Table 2. QA/QC result of target compound.
CompoundRSD (%)MDL (ng)r2 of Calibration Curve
Benzene1.800.270.999
Toluene4.740.510.999
Ethylbenzene3.050.340.998
m,p-xylene2.680.190.999
Isopene0.630.370.998
α-Pinene1.750.150.999
Camphene4.880.320.999
β-Pinene3.260.330.999
δ-3-Carene1.830.460.999
α-Terpinene2.710.420.999
d-Limonene4.130.500.999
ρ-Cymene3.440.480.999
γ-Terpinene3.530.260.999
Formaldehyde1.050.120.999
Acetaldehyde4.250.090.997
Acetone3.730.060.999
Acrolein2.880.050.999
Propionaldehyde4.320.050.999
Crotonaldehyde4.640.050.999
2-Butanone3.380.060.999
Methacrolein4.790.090.997
n-Butyraldehyde1.290.060.997
Benzaldehyde3.580.080.999
Valeraldehyde4.240.090.999
m-Tolualdehyde4.800.080.999
Hexaldehyde3.580.120.999
Table 3. Temporal trends in fire incidence.
PeriodThailandMyanmarLaos
13–18 MarchSeriousSeriousSerious
19–20 March MinimalSeriousMinimal
21–22 March MinimalMinimalMinimal
23–24 March Moderate (Increasing)Moderate (Increasing)Moderate (Increasing)
25–26 MarchSeriousSeriousSerious
Table 4. Correlation coefficients (r2) between compounds.
BTEXISPMTPFAAAACPM2.5
B10.100.040.070.030.120.270.410.460.83
T 10.840.980.130.930.010.050.010.004
E 10.830.040.770.100.100.100.004
X 10.160.970.020.060.060.0004
ISP 10.150.0020.270.250.17
MTP 10.0020.030.00070.01
FA 10.450.390.33
AA 10.760.71
AC 10.75
PM2.5 1
Table 5. Atmospheric lifetime of each compound [49,59].
CompoundAtmospheric Lifetime
Benzene9.4 days
Toluene1.9 days
Ethylbenzene1.6 days
m,p-Xylene11.8 h/19.4 h
Isoprene1 h
Alpha-pinene5.8 h
Formaldehyde4 h
Acetaldehyde6 h
Table 6. Concentration ratios of toluene/benzene (T/B), xylenes/benzene (X/B), m-,p xylene/ethylbenzene (m,p-X/E), and formaldehyde/acetaldehyde (FA/AA).
DateT/BX/BX/EFA/AA
13 March84.2820.981.512.28
14 March37.457.701.082.54
15 March7.490.690.342.13
16 March10.280.800.282.16
17 March14.410.860.252.72
18 March9.480.730.251.97
19 March9.710.800.252.82
20 March25.741.630.282.77
21 March22.751.440.252.60
22 March20.581.450.214.20
23 March20.301.230.202.62
24 March17.510.990.222.98
25 March21.481.450.242.36
26 March10.870.950.304.34
Disclaimer/Publisher’s Note: The statements, opinions and data contained in all publications are solely those of the individual author(s) and contributor(s) and not of MDPI and/or the editor(s). MDPI and/or the editor(s) disclaim responsibility for any injury to people or property resulting from any ideas, methods, instructions or products referred to in the content.