
Long-Term Spatio-Temporal Analysis, Distribution, and Trends of Dust Events over Iran

 ,
,  ,
,  and
and
Abstract
1. Introduction
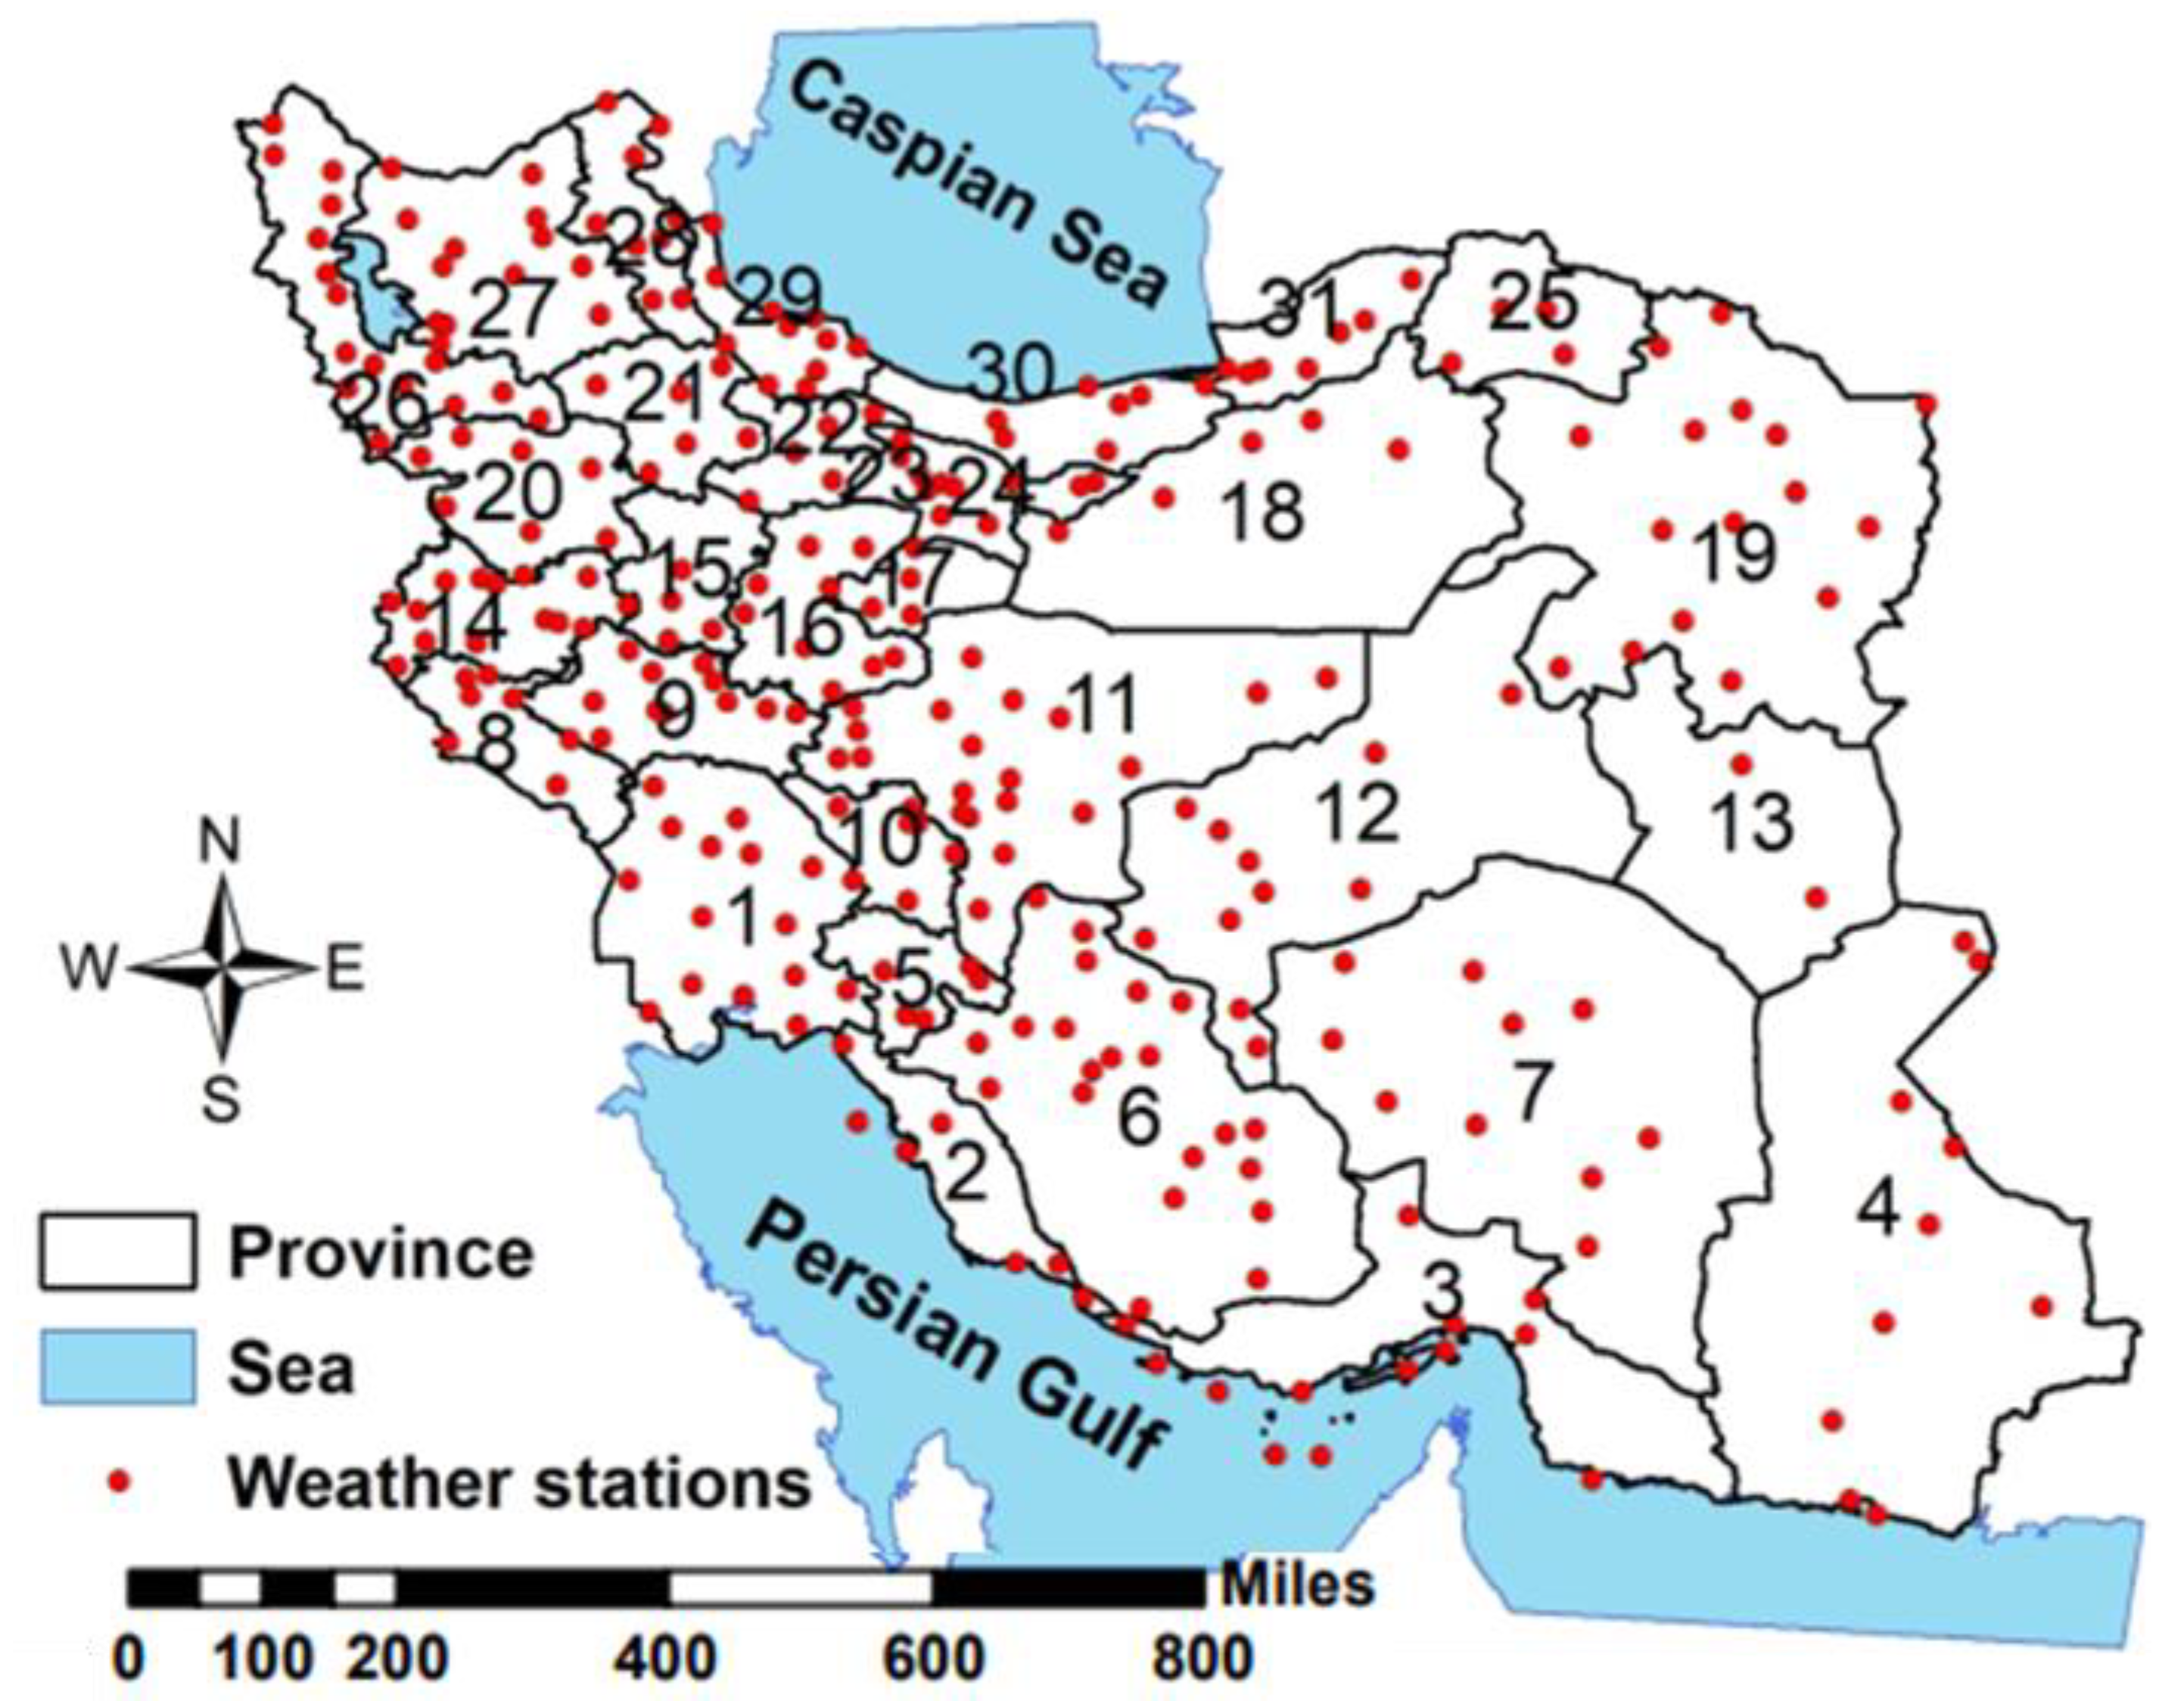
2. Study Area
3. Data Set and Methodology
4. Results and Discussion
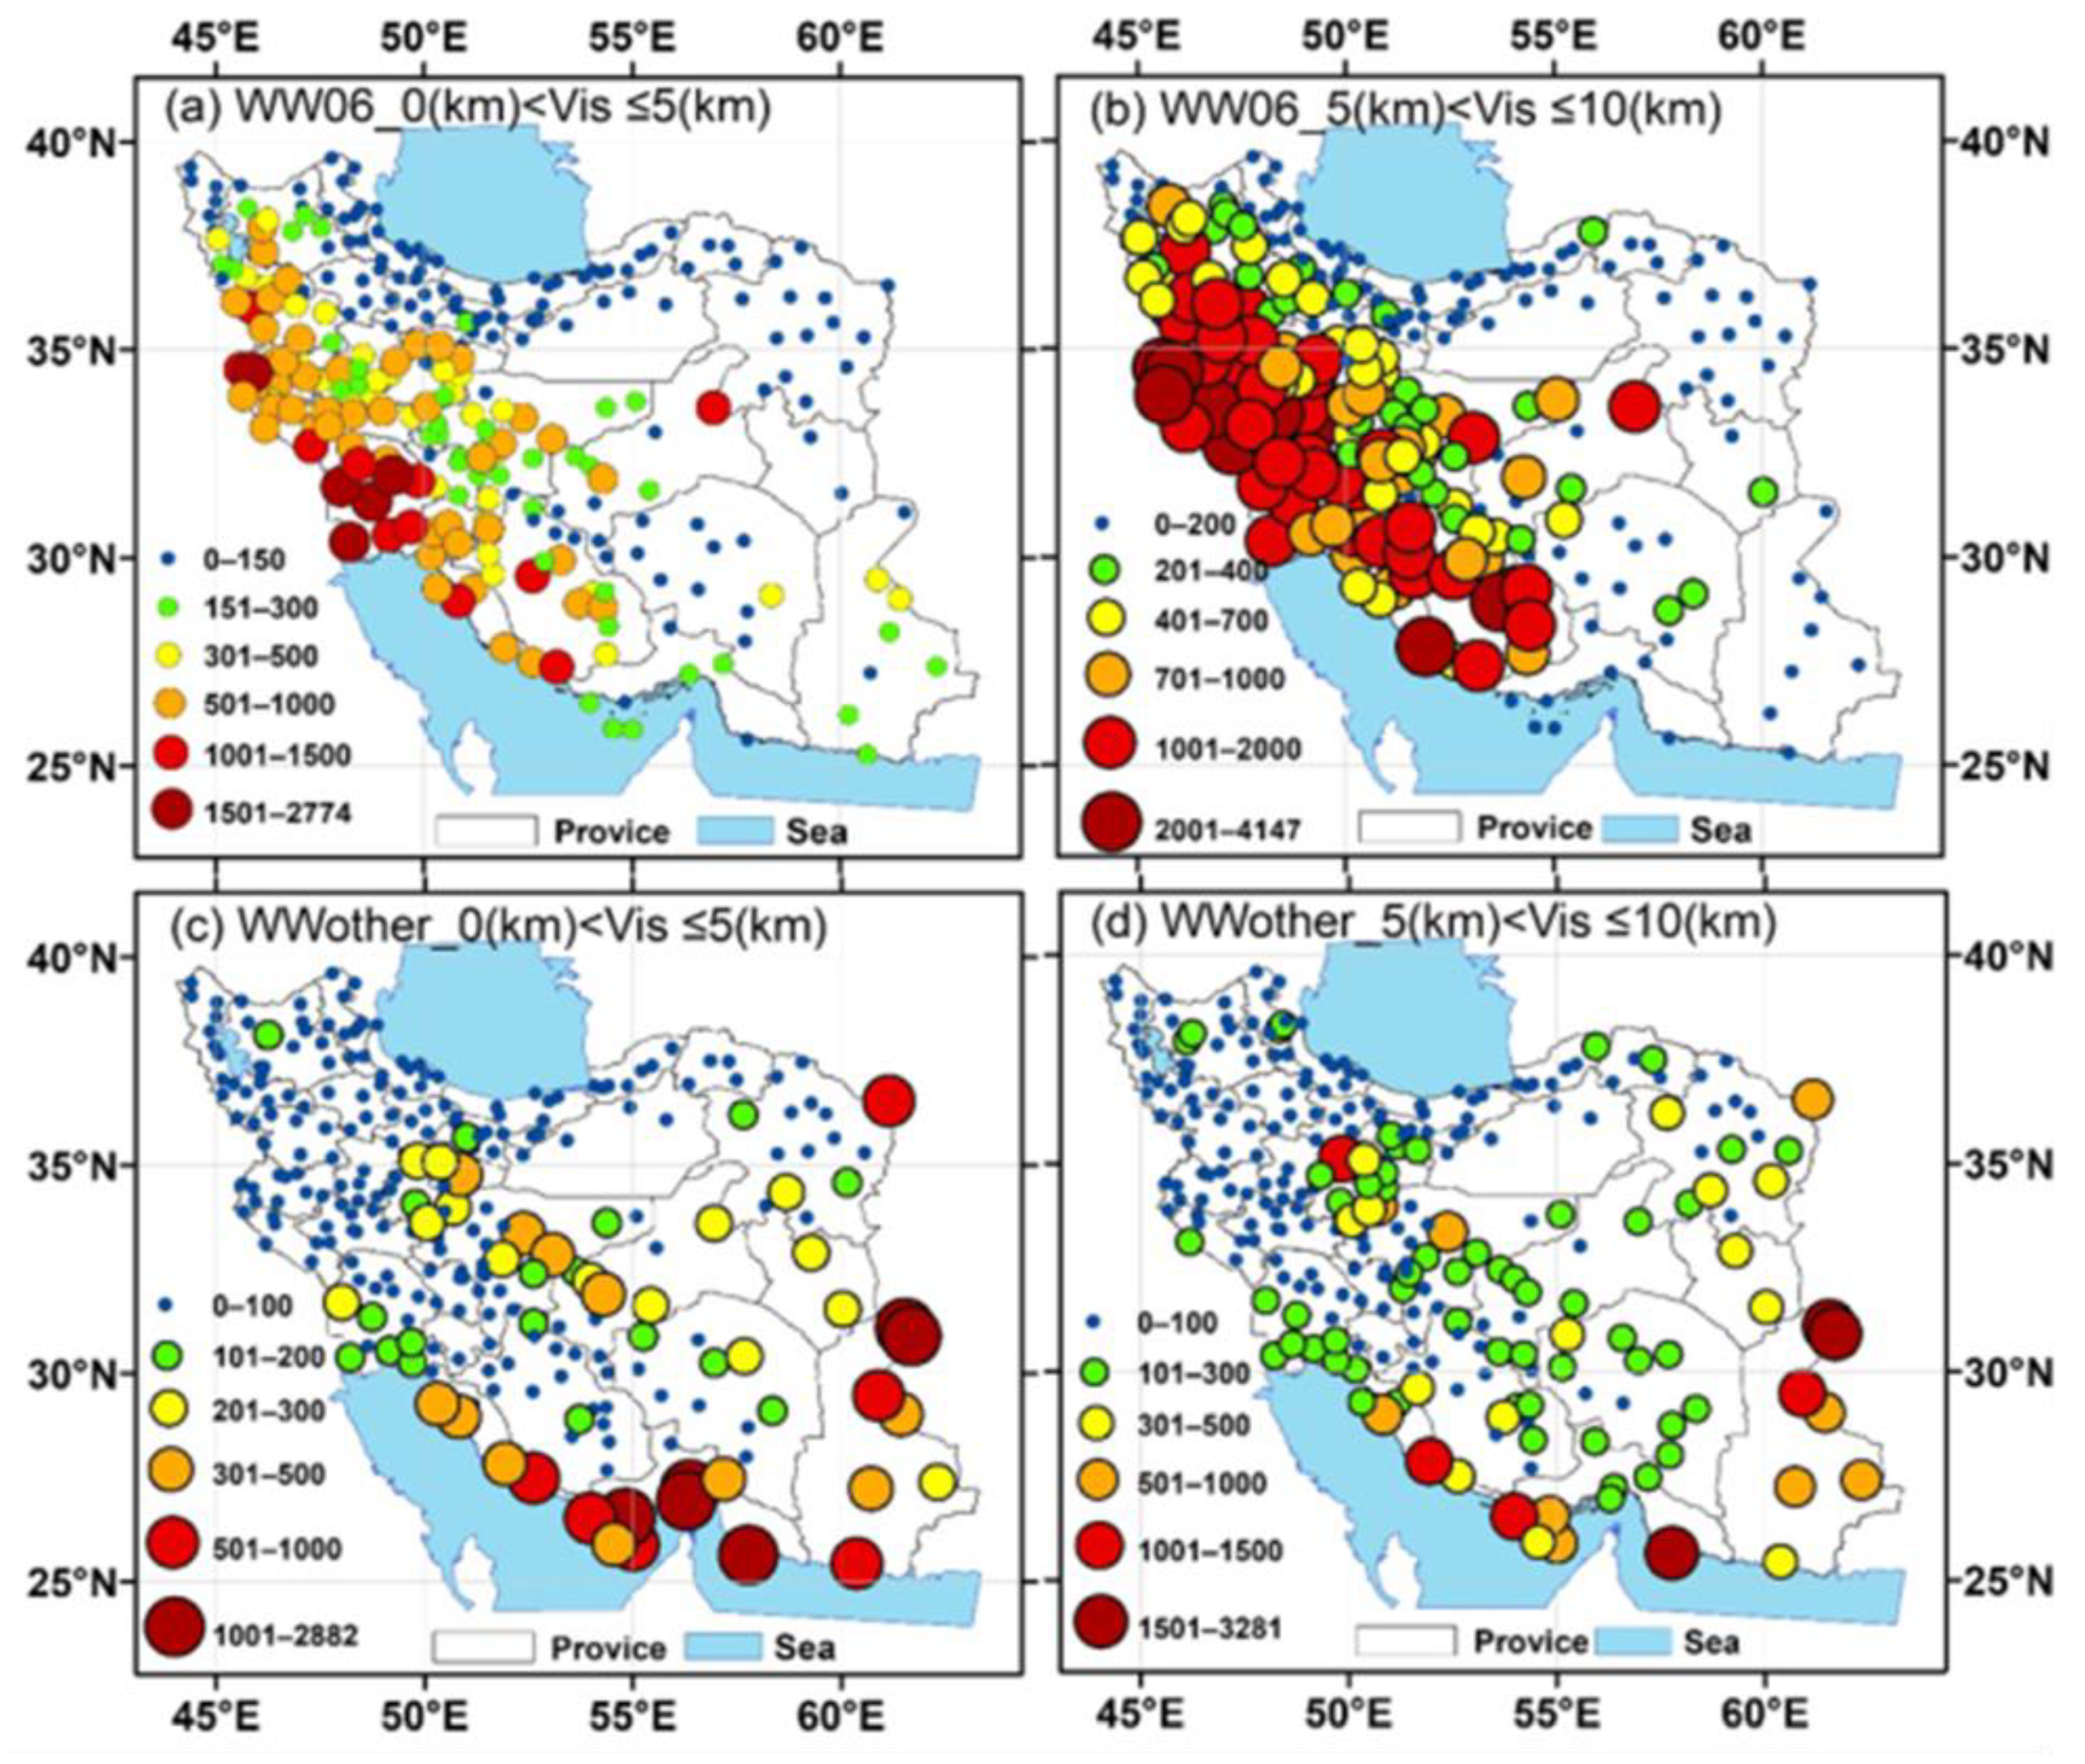
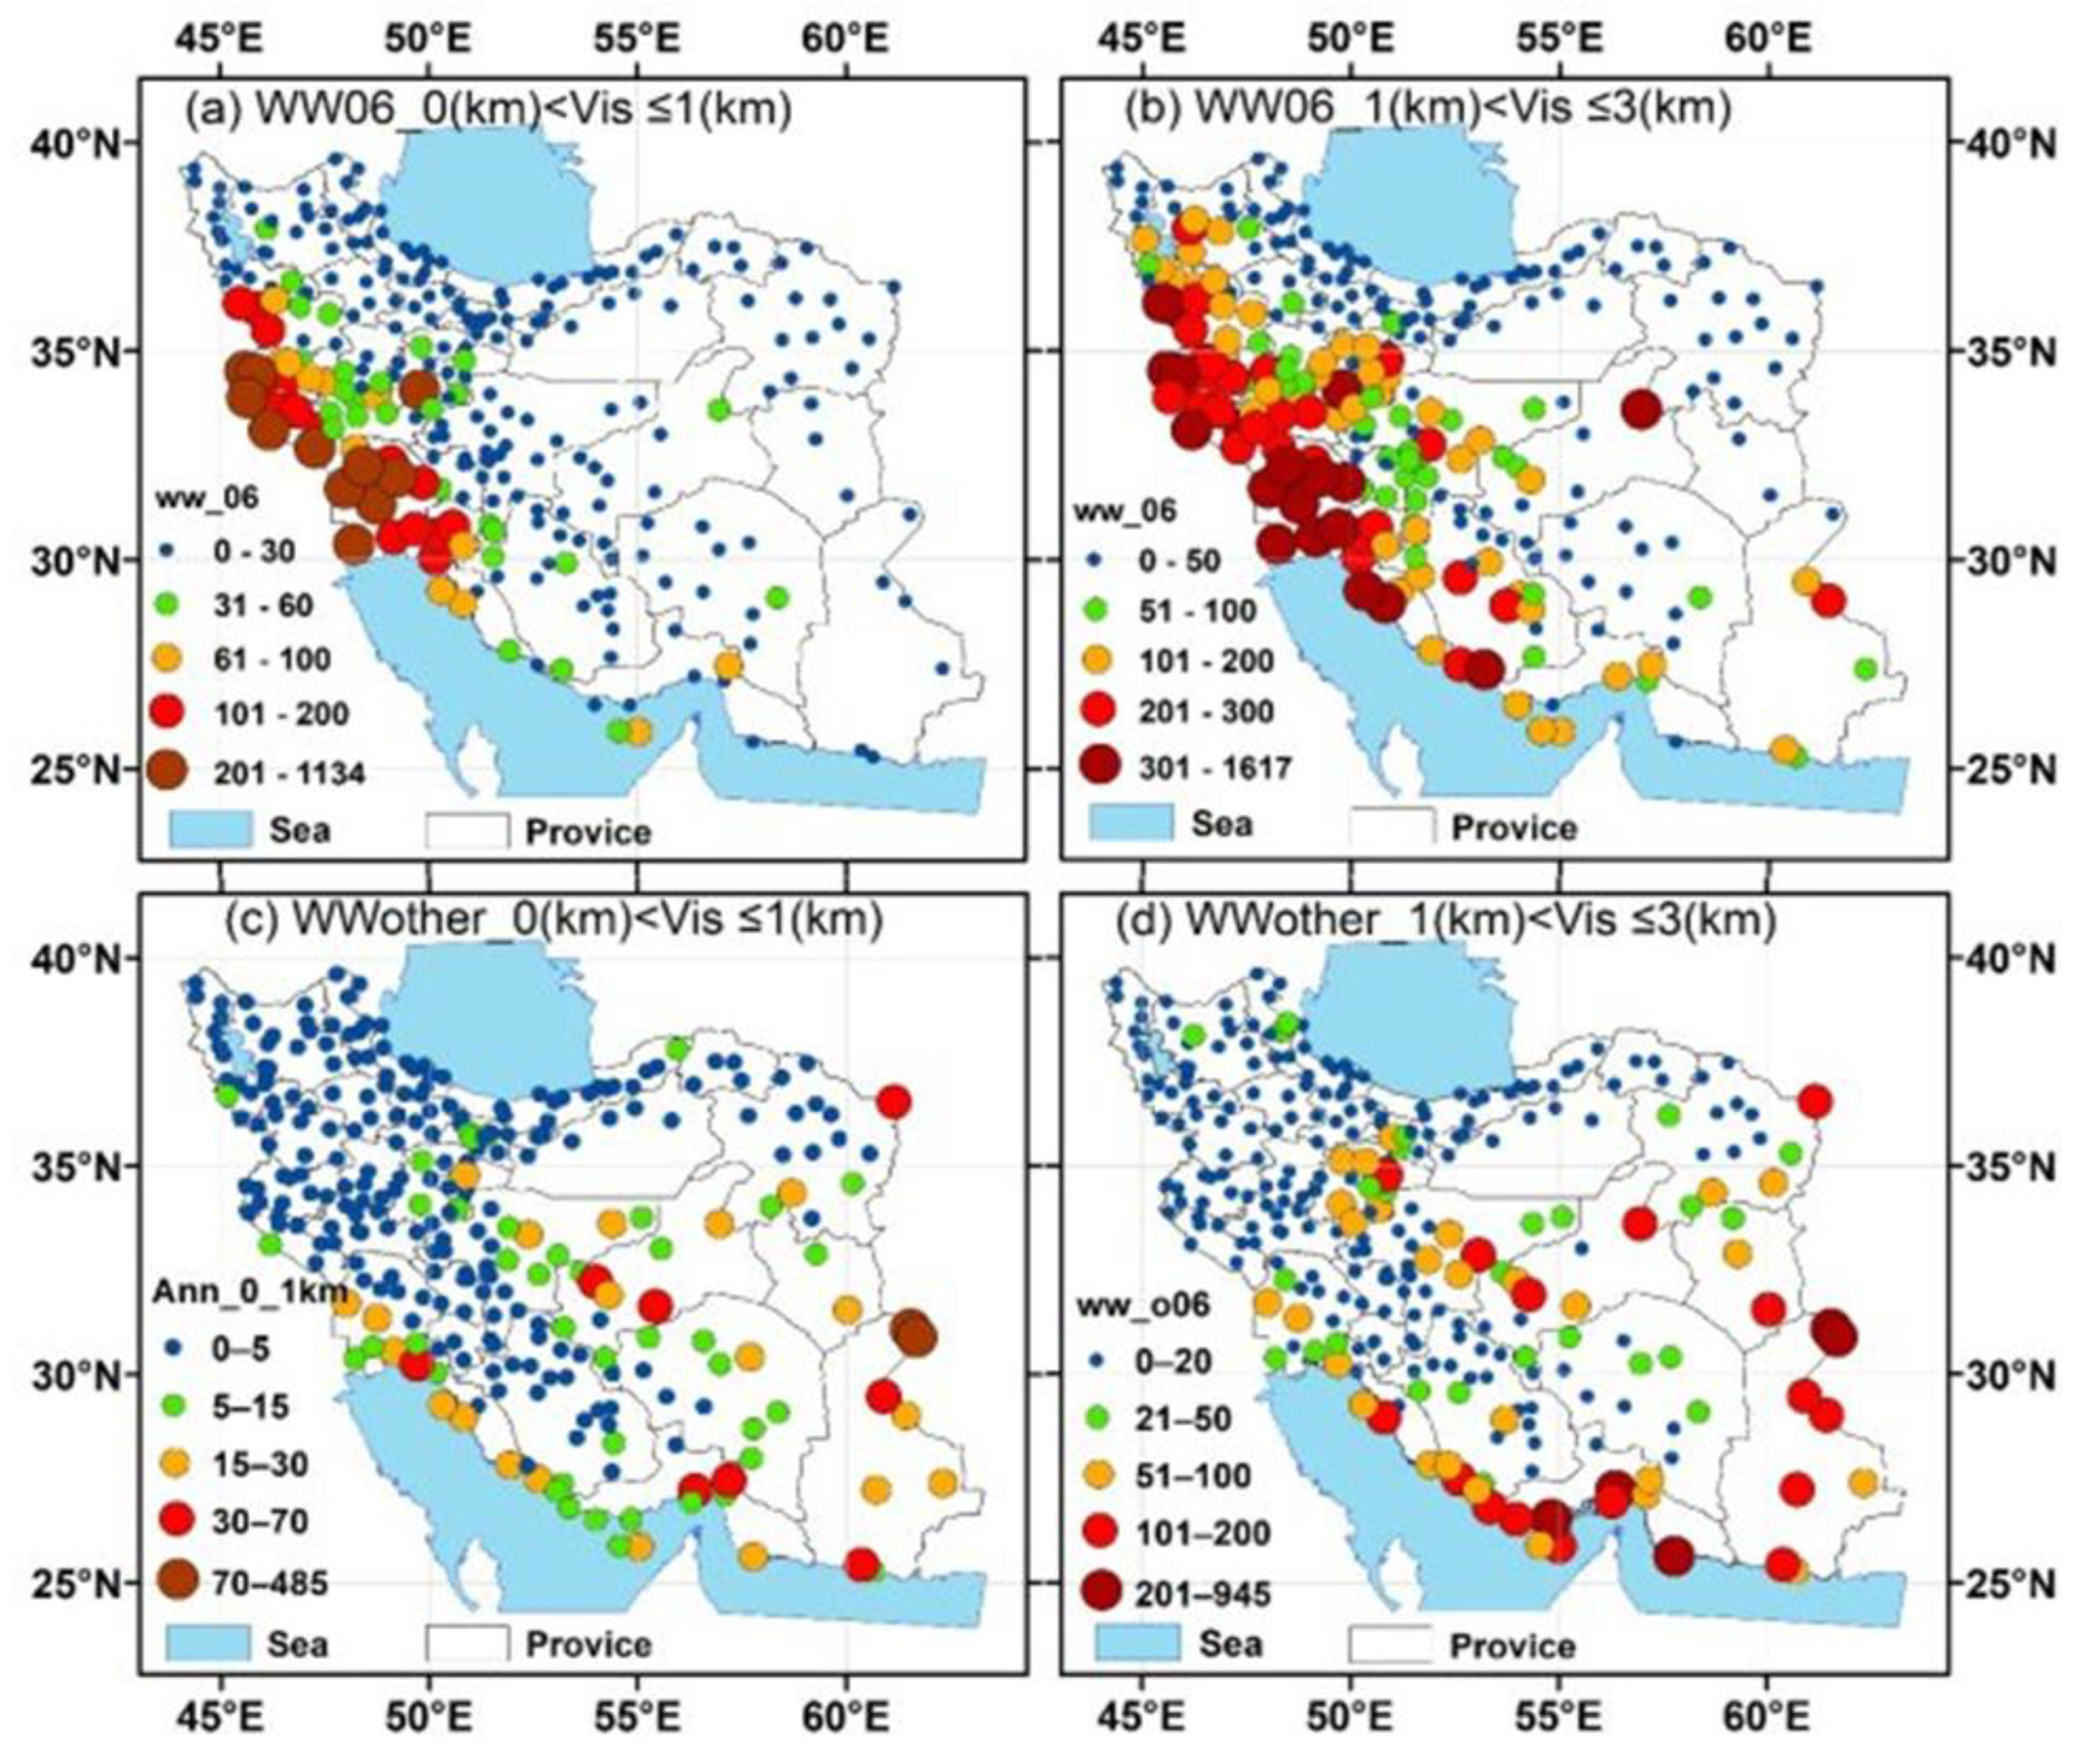
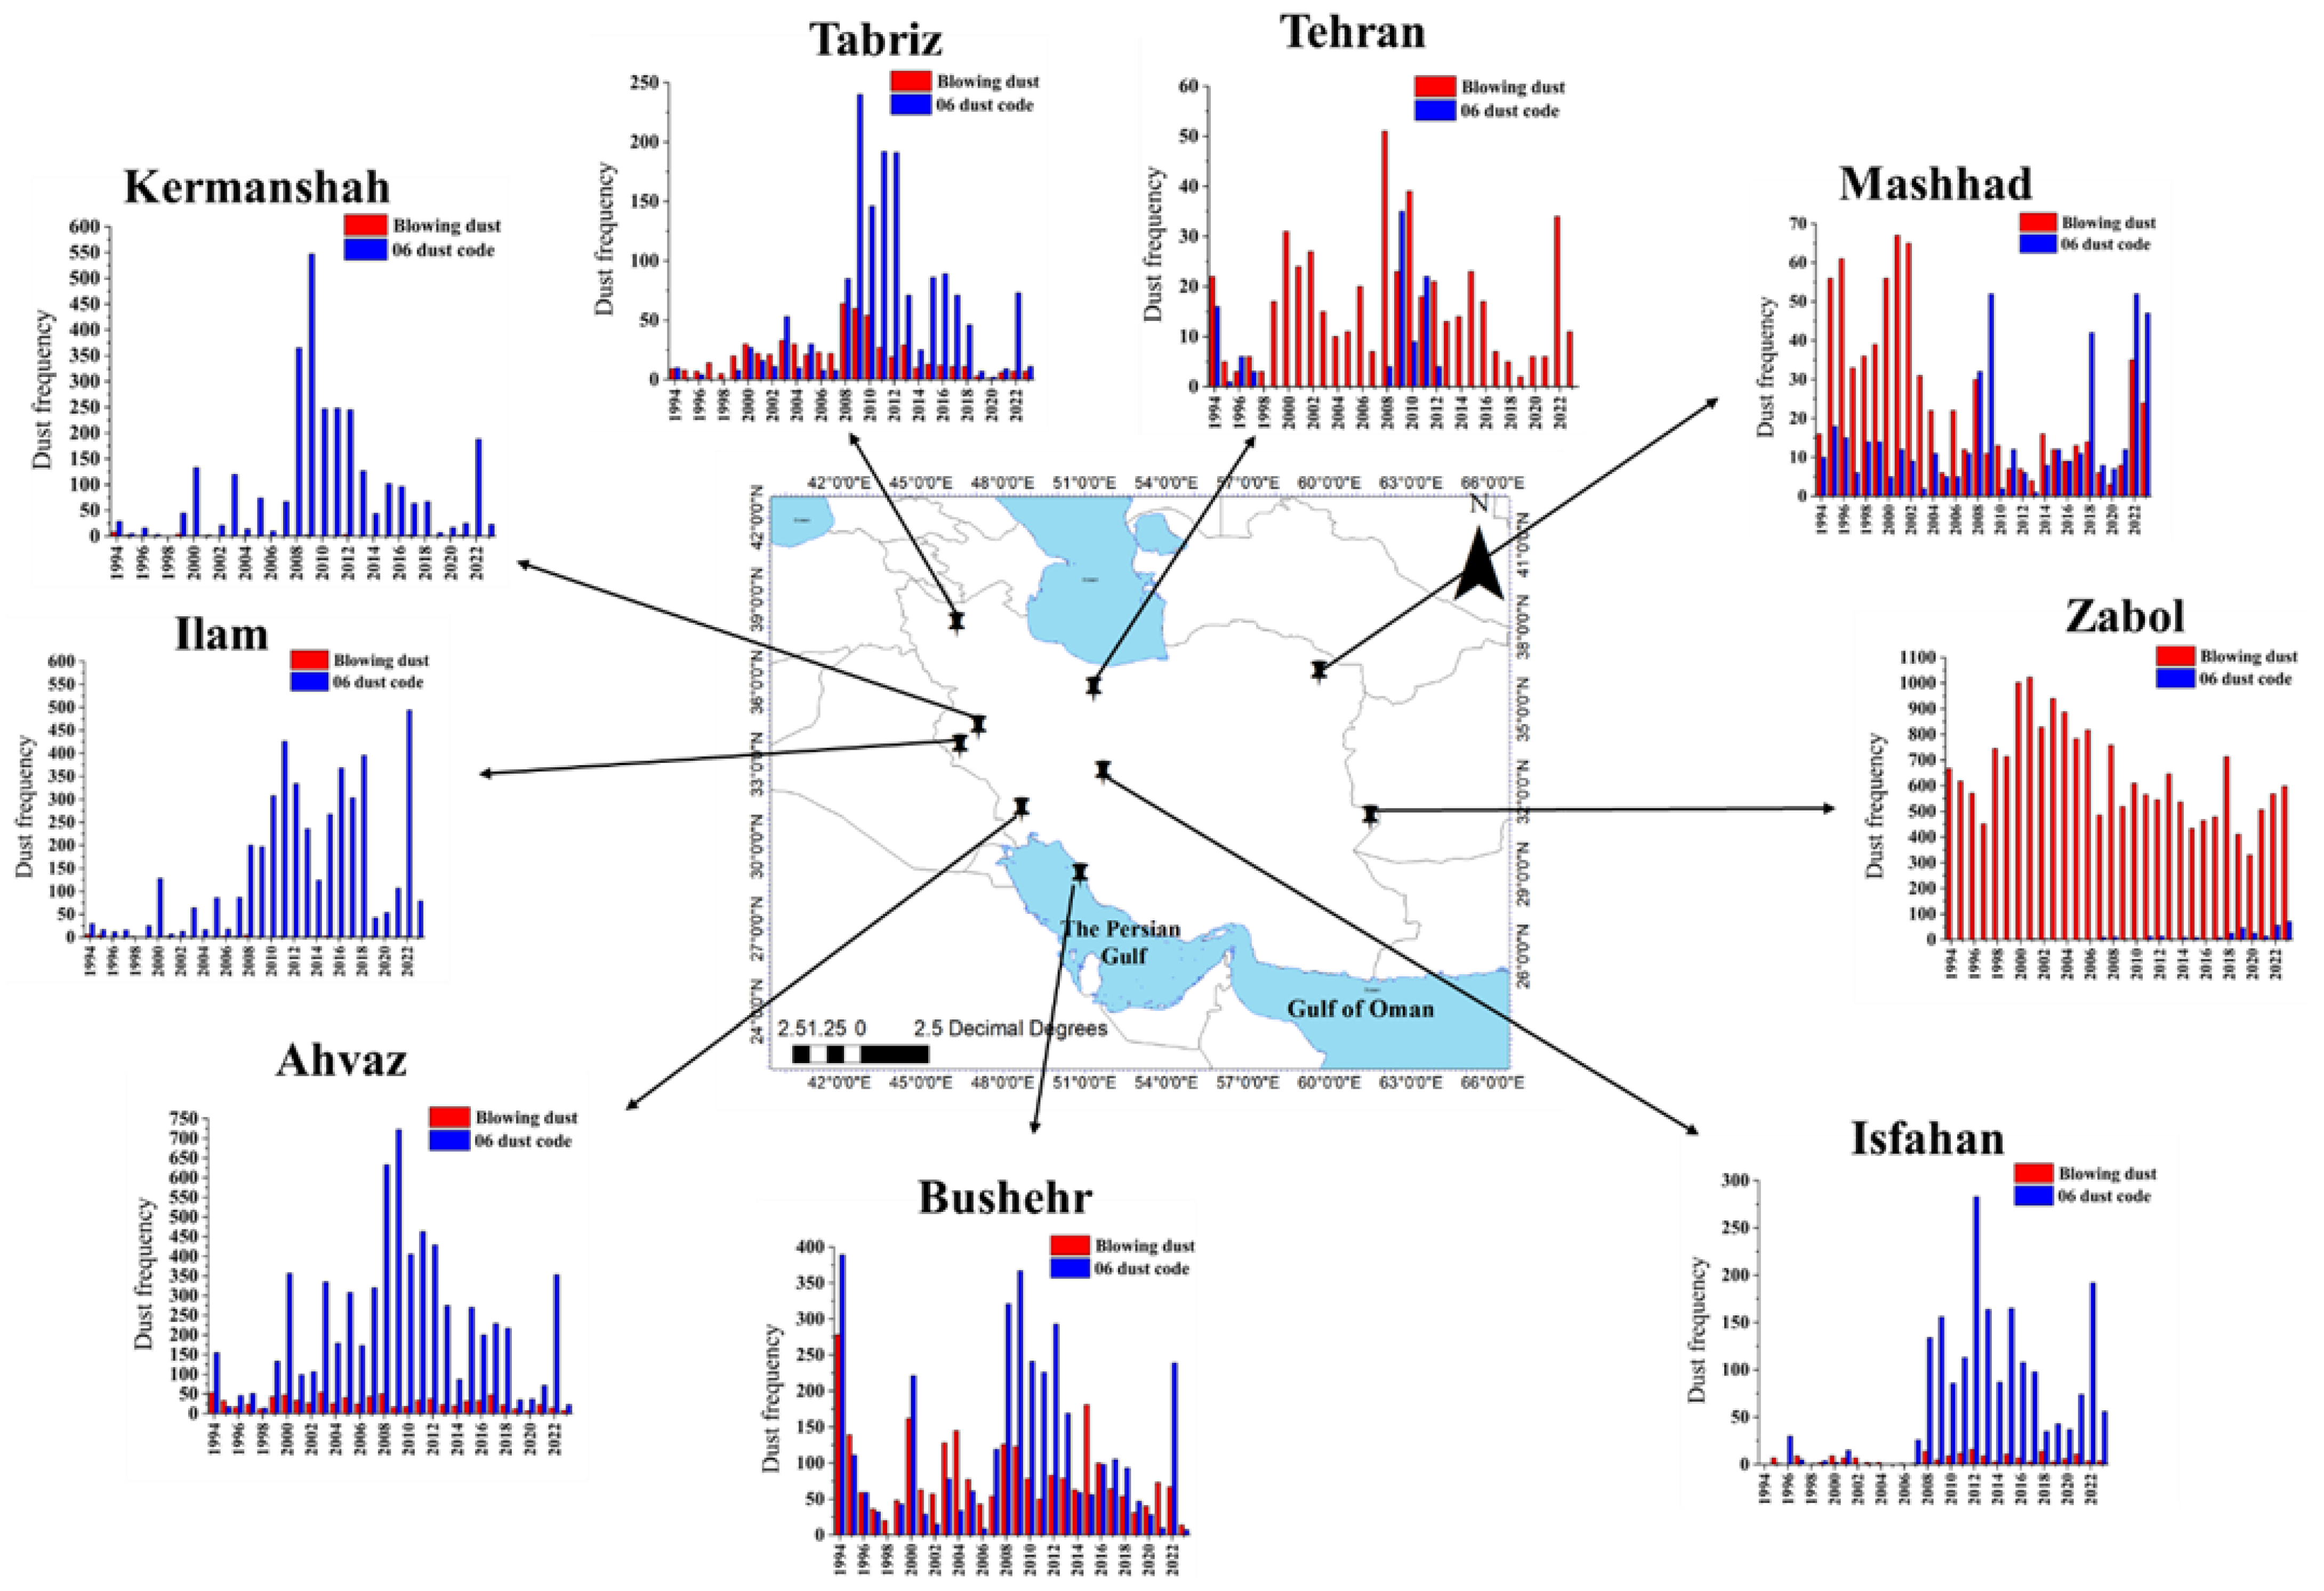
4.1. Frequency Distribution of Suspended and Blowing Dust Events
4.2. Intensity of Dust Storms
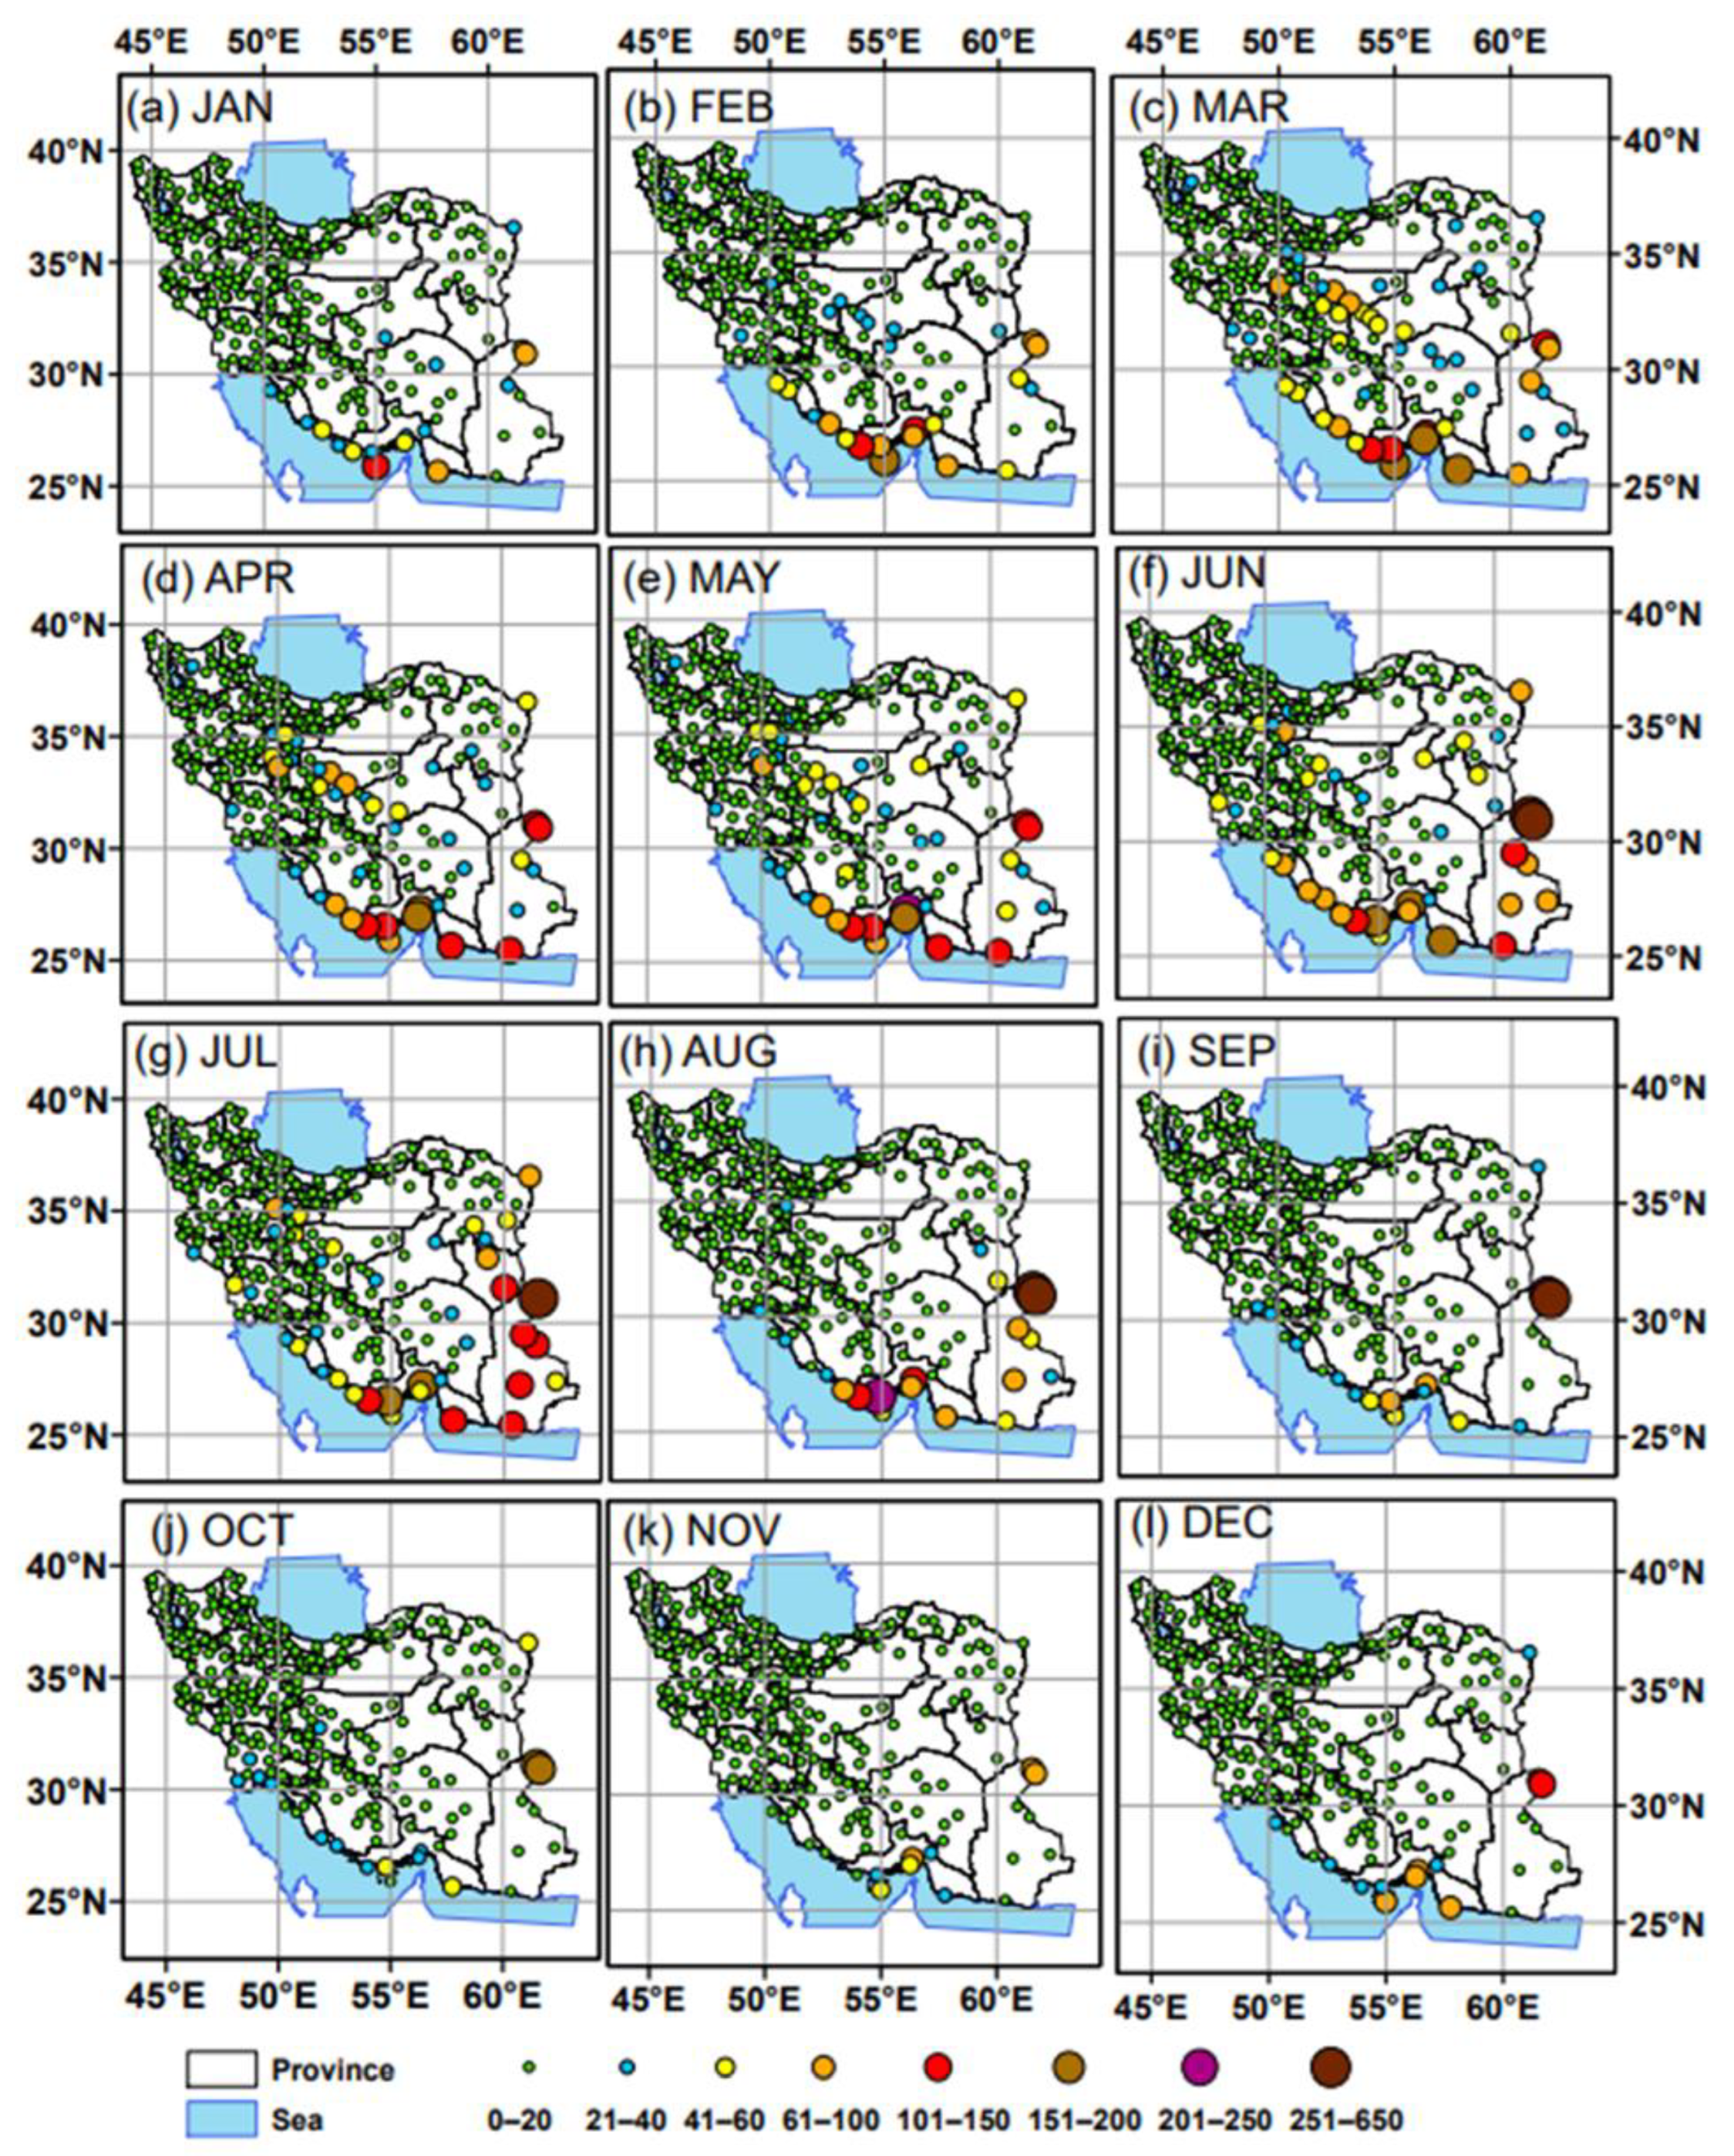
4.3. Seasonality of Suspended Dust
4.4. Seasonality of Blowing Dust
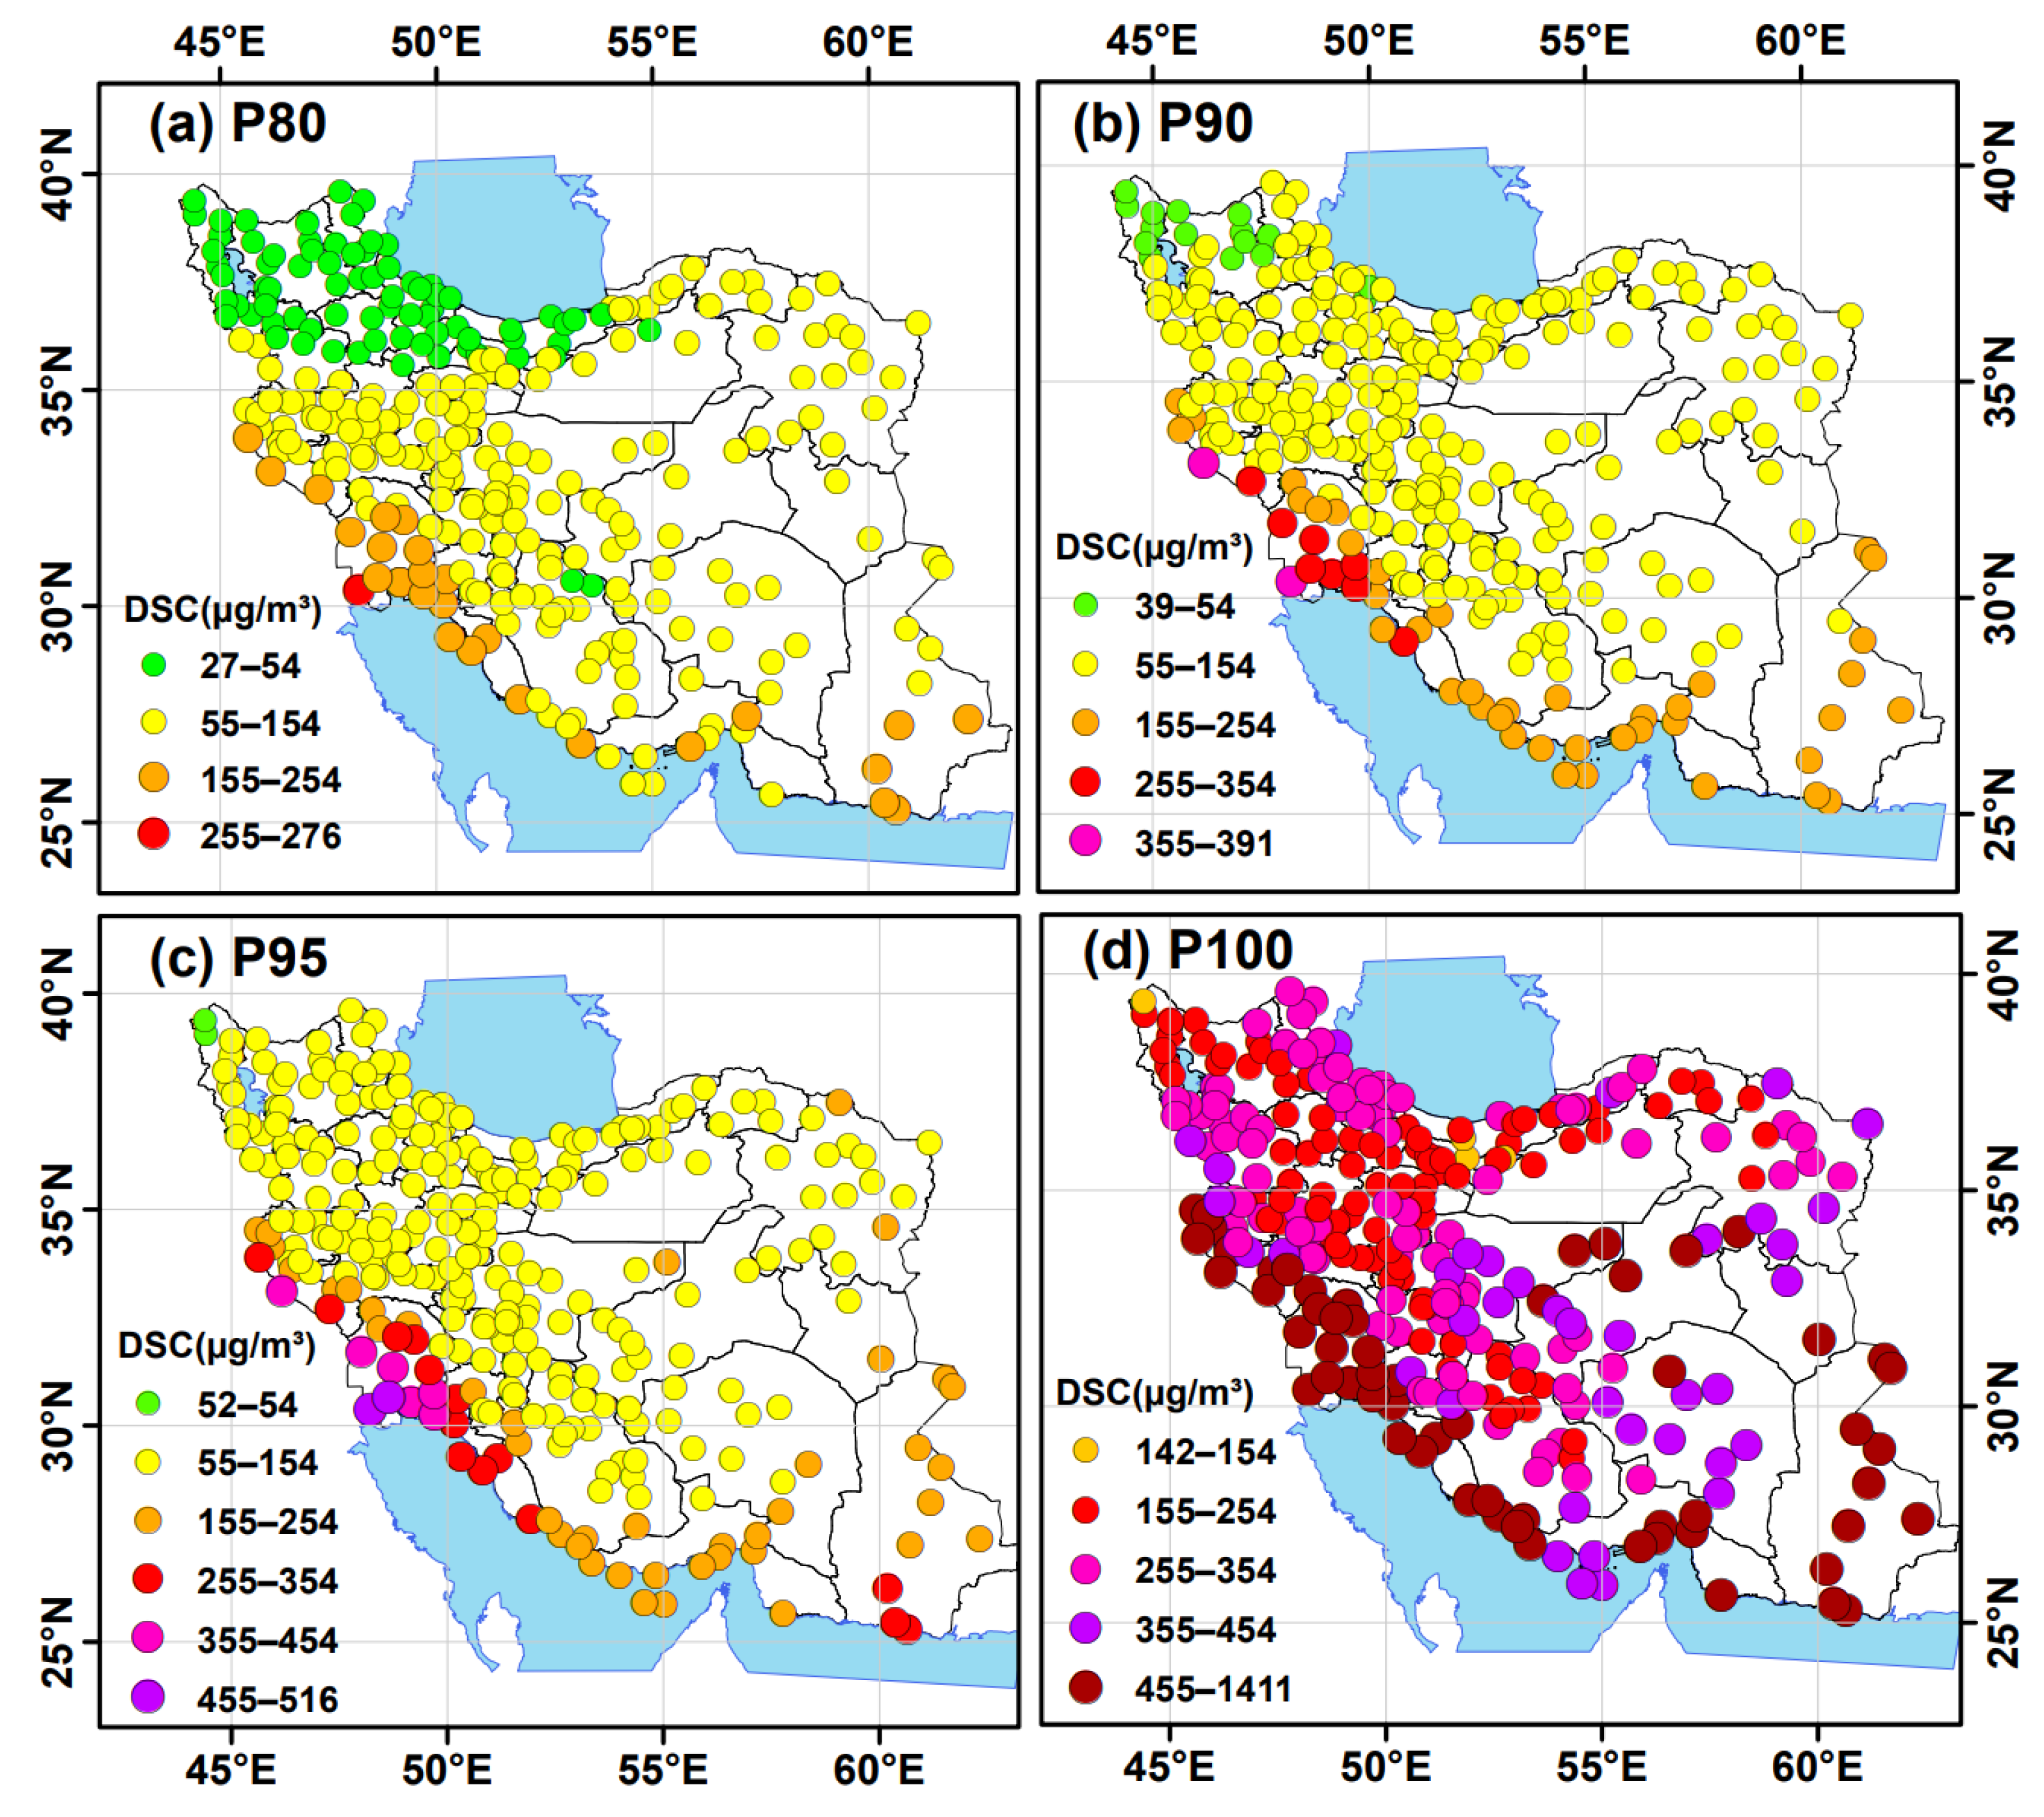
4.5. Percentage of Daily Surface Particle Concentrations
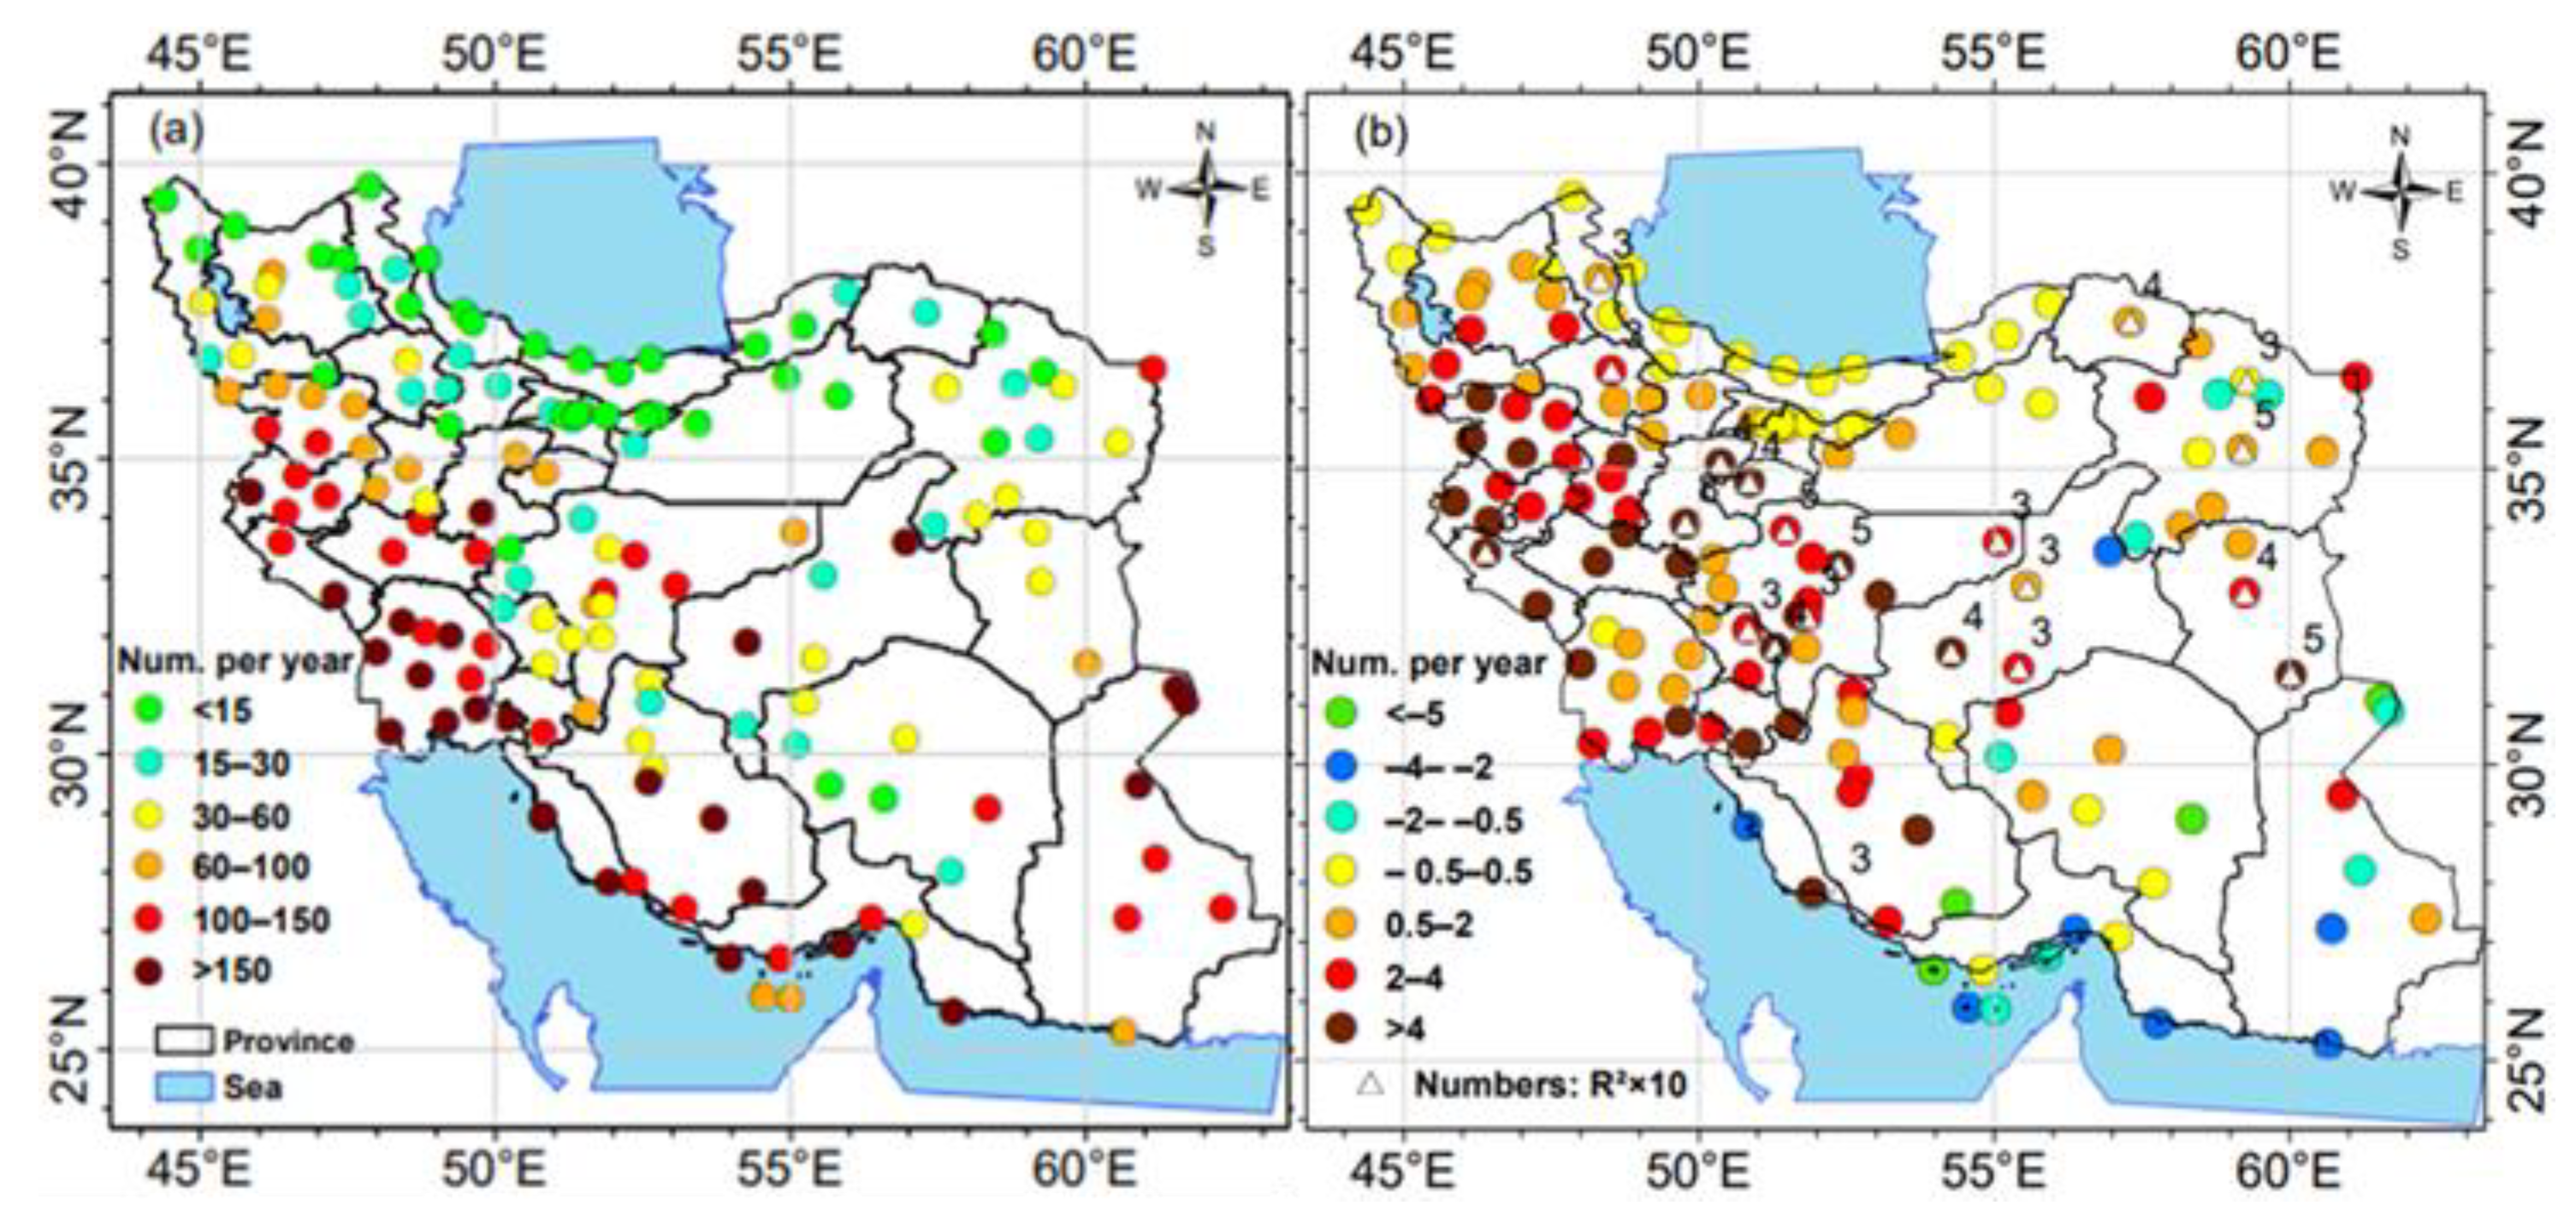
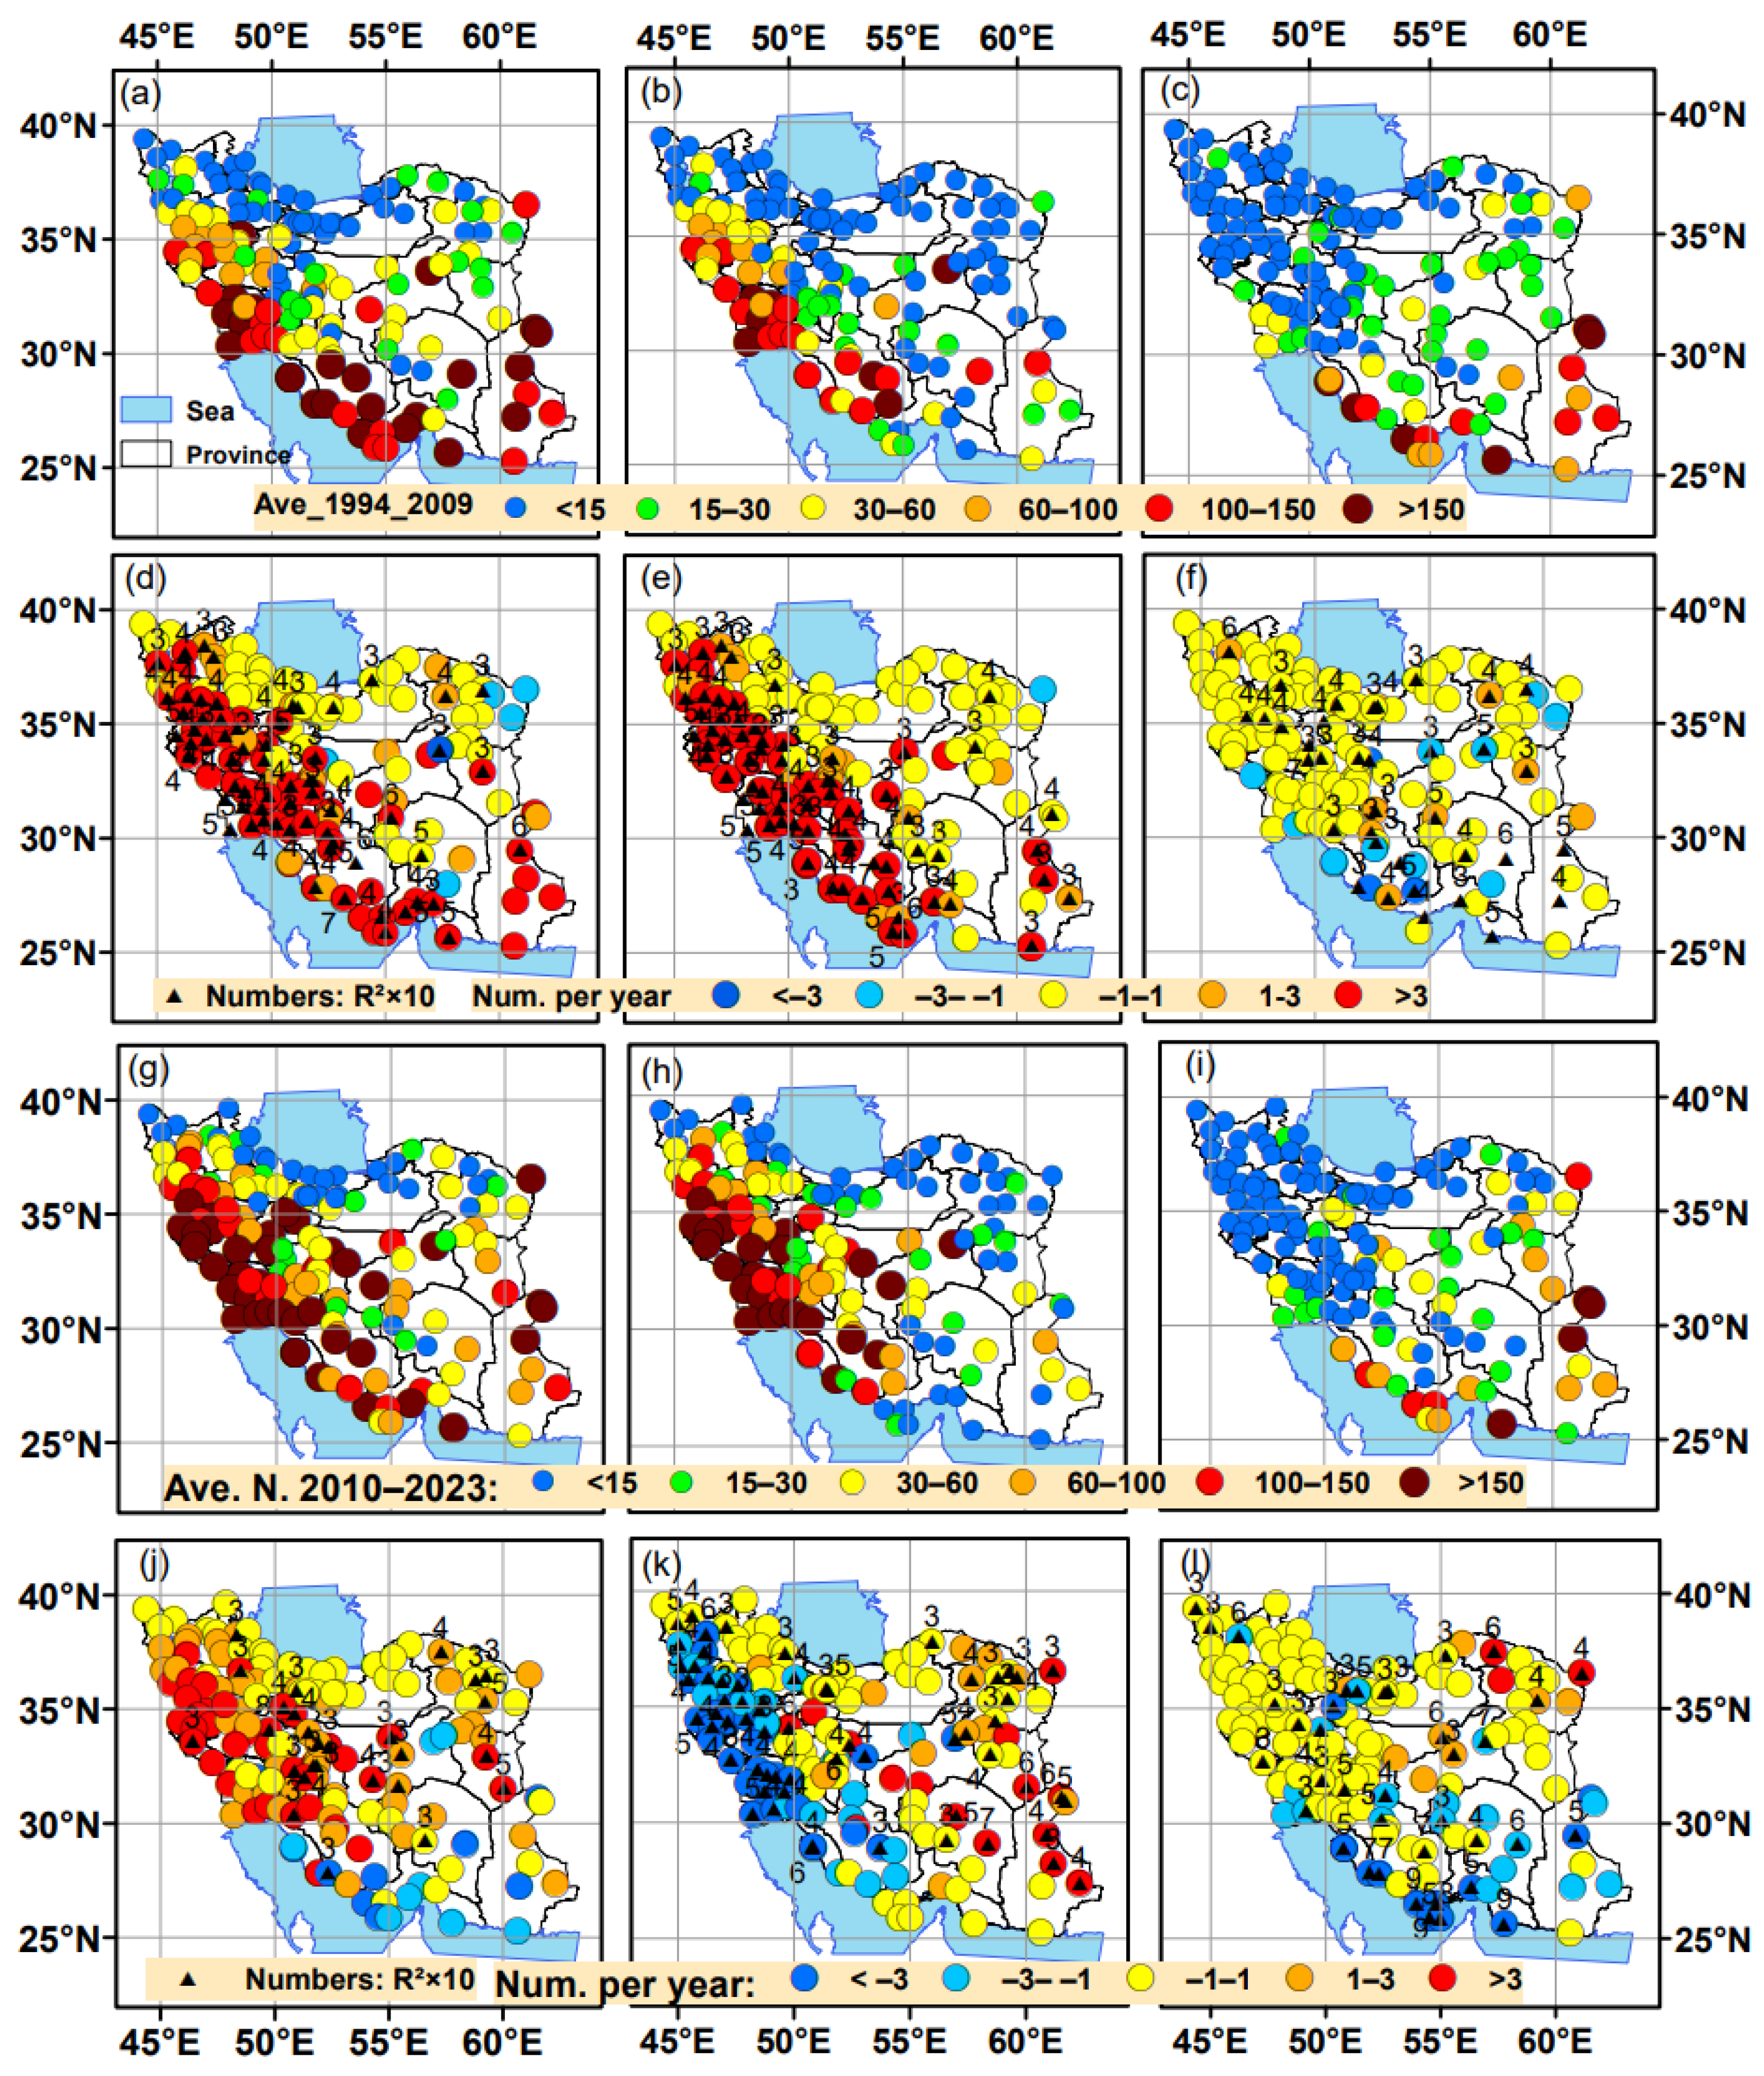
4.6. Spatio-Temporal Trends of Dust Events
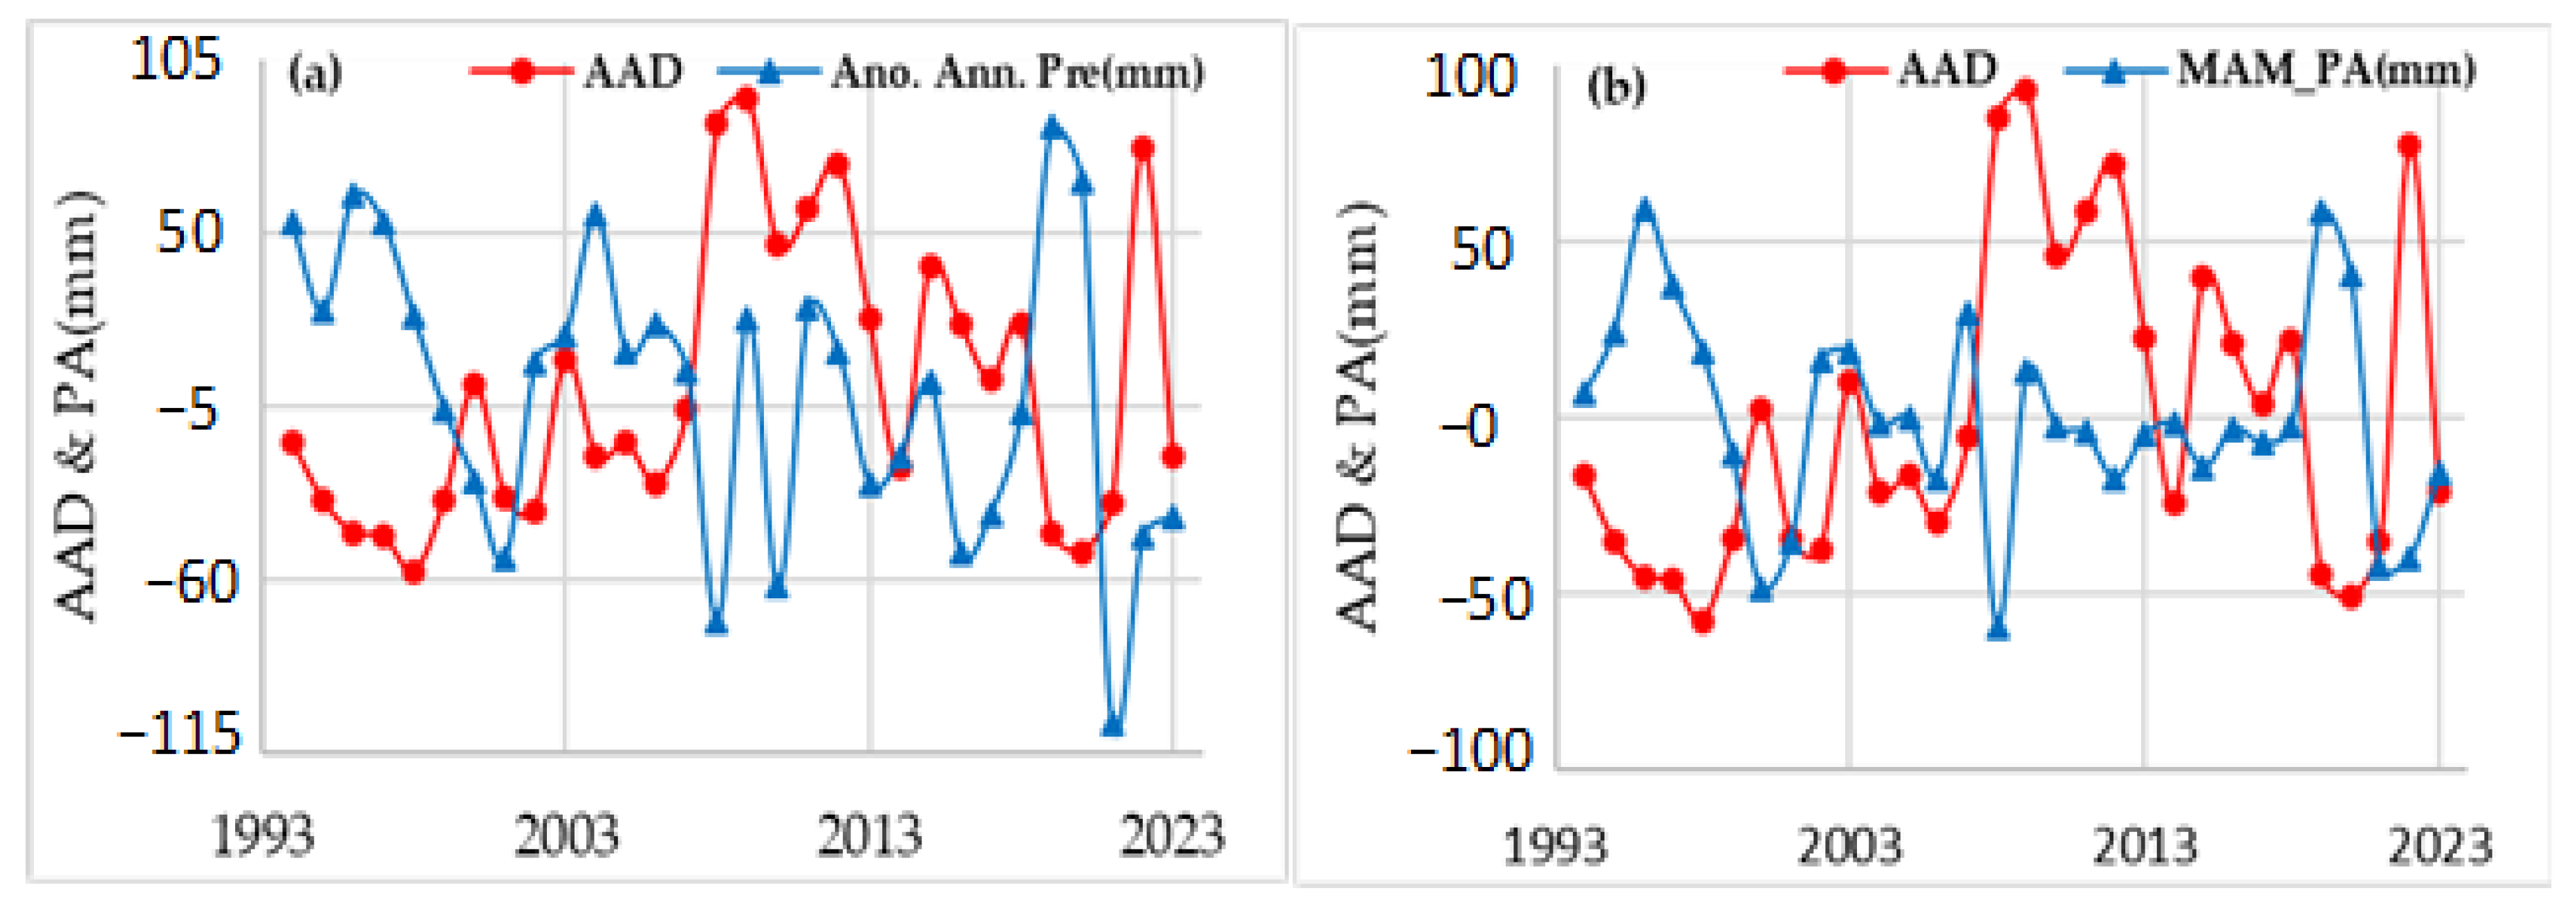
4.7. Influence of Precipitation Anomalies on Dust Events
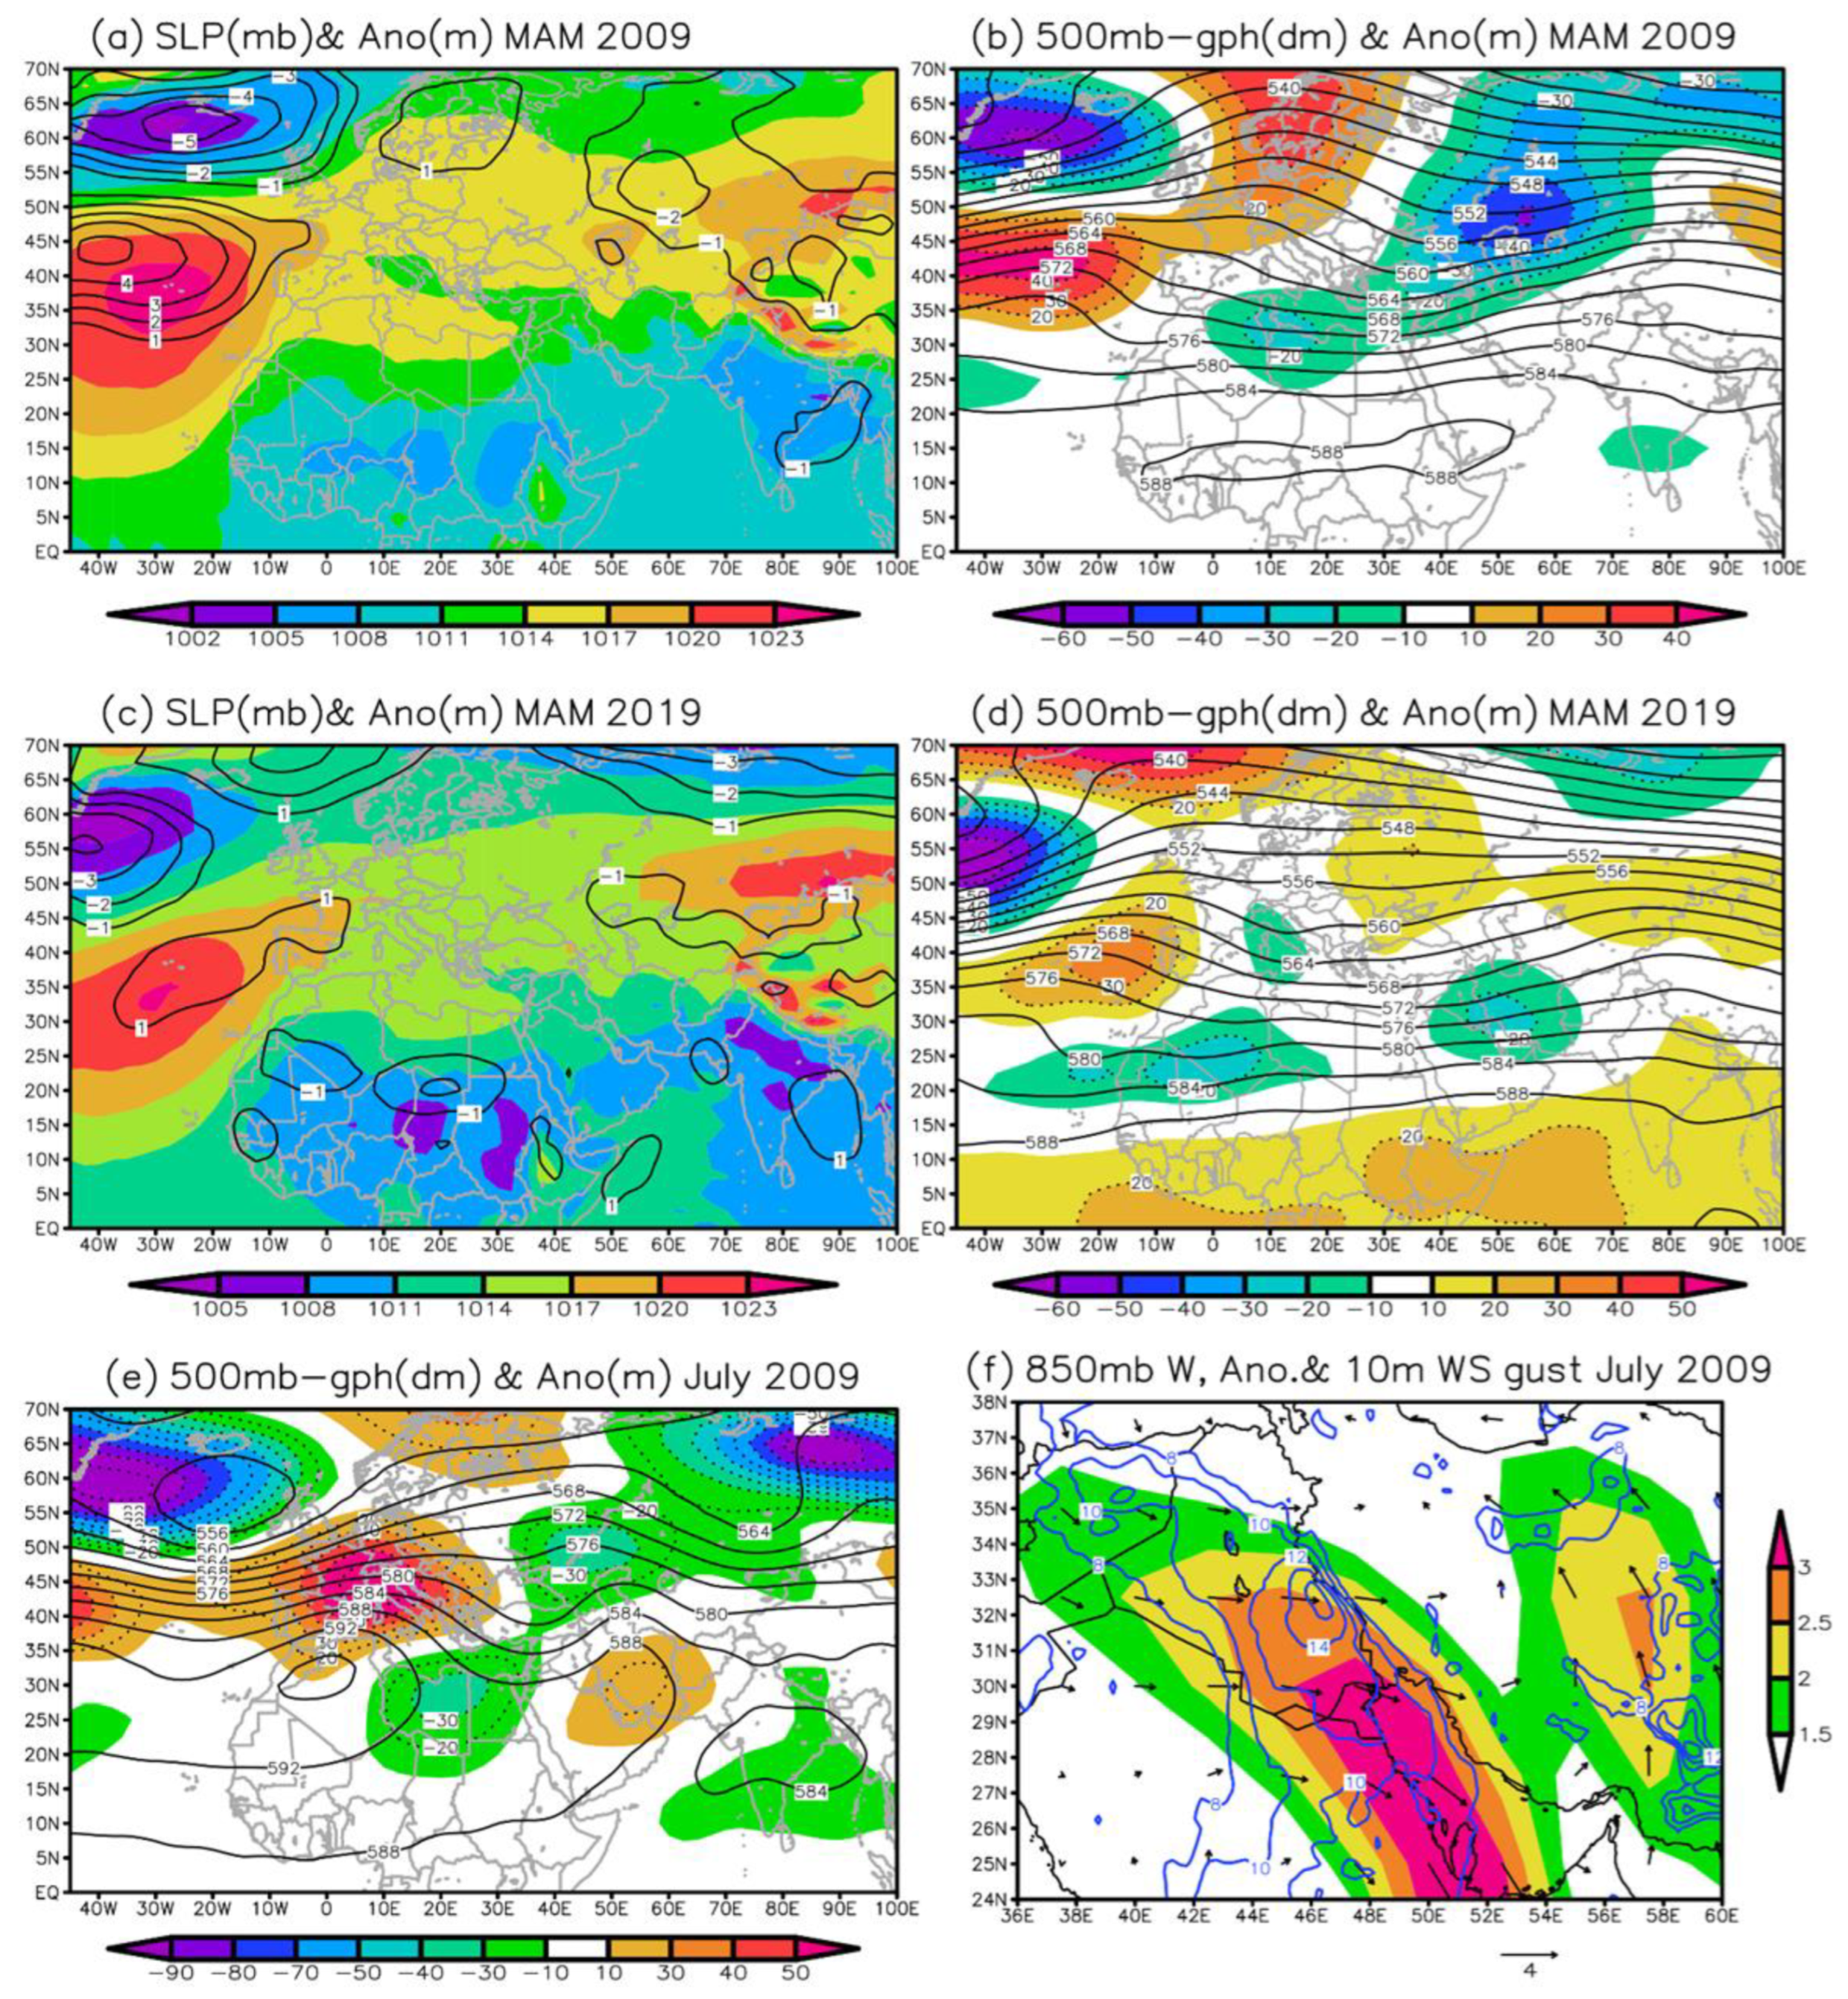
4.8. Atmospheric Circulations Affecting Dust Events
5. Conclusions
Author Contributions
Funding
Institutional Review Board Statement
Informed Consent Statement
Data Availability Statement
Acknowledgments
Conflicts of Interest
References
- World Health Organization. WHO Report on Surveillance of Antibiotic Consumption: 2016–2018 Early Implementation. 2018. Available online: https://www.who.int/publications/i/item/9789241514880 (accessed on 10 December 2024).
- Antoniadis, V.; Shaheen, S.M.; Levizou, E.; Shahid, M.; Niazi, N.K.; Vithanage, M.; Ok, Y.S.; Bolan, N.; Rinklebe, J. A critical prospective analysis of the potential toxicity of trace element regulation limits in soils worldwide: Are they protective concerning health risk assessment?—A review. Environ. Int. 2019, 127, 819–847. [Google Scholar] [CrossRef] [PubMed]
- Vohra, K.; Vodonos, A.; Schwartz, J.; Marais, E.A.; Sulprizio, M.P.; Mickley, L.J. Global mortality from outdoor fine particle pollution generated by fossil fuel combustion: Results from GEOS-Chem. Environ. Res. 2021, 195, 110754–110780. [Google Scholar] [CrossRef] [PubMed]
- World Health Organization. Interim Case Reporting form for 2019 Novel Coronavirus (2019-nCoV) of Confirmed and Probable Cases: WHO Minimum Data Set Report form, 21 January 2020 (No. WHO/2019-nCoV/Surveillance_CRF/2020.1); World Health Organization: Geneva, Switzerland, 2020. [Google Scholar]
- Schepanski, K. Transport of Mineral Dust and Its Impact on Climate. Geosciences 2018, 8, 151. [Google Scholar] [CrossRef]
- Logothetis, S.-A.; Salamalikis, V.; Kazantzidis, A. Aerosol classification in Europe, Middle East, north Africa and arabian peninsula based on AERONET version 3. Atmos. Res. 2020, 239, 104893. [Google Scholar] [CrossRef]
- Kosmopoulos, P.G.; Kazadzis, S.; Taylor, M.; Athanasopoulou, E.; Speyer, O.; Raptis, P.I.; Marinou, E.; Proestakis, E.; Solomos, S.; Gerasopoulos, E. Dust impact on surface solar irradiance assessed with model simulations, satellite observations and ground-based measurements. Atmos. Meas. Tech. 2017, 10, 2435–2453. [Google Scholar] [CrossRef]
- Mostamandi, S.; Ukhov, A.; Engelbrecht, J.; Shevchenko, I.; Osipov, S.; Stenchikov, G. Fine and Coarse Dust Effects on Radiative Forcing, Mass Deposition, and Solar Devices Over the Middle East. J. Geophys. Res. Atmos. 2023, 128, 22. [Google Scholar] [CrossRef]
- Haywood, J.M.; Boucher, O. Estimates of the direct and indirect radiative forcing due to tropospheric aerosols: A review. Rev. Geophys. 2000, 38, 513–543. [Google Scholar] [CrossRef]
- Ghosh, T.; Pal, I. Dust storm and its environmental implications. J. Eng. Comput. Appl. Sci. 2014, 3, 30–37. [Google Scholar]
- Abuduwaili, J.; Liu, D.; Wu, G. Saline dust storms and their ecological impacts in arid regions. J. Arid Land 2010, 2, 144–150. [Google Scholar] [CrossRef]
- Tyagi, G.; Babu, K.N.; Solanki, H.A. Monitoring bio-optical response of coastal waters surrounding the Indian subcontinent to atmospheric dust deposition using satellite data. Environ. Sci. Pollut. Res. 2019, 27, 5523–5535. [Google Scholar] [CrossRef]
- Ramaswamy, V.; Muraleedharan, P.M.; Prakash Babu, C. Mid-troposphere transport of Middle-East dust over the Arabian Sea and its effect on rainwater composition and sensitive ecosystems over India. Sci. Rep. 2017, 7, 13676. [Google Scholar] [CrossRef]
- Javanmard, Z.; Kouchaksaraei, M.T.; Bahrami, H.A.; Hosseini, S.M.; Modarres Sanavi, S.A.M.; Struve, D.; Ammere, C. Soil dust effects on morphological, physiological and biochemical responses of four tree species of semiarid regions. Eur. J. For. Res. 2019, 139, 333–348. [Google Scholar] [CrossRef]
- Engelstaedter, S.; Kohfeld, K.E.; Tegen, I.; Harrison, S.P. Controls of dust emissions by vegetation and topographic depressions: An evaluation using dust storm frequency data. Geophys. Res. Lett. 2003, 30, 6. [Google Scholar] [CrossRef]
- Hashizume, M.; Ueda, K.; Nishiwaki, Y.; Michikawa, T.; Onozuka, D. Health effects of Asian dust events: A review of the literature. Nihon Eiseigaku Zasshi 2010, 65, 413–421. [Google Scholar] [CrossRef] [PubMed]
- Sulaiman, S.A.; Hussain, H.H.; Leh, N.S.H.N.; Razali, M.S. Effects of dust on the performance of PV panels. World Acad. Sci. Eng. Technol. 2011, 58, 588–593. [Google Scholar]
- Choobari, O.A.; Zawar-Reza, P.; Sturman, A. The global distribution of mineral dust and its impacts on the climate system: A review. Atmos. Res. 2014, 138, 152–165. [Google Scholar] [CrossRef]
- Huang, J.; Wang, T.; Wang, W.; Li, Z.; Yan, H. Climate effects of dust aerosols over East Asian arid and semiarid regions. J. Geophys. Res. Atmos. 2014, 119, 11–398. [Google Scholar] [CrossRef]
- Kok, J.F.; Adebiyi, A.A.; Albani, S.; Balkanski, Y.; Checa-Garcia, R.; Chin, M.; Colarco, P.R.; Hamilton, D.S.; Huang, Y.; Ito, A.; et al. Contribution of the world’s main dust source regions to the global cycle of desert dust. Atmos. Chem. Phys. 2021, 21, 8169–8193. [Google Scholar] [CrossRef]
- Yu, Y.; Notaro, M.; Liu, Z.; Wang, F.; Alkolibi, F.; Fadda, E.; Bakhrjy, F. Climatic Controls on the Interannual to Decadal Variability in Saudi Arabian Dust Activity: Toward the Development of a Seasonal Dust Prediction Model: Saudi Arabian Dust Prediction. J. Geophys. Res. 2015, 120, 1739–1758. [Google Scholar] [CrossRef]
- Rashki, A.; Kaskaoutis, D.G.; Mofidi, A.; Minvielle, F.; Chiapello, I.; Legrand, M.; Dumka, U.C.; Francois, P. Effects of Monsoon, Shamal and Levar winds on dust accumulation over the Arabian Sea during summer—The July 2016 case. Aeolian Res. 2019, 36, 27–44. [Google Scholar] [CrossRef]
- Labban, A.H.; Mashat, A.S.; Awad, A.M. The Variability of the Siberian High Ridge over the Middle East. Int. J. Climatol. 2020, 41, 104–130. [Google Scholar] [CrossRef]
- Miri, A.; Maleki, S.; Middleton, N. An investigation into climatic and terrestrial drivers of dust storms in the Sistan region of Iran in the early twenty-first century. Sci. Total Environ. 2021, 757, 143952. [Google Scholar] [CrossRef]
- Shaheen, A.; Wu, R.; Aldabash, M. Long-term AOD trend assessment over the Eastern Mediterranean region: A comparative study including a new merged aerosol product. Atmos. Environ. 2020, 238, 117736. [Google Scholar] [CrossRef]
- Shaheen, A.; Wu, R.; Lelieveld, J.; Yousefi, R.; Aldabash, M. Winter AOD trend changes over the Eastern Mediterranean and Middle East region. Int. J. Climatol. 2021, 41, 5516–5535. [Google Scholar] [CrossRef]
- Shaheen, A.; Wu, R.; Yousefi, R.; Wang, F.; Ge, Q.; Kaskaoutis, D.G.; Wang, J.; Alpert, P.; Munawar, I. Spatio-temporal changes of spring-summer dust AOD over the Eastern Mediterranean and the Middle East: Reversal of dust trends and associated meteorological effects. Atmos. Res. 2023, 281, 106509. [Google Scholar] [CrossRef]
- Yousefi, R.; Wang, F.; Ge, Q.; Shaheen, A. Long-term aerosol optical depth trend over Iran and identification of dominant aerosol types. Sci. Total Environ. 2020, 722, 137906. [Google Scholar] [CrossRef]
- Yousefi, R.; Wang, F.; Ge, Q.; Shaheen, A.; Kaskaoutis, D.G. Analysis of the winter AOD trends over Iran from 2000 to 2020 and associated meteorological effects. Remote Sens. 2023, 15, 905. [Google Scholar] [CrossRef]
- Klingmüller, K.; Pozzer, A.; Metzger, S.; Stenchikov, G.L.; Lelieveld, J. Aerosol optical depth trend over the Middle East. Atmos. Chem. Phys. 2016, 16, 5063–5073. [Google Scholar] [CrossRef]
- Eskandari Damaneh, H.; Sayadi, Z.; Khoorani, A. Evaluation of spatiotemporal changes and correlations of aerosol optical depth, NDVI and climatic data over Iran. Iran. J. Range Desert Res. 2021, 28, 772–786. (In Persian) [Google Scholar] [CrossRef]
- Choubin, B.; Sajedi Hosseini, F.; Rahmati, O.; Mehdizadeh Youshanloei, M.; Jalali, M. Temporal and Spatial Variations of Dust Days in Western Azarbaijan Province, Determination of The Influencing Factors and Source of Events. Desert Manag. 2022, 10, 71–86. (In Persian) [Google Scholar] [CrossRef]
- Yousefi, R.; Wang, F.; Ge, Q.; Lelieveld, J.; Shaheen, A. Aerosol trends during the dusty season over Iran. Remote Sens. 2021, 13, 1045. [Google Scholar] [CrossRef]
- Liu, M.; Westphal, D.L.; Holt, T.R.; Xu, Q. Numerical simulation of a low-level jet over complex terrain in southern Iran. Mon. Weather Rev. 2000, 128, 1309–1327. [Google Scholar] [CrossRef]
- Fiedler, S.; Schepanski, K.; Heinold, B.; Knippertz, P. Climatology of Nocturnal Low-Level Jets over North Africa and Implications for Modeling Mineral Dust Emission. J. Geophys. Res. Atmos. 2013, 118, 6100–6121. [Google Scholar] [CrossRef]
- Zhang, G.; Zhang, D.; Sun, S. On the Orographically Generated Low-Level Easterly Jet and Severe Downslope Storms of March 2006 over the Tacheng Basin of Northwest China. Mon. Weather Rev. 2018, 146, 1667–1683. [Google Scholar] [CrossRef]
- Hashemi Devin, M.; Ranjbar SaadatAbadi, A.; Fattahi, E.; Karami, S.; Sehat Kashani, S. Study of the effect of low-level jets on genesis and transport of dust in the west and southwest of Iran. Iran. J. Geophys. 2022, 16, 1–19. [Google Scholar] [CrossRef]
- Parno, R.; Meshkatee, A.H.; Mobarak Hassan, E.; Hamzeh, N.H.; Chel Gee Ooi, M.; Habibi, M. Investigating the Role of the Low-Level Jet in Two Winters Severe Dust Rising in Southwest Iran. Atmosphere 2024, 15, 400. [Google Scholar] [CrossRef]
- Yu, Y.; Notaro, M.; Kalashnikova, O.V.; Garay, M.J. Climatology of summer Shamal wind in the Middle East. J. Geophys. Res. Atmos. 2016, 121, 289–305. [Google Scholar] [CrossRef]
- Mofidi, A.; Zarrin, A. On the Existence of Summer Shamal Wind Induced by the Zagros Mountains in the Middle East. Geophys. Res. Lett. 2022, 49, e2022GL100151. [Google Scholar] [CrossRef]
- Alsubhi, Y.; Awad, A.M.; Mashat, A.S.; Labban, A.H. Climatology of the spring subtropical jet stream over the Middle East and its effect on the synoptic characteristics of dust systems over the northern Arabian Peninsula. Arab. J. Geosci. 2023, 16, 12. [Google Scholar] [CrossRef]
- Mofidi, A.; Zarrin, A.; Hassani, S.; Soltani, M. Dynamics of a severe summer Shamal wind and its induced dust storm in the Middle East: A diagnostic study based on numerical simulation. Atmos. Res. 2024, 314, 107800. [Google Scholar] [CrossRef]
- Foroushani, M.A.; Opp, C.; Groll, M.; Nikfal, A. Evaluation of WRF-Chem Prediction for Dust Deposition in Southwestern Iran. Atmosphere 2020, 11, 757. [Google Scholar] [CrossRef]
- Karami, S.; Hamzeh, N.H.; Noori, F.; Ranjbar, A. Investigation of dust storms in Ilam and the performance analysis of simulation of 6 numerical prediction models at a severe dust storm in west of Iran. J. Air Pollut. Health 2019, 2, 14–27. [Google Scholar] [CrossRef]
- Foroushani, M.A.; Opp, C.; Groll, M. Investigation of aeolian dust deposition rates in different climate zones of southwestern Iran. Atmosphere 2021, 12, 229. [Google Scholar] [CrossRef]
- Foroushani, M.A.; Opp, C.; Groll, M. Spatial and temporal gradients in the rate of dust deposition and aerosol optical thickness in southwestern Iran. J. Arid Land 2021, 13, 1–22. [Google Scholar] [CrossRef]
- Notaro, M.; Yu, Y.; Kalashnikova, O.V. Regime shift in Arabian dust activity, triggered by persistent Fertile Crescent drought. J. Geophys. Res. Atmos. 2015, 120, 10–229. [Google Scholar] [CrossRef]
- Hamzeh, N.H.; Kaskaoutis, D.G.; Rashki, A.; Mohammadpour, K. Long-Term Variability of Dust Events in Southwestern Iran and Its Relationship with the Drought. Atmosphere 2021, 12, 1350–1368. [Google Scholar] [CrossRef]
- Abadi, A.R.S.; Hamzeh, N.H.; Chel Gee Ooi, M.; Kong, S.S.K.; Opp, C. Investigation of two severe shamal dust storms and the highest dust frequencies in the south and southwest of Iran. Atmosphere 2022, 12, 1990. [Google Scholar] [CrossRef]
- Nasabpour, M.S.; Salajegheh, A.; Khosravi, H.; Nasiri, A.; Ranjbar Saadat Abadi, A. Investigating the Trend of Dust Changes in The Eastern Half of Iran. Desert Manag. 2023, 11, 1–16. [Google Scholar]
- Cao, L.; Gao, Y.; Zhang, M.; Wang, Y. Impacts of aerosol direct radiative effect on global and regional climate changes from 2001 to 2010. J. Geophys. Res. Atmos. 2015, 120, 9932–9948. [Google Scholar]
- Francis, B.D.; Flamant, C.; Chaboureau, J.P.; Banks, J.; Cuesta, J.; Brindley, H.; Oolman, L. Dust emission and transport over Iraq associated with the summer Shamal winds. Aeolian Res. 2017, 24, 15–31. [Google Scholar] [CrossRef]
- Francis, D.; Chaboureau, J.-P.; Nelli, N.; Cuesta, J.; Alshamsi, N.; Temimi, M.; Pauluis, O.; Xue, L. Summertime dust storms over the Arabian Peninsula and impacts on radiation, circulation, cloud development and rain. Atmos. Res. 2021, 250, 105364. [Google Scholar] [CrossRef]
- Soleimani, Z.; Teymouri, P.; Darvishi Boloorani, A.; Mesdaghini, A.; Middleton, N.; Griffin, D.W. An overview of bioaerosol load and health impacts associated with dust storms: A focus on the Middle East. Atmos. Environ. 2020. [CrossRef]
- Mobarak Hassan, E. Effective Synoptic Structures in the Supporting Dust Storms over the Persian Gulf. J. Oceanogr. 2019, 10, 53–64. [Google Scholar] [CrossRef]
- Rezazadeh, M.; Irannejad, P.; Shao, Y. Climatology of the Middle East Dust Events. Aeolian Res. 2013, 10, 103–109. [Google Scholar] [CrossRef]
- Modarres, R.; Sadeghi, S. Spatial and Temporal Trends of Dust Storms across Desert Regions of Iran. Nat. Hazards 2018, 90, 101–114. [Google Scholar] [CrossRef]
- Rashki, A.; Kaskaoutis, D.G.; Sepehr, A. Statistical evaluation of the dust events at selected stations in southwest Asia: From the Caspian Sea to the Arabian Sea. Catena 2018, 165, 590–603. [Google Scholar] [CrossRef]
- Hamzeh, N.H.; Karami, S.; Opp, C.; Fattahi, E.; Jean-François, V. Spatial and temporal variability in dust storms in the Middle East, 2002–2018: Three case studies in July 2009. Arab. J. Geosci. 2021, 14, 538. [Google Scholar] [CrossRef]
- Abadi, A.R.S.; Shukurov, K.A.; Hamzeh, N.H.; Kaskaoutis, D.G.; Opp, C.; Shukurova, L.M.; Ghasabi, Z. Dust events over the Urmia Lake Basin, NW Iran, in 2009–2022 and their potential sources. Remote Sens. 2024, 16, 2384. [Google Scholar] [CrossRef]
- Hamzeh, N.H.; Abadi, A.R.S.; Kaskaoutis, D.G.; Mirzaei, E.; Shukurov, K.A.; Sotiropoulou, R.-E.P.; Tagaris, E. The Importance of Wind Simulations over Dried Lake Beds for Dust Emissions in the Middle East. Atmosphere 2023, 15, 24. [Google Scholar] [CrossRef]
- Saadatabadi, A.R.; Hamzeh, N.H.; Kaskaoutis, D.G.; Ghasabi, Z.; Penchah, M.M.; Sotiropoulou, R.-E.P.; Habibi, M. Optimization and evaluation of the Weather Research and Forecasting (WRF) model for wind energy resource assessment and mapping in Iran. Appl. Sci. 2024, 14, 3304. [Google Scholar] [CrossRef]
- Hamzeh, N.H.; Abadi, A.R.S.; Alam, K.; Shukurov, K.A.; Opp, C. Long-Term Wind and Air Temperature Patterns in the Southeastern Region of Iran through Model Simulation and Ground Observations. Atmosphere 2024, 15, 993. [Google Scholar] [CrossRef]
- Mahmoudi, L.; Ikegaya, N. Identifying the Distribution and Frequency of Dust Storms in Iran Based on Long-Term Observations from over 400 Weather Stations. Sustainability 2023, 15, 12294. [Google Scholar] [CrossRef]
- Farzadfar, F.; Yousefi, M.; Jafari-Khounigh, A.; Khorrami, Z.; Haghdoost, A.; Shadmani, F.K. Trend and projection of non-communicable diseases risk factors in Iran from 2001 to 2030. Sci. Rep. 2024, 14, 8092. [Google Scholar] [CrossRef] [PubMed]
- Dadashi Roudbari, A.A.; Ahmadi, M. An assessment of change point and trend of diurnal variation of dust storms in Iran: A multi-instrumental approach from in situ, multi-satellite, and reanalysis dust product. Meteorol. Atmos. Phys. 2021. [CrossRef]
- Abadi, A.R.S.; Hamzeh, N.H.; Kaskaoutis, D.G.; Vuillaume, J.F.; Shukurov, K.A.; Gharibzadeh, M. Spatio-Temporal Distribution of PM2.5 and PM10 Concentrations and Assessment of Public Health Risk in the Three Most Polluted Provinces of Iran. Sustainability 2024, 17, 44. [Google Scholar] [CrossRef]
- Kalnay, E.; Kanamitsu, M.; Kistler, R.; Collins, W.; Deaven, D.; Gandin, L.; Iredell, M.; Saha, S.; White, G.; Woolen, J.; et al. The NCEP/NCAR 40-year reanalysis project. Bull. Am. Meteorol. Soc. 1996, 77, 437–471. [Google Scholar] [CrossRef]
- Hersbach, H. The ERA5 Global Reanalysis. Q. J. R. Meteorol. Soc. 2020, 146, 1999–2049. [Google Scholar] [CrossRef]
- Barcelona Dust Regional Center. Available online: https://dust.aemet.es (accessed on 12 January 2025).
- Mesbahzadeh, T.; Salajeghe, A.; Sardoo, F.S.; Zehtabian, G.; Ranjbar, A.; Krakauer, N.Y.; Miglietta, M.M.; Mirakbari, M. Climatology of dust days in the Central Plateau of Iran. Nat. Hazards 2020, 104, 1801–1817. [Google Scholar] [CrossRef]
- Ahrari, A.; Panchanathan, A.; Haghighi, A.T. Dust over water: Analyzing the impact of lake desiccation on dust storms on the Iranian Plateau. J. Hazard. Mater. 2024, 480, 136377. [Google Scholar] [CrossRef]
- Mohammadpour, K.; Sciortino, M.; Kaskaoutis, D.G. Classification of weather clusters over the Middle East associated with high atmospheric dust-AODs in West Iran. Atmos. Res. 2021, 259, 105682. [Google Scholar] [CrossRef]
- Mobarak Hassan, E.; Alizadeh, O. Dust events in southwestern Iran: Estimation of pm10 concentration based on horizontal visibility during dust events. Int. J. Climatol. 2022, 42, 5159–5172. [Google Scholar] [CrossRef]
- Ghafarian, P.; Kabiri, K.; Delju, A.H.; Fallahi, M. Spatio-temporal variability of dust events in the northern Persian Gulf from 1991 to 2020. Atmos. Pollut. Res. 2022, 13, 101357. [Google Scholar] [CrossRef]
- Ghafarian, P.; Mohammadpour Penchah, M. Wind resource assessment over the Persian Gulf and Oman Sea using a numerical model simulation and satellite data. J. Ocean Eng. Mar. Energy 2023, 9, 377–386. [Google Scholar] [CrossRef]
- Salmabadi, H.; Saeedi, M.; Roy, A.; Kaskaoutis, D.G. Quantifying the contribution of Middle Eastern dust sources to PM10 levels in Ahvaz, Southwest Iran. Atmos. Res. 2023, 295, 106993. [Google Scholar] [CrossRef]
- Karami, S.; Kaskaoutis, D.G.; Ghassabi, Z.; Khansalari, S. Investigation and model simulation of dry and moist (haboob) convective dust storms in Yazd Province, central Iranian plateau. Arab. J. Geosci. 2023, 16, 241. [Google Scholar] [CrossRef]
- Baghbanan, P.; Ghavidel, Y.; Farajzadeh, M. Spatial analysis of spring dust storms hazard in Iran. Theor. Appl. Climatol. 2020, 139, 1447–1457. [Google Scholar] [CrossRef]
- Bayat, F.; Khalesifard, H.R. Characterization of released dust over open waters in the south of the Iran Plateau based on satellite and ground-based measurements. Atmos. Pollut. Res. 2021, 12, 101208. [Google Scholar] [CrossRef]
- Mesbahzadeh, T.; Miglietta, M.M.; Sardoo, F.S.; Krakauer, N.; Hasheminejad, M. Regional Analysis of Dust Day Duration in Central Iran. Appl. Sci. 2022, 12, 6248. [Google Scholar] [CrossRef]
- Zawar-Reza, P. Numerical Analysis of the’120 Day Wind’over the Sistan Region, South-West Asia with TAPM. Clean Air Environ. Qual. 2008, 42, 21–24. [Google Scholar]
- Abbasi, H.; Opp, C.; Groll, M.; Gohardoust, A. Wind regime and sand transport in the Sistan and Registan regions (Iran/Afghanistan). Zeitschrift für Geomorphologie 2019, 62 (Suppl. S1), 41–57. [Google Scholar] [CrossRef]
- Gholami, H.; Mohamadifar, A.; Sorooshian, A.; Jansen, J. Machine-learning algorithms for predicting land susceptibility to dust emissions: The case of the Jazmurian Basin, Iran. Atmos. Pollut. Res. 2020, 11, 1303–1315. [Google Scholar] [CrossRef]
- Shirani, M.; Afzali, K.N.; Jahan, S.; Strezov, V.; Soleimani-Sardo, M. Pollution and contamination assessment of heavy metals in the sediments of Jazmurian playa in southeast Iran. Sci. Rep. 2020, 10, 4775. [Google Scholar] [CrossRef] [PubMed]
- Darvishi Boloorani, A.; Najafi, M.S.; Soleimani, M.; Papi, R.; Torabi, O. Influence of Hamoun Lakes’ dry conditions on dust emission and radiative forcing over Sistan plain, Iran. Atmos. Res. 2022, 272, 106152. [Google Scholar] [CrossRef]
- Rami, A.; Hamidi, M.; Neya, B.N. Atmospheric analysis of dust storms in Sistan region. J. Atmos. Sol.-Terr. Phys. 2022, 227, 105800. [Google Scholar] [CrossRef]
- Ebrahimi-Khusfi, Z.; Zandifar, S.; Ebrahimi-Khusfi, M.; Tavakoli, V. Heavy metal mapping, source identification, and ecological risk assessment in the International Hamoun wetland, Sistan region, Iran. Environ. Sci. Pollut. Res. 2022, 30, 29321–29335. [Google Scholar] [CrossRef]
- Alizadeh-Choobari, O.; Ghafarian, P.; Owlad, E. Temporal Variations in the Frequency and Concentration of Dust Events over Iran Based on Surface Observations. Int. J. Climatol. 2016, 36, 2050–2062. [Google Scholar] [CrossRef]
- Beyranvand, A.; Azizi, G.; Alizadeh-Choobari, O.; Darvishi Boloorani, A. Spatial and Temporal Variations in the Incidence of Dust Events over Iran. Nat. Hazards 2019, 97, 229–241. [Google Scholar] [CrossRef]
- Nabavi, S.S.; Moradi, H.; Shrifikia, M. Evaluation of dust storm temporal distribution and the relation of the effective factors with the frequency of occurrence in Khuzestan Province from 2000 to 2015. Geogr. Data 2019, 28, 191–203. [Google Scholar]
- Salmabadi, H.; Khalidy, R.; Saeedi, M. Transport routes and potential source regions of the Middle Eastern dust over Ahvaz during 2005–2017. Atmos. Res. 2020, 241, 104947. [Google Scholar] [CrossRef]
- Rezaei, M.; Mielonen, T.; Farajzadeh, M. Climatology of atmospheric dust corridors in the Middle East based on satellite data. Atmos. Res. 2022, 280, 106454. [Google Scholar] [CrossRef]
- Ahmadi-Molaverdi, M.; Jabbari, I.; Fathnia, A. Geomorphological and Spatial Analysis of Dust sources in Ilam Province, Iran. Sediment. Geol. 2022, 436, 106168. [Google Scholar] [CrossRef]
- Mohammadi, Z.; Rahimi, D.; Najafi, M.R.; Zakerinejad, R. The Effect of Environmental Degradation and Climate on Dust in Khuzestan Province, Iran. Nat. Hazards 2024, 120, 1–20. [Google Scholar] [CrossRef]
- Pourhashemi, S. Preparing a map of the sensitivity of the lands of Ilam province to dust production using data mining models. Environ. Eros. Res. 2024, 14, 83–101. [Google Scholar] [CrossRef]
- Khaniabadi, Y.O.; Daryanoosh, S.M.; Amrane, A.; Polosa, R.; Hopke, P.K.; Goudarzi, G.; Mohammadi, M.J.; Sicard, P.; Armin, H. Impact of Middle Eastern Dust storms on human health. Atmos. Pollut. Res. 2017, 8, 606–613. [Google Scholar] [CrossRef]
- Farsani, M.H.; Shirmardi, M.; Alavi, N.; Maleki, H.; Sorooshian, A.; Babaei, A.; Asgharnia, H.; Marzouni, M.B.; Goudarzi, G. Evaluation of the relationship between PM10 concentrations and heavy metals during normal and dusty days in Ahvaz, Iran. Aeolian Res. 2018, 33, 12–22. [Google Scholar] [CrossRef]
- Amini, H. WHO air quality guidelines need to be adopted. Int. J. Public Health 2021, 66, 1604483. [Google Scholar] [CrossRef]
- Ebrahimi, S.J.A.; Ebrahimzadeh, L.; Eslami, A.; Bidarpoor, F. Effects of dust storm events on emergency admissions for cardiovascular and respiratory diseases in Sanandaj, Iran. J. Environ. Health Sci. Eng. 2014, 12, 1–5. [Google Scholar] [CrossRef]
- Pouri, N.; Karimi, B.; Kolivand, A.; Mirhoseini, S.H. Ambient dust pollution with all-cause, cardiovascular and respiratory mortality: A systematic review and meta-analysis. Sci. Total Environ. 2024, 912, 168945. [Google Scholar] [CrossRef]
- Goudarzi, G.; Daryanoosh, S.M.; Godini, H.; Hopke, P.K.; Sicard, P.; De Marco, A.; Rad, H.D.; Harbizadeh, A.; Jahedi, F.; Mohammadi, M.J.; et al. Health risk assessment of exposure to the Middle-Eastern Dust storms in the Iranian megacity of Kermanshah. Public Health 2017, 148, 109–116. [Google Scholar] [CrossRef]
- Gholampour, A.; Nabizadeh, R.; Yunesian, M.; Naseri, S.; Taghipour, H.; Rastkari, N.; Nazmara, S.; Mahvi, A.H. Physico-chemical characterization of ambient air particulate matter in Tabriz, Iran. Bull. Environ. Contam. Toxicol. 2014, 92, 738–744. [Google Scholar] [CrossRef]
- Boroughani, M.; Hashemi, H.; Hosseini, S.H.; Pourhashemi, S.; Berndtsson, R. Desiccating Lake Urmia: A New Dust Source of Regional Importance. IEEE Geosci. Remote Sens. Lett. 2020, 17, 1483–1487. [Google Scholar] [CrossRef]
- Zucca, C.; Middleton, N.; Kang, U.; Liniger, H. Shrinking Water Bodies as Hotspots of Sand and Dust Storms: The Role of Land Degradation and Sustainable Soil and Water Management. Catena 2021, 207, 105669. [Google Scholar] [CrossRef]
- Eivazzadeh, M.; Yadeghari, A.; Gholampour, A. Temporal and spatial variations of deposition and elemental composition of dust fall and its source identification around Tabriz, Iran. J. Environ. Health Sci. Eng. 2019, 17, 29–40. [Google Scholar] [CrossRef]
- Najmeddin, A.; Keshavarzi, B.; Moore, F.; Lahijanzadeh, A. Source apportionment and health risk assessment of potentially toxic elements in road dust from urban industrial areas of Ahvaz megacity, Iran. Environ. Geochem. Health 2018, 40, 1187–1208. [Google Scholar] [CrossRef]
- Maleki, H.; Sorooshian, A.; Goudarzi, G.; Nikfal, A.; Baneshi, M.M. Temporal profile of PM10 and associated health effects in one of the most polluted cities of the world (Ahvaz, Iran) between 2009 and 2014. Aeolian Res. 2016, 22, 135–140. [Google Scholar] [CrossRef] [PubMed]
- Goudarzi, G.; Sorooshian, A.; Maleki, H. Local and Long-range transport dust storms over the city of Ahvaz: A survey based on spatiotemporal and geometrical properties. Pure Appl. Geophys. 2020, 177, 3979–3997. [Google Scholar] [CrossRef]
- Broomandi, P.; Dabir, B.; Bonakdarpour, B.; Rashidi, Y. Identification of the sources of dust storms in the City of Ahvaz by HYSPLIT. Pollution 2017, 3, 341–348. [Google Scholar]
- Goudarzi, G.; Shirmardi, M.; Khodarahmi, F.; Hashemi-Shahraki, A.; Alavi, N.; Ankali, K.A.; Babaei, A.A.; Soleimani, Z.; Marzouni, M.B. Particulate matter and bacteria characteristics of the Middle East Dust (MED) storms over Ahvaz, Iran. Aerobiologia 2014, 30, 345–356. [Google Scholar] [CrossRef]
- Alizadeh-Choobari, O.; Zawar-Reza, P.; Sturman, A. The wind of 120 days and dust storm activity over the Sistan Basin. Atmos. Res. 2014, 143, 328–341. [Google Scholar] [CrossRef]
- Ahmadi, S.; Ezeliora, C.D.; Sharki, S.H.; Osagie, C.; Ghosh, S.; Igwegbe, C.A.; Khan, N.A. Assessment of health impacts attributed to PM10 exposure during 2015–2017 in Zabol City, Iran. Int. J. Environ. Sci. Technol. 2022, 19, 4123–4136. [Google Scholar] [CrossRef]
- Saberifar, R.; Moosa Kazemi, S.M.; Karimian Pour, F. Investigating the Viability of Cities Located in Environmentally Sensitive Areas, Case Study: Zabol City. J. Urban Ecol. Res. 2024, 15, 19–32. [Google Scholar]
- Javadian, M.; Behrangi, A.; Sorooshian, A. Impact of Drought on Dust Storms: Case Study over Southwest Iran. Environ. Res. Lett. 2019, 14, 124029. [Google Scholar] [CrossRef]
- Kaniewski, D.; Van Campo, E.; Weiss, H. Drought is a recurring challenge in the Middle East. Proc. Natl. Acad. Sci. USA 2012, 109, 3862–3867. [Google Scholar] [CrossRef] [PubMed]
- Zittis, G.; Hadjinicolaou, P.; Lelieveld, J. Dust storms in the Eastern Mediterranean: Natural or anthropogenic? Atmos. Chem. Phys. 2019, 19, 1811–1830. [Google Scholar]
- Hameed, M.; Ahmadalipour, A.; Moradkhani, H. Drought and food security in the middle east: An analytical framework. Agric. For. Meteorol. 2020, 281, 107816. [Google Scholar] [CrossRef]
- Alsafadi, K.; Al-Ansari, N.; Mokhtar, A.; Mohammed, S.; Elbeltagi, A.; Sh-Sammen, S.; Bi, S. An evapotranspiration deficit-based drought index to detect variability of terrestrial carbon productivity in the Middle East. Environ. Res. Lett. 2022, 17, 014051. [Google Scholar] [CrossRef]
- Pary, A.T.; Rastgoo, P.; Opp, C.; Zeuss, D.; Abera, T.A. Impacts of drought severity and frequency on natural vegetation across Iran. Water 2024, 16, 3334. [Google Scholar] [CrossRef]
- Beyranvand, A.; Azizi, G.; Alizadeh, O.; Darvishi Boloorani, A. Dust in Western Iran: The emergence of new sources in response to shrinking water bodies. Sci. Rep. 2023, 13, 16158. [Google Scholar] [CrossRef]
- Razavieh, A.; Sedaghat, A.; Ayodele, R.; Mostafaeipour, A. Worldwide wind energy status and the characteristics of wind energy in Iran, case study: The province of Sistan and Baluchestan. Int. J. Sustain. Energy 2017, 36, 103–123. [Google Scholar] [CrossRef]
- Alizadeh, O.; Abniki, M.; Babaei, M.; Irannejad, P. Climatology and the dynamic mechanism of the Levar wind and dust events in eastern Iran. Int. J. Climatol. 2022, 42, 9288–9303. [Google Scholar] [CrossRef]
- Vaezi, A.; Shahbazi, R.; Sheikh, M.; Lak, R.; Ahmadi, N.; Kaskaoutis, D.G.; Behrooz, R.D.; Sotiropoulou, R.E.P.; Tagaris, E. Environmental pollution and human health risks associated with atmospheric dust in Zabol City, Iran. Air Qual. Atmos. Health 2024, 17, 2491–2513. [Google Scholar] [CrossRef]
- Mohamadi Moradian, J.; Hosseinzadeh, S.R. The study of desert dust in Mashhad Metropolis using satellite images and synoptic datasets (2009–2013). J. Geogr. Environ. Hazards 2015, 4, 35–57. [Google Scholar]
- Darvishi Boloorani, A.; Papi, R.; Soleimani, M.; Karami, L.; Amiri, F.; Samany, N.N. Water bodies changes in Tigris and Euphrates basin has impacted dust storms phenomena. Aeolian Res. 2021, 50, 100698. [Google Scholar] [CrossRef]
- Naghibi, A.; Hashemi, H.; Zhao, P.; Brogaard, S.; Eklund, L.; Hassan, H.H.; Mansourian, A. Spatiotemporal variability of dust storm source susceptibility during wet and dry periods: The Tigris-Euphrates River Basin. Atmos. Pollut. Res. 2023, 15, 101953. [Google Scholar] [CrossRef]
- Ahmady-Birgani, H.; Ravan, P.; Schlosser, J.S.; Cuevas-Robles, A.; Azadi Aghdam, M.; Sorooshian, A. On the chemical nature of wet deposition over a major desiccated lake: Case study for Lake Urmia basin. Atmos. Res. 2020, 234, 104762. [Google Scholar] [CrossRef]
- Hamzehpour, N.; Mahdavinia, G.R.; Rahmati, M. Sand sheets—The major dust source in the western Lake Urmia playa—A comprehensive study of the soil-dust properties and stabilization. Int. J. Sediment Res. 2024, 39, 355–374. [Google Scholar] [CrossRef]
- Mousavi, A.; Shahbazi, F.; Oustan, S.; Jafarzadeh, A.A.; Minasny, B. Spatial distribution of iron forms and features in the dried lake bed of Urmia Lake of Iran. Geoderma Reg. 2020, 21, e00275. [Google Scholar] [CrossRef]
- Basart, S.; Pérez, C.; Nickovic, S.; Cuevas, E.; Baldasano, J. Development and evaluation of the BSC-DREAM8b dust regional model over Northern Africa, the Mediterranean and the Middle East. Tellus B Chem. Phys. Meteorol. 2012, 64, 18539. [Google Scholar] [CrossRef]
- Parolari, A.J.; Li, D.; Bou-Zeid, E.; Katul, G.G.; Assouline, S. Climate, not conflict, explains extreme Middle East dust storm. Environ. Res. Lett. 2016, 11, 114013. [Google Scholar] [CrossRef]
- Solomos, S.; Ansmann, A.; Mamouri, R.E.; Binietoglou, I.; Patlakas, P.; Marinou, E.; Amiridis, V. Remote sensing and modelling analysis of the extreme dust storm hitting the Middle East and eastern Mediterranean in September 2015. Atmos. Chem. Phys. 2017, 17, 4063–4079. [Google Scholar] [CrossRef]
- Issanova, G.; Abuduwaili, J. Aeolian Processes as Dust Storms in the Deserts of Central Asia and Kazakhstan; Springer: Berlin/Heidelberg, Germany, 2017. [Google Scholar]
- Zhang, X.; He, M.; Bai, M.; Ge, Q. Meteorological drought and its large-scale climate patterns in each season in Central Asia from 1901 to 2015. Clim. Change 2021, 166, 41. [Google Scholar] [CrossRef]
- Mamadjanova, G. Variability of the Steering Factors for Extreme Hydrometeorological Events in Central Asia and Its Relation to the Formation of Mudflows in the Piedmont Areas of Uzbekistan. Doctoral Dissertation, University of Birmingham, Birmingham, UK, 2019. [Google Scholar]
- Nobakht, M. Characterisation of Dust Sources in Central Asia Using Remote Sensing. Doctoral Dissertation, University of Reading, Reading, UK, 2018. [Google Scholar]
- Zhang, X.X.; Claiborn, C.; Lei, J.Q.; Vaughan, J.; Wu, S.X.; Li, S.Y.; Liu, L.Y.; Wang, Z.F.; Wang, Y.D.; Huang, S.Y.; et al. Aeolian dust in Central Asia: Spatial distribution and temporal variability. Atmos. Environ. 2020, 238, 117734. [Google Scholar] [CrossRef]
- Wang, W.; Samat, A.; Abuduwaili, J.; Ge, Y.; De Maeyer, P.; Van de Voorde, T. Temporal characterization of sand and dust storm activity and its climatic and terrestrial drivers in the Aral Sea region. Atmos. Res. 2022, 275, 106242. [Google Scholar] [CrossRef]
- Chen, L.; Zhu, G.; Wang, Q.Q.; Ye, L.; Lin, X.; Lu, S.; Jiao, Y.; Li, R.; Meng, G.; Wang, Y.; et al. Influence of mountain orientation on precipitation isotopes in the westerly belt of Eurasia. Glob. Planet. Change 2024, 240, 104543. [Google Scholar] [CrossRef]
- Wang, Q.; Liu, Y.; Zhu, G.; Lu, S.; Chen, L.; Jiao, Y.; Li, W.; Li, W.; Wang, Y. Regional differences in the effects of atmospheric moisture residence time on precipitation isotopes over Eurasia. Atmos. Res. 2025, 314, 107813. [Google Scholar] [CrossRef]


| 0. WW Code Number | Definition |
|---|---|
| 06 | Widespread suspended dust that has not been raised by wind near or at the station at the observation time. |
| 07 | Sand or dust raised by wind near or at the observation time, but no well-developed SDS. |
| 08 | Sand or dust whirl(s) developed at or around the station at the observation time or during the previous hour. |
| 09 | Dust storm (DS) or sandstorm (SS) sighted around the station or at the station during the previous hour. |
| 30–32 Slight or moderate DS or SS, visibility less than 1000 m but greater than 200 m | 30: decreased during the previous hour 31: no considerable change during the previous hour 32: has begun or has increased during the previous hour |
| 33–35 Severe DS or SS, visibility of less than 200 m. | 33: decreased during the previous hour 34: no considerable change during the previous hour 35: has begun or has increased during the previous hour |
| 98 | Thunderstorm combined with DS or SS at the time of observation |
| Month | PA | Slope | R2 | Month | PA | Slope | R2 | Season | PA | Slope | R2 |
|---|---|---|---|---|---|---|---|---|---|---|---|
| JAN | 35.7 | −0.07 | 0.06 | JUL | 4.6 | 0 | 0 | DJF | 93.8 | −0.17 | 0.07 |
| FEB | 31 | −0.27 | 0.01 | AUG | 3.3 | 0.01 | 0.03 | MAM | 75.8 | −0.3 | 0.21 |
| MAR | 36.3 | −0.22 | 0.26 | SEP | 4.2 | 0.01 | 0.1 | JJA | 12.2 | 0 | 0 |
| APR | 26.6 | −0.07 | 0.04 | OCT | 10.1 | 0.03 | 0.03 | SON | 38.3 | 0.1 | 0.05 |
| MAY | 12.9 | −0.01 | 0.01 | NOV | 24 | 0.05 | 0.03 | Annual | 220.1 | −0.37 | 0.13 |
| JUN | 4.3 | 0 | 0 | DEC | 27.2 | −0.0.5 | 0.02 |
Disclaimer/Publisher’s Note: The statements, opinions and data contained in all publications are solely those of the individual author(s) and contributor(s) and not of MDPI and/or the editor(s). MDPI and/or the editor(s) disclaim responsibility for any injury to people or property resulting from any ideas, methods, instructions or products referred to in the content. |
© 2025 by the authors. Licensee MDPI, Basel, Switzerland. This article is an open access article distributed under the terms and conditions of the Creative Commons Attribution (CC BY) license (https://creativecommons.org/licenses/by/4.0/).
Share and Cite
Abadi, A.R.S.; Hamzeh, N.H.; Kaskaoutis, D.G.; Opp, C.; Kazemi, A.F. Long-Term Spatio-Temporal Analysis, Distribution, and Trends of Dust Events over Iran. Atmosphere 2025, 16, 334. https://doi.org/10.3390/atmos16030334
Abadi ARS, Hamzeh NH, Kaskaoutis DG, Opp C, Kazemi AF. Long-Term Spatio-Temporal Analysis, Distribution, and Trends of Dust Events over Iran. Atmosphere. 2025; 16(3):334. https://doi.org/10.3390/atmos16030334
Chicago/Turabian StyleAbadi, Abbas Ranjbar Saadat, Nasim Hossein Hamzeh, Dimitris G. Kaskaoutis, Christian Opp, and Amin Fazl Kazemi. 2025. "Long-Term Spatio-Temporal Analysis, Distribution, and Trends of Dust Events over Iran" Atmosphere 16, no. 3: 334. https://doi.org/10.3390/atmos16030334
APA StyleAbadi, A. R. S., Hamzeh, N. H., Kaskaoutis, D. G., Opp, C., & Kazemi, A. F. (2025). Long-Term Spatio-Temporal Analysis, Distribution, and Trends of Dust Events over Iran. Atmosphere, 16(3), 334. https://doi.org/10.3390/atmos16030334