Article

Wavelet Coherence Analysis of PM10 Variability Due to Changes in Meteorological Factors in the Continental Climate

Department of Environmental Engineering, Engineering Faculty, Ardahan University, 75002 Ardahan, Turkey
Atmosphere 2025, 16(3), 331; https://doi.org/10.3390/atmos16030331
Submission received: 12 February 2025 / Revised: 6 March 2025 / Accepted: 13 March 2025 / Published: 15 March 2025
(This article belongs to the Section Air Quality)

Abstract

:
The high-altitude region in northeastern Türkiye is known as the Erzurum–Kars Plateau. The Ardahan, Erzurum, and Kars provinces are its most important settlements, established at an altitude of approximately 1800 m on the plateau. In this region, where the continental climate prevails, the relationships between the PM10 concentration levels recorded between 2010 and 2022 and meteorological variables were investigated. During the study, the average daily PM10 levels for Ardahan, Erzurum, and Kars in the winter seasons were 73.3, 76.7, and 72.2 µg/m3 respectively. In the same period, the daily average temperature (and humidity) was determined as −6.9 °C (75.0%), −7.1 °C (82.9%), and −6.3 °C (75.7%), respectively, and the average wind speed was determined as 0.9 m/s, 2.2 m/s, and 1.7 m/s, respectively. For these provinces, the highest correlation coefficients between PM10 and temperature (and wind speed) in winter were calculated as −0.47 (−0.36), −0.49 (−0.60), and −0.52 (−0.54), respectively, while the correlation coefficients between PM10 and temperature (and humidity) in summer were calculated as 0.32 (−0.32), 0.39 (−0.35), and 0.55 (−0.48), respectively. In the analysis performed using the wavelet coherence approach, it was possible to determine the relationships between PM10 and meteorological parameters not only in annual cycles, but also in seasonal and even monthly cycles.

1. Introduction

Atmospheric particulate matter (PM) consists of particles with aerodynamic diameters ranging from 0.001 to 100 μm. It has been reported that a significant increase in lung and heart disease is observed with high levels of atmospheric concentrations of particulate matter, especially those with a diameter of less than 10 μm (PM10) [1,2]. Since it directly affects the deterioration of human health, national and international organizations set limit values for exposure times to PM10, considering the observed health effects. In EEA (European Environment Agency) regulations, the annual average limit value for PM10 is 40 μg/m3, and the 24 h average PM10 concentration is required not to exceed 50 μg/m3 more than 35 times a year [3]. In the air quality guidelines updated in 2021, the WHO (World Health Organization) recommends the annual average limit value for PM10 as 15 μg/m3, and states that the average daily concentration value of 45 μg/m3 can be exceeded only for 3–4 days a year [4].
Air quality in any location is strongly dependent on factors such as pollutant emissions, meteorology, and topography. Understanding the temporal and spatial variability of pollutant concentrations in the atmosphere is important for air quality management and health risk assessment [5]. In addition to basic statistical approaches such as correlation [6,7,8] and regression models [9,10], many modeling tools such as machine learning [11,12], artificial neural networks (ANNs) [13,14], or wavelet analysis [15,16,17] have been used to determine the temporal and/or spatial effects of meteorological factors on PM concentrations.
In particular, well-known statistical tools such as regression analysis, Spearman’s rank correlation, and Pearson correlation have been widely used to identify these effects. Multiple linear regression, Pearson, Spearman’s rank, and Kendall’s Tau correlation analyses were used in a study investigating the relationship between the PM10 and meteorological parameters in Istanbul in the period covering the years 2011–2018 [6]. The study reported a negative relationship between the PM10 levels and temperature and wind speed, while the opposite trend was found with wind direction and relative humidity. Another study conducted in Thailand examined the relationship between the PM10 levels in the atmosphere and other pollutant parameters and meteorological factors, and reported a negative correlation with temperature and relative humidity [18]. Maltare et al. [8] investigated the linear and nonlinear relationships between meteorological factors such as temperature, dew point, relative humidity, precipitation, cloud cover, and pressure and PM2.5, PM10, and other gaseous pollutants in Kolkata. They stated that meteorological variables significantly affect air quality and that these effects create correlations that vary seasonally. In a study conducted in China [19], the relationships between pollutants such as PM2.5, PM10, TSP, CO, NO2, O3, and SO2 and temperature, relative humidity, and wind speed were investigated in 16 urban areas in Xiangyang city. It was found that relative humidity and wind speed had strong negative correlations with PM2.5 and PM10, while temperature had a positive correlation with O3.
In recent years, the wavelet coherence approach, which is used to analyze the correlation between two signals [16], has been applied along with traditional statistical analysis methods to analyze the relationships between time series in air pollution studies. In this methodology, Morlet wavelet transform analysis is applied to estimate the spectral properties of time series data, show the fluctuations of periodic components as a function of time, and explore the relationships between two time series. For example, in a study where WTC was used to examine the relationships between the Air Pollution Index (API) and meteorological factors for the period covering 2001–2011 for Guangzhou, China [15], it was found that API was negatively correlated with temperature, relative humidity, precipitation, and wind speed, and positively correlated with atmospheric pressure. In their study investigating the correlation of PM2.5 levels with meteorological variables in major South Asian cities such as Dhaka, Jakarta, Lahore, Karachi, Islamabad, Delhi, Mumbai, Kolkata, and Kathmandu, Fattah et al. [17] applied linear regression, Pearson, Spearman’s rank correlation analyses, and wavelet coherence analysis to time series. They found that PM2.5 concentrations in most cities showed negative correlations with humidity, temperature, precipitation, and wind speed. Also, according to wavelet coherence analysis, pollution and meteorological factors were in a consistent frequency relationship over time. A study conducted by Liu et al. [20] using wavelet analysis for the Beijing–Tianjin–Hebei region of China indicates that PM2.5 concentrations are most affected by dew point temperature, meridional wind, and atmospheric temperature, and that the positive correlation between dew point temperature and PM2.5 concentrations is especially prominent. Another study investigating the relationship between the Air Quality Index and rainfall and air temperature using wavelet coherence analysis reported that the index showed a negative correlation with these meteorological factors, but that there were positive correlations between it and temperature in some periods, which could be considered abnormal [21].
There are very few studies investigating the effects of meteorological parameters on pollutant behavior in regions where the urban and pollution profiles are quite different from in megacities. In the literature, a study conducted on Ardahan investigated the relationships between PM10 concentrations and meteorological parameters between 2010 and 2020 [22]. The study states that meteorological variables have a clear effect on pollutant concentrations. Another study conducted on Erzurum in 2009 emphasized that they play an important role in the distribution, transformation, and removal of air pollutants from the atmosphere [23]. This study provides a comprehensive seasonal and annual analysis by uniquely investigating the wavelet coherence of PM10 variability over a 13-year period in three high-altitude cities in northeastern Türkiye, where the continental climate prevails. Northeastern Anatolia presents a plateau morphology in the mountainous areas of the Eastern Anatolia Region of Türkiye, with an average altitude of 2000 m above sea level [24]. This volcanic plateau is called the Erzurum–Kars Plateau and has a unique geography, with the Palandöken, Mescit, and Kargapazarı mountains exceeding 3200 m [25]. In the region far from the sea, the majority of precipitation occurs in late spring. Precipitation is minimal in the winter season, with frost events starting in September and continuing until June.
The relationships between daily average PM10 concentrations and temperature (°C), relative humidity (%), air pressure (hPa), wind speed (m/s) and direction (°) are investigated using Spearman’s rank correlation and WTC. To determine the impact of climatic factors, analyses were conducted annually, seasonally or monthly. Uncovering the complex relationships between air pollution from heating emissions and climate conditions in this high-altitude geography could also lead to more effective air quality management and better protection of human health in other similar geographies.

2. Materials and Methods
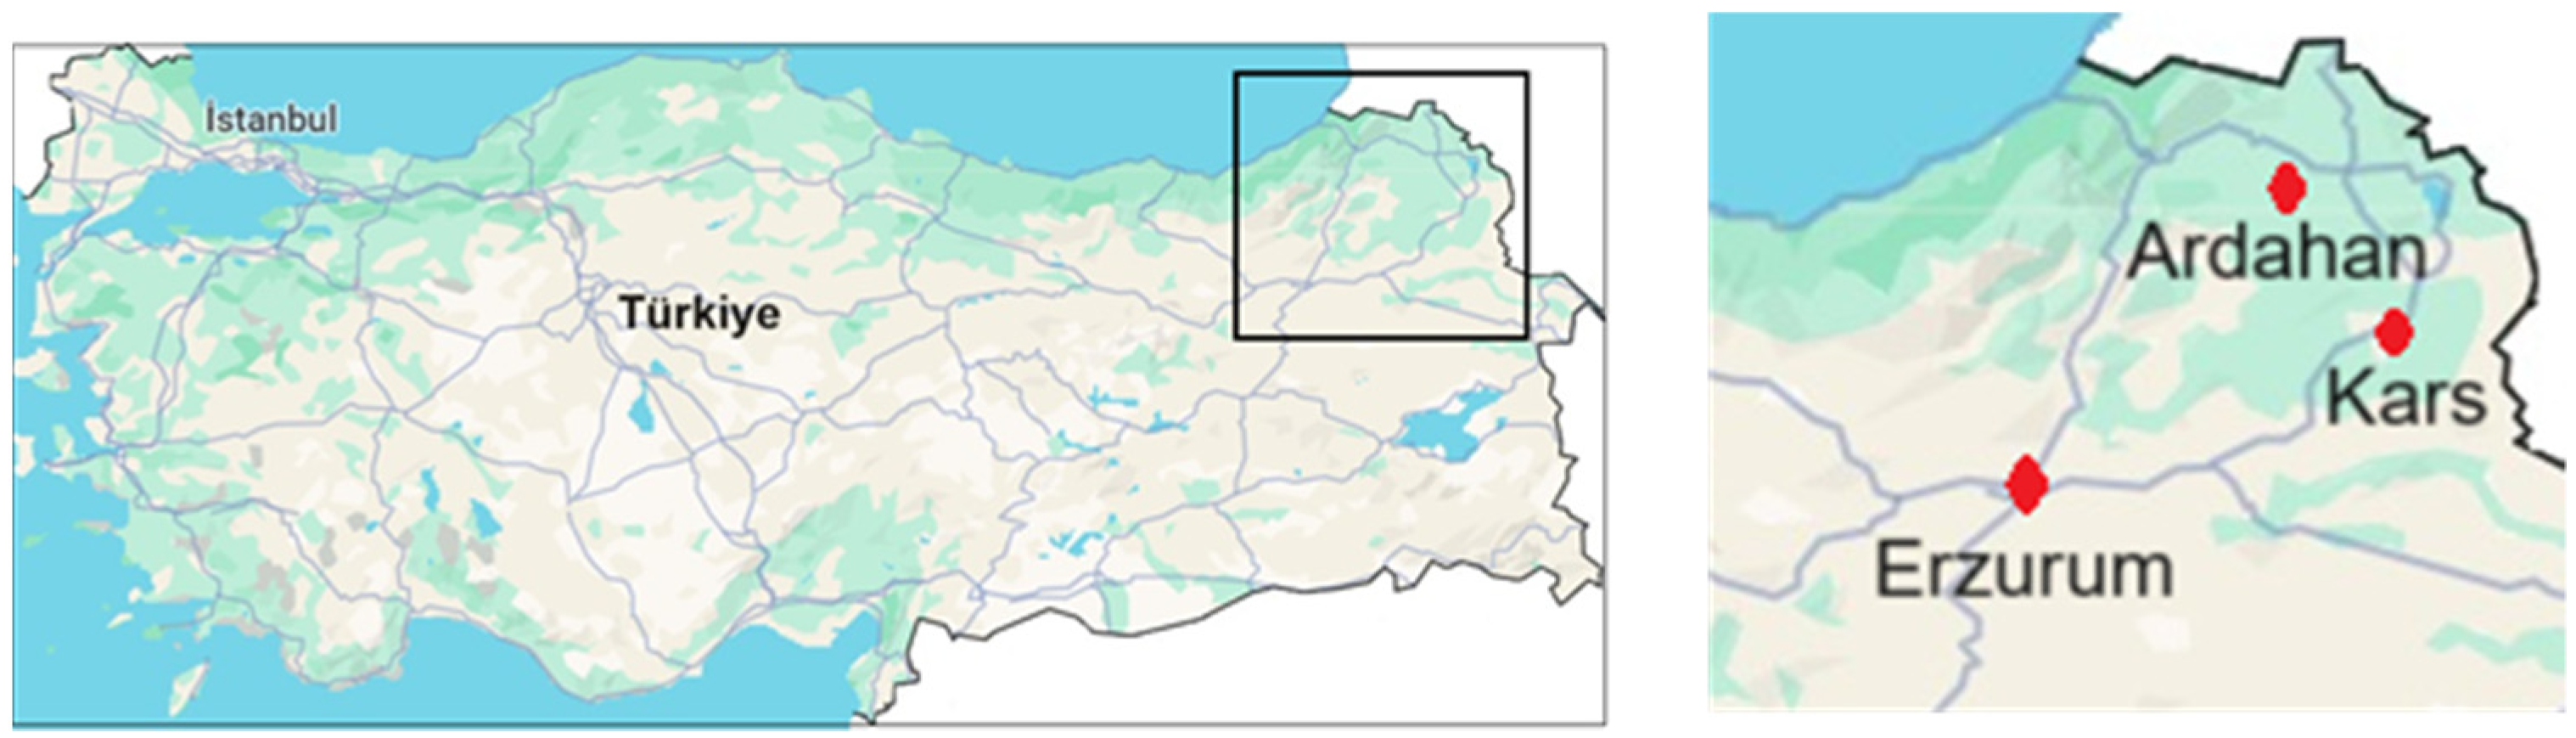
2.1. Study Area

The region in northeastern Türkiye where a continental climate prevails was determined as the study area. The cities of Ardahan, Erzurum, and Kars, located in the region called the Erzurum–Kars Plateau, are also the cities with the highest altitude in Türkiye. A semi-humid, cold, microthermal, continental climate prevails in most of the plateau [26], and the Dfb climate type is dominant according to Köppen–Geiger climate classification [27]. According to long-term statistics, the highest precipitation in Ardahan is seen in June (as 93.8 mm), and the annual total precipitation is 555.8 mm on average. The highest precipitation in the Erzurum and Kars provinces is observed in May (as 72.9 and 82.6 mm), and the annual total precipitation is 431.5 and 506.3 mm, respectively. According to the same statistics, the annual average temperature calculated for Ardahan, Erzurum, and Kars is 3.7, 5.8, and 4.8 °C, respectively [28]. The locations of these cities are presented in Figure 1, and their location information is also provided in Table 1.
The total resident population in these cold settlements of Türkiye is approximately 1.2 million [29]. In the socio-economic development index ranking of Türkiye’s 81 provinces, the Ardahan, Erzurum, and Kars provinces are ranked 67th, 61st, and 69th, respectively [30], and the contribution of these 3 provinces to Türkiye’s total industry is approximately 0.51% [31]. Despite the low development rate in industry in these regions, emissions caused by heating, especially during the long and hard winter season, cause serious air pollution in the region. Emissions from burning fuel (natural gas and solid fuels such as wood and coal) for heating purposes in buildings continue for approximately 8 months (during September–April) in urban areas.

2.2. Data

Hourly PM10 concentrations and some meteorological factors recorded in Ardahan, Erzurum, and Kars’ provincial centers between 1 January 2010 and 31 December 2022 were used as the data set.
Hourly average PM10 concentration (µg/m3) values were obtained from real-time monitoring data published by the National Air Quality and Monitoring Network (NAQMN) [32]. In this study, temperature (°C), relative humidity (%), air pressure (hPa), wind speed (m/s), and direction (°) were selected as the basic meteorological factors whose effects on PM10 concentrations were examined. Hourly average values of meteorological factors covering the same period were obtained from the Turkish State Meteorological Service (TSMS) [33].
The hourly average values were converted to daily average values and the analyses were conducted. The data set should contain 113,952 h (i.e., 4748 days) of data points for each station in the study period between 1 January 2010 and 31 December 2022. In such studies, while preparing the data sets, missing data can be completed using approaches such as interpolation [34], or missing data points can be cleaned [35,36]. In this study, all values in the data point for missing data were removed from the data set and then the data set was converted to average daily values. Since the missing data sets in the hourly data sets were not weekly (or larger), i.e., they were scattered throughout the data set and were not systematic (i.e., they were not limited to any month or season), they were not at a level that would affect the overall picture of a long period of 13 years (113,952 h). Thus, the number (percentage) of data points provided for the Ardahan, Erzurum, and Kars stations was 4330 (91%), 4377 (92%), and 4155 (88%), respectively. Data sets were organized monthly, seasonally, and annually and prepared for conducting analyses.

2.3. Models

The effect of meteorological factors on the average daily PM10 concentration values monitored in three stations over a 13-year period was analyzed using Spearman’s rank correlation and WTC methods on annual and seasonal scales. The non-parametric Spearman’s rank correlation and the WTC method were chosen because the former is a traditional statistical tool that can effectively handle data in the analysis of non-normally distributed data sets, similar to those in this study, and is also widely used, and the latter is a relatively new method that has been effectively used in air pollution studies in recent years. This approach enabled producing comparative results both periodically and methodologically.
First, basic statistics such as the mean, min, max, standard deviation, and normalization were determined for the data sets, which were organized as annual and seasonal daily average values, and then analyses were carried out using the methods detailed below.

2.3.1. Spearman’s Rank Correlation

Spearman’s rank correlation is a non-parametric form of the product–moment correlation. This method determines how well a monotonic function can describe the linear relationship between the ranks of the X variable and those of the Y variable. The coefficient of Spearman’s rank correlation is denoted by rs and expressed as follows [37]:
r s = 1 6 i = 1 k r x i r y i 2 k k 2 1
where k refers to the number of events and rxi and ryi are ranks assigned to an X, and Y pair, respectively.
1.0 r s 1.0
  • If rs is close to +1.0, there is close positive agreement between the ranks of the X variable and those of the Y variable.
  • If rs is close to −1.0, one of the variables tends to rank high, while the other tends to rank low.
  • If rs is near zero, the ranks of the X and Y variables are nearly independent.
The non-parametric Spearman’s rank correlation test was conducted on non-normally distributed data sets to test the correlation relationship between the meteorological parameters and the PM10 concentrations. The Origin 2022 program was used for Spearman’s rank correlation analysis, normalization tests of the data set, and the creation of the graphs.

2.3.2. Wavelet Coherence Analysis

Wavelet analysis, which means the calculation of wavelet transform coherence (WTC) [38], is widely used in many fields, such as climatology [39], oceanography [40], environment [16,17,41], and geophysics [42]. Wavelet coherence examines whether two time series show co-oscillations, that is, whether their relationships are consistent in terms of time and frequency, and it can also reveal inconsistent correlations between the series. High coherence between the times and frequencies of two series indicates the ability of one time series to predict the other, and vice versa. In this study, WTC analysis was used to investigate the effect of meteorological parameters such as temperature, relative humidity, air pressure, wind speed, and direction on PM10 concentrations on an annual and seasonal scale.
The modified wavelet coherence coefficient model can be simply expressed using the following equation:
R n 2 s = S ( s 1 W n X Y s ) 2 S s 1 W n X s 2 S ( s 1 W n Y s 2 )
where S is a smoothing operator for performing time–frequency normalization processing and the square of the WTC coefficient, R2, is in the following range:
0 R n 2 ( s ) 1
If the coefficient equals 1, there is a perfect linear relationship between the X(t) and Y(t), if it equals 0, the two series are independent. The Morlet wavelet, which is also suitable for sinusoidal signals, is widely used in climate research [15].
ψ 0 η = π 1 / 4 e i ω 0 η e η 2 / 2
where ω0 and η denote the dimensionless frequency and time, respectively, and ω0 is taken to be 6 to satisfy the admissible condition [43]. The WTC is expressed in square terms, so it cannot reveal the difference between positive and negative correlations. The phase difference can be used to provide information about the forward and reverse relationships between the variables X(t) and Y(t) and to characterize their phase relationships [44,45]:
ϕ X Y s = t a n 1 I S s 1 W X Y ( s ) R S s 1 W X Y ( s )
where ℑ and ℜ denote an imaginary and real operator, respectively. The definition range of ϕXY is [−π, π] [46]:
If ϕXY ∈ (0, π/2), the series moves in series phase and Y(t) leads to X(t).
If ϕXY ∈ (π/2, π), the series moves out of series phase and X(t) leads to Y(t).
If ϕXY, ∈ (−π/2, 0), the series moves positively in phase and X(t) leads to Y(t).
If ϕXY, ∈ (−π, -π/2), the series goes negatively out of phase and Y(t) leads to X(t).
A MATLAB 2019b code is used to generate wavelet coherence transform diagrams. In WTC plots, yellow indicates a strong correlation between the PM10 concentration and the meteorological factor, while blue indicates zero or no correlation between these time series. The phase relationship between two time series is shown by arrows in the plots. If the time series examined move together, the phase difference will be zero. For two time series, the right arrow indicates that the series are in phase or positively correlated, while the left arrow indicates that they are out of phase or negatively correlated.

3. Results and Discussion

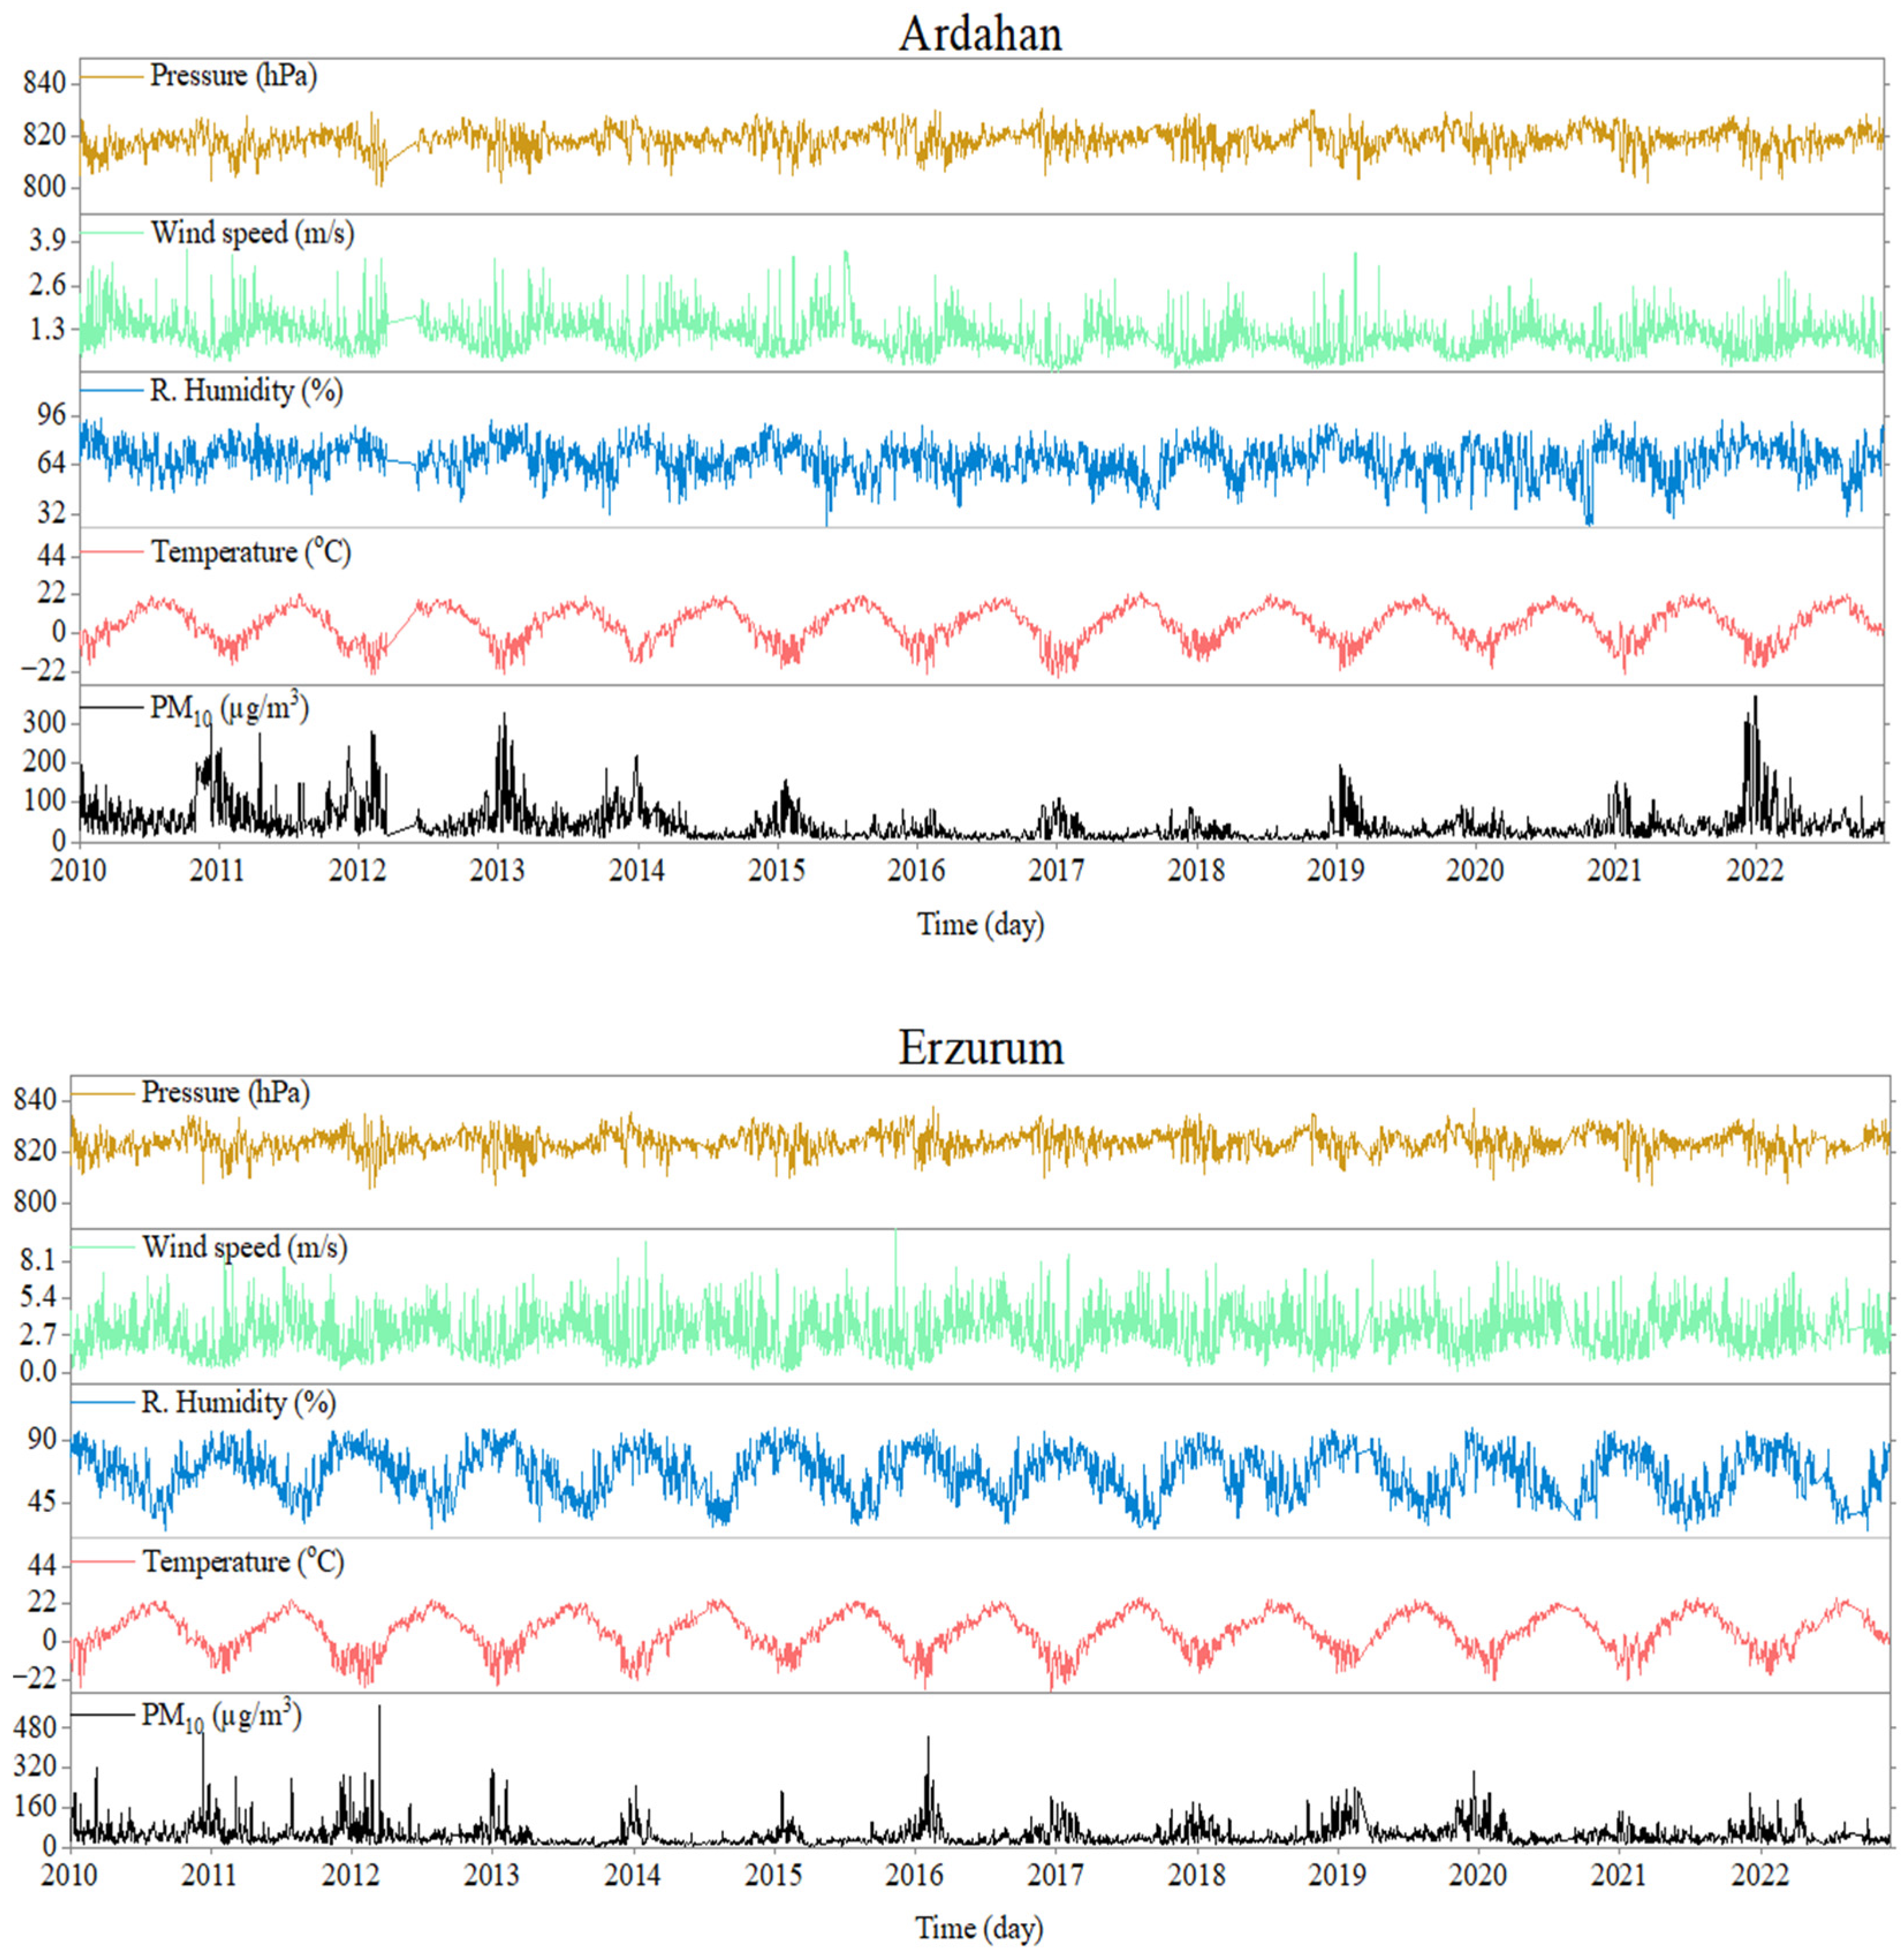
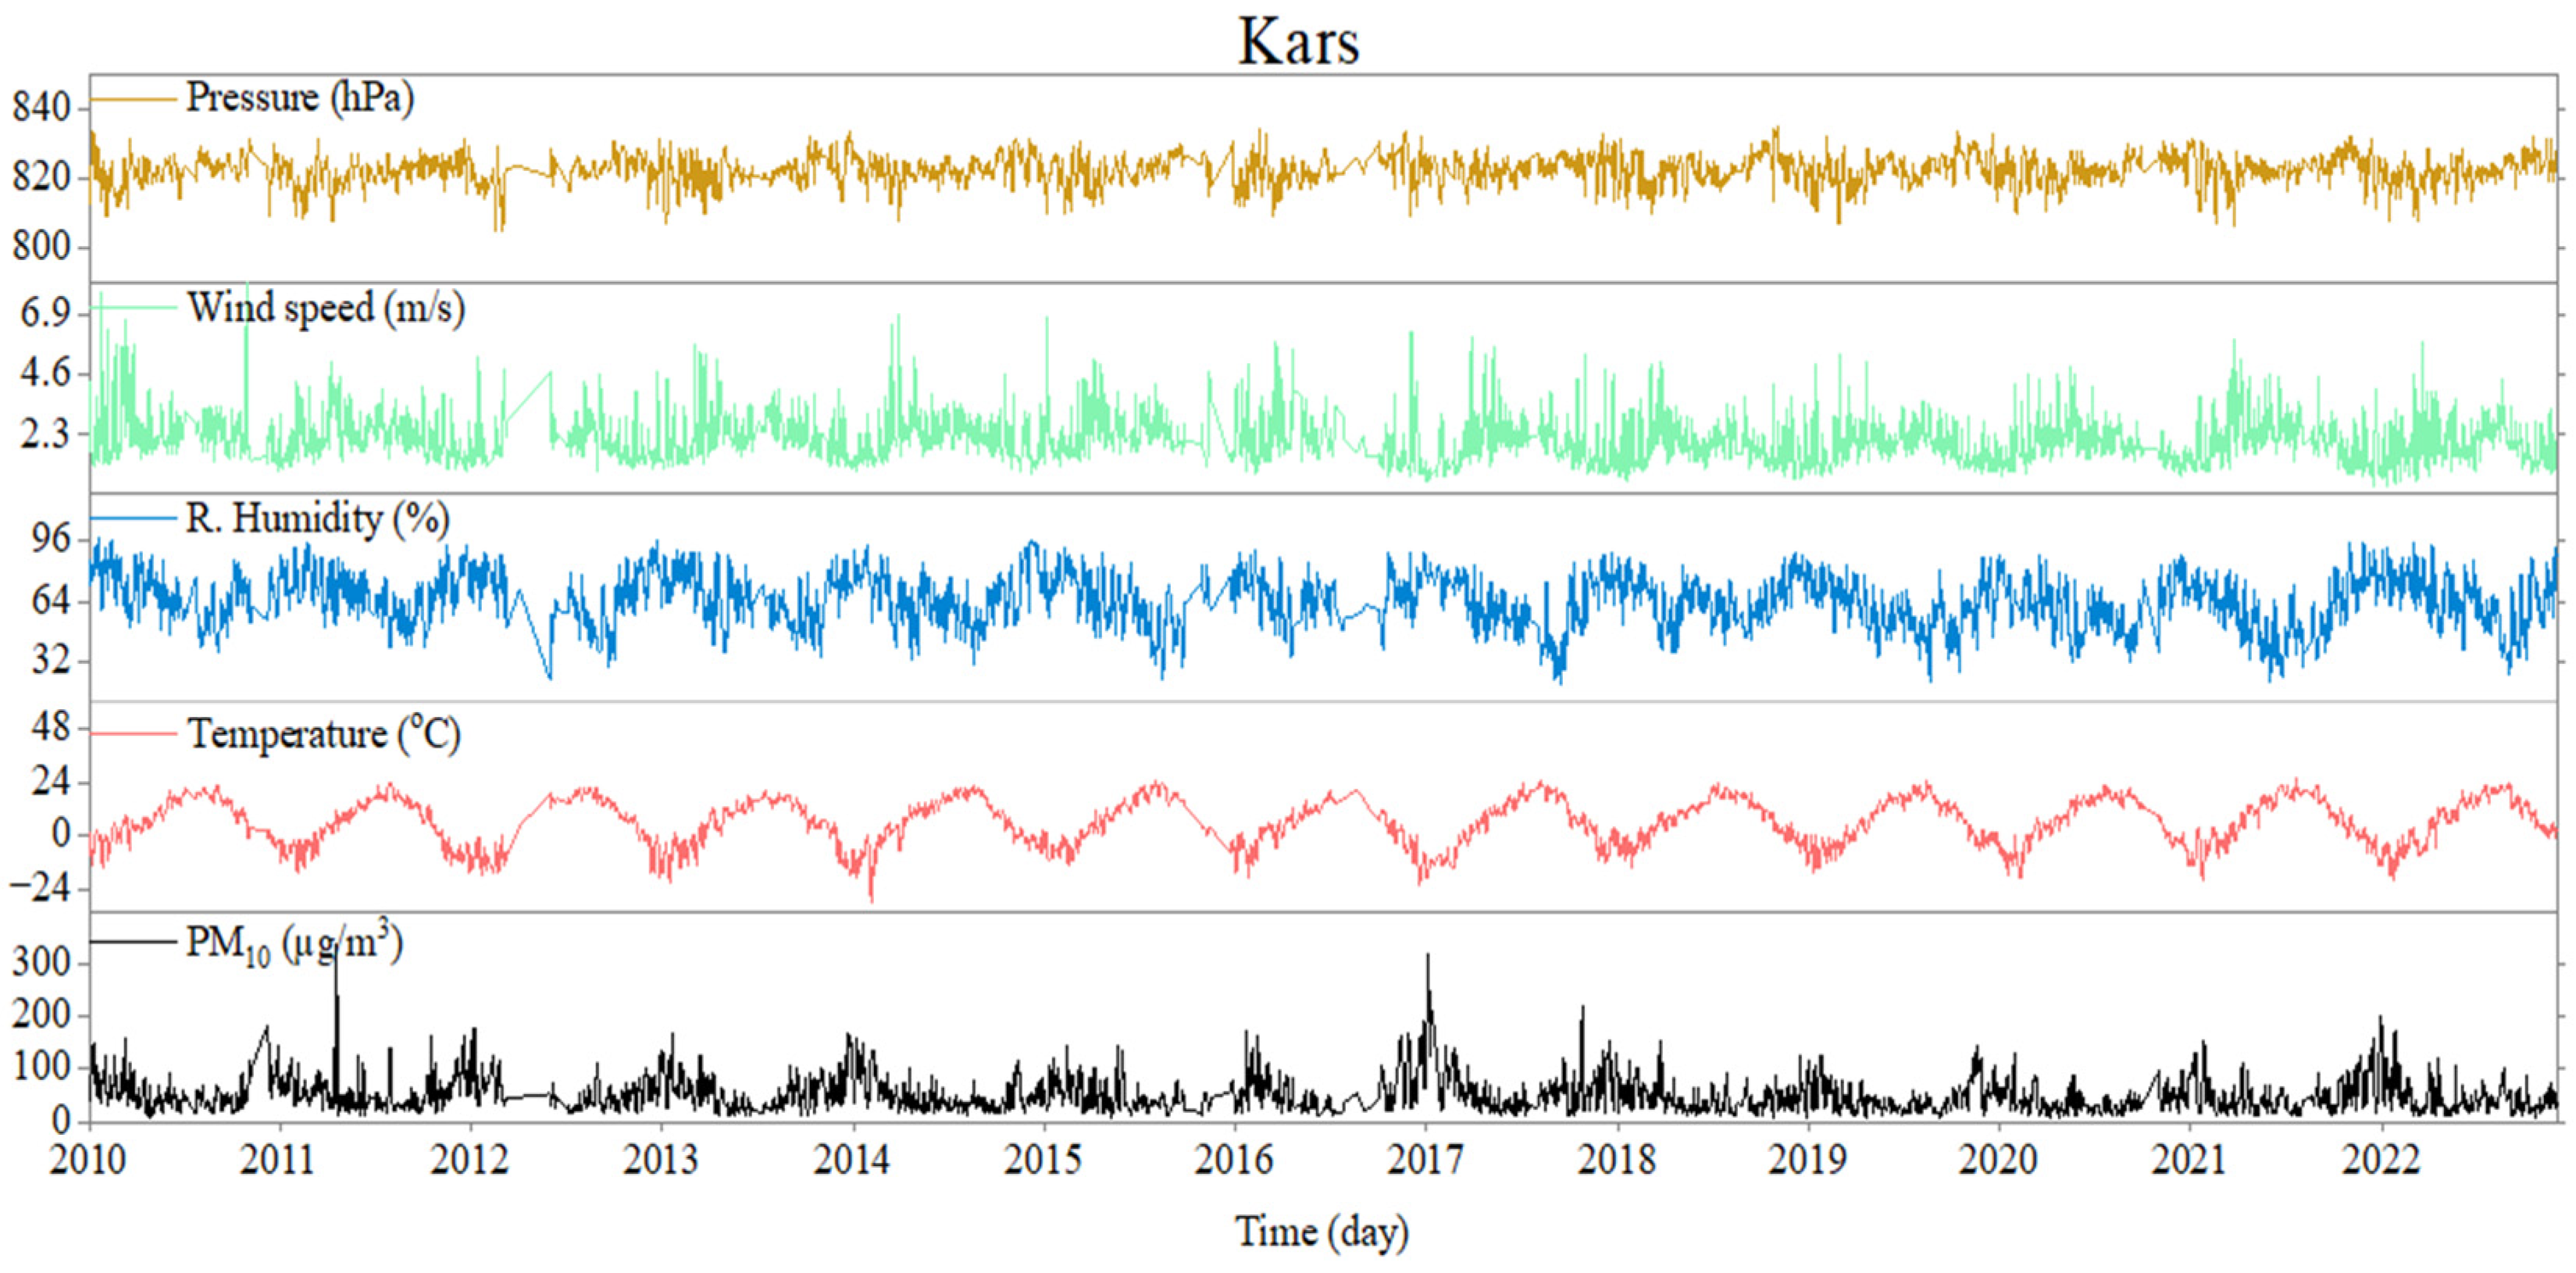
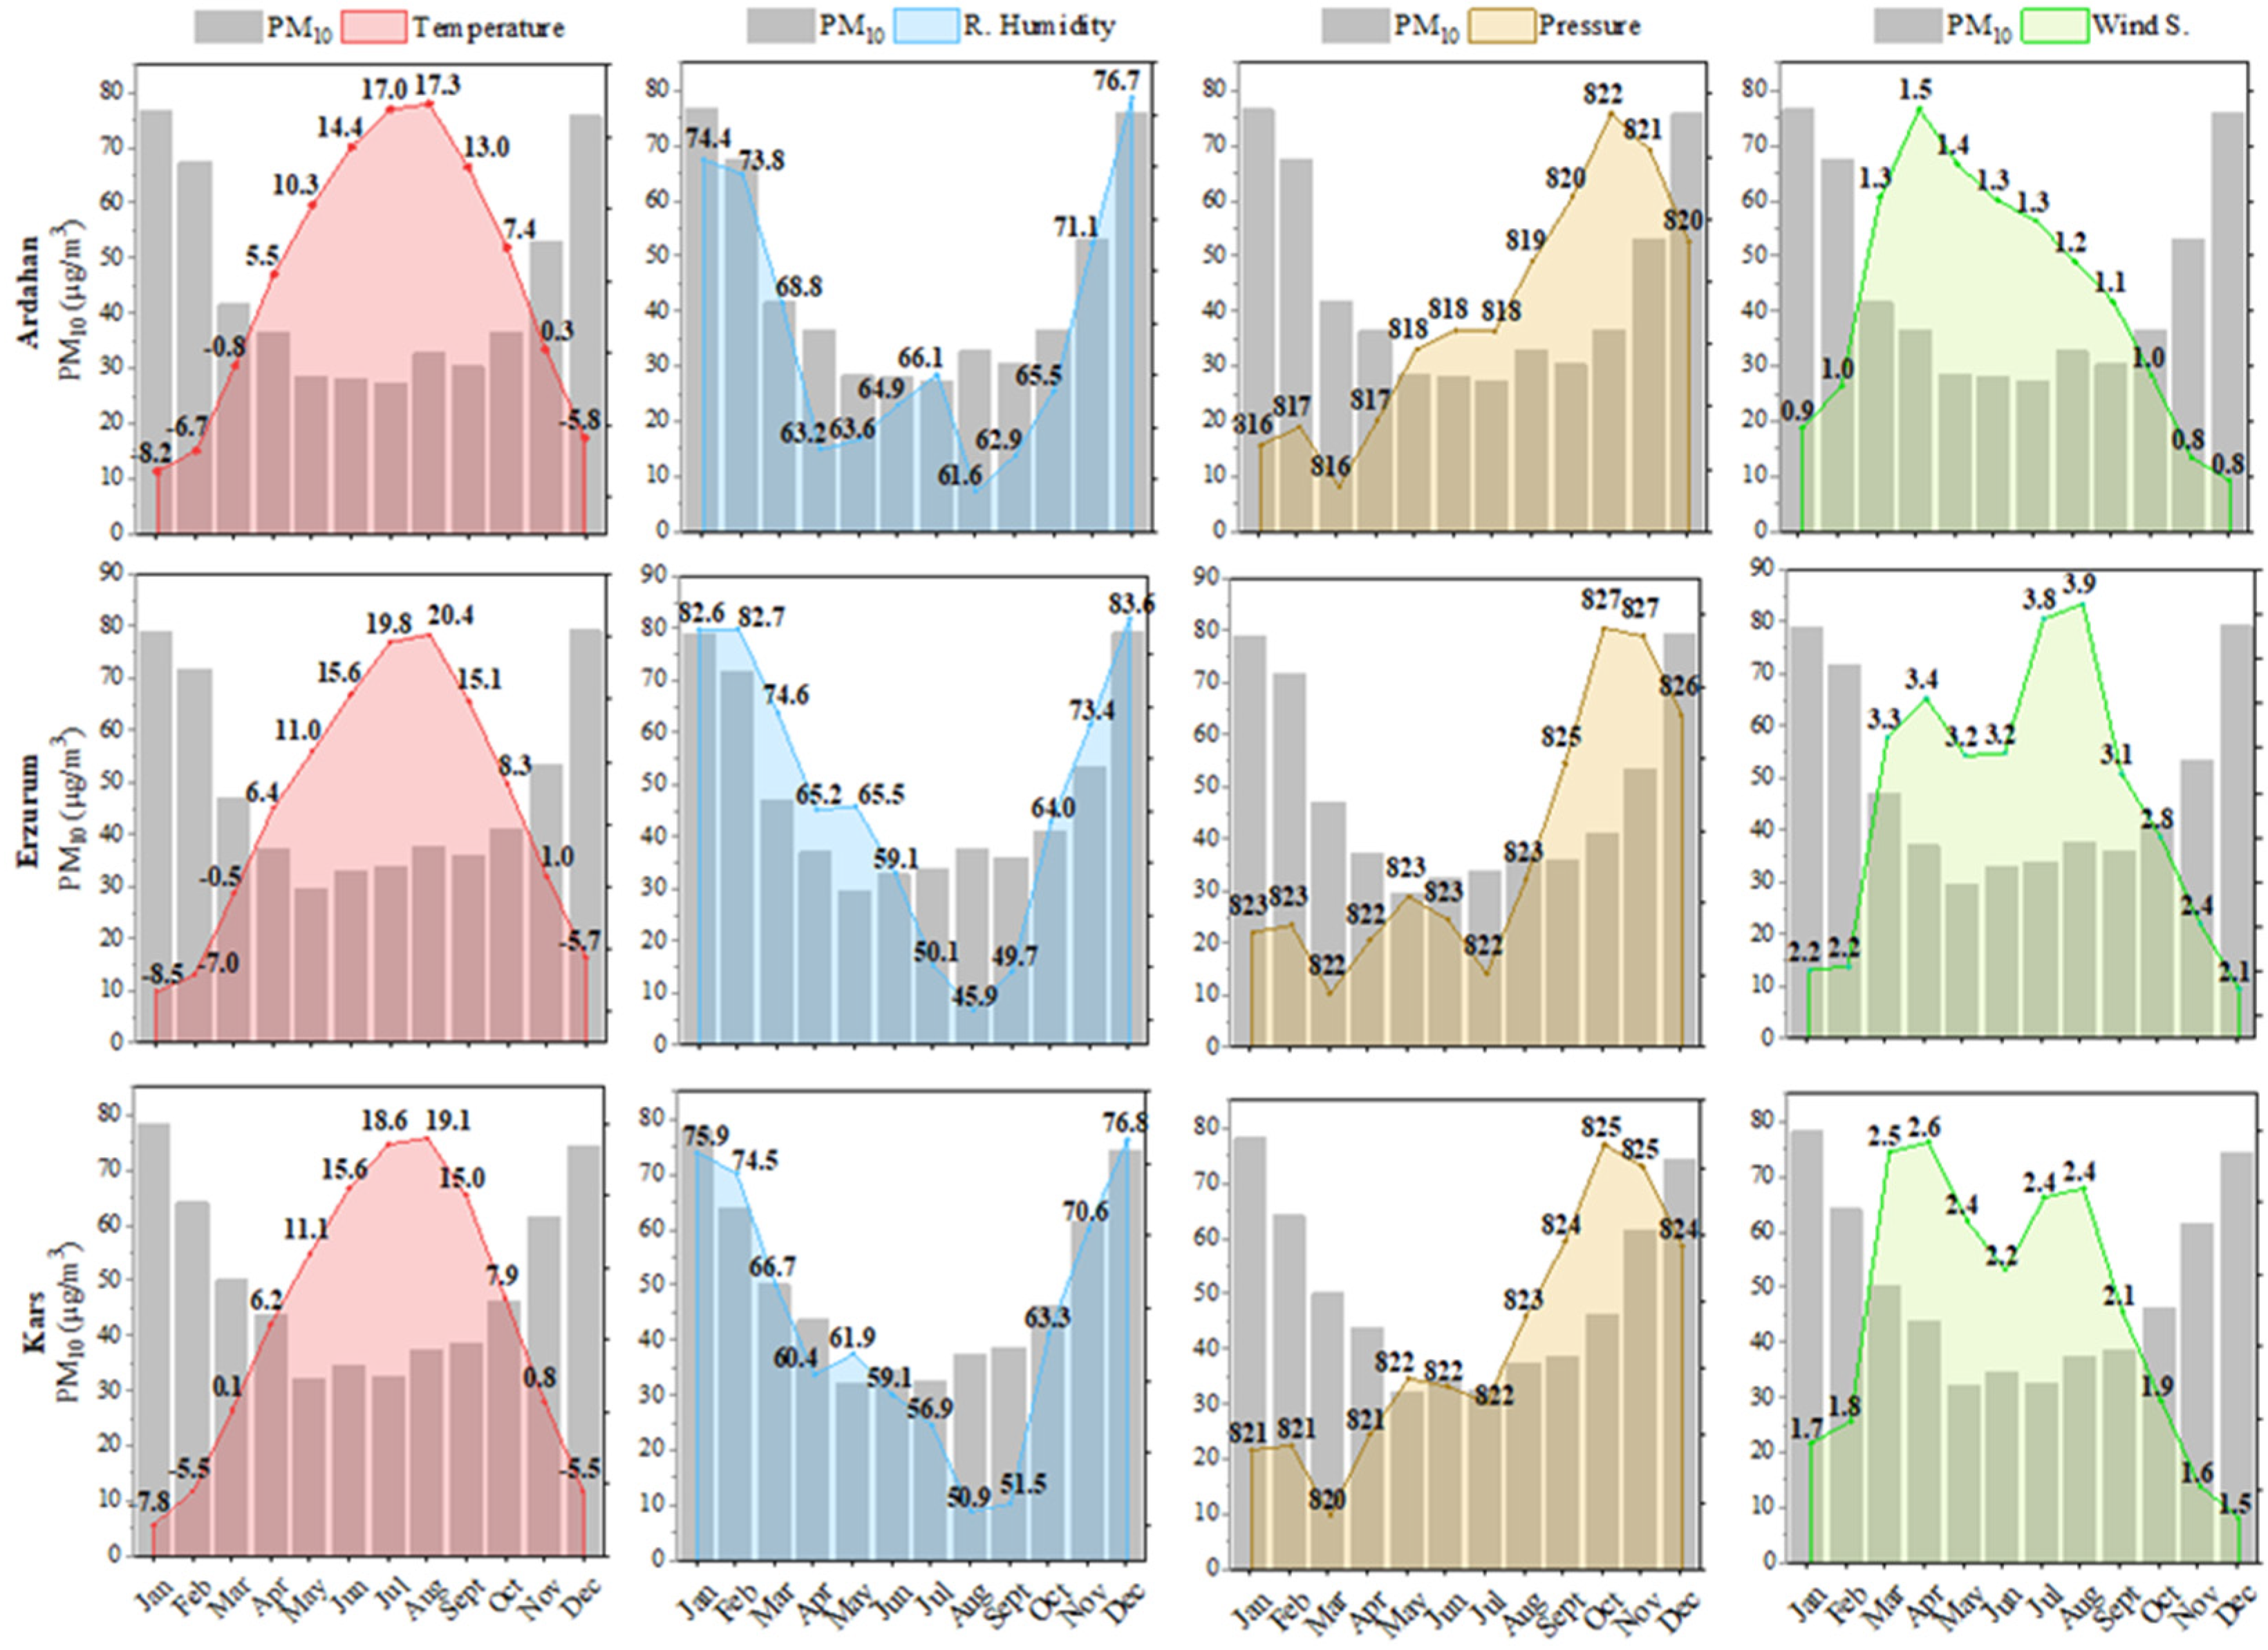
3.1. Comparison Analyses of the Time Series Characteristics

Initially, descriptive statistical analyses were performed for daily averages of the values of PM10 and the meteorological parameters of three monitoring stations over a 13-year period. In analyses conducted annually and seasonally, seasonal classification was made as winter (December, January, and February), spring (March, April, and May), summer (June, July, and August), and autumn (September, October, and November). Seasonal minimum, maximum, and mean values are summarized in Table 2. Descriptive statistics, which also show asymmetry in the data sets, are given separately for each station in Tables S1–S3 in the Supplementary File.
During the examined period, the mean temperature (and PM10) values at the Ardahan, Erzurum, and Kars observation stations were 5.4 °C (44.4 µg/m3), 6.2 °C (48.4 µg/m3), and 6.0 °C (49.8 µg/m3), respectively. In the same period, the mean relative humidity for Ardahan, Erzurum, and Kars was calculated as 67.7%, 66.6%, and 64.2%, respectively, while the mean wind speed was 1.12 m/s, 2.96 m/s, and 2.10 m/s. The mean atmospheric pressure was observed to be between 816.8 and 826.2 hPa at these three stations. The lowest mean pressure value was determined for the station in Ardahan in the autumn season, with 816.8 hPa, and the highest mean value was determined for the station in Erzurum in the same season, with 826.2 hPa.
In winter, the mean PM10 concentrations were at their highest value in all three stations, while the temperature and wind speed had the lowest mean values and relative humidity had the highest mean value. According to these values highlighted in Table 2, the statistics showed an opposite trend for the summer season, except for the mean wind speed values for the Ardahan and Kars stations. While the two highest mean wind speeds in the two provinces were observed in spring as 1.38 m/s and 2.49 m/s, respectively, they reached the second highest mean values in summer as 1.25 m/s and 2.36 m/s, respectively. In parallel with these statistics, the maximum average PM10 concentrations (and relative humidity values) for Ardahan, Erzurum, and Kars were recorded as 371.2 µg/m3 (95.0%), 465.6 µg/m3 (98.5%), and 321.1 µg/m3 (97.7%), respectively, in the winter season. The minimum average temperature (and wind speed) values were recorded as −25.1 °C (0.0 m/s), −28.8 °C (0.0 m/s), and −29.9 °C (0.3 m/s), respectively, in the same season. The stable weather conditions and sublimation of snow on the plateau, which remains under snow cover for approximately 5 months (from early November to late March), have an effect of increasing atmospheric humidity and decreasing temperature [47], indirectly causing an increase in the need for heating. Under these atmospheric conditions, fossil fuel emissions used for heating cannot find an opportunity for proper dispersion, which can cause increases in PM10.
Temporal variations in the daily average values of PM10 concentration and the meteorological parameters in the period 2010–2022 are given in Figure 2. It can clearly be seen in the plots that the PM10 values peak in the winter months (tick points on the time axis indicate 1 January).
For all three stations, during periods when the PM10 time series curves peak, the temperature–time variations show a decreasing trend and the relative humidity curves show an increasing trend, and vice versa. The temporal variations exhibited by the average wind speed and atmospheric pressure curves are less consistent with the PM10 curves.
According to the classification made by the European Air Quality Index (EAQI) for PM10 concentrations (Table S4 in the Supplementary File), during the entire study period, 29, 32, and 39% of the daily average PM10 concentrations recorded at the stations in Ardahan, Erzurum, and Kars, respectively, are in the “poor”, “very poor”, or “extremely poor” (greater than 50 µg/m3) category. It is observed that the rate of daily average PM10 concentrations exceeding 50 µg/m3 is highest in the winter season in all three stations. In the winter season, 53, 60, and 69% of the daily average PM10 concentrations recorded at the stations in Ardahan, Erzurum, and Kars, respectively, are above the 50 µg/m3 level. This is followed by the autumn and spring seasons, respectively. Summer is the season when the average daily PM10 concentrations are lowest. Approximately 16% of the average daily PM10 levels in summer at all three stations exceed 50 µg/m3.
Atmospheric dispersion is affected by wind direction and speed, or vice versa. At low wind speeds, air pollution of anthropogenic origin can remain undispersed in the atmosphere of urban areas. In some periods, high-speed winds blowing towards urban areas can be carriers of dust and sandstorms. Wind rose diagrams giving the frequency of recording of a particular wind direction and speed have been drawn separately for the annual, winter, spring, summer, and autumn seasons, respectively, as presented in Figure 3.
In Ardahan, low-speed winds were dominant in the NW, N, and NE arc throughout the year. The strongest winds blew in spring and summer, at 2–3 m/s. In spring, the wind direction was NW with a rate of approximately 13% and WNW with a rate of 11%, while these winds were recorded in the NE axis in summer, and in fewer numbers. In autumn and winter, winds blew in the N and NNW directions at 0–2 m/s. Higher-speed and more multi-directional winds were recorded in Erzurum compared to the other two stations. Winds with a speed of 4–5 m/s were observed for 13–25% of the year. These winds were in the east (E) direction at 13 and 15% in the winter and the autumn, respectively. They blew in WSW–ENE directions at less rates. Their frequency increased in spring and summer. The winds blew in the WSW direction at a rate of 17% in the spring, and were directed towards the ENE at a rate of 25% in the summer. The highest-speed winds measured at the Kars station were in the S direction, at a speed of 4–5 m/s in the spring season, a rate of 16%, and in the SSW direction with a lesser percentage, while in the NNE and NE directions in the summer season. In this station, S winds with a speed of 3–4 m/s in the winter season were dominant in the NNE and SSW directions in the autumn season.
Since all three stations considered in this study are located in urban areas located on a wide plateau, the topography facilitates the atmospheric dispersion of the wind. The PM10 values recorded in the summer, independent of the heating need that continues throughout the winter season and including a large part of the autumn and spring seasons, may be a result of dust and sand storms carried by high-speed winds in the summer season [48]. Similarly, the lowest wind speeds in the winter season, when heating needs are highest, may be one of the factors contributing to poor atmospheric dispersion and increased PM10 levels in urban areas. It is thought that inadequate atmospheric dispersion at low wind speeds may cause favorable environments for the mixing and secondary reactions of pollutants, thus increasing PM concentrations [49].
It is also seen in the plot in Figure 4 (green plot) that the monthly average PM10 concentration levels were low in months with high wind speed during the period 2010–2022. A similar relationship is also present in the red and orange plots between the monthly average PM10 concentrations and the temperature and pressure values, respectively, but the opposite is the case for relative humidity (blue plot). According to the monthly average temperature values during the research period (Table S5 in the Supplementary File), January was the coldest month in all three cities, followed by February and December. As seen in Figure 4, in these months, the relative humidity and PM10 concentrations exhibit the highest values, while wind speed has the lowest values. Between 2010 and 2022, the average temperature values (and PM10 levels) in January were −8.2 °C (76.6 µg/m3), −8.5 °C (78.9 µg/m3), and −7.8 °C (78.2 µg/m3) for Ardahan, Erzurum, and Kars, respectively, while the average relative humidity (and wind speed) values in December were 76.7% (0.8 m/s), 83.6% (2.1 m/s), and 76.8% (1.5 m/s), respectively. On the other hand, August is the month with the highest monthly average temperature and lowest relative humidity values. While the monthly average temperature values in August were 17.3 °C, 20.4 °C, and 19.1 °C for Ardahan, Erzurum, and Kars, respectively, the monthly average relative humidity values were 61.6%, 45.9%, and 50.9%, respectively. August was also the month with the highest monthly average wind speeds for Erzurum and Kars, at 3.9 m/s and 2.4 m/s, respectively. In Ardahan, this value was 1.5 m/s in April. The lowest monthly average pressure values were observed in March and April in all three provinces, while the highest values were observed in October and November. One of the most striking results for the three provinces was found in the lowest monthly average PM10 concentrations. The lowest pollutant levels, ranging from 27.3 to 34.4 µg/m3, occurred in May, June, and July, at the mid-levels of all meteorological parameters.

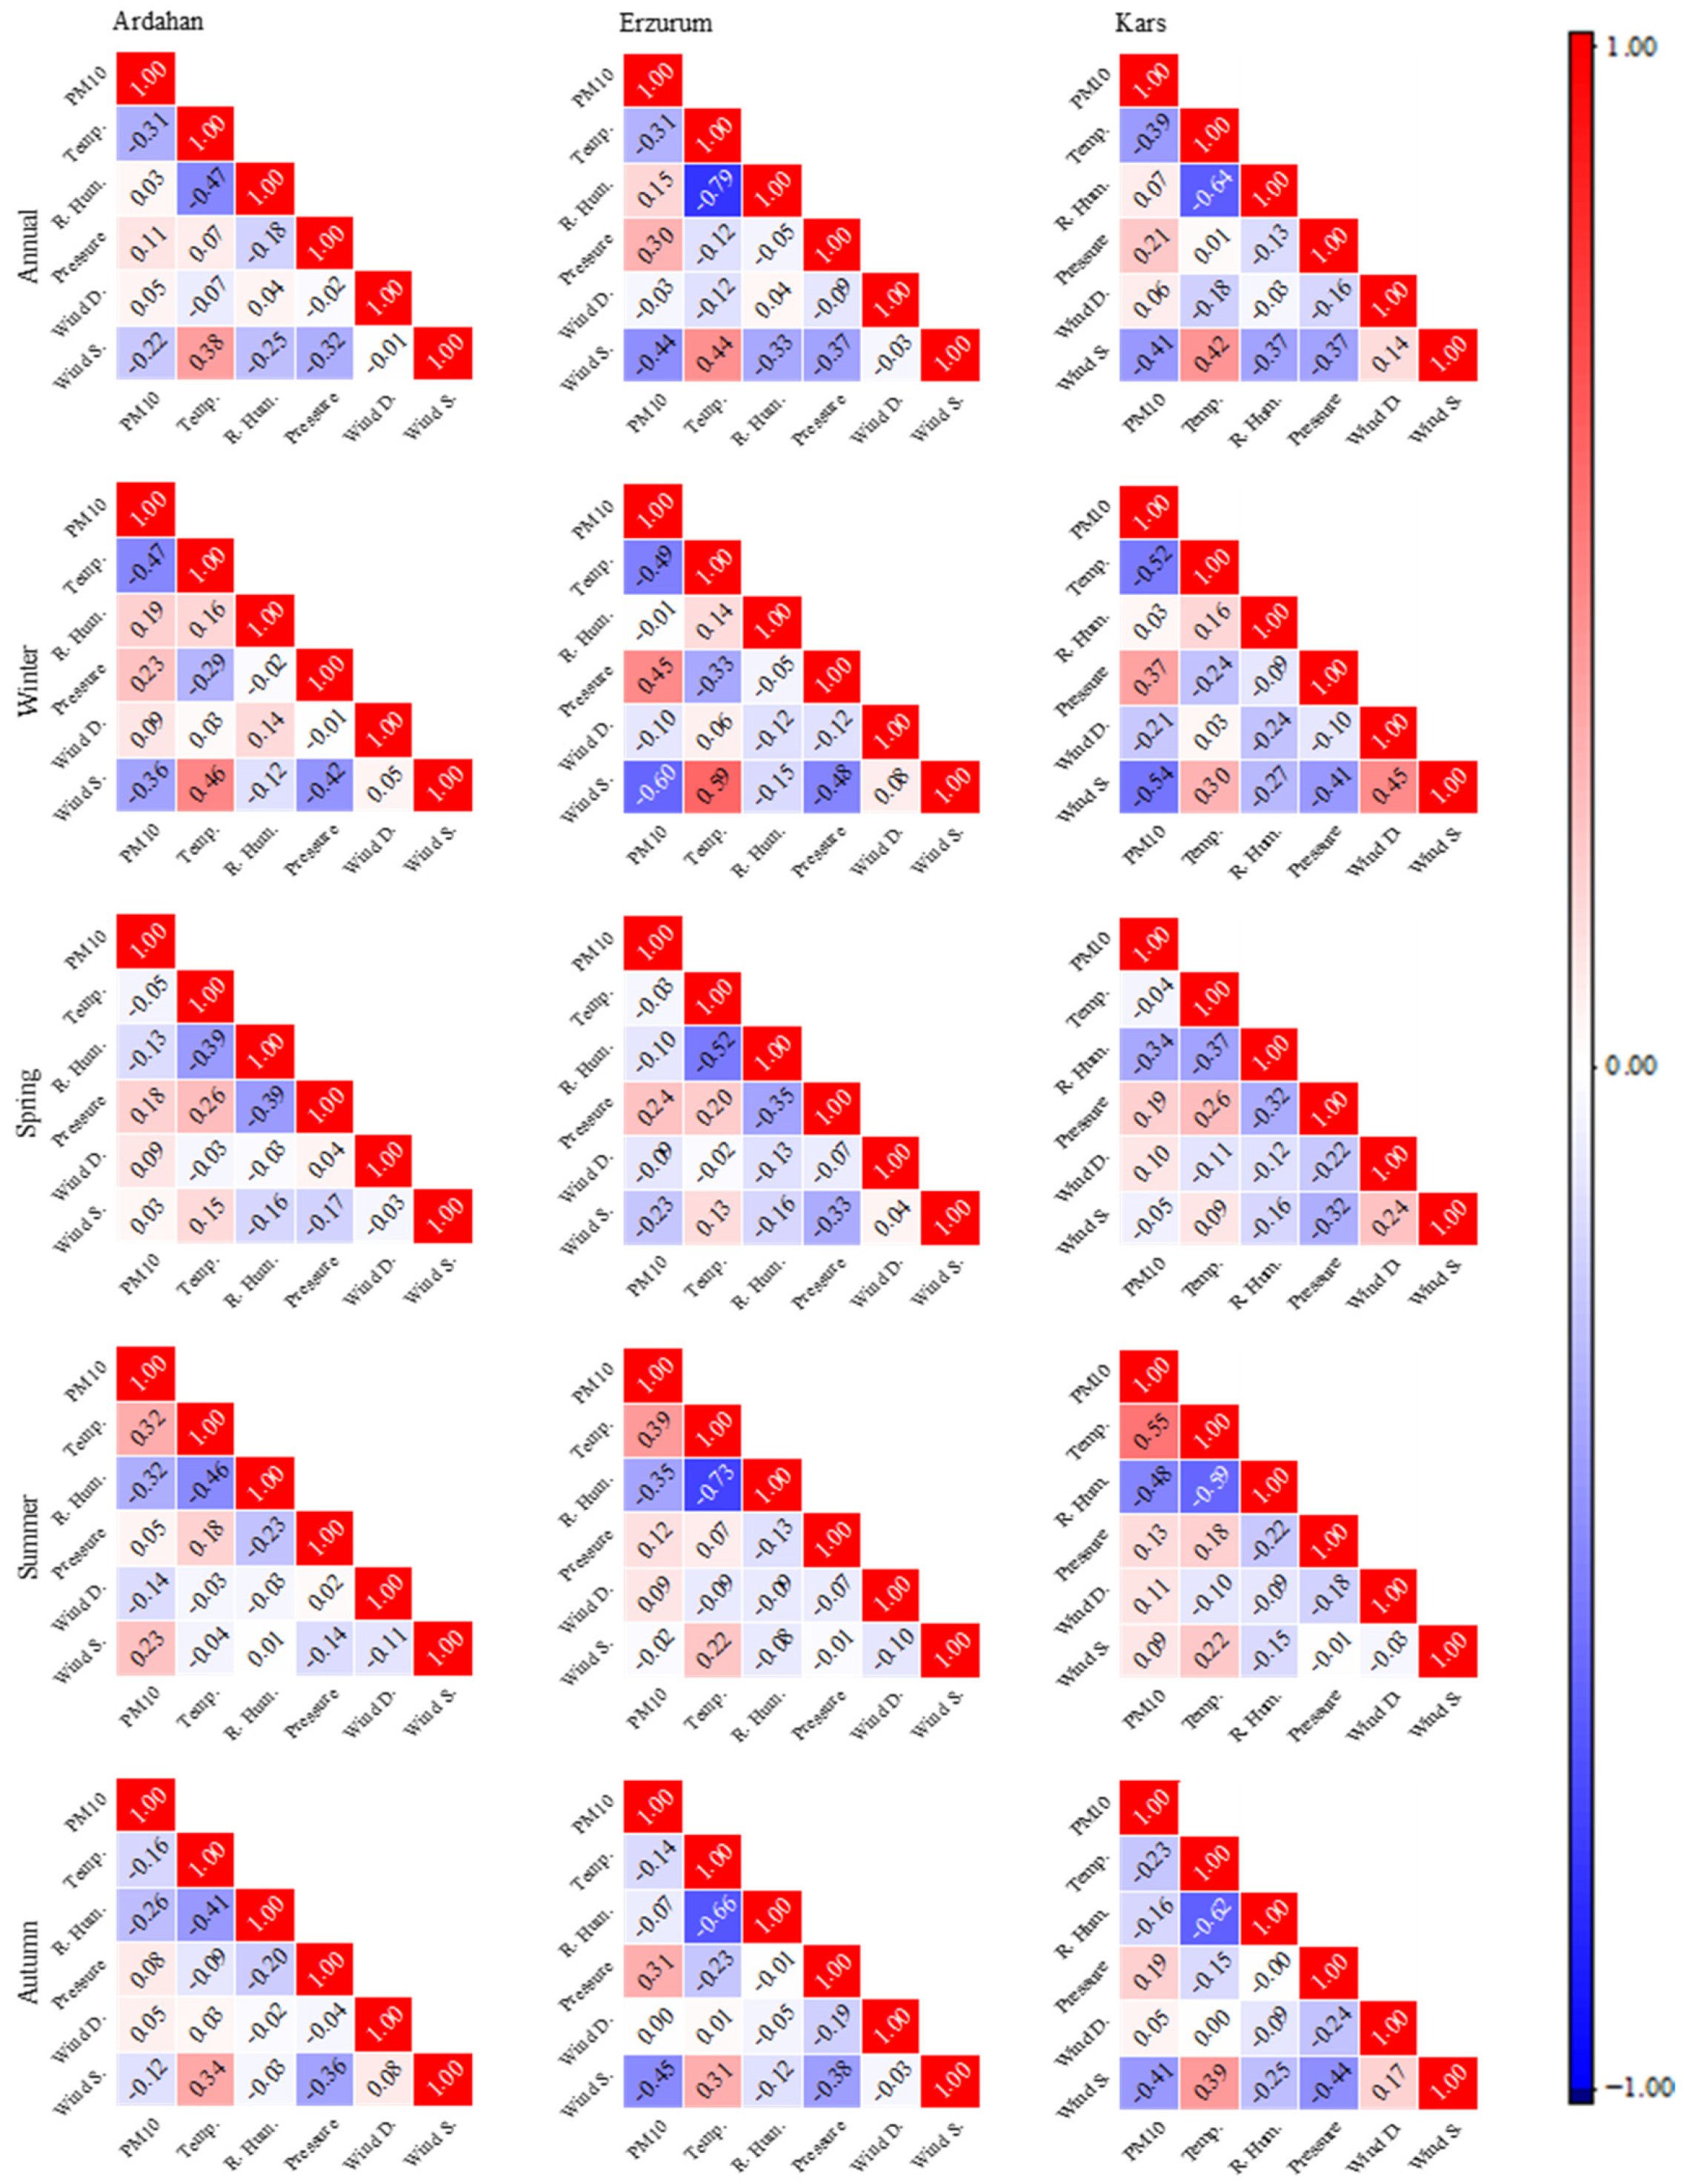
3.2. Spearman’s Rank Correlation Analysis

Correlation analyses are basic statistical approaches that determine the degree of relationship between two variables. In the analysis, it is necessary to know whether the data are normally distributed before choosing the method [37]. Therefore, the following null hypothesis was tested using a normality test:
H0: 
The raw data set is normally distributed”.
According to the α = 0.05 significance level in the normality test statistics (provided in the Supplementary File Tables S1–S3), the data set based on this study does not show a normal distribution, and the null hypothesis should be rejected. The non-parametric Spearman’s rank correlation test is conducted to determine the degree of relationship between two series that do not have a normal distribution [50]. Therefore, in this study, the degree of relationship between the daily average PM10 levels and daily average values of meteorological parameters was measured using Spearman’s rank correlation test. In the correlation analyses, the following null hypotheses were tested separately for all annual and seasonal periods and locations using a two-tailed t-test (α = 0.05):
H1: 
The PM10 levels are not significantly affected by independent variable temperature levels”;
H2: 
The PM10 levels are not significantly affected by independent variable relative humidity levels”;
H3: 
The PM10 levels are not significantly affected by independent variable pressure levels”;
H4: 
The PM10 levels are not significantly affected by independent variable wind direction levels”;
H5: 
The PM10 levels are not significantly affected by independent variable wind speed levels”.
The results of the correlation analyses measuring the degree of relationship between the PM10 levels and meteorological factors are presented in Table 3. Table 3 only lists those correlations that were found to be significant according to the 95% confidence interval obtained from the two-tailed t-test (full results, see also Tables S6–S8 of the Supplementary File), and also highlights “moderate” relationships with correlation coefficients between 0.30 and 0.39, and “strong” relationships with correlation coefficients between 0.40 and 0.69. Other values in the table are relationships in the “weak” or “no or negligible” category. Classifications made according to the effect size of the correlation coefficients [8] are also provided in Table S9 of the Supplementary File. The results of all analyses for three stations on an annual and seasonal basis are also presented as heat map diagrams in Figure 5. In the diagrams showing the distributions between −1 (blue) and 1 (red), the colors become darker as the strength of the correlation increases.
The correlation between the PM10 and temperature values is statistically significant for all periods except spring, and the null H1 hypothesis is accepted for spring, while it is rejected for other periods. As can be seen in Figure 5, through the relatively dark blue boxes in the winter diagrams and the relatively dark red boxes in the summer diagrams, in contrast to the “strong” inverse relationships in winter, there are positive “medium” (Ardahan and Erzurum) or “strong” (Kars) relationships in summer. When all the correlation coefficients are considered, most of the “strong” correlation relationships are between the PM10 concentrations and temperature, and also, the largest positive correlation coefficients occur between these relationships in summer. It can be said that a “strong” correlation of 0.54 was achieved especially for Kars, while a “moderate” correlation of 0.32 and 0.39 was achieved for Ardahan and Erzurum, respectively. The second largest correlation relationships in the same season were between the PM10 levels and relative humidity levels inversely (darker blue small boxes in the first column of the summer diagrams in Figure 5). Similarly to the intensity of the PM10–temperature correlation relation in the summer, the PM10–relative humidity correlations were “strong” for Kars (−0.48) and “moderate” for Ardahan (−0.32) and Erzurum (−0.35). As seen in the monthly mean diagrams in Figure 4 (and Table S5 in the Supplementary File), the PM10 concentrations and temperature show an increasing trend in June, July, and August during the summer season, while relative humidity shows a decreasing trend, which is consistent with the correlation analysis results. According to the calculated coefficients, winter was the season with the strongest correlation relationships for all three provinces. There were “strong” correlations between PM10 and temperature (and wind speed) in Ardahan, with a coefficient of −0.47 (and −0.36), and between PM10 and wind speed (and temperature) in Erzurum and Kars, with coefficients of −0.60 (and −0.49) and −0.54 (and −0.52), respectively.
Essentially, when annual and seasonal correlation relationships were examined separately in all three provinces, the relationships found for the winter seasons were in great agreement with the relationships found on an annual basis. Due to this agreement, which can clearly be seen in Figure 5, it can be said that the strong relationships observed between the PM10 levels and meteorological parameters in the winter season also significantly affect the annual correlation relationships. Similar results have been found in other studies in the literature investigating the correlation between PM10 concentrations and meteorological parameters. For example, in a study investigating the effect of meteorology on PM10 concentrations in Switzerland, it was found that there is a positive correlation between pollution levels and temperature in summer [51]. Apart from the positive “weak” correlation of 0.23 between the PM10 levels and wind speed in Ardahan in the summer, since the correlations of the PM10 levels with wind direction and speed in other locations are “no or negligible”, it can be considered that the effect of wind dust transport to urban areas is not significant. However, high atmospheric humidity may indirectly increase the mass of suspended particulate matter, making it heavier and more likely to settle. Therefore, the decrease in atmospheric humidity with increasing temperatures may indirectly increase PM10 levels.
In two different studies conducted on western Türkiye and Istanbul, it was also stated that PM10 concentrations increased during the heating (winter) seasons [6,52]. It has been reported that negative correlations between the PM10 levels and temperature and wind speed may be due to inadequate atmospheric dispersion at low temperatures and wind speeds [53]. Another study investigating the urban variability of particulate matter levels in Delhi found very similar results to those of this study. Tiwari et al. [54] reported that temperature, relative humidity, and wind speed were negatively correlated with particulate matter concentrations in winter (December–March) and post-monsoon (October–November) periods, while temperature and wind speed were positively correlated, but relative humidity was negatively correlated in pre-monsoon (April–June) and monsoon (July–September) periods.
According to Table 3, similarly to the null H1 hypothesis, the null H5 hypothesis was also rejected for all periods except spring, while the null H2 hypothesis was accepted for Erzurum and Kars in winter. The correlation analyses between wind direction and PM10 concentration can provide information on wind transport into or out of urban areas. Although there were significant relationships in the correlations between pollution levels and wind direction in almost all locations in every period (except autumn), these relationships remained at the “weak” or “no or negligible” level. The fact that pollution concentrations are significantly but weakly or negligibly affected by wind direction may be due to the topography and land use where these locations are located. In these cities, which are established on the wide Erzurum–Kars Plateau and do not have very large settlements, particulate matter can be carried towards/outside urban areas regardless of the direction the wind blows. Since there is no natural topographic formation or dense construction that can block the flow of wind from inside the cities, particulate matter carried by winds blowing from any direction can be transported out of the city without accumulating in the city [55]. In a study conducted on Xiangyang [19], a city in Central China where a subtropical monsoon climate prevails throughout the year, temporal changes in the relationships between particulate matter and meteorological parameters were investigated. According to the results of Spearman’s rank correlation and contrary to the results found in this study, wind speed was reported to have a negative correlation with PM10 concentrations in all seasons, while there were positive correlations between relative humidity and PM10 in autumn. This situation was explained by the decrease in the evaporation effect due to lower temperatures and less sunlight in autumn, and therefore an increase in relative humidity. In addition, there were positive correlations between temperature and PM10 concentrations in winter, and negative correlations in summer. It was stated that the negative correlations were due to wet deposition, due to the combined effects of better distribution, more precipitation, stronger wind, and better vertical air mixing.
In the correlation analyses conducted between PM10 levels and atmospheric pressure, no significant relationship was determined between the series in Ardahan in summer. However, in winter and autumn, except for the “strong” and “moderate” positive correlations calculated for Erzurum and Kars, respectively, the relationships were “weak” or “no or negligible”. In their study investigating the temporal and spatial variations in PM10 concentrations in Istanbul, Unal et al. [48] stated that high pressure values caused an increase in PM10 concentrations, and that this was due to the low wind or calm atmosphere of anticyclonic weather conditions.

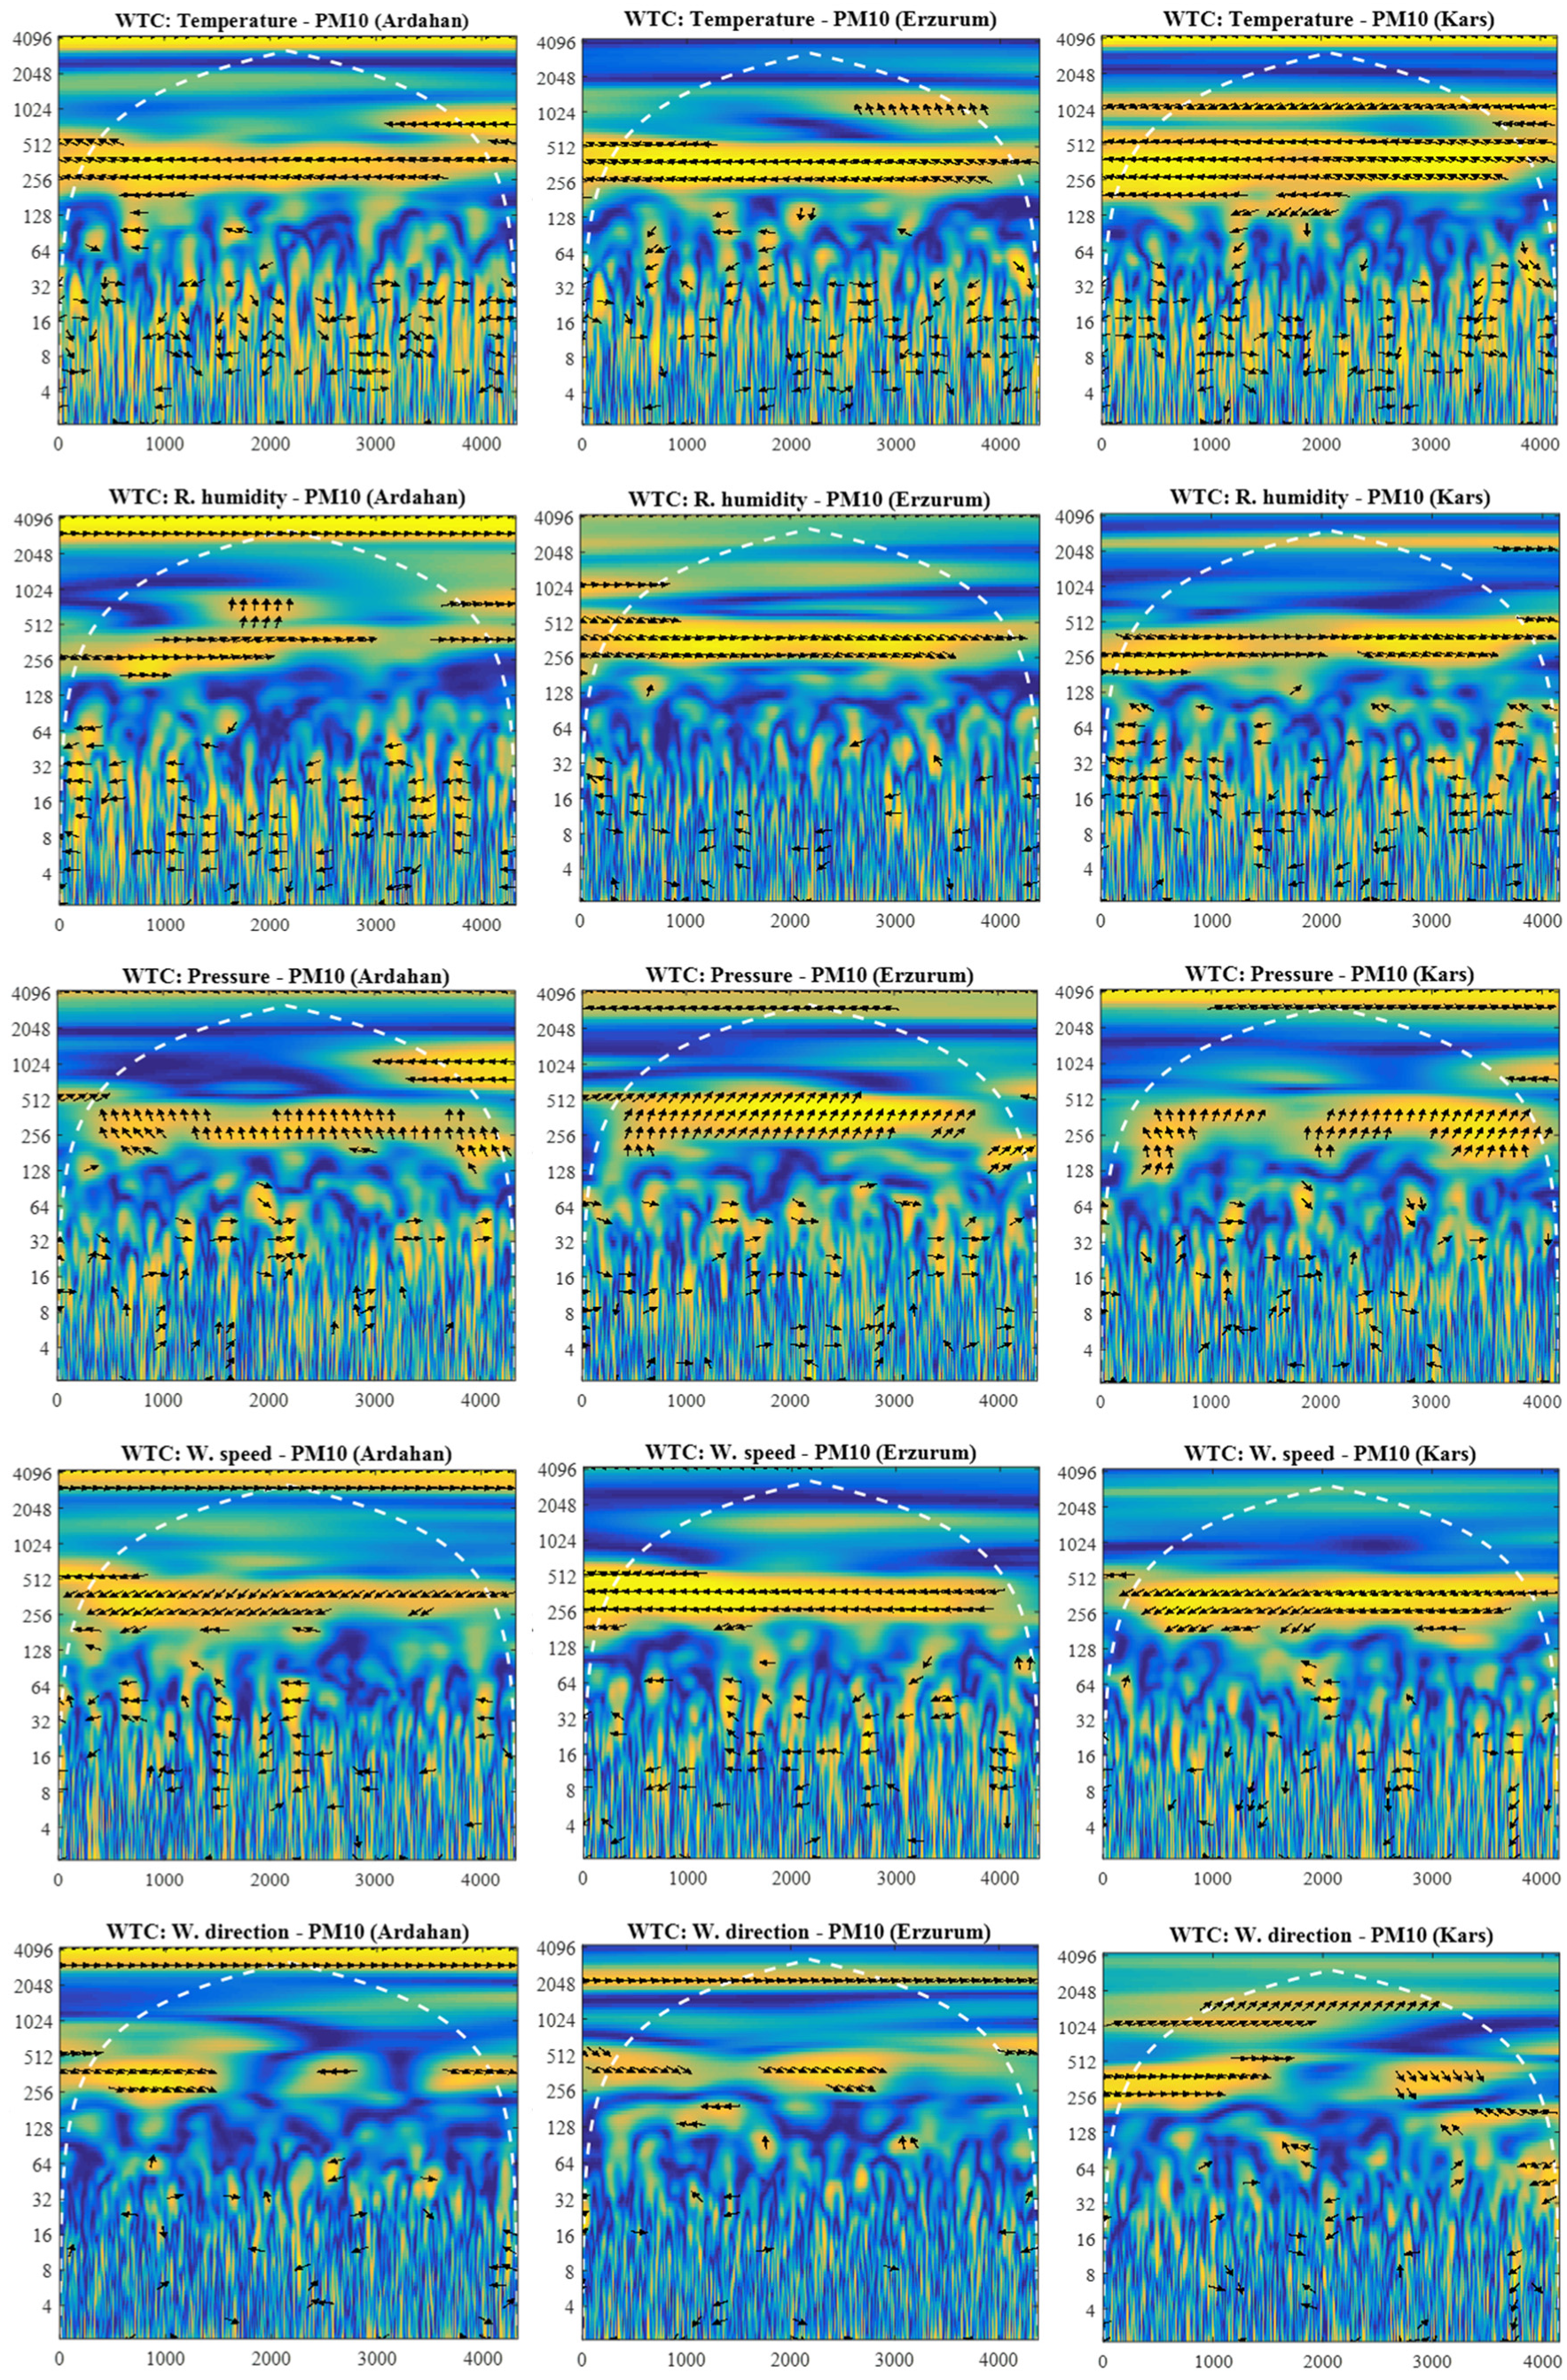
3.3. Wavelet Coherence Analysis

In this part of the study, the correlations between PM10 and meteorological parameters (temperature, humidity, pressure, wind speed, and direction) for three locations during the period of January 2010–December 2022 were examined using the wavelet coherence method. The WTC approach can show the co-movements between PM10 levels and meteorological parameters at different time periods. The WTC plots between PM10 and each meteorological parameter are presented separately for Ardahan, Erzurum, and Kars in Figure 6. In the plots, the horizontal axes represent the time scale in days and the vertical axes represent the period scale in days. As mentioned before, the phase relationship between the two time series is defined by the directions and orientations of the arrows, and the correlation relationship is defined by the color scale. If the correlation is close to 1, the yellow color is dominant, and if it is close to 0, the blue color is dominant. In addition, the dashed white line called the influence cone forms the boundary between more reliable and less reliable estimates [21,56].
In the WTC graphs, the correlation between meteorological parameters and pollution levels for the entire range from 2010 to 2022 is shown. In Figure 6, there is great similarity between the wavelet coherence plots of the daily mean temperature values and the PM10 levels for the three locations. In the annual wavelet coherence correlations of all three locations, there are strong negative (or out-of-phase) correlations between the temperature and PM10 time series for the period of 256 to 512 days (approximate annual cycle) during the study period. In the diagrams, the downward-pointing arrows (−π/2, 0) to the right in the yellow areas in the 4 to 8, 8 to 16, 16 to 32, and 32 to 64-day bands indicate that the two series are in the same phase (positive correlations), and that X(t) (temperature) leads to Y(t) (PM10 concentration); arrows pointing down to the left (−π, −π/2) indicate that the series is out of phase and that Y(t) leads to X(t). Smaller-scale periods, when the two series are in phase and temperature is positively correlated with the PM10 levels, may indicate summer days. The fact that temperature is negatively correlated with pollution levels on an annual scale is consistent with the fact that PM10 concentrations are lower on summer days and higher on winter days.
Essentially, the most striking result found in the WTC analyses is the existence of 256–512-day cycles between temperature, relative humidity, pressure, wind speed, and PM10 concentrations in almost all plots throughout the study range. On an annual scale, pollution levels exhibit out-of-phase relationships with temperature and wind speed, while they are in phase with relative humidity and pressure. In other words, on an annual scale, there are negative correlations between pollution levels and temperature and wind speed, while there are positive correlations with relative humidity and pressure. These results are quite similar to those found with the Spearman correlation.
For the Ardahan station, there are positive correlations between relative humidity and the PM10 levels in the entire study period, except for the days between 3000 and 3400 (mid-2018 to mid-2019), where relative humidity rates lead to pollution levels in the period 256–512. Traces of strong correlations in the period 512–1024, where pollution levels lead to relative humidity rates between days 1500–2000 (late 2014 to early 2016), are also seen in the wind speed and wind direction WTC plots. Therefore, the relationships in this period may have been strongly affected by the changes in humidity and pollutant rates caused by the winds blowing during those days. The negative correlations observed in the 4–8, 8–16, 16–32, and 32–64-day periods throughout the entire study period at this station may represent the months of May, June, and July, when pollution levels decreased despite relatively increasing humidity rates, as seen in Figure 4. A similar situation is also valid for the Kars station. However, except for the strong positive correlation observed in the 256–512-day band at the Erzurum station, the small-scale correlations are not consistent.
In the WTC graphs drawn between pressure values and pollution levels, strong correlations are observed in the 256–512-day band. These relationships, in phase and with PM10 series leading in the Erzurum and Kars stations, occurred in the form of out-of-phase relationships and with pressure series leading in the Ardahan station. Therefore, it can be said that the increase in pressure values for Erzurum and Kars causes an increase in pollution levels, while for Ardahan, this situation is the opposite. This situation may be due to the stable atmospheric conditions created by the relatively higher-pressure values in Erzurum and Kars than in Ardahan throughout the year. The positive correlations observed in all three locations in the 4–8, 8–16, 16–32, and 32–64 bands can also be evaluated as a result of the stable atmospheric conditions of high pressure, especially in the autumn months (Figure 4).
Negative correlations between wind speed and pollution levels occurred in all three locations, both in the 256–512-day band and in smaller-scale cycles. This is a result that is quite consistent with the fact that wind has a dispersive role in the atmosphere in urban areas. Apart from the positive wind direction–PM10 correlations that occurred in the 256–512-day band in some periods of the examined time period, there are no consistent correlations at smaller scales. This indicates that wind direction will not have a consistent effect on PM10 concentration in the short term, but that the long-term effect is to increase PM10 concentration.
Fattah et al. [17] used wavelet coherence analysis to identify the relationship between the PM2.5 levels and various meteorological factors for South Asian cities from 2016 to 2021 and found similar results to those of this study. They found out-of-phase relationships between the pollution and temperature at the 70–365-day scale for Dhaka and Hanoi, the 4–100-day scale for Lahore, the 64–365-day scale for Mumbai, the 256–365-day scale for Hyderabad, the 64–365-day scale for Chennai, the 240–365-day scale for Kathmandu, and the 64–365-day scale for Kolkata. They reported that there were in-phase relationships between the pollution and humidity at low scales, and out-of-phase relationships at high scales. As a general assessment, the wavelet coherence approach supported other correlation analyses in all cities.
Another study investigating the spatial and temporal changes in PM2.5 in Beijing between 2015 and 2020 by using wavelet coherence indicated that wind speed has a negative correlation with pollution concentration, and therefore has a dilution effect. The researchers also noted that there are long-term positive correlations between pollution levels and pressure, and that air quality will deteriorate during high-pressure periods [20].

4. Conclusions

In this study, Spearman’s rank correlation and the WTC approach were used to measure and show the interdependence of PM10 concentrations and meteorological parameters by using data from three different cities in the Erzurum–Kars Plateau. The strength of the relationship between the PM10 and each parameter was investigated using Spearman’s rank correlation on annual and seasonal scales and WTC analysis on an annual scale. A comparative analysis of each time series was performed before the correlation relationships.
Since there are no industrial sources that could cause higher emission intensity in these cities, emissions increase due to the burning of coal used in the heating season. Assuming that the amount of pollution from anthropogenic emission sources does not change approximately in a particular season and region, seasonal changes in the PM10 levels can be partially attributed to the changes in meteorological conditions. In all three provinces, the increase in the PM10 concentrations is clearly observed as a result of the increase in heating demand, and thus as a result of heating emissions in stable atmospheric conditions dominated by low temperature, precipitation, wind speed, and high humidity in the winter season.
Close relationships are identified between mean the PM10 levels and temperature, relative humidity, wind speed, and pressure for all data sets used. Due to the topography of the plateau where all three locations are located, winds contribute to the transport of pollutants out of urban areas. Spearman’s rank correlation results in all three analyzed stations show that there is a relatively strong linear dependence between PM10 and temperature, relative humidity, wind speed, and pressure, especially on the seasonal scale. However, Spearman’s rank correlation statistics for annual data sets may lead to misleading results unless seasonal statistics are considered. Therefore, alternative potential approaches that can also allow for seasonal or monthly scale evaluations in an analysis to be performed on an annual data set are needed.
In this study, the WTC approach, which was carried out for all three locations, can help to determine the time periods where significant correlations between PM10 and meteorological parameters can be expected, by conducting time–frequency analysis in time series. WTC plots can provide detailed information about both the dynamic behavior and relationships of large time series, especially those containing a large number of data points.
According to the WTC analysis, there are significant consistent annual cycles between the PM10 and temperature, relative humidity, wind speed, and pressure. In annual cycles, the daily PM10 is negatively correlated with daily temperature and wind speed, but positively correlated with daily relative humidity and atmospheric pressure. These results can also be produced by Spearman’s rank correlation, but information about the time period in which this phenomenon occurs cannot be provided. However, the direction and magnitude of the correlation between PM10 and each meteorological parameter can be observed even in monthly periods in WTC plots.
This approach has produced results that should be considered in air quality predictions and the implementation of control measures. It has emphasized once again that in regions where the heating season is long and heating emissions contribute significantly to urban air pollution, similar to the provinces in the study, heating needs should be met by the right options in terms of both public health and climate change adaptation policies.
The results produced by this study are of course limited to the study area and its unique conditions. However, the study has the potential to pave the way for similar studies, especially on other cities with similar geographical and socioeconomic characteristics in the east of Türkiye (or other settlements in geographies with continental climate characteristics), and more comprehensive studies that will model other pollutant emissions, especially SO2 and NOx, spatially and temporally. It is also possible to conduct more specific studies, such as an analysis of consumers’ preferences for meeting their heating needs in small settlements, which is also the subject of this study, and the relationships between these preferences and meteorological parameters, or to conduct more detailed analyses on data sets with more frequent sampling.

Supplementary Materials

The following supporting information can be downloaded at: https://www.mdpi.com/article/10.3390/atmos16030331/s1. Tables S1–S3: Some statistics of the data set for Ardahan, Erzurum, and Kars stations and Shapiro–Wilk normality test results, respectively; Table S4: Classification of PM10 concentration according to the EAQI; Table S5: The values of monthly average of meteorological parameters and 24 h moving PM10 concentrations (μg/m3) between 2010 and 2022; Tables S6–S8: Spearman’s rank correlation coefficients for Ardahan, Erzurum, and Kars stations, respectively; Table S9: Classifications of Spearman’s rank correlation coefficient for the effect size.

Funding

This research received no external funding.

Institutional Review Board Statement

Not applicable.

Informed Consent Statement

Not applicable.

Data Availability Statement

The data are contained within the article or Supplementary Materials.

Acknowledgments

I would like to thank the Turkish State Meteorological Service for sharing the meteorological records of the Ardahan, Erzurum, and Kars stations between 2010 and 2012.

Conflicts of Interest

The authors declare no conflicts of interest.

References

  1. Ostro, B.; Chestnut, L.; Vichit-Vadakan, N.; Laixuthai, A. The Impact of Particulate Matter on Daily Mortality in Bangkok, Thailand. J. Air Waste Manag. Assoc. 1999, 49, 100–107. [Google Scholar] [CrossRef] [PubMed]
  2. Biancofiore, F.; Busilacchio, M.; Verdecchia, M.; Tomassetti, B.; Aruffo, E.; Bianco, S.; Di Tommaso, S.; Colangeli, C.; Rosatelli, G.; Di Carlo, P. Recursive Neural Network Model for Analysis and Forecast of PM10 and PM2.5. Atmos. Pollut. Res. 2017, 8, 652–659. [Google Scholar] [CrossRef]
  3. EU. Official Journal of the European Union; EU: Aberdeen, UK, 2008; pp. 1–44. [Google Scholar]
  4. WHO. WHO Global Air Quality Guidelines: Particulate Matter (PM2.5 and PM10), Ozone, Nitrogen Dioxide, Sulfur Dioxide and Carbon Monoxide; WHO: Geneva, Switzerland, 2021. [Google Scholar]
  5. Marshall, J.D.; Nethery, E.; Brauer, M. Within-Urban Variability in Ambient Air Pollution: Comparison of Estimation Methods. Atmos. Environ. 2008, 42, 1359–1369. [Google Scholar] [CrossRef]
  6. Birinci, E.; Deniz, A.; Özdemir, E.T. The Relationship between PM10 and Meteorological Variables in the Mega City Istanbul. Environ. Monit. Assess. 2023, 195, 304. [Google Scholar] [CrossRef]
  7. Sarigiannis, D.A.; Handakas, E.J.; Kermenidou, M.; Zarkadas, I.; Gotti, A.; Charisiadis, P.; Makris, K.; Manousakas, M.; Eleftheriadis, K.; Karakitsios, S.P. Monitoring of Air Pollution Levels Related to Charilaos Trikoupis Bridge. Sci. Total Environ. 2017, 609, 1451–1463. [Google Scholar] [CrossRef]
  8. Maltare, N.N.; Vahora, S.; Jani, K. Seasonal Analysis of Meteorological Parameters and Air Pollutant Concentrations in Kolkata: An Evaluation of Their Relationship. J. Clean. Prod. 2024, 436, 140514. [Google Scholar] [CrossRef]
  9. Birim, N.G.; Turhan, C.; Atalay, A.S.; Gokcen Akkurt, G. The Influence of Meteorological Parameters on PM10: A Statistical Analysis of an Urban and Rural Environment in Izmir/Türkiye. Atmosphere 2023, 14, 421. [Google Scholar] [CrossRef]
  10. Rahman, M.M.; Shuo, W.; Zhao, W.; Xu, X.; Zhang, W.; Arshad, A. Investigating the Relationship between Air Pollutants and Meteorological Parameters Using Satellite Data over Bangladesh. Remote Sens. 2022, 14, 2757. [Google Scholar] [CrossRef]
  11. Ali-Taleshi, M.S.; Riyahi Bakhtiari, A.; Hopke, P.K. Meteorologically Normalized Spatial and Temporal Variations Investigation Using a Machine Learning-Random Forest Model in Criteria Pollutants across Tehran, Iran. Urban Clim. 2024, 53, 101790. [Google Scholar] [CrossRef]
  12. Yang, J.; Xu, X.; Ma, X.; Wang, Z.; You, Q.; Shan, W.; Yang, Y.; Bo, X.; Yin, C. Application of Machine Learning to Predict Hospital Visits for Respiratory Diseases Using Meteorological and Air Pollution Factors in Linyi, China. Environ. Sci. Pollut. Res. 2023, 30, 88431–88443. [Google Scholar] [CrossRef]
  13. Bai, Y.; Li, Y.; Wang, X.; Xie, J.; Li, C. Air Pollutants Concentrations Forecasting Using Back Propagation Neural Network Based on Wavelet Decomposition with Meteorological Conditions. Atmos. Pollut. Res. 2016, 7, 557–566. [Google Scholar] [CrossRef]
  14. Dotse, S.Q.; Petra, M.I.; Dagar, L.; De Silva, L.C. Application of Computational Intelligence Techniques to Forecast Daily PM10 Exceedances in Brunei Darussalam. Atmos. Pollut. Res. 2018, 9, 358–368. [Google Scholar] [CrossRef]
  15. Li, L.; Qian, J.; Ou, C.Q.; Zhou, Y.X.; Guo, C.; Guo, Y. Spatial and Temporal Analysis of Air Pollution Index and Its Timescale-Dependent Relationship with Meteorological Factors in Guangzhou, China, 2001–2011. Environ. Pollut. 2014, 190, 75–81. [Google Scholar] [CrossRef] [PubMed]
  16. Chi, W.J.; Lin, Y.C. Investigation of the Main PM2.5 Sources and Diffusion Patterns and Corresponding Meteorological Conditions by the Wavelet Analysis Approach. Atmos. Pollut. Res. 2021, 12, 101222. [Google Scholar] [CrossRef]
  17. Fattah, M.A.; Morshed, S.R.; Kafy, A.-A.; Rahaman, Z.A.; Rahman, M.T. Wavelet Coherence Analysis of PM2.5 Variability in Response to Meteorological Changes in South Asian Cities. Atmos. Pollut. Res. 2023, 14, 101737. [Google Scholar] [CrossRef]
  18. Kliengchuay, W.; Worakhunpiset, S.; Limpanont, Y.; Meeyai, A.C.; Tantrakarnapa, K. Influence of the Meteorological Conditions and Some Pollutants on PM10 Concentrations in Lamphun, Thailand. J. Environ. Health Sci. Eng. 2021, 19, 237–249. [Google Scholar] [CrossRef]
  19. Xue, W.; Zhan, Q.; Zhang, Q.; Wu, Z. Spatiotemporal Variations of Particulate and Gaseous Pollutants and Their Relations to Meteorological Parameters: The Case of Xiangyang, China. Int. J. Environ. Res. Public Health 2020, 17, 136. [Google Scholar] [CrossRef]
  20. Liu, N.; Li, S.; Zhang, F. Multi-Scale Spatiotemporal Variations and Drivers of PM2.5 in Beijing-Tianjin-Hebei from 2015 to 2020. Atmosphere 2022, 13, 1993. [Google Scholar] [CrossRef]
  21. Gautam, S.P.; Silwal, A.; Baral, B.; Subedi, S.; Lamichhane, N.; Chapagain, N.P.; Adhikari, B. Influence of the Rainfall and Temperature Oscillation on Air Quality in Kathmandu Valley: The Wavelet Analysis. Environ. Eng. Res. 2023, 28, 220694. [Google Scholar] [CrossRef]
  22. BARLİK, N. Effect of Meteorological Parameters on PM10 Concentrations in Ardahan by Wavelet Coherence Analysis. Celal Bayar Üniversitesi Fen Bilim. Derg. 2020, 17, 43–49. [Google Scholar] [CrossRef]
  23. Ocak, S.; Turalioglu, F.S. Relationship Between Air Pollutants and Some Meteorological Parameters in Erzurum, Turkey. In Global Warming: Engineering Solutions; Dincer, I., Hepbasli, A., Midilli, A., Karakoc, T.H., Eds.; Springer US: Boston, MA, USA, 2010; pp. 485–499. ISBN 978-1-4419-1017-2. [Google Scholar]
  24. Duru, O. Volcano Stratigraphy, Petrology and Geochemistry of The Kars Volcanic Plateau in The North of Çıldır (Ardahan City); İstanbul University Graduate Studies in Sciences: İstanbul, Turkey, 2012. (In Turkish) [Google Scholar]
  25. Keskin, M. Volcano-Stratigraphy and Evolution of Collision-Origin Volcanism in the Erzurum-Kars Plateau in Light of New K/Ar Age Findings, Northeastern Anatolia. MTA 1998, 120, 135–157. (In Turkish) [Google Scholar]
  26. Iyigun, C.; Türkeş, M.; Batmaz, I.; Yozgatligil, C.; Purutçuoǧlu, V.; Koç, E.K.; Öztürk, M.Z. Clustering Current Climate Regions of Turkey by Using a Multivariate Statistical Method. Theor. Appl. Climatol. 2013, 114, 95–106. [Google Scholar] [CrossRef]
  27. Yılmaz, E.; Çiçek, İ. Detailed Köppen-Geiger Climate Regions of Turkey<p>Türkiye’nin Detaylandırılmış Köppen-Geiger Iklim Bölgeleri. J. Hum. Sci. 2018, 15, 225. [Google Scholar] [CrossRef]
  28. TSMS. Extreme Maximum, Minimum and Average Temperatures Measured in Long Period. Available online: https://www.mgm.gov.tr/eng/forecast-cities.aspx (accessed on 14 June 2024).
  29. TURKSTAT. Address Based Population Registration System Results. 2023. Available online: https://data.tuik.gov.tr/Bulten/Index?p=Adrese-Dayali-Nufus-Kayit-Sistemi-Sonuclari-2023-49684 (accessed on 21 July 2024).
  30. MoIT. Socio-Economic Development Ranking of Provinces and Regions SEGE-2017; MoIT: Ankara, Turkey, 2017. (In Turkish)
  31. MoIT. 81 Provinces Industrial Status Reports. Available online: https://www.sanayi.gov.tr/plan-program-raporlar-ve-yayinlar/81-il-sanayi-durum-raporlari (accessed on 21 July 2024).
  32. NAQMN (National Air Quality Monitoring Network). Available online: https://sim.csb.gov.tr/STN/STN_Report/StationDataDownloadNew (accessed on 14 June 2024).
  33. TSMS (Turkish State Meteorological Service). Available online: https://mevbis.mgm.gov.tr/mevbis/ui/index.html#/Login (accessed on 14 June 2024).
  34. Tian, H.; Kong, H.; Wong, C. A Novel Stacking Ensemble Learning Approach for Predicting PM2.5 Levels in Dense Urban Environments Using Meteorological Variables: A Case Study in Macau. Appl. Sci. 2024, 14, 5062. [Google Scholar] [CrossRef]
  35. Liu, Z.; Zhang, R.; Ma, J.; Zhang, W.; Li, L. Analysis and Prediction of the Meteorological Characteristics of Dust Concentrations in Open-Pit Mines. Sustainability 2023, 15, 4837. [Google Scholar] [CrossRef]
  36. Tang, J.; Xin, Y.; Xie, Y.; Wang, W. Analysis of Dry-Wet Changes and the Driving Factors in Mainland China under Climate Change. Water 2023, 15, 2737. [Google Scholar] [CrossRef]
  37. Dowdy, S.; Wearden, S.; Chilko, D. Statistics for Research, 3rd ed.; John Wiley & Sons, Inc.: Hoboken, NJ, USA, 2004; ISBN 0-471-26735-X. [Google Scholar]
  38. Labat, D. Recent Advances in Wavelet Analyses: Part 1. A Review of Concepts. J. Hydrol. 2005, 314, 275–288. [Google Scholar] [CrossRef]
  39. Hussain, A.; Cao, J.; Ali, S.; Ullah, W.; Muhammad, S.; Hussain, I.; Abbas, H.; Hamal, K.; Sharma, S.; Akhtar, M.; et al. Wavelet Coherence of Monsoon and Large-Scale Climate Variabilities with Precipitation in Pakistan. Int. J. Climatol. 2022, 42, 9950–9966. [Google Scholar] [CrossRef]
  40. Mihanović, H.; Orlić, M.; Pasarić, Z. Diurnal Thermocline Oscillations Driven by Tidal Flow around an Island in the Middle Adriatic. J. Mar. Syst. 2009, 78, S157–S168. [Google Scholar] [CrossRef]
  41. Farhan Bashir, M.; Benghoul, M.; Numan, U.; Shakoor, A.; Komal, B.; Adnan Bashir, M.; Bashir, M.; Tan, D. Environmental Pollution and COVID-19 Outbreak: Insights from Germany. Air Qual. Atmos. Health 2020, 13, 1385–1394. [Google Scholar] [CrossRef]
  42. Grinsted, A.; Moore, J.C.; Jevrejeva, S. Nonlinear Processes in Geophysics Application of the Cross Wavelet Transform and Wavelet Coherence to Geophysical Time Series. Nonlinear Process. Geophys. 2004, 11, 561–566. [Google Scholar] [CrossRef]
  43. Torrence, C.; Compo, G.P. A Practical Guide to Wavelet Analysis. Bull. Am. Meteorol. Soc. 1998, 79, 61–78. [Google Scholar] [CrossRef]
  44. Avdakovic, S.; Ademovic, A.; Nuhanovic, A. Correlation between Air Temperature and Electricity Demand by Linear Regression and Wavelet Coherence Approach: UK, Slovakia and Bosnia and Herzegovina Case Study. Arch. Electr. Eng. 2013, 62, 521–532. [Google Scholar] [CrossRef]
  45. Nie, Y.; Chen, P.; Zhang, T.; Wang, E. Impacts of International Oil Price Fluctuations on China’s PM2.5 Concentrations: A Wavelet Analysis. Econ. Res. Istraz. 2019, 33, 2488–2508. [Google Scholar] [CrossRef]
  46. Aguiar-Conraria, L.; Azevedo, N.; Soares, M.J. Using Wavelets to Decompose the Time-Frequency Effects of Monetary Policy. Phys. A Stat. Mech. Its Appl. 2008, 387, 2863–2878. [Google Scholar] [CrossRef]
  47. Mott, R.; Vionnet, V.; Grünewald, T. The Seasonal Snow Cover Dynamics: Review on Wind-Driven Coupling Processes. Front. Earth Sci. 2018, 6, 197. [Google Scholar] [CrossRef]
  48. Unal, Y.S.; Toros, H.; Deniz, A.; Incecik, S. Influence of Meteorological Factors and Emission Sources on Spatial and Temporal Variations of PM10 Concentrations in Istanbul Metropolitan Area. Atmos. Environ. 2011, 45, 5504–5513. [Google Scholar] [CrossRef]
  49. Meng, Y.; Sun, W. Relationship between the Formation of PM2.5and Meteorological Factors in Northern China: The Periodic Characteristics of Wavelet Analysis. Adv. Meteorol. 2021, 2021, 9723676. [Google Scholar] [CrossRef]
  50. King, A.P.; Eckersley, R.J. Statistics for Biomedical Engineers and Scientists: How to Visualize and Analyze Data; Elsevier: Amsterdam, The Netherlands, 2019; pp. 1–249. [Google Scholar] [CrossRef]
  51. Barmpadimos, I.; Hueglin, C.; Keller, J.; Henne, S.; Prévôt, A.S.H. Influence of Meteorology on PM10 Trends and Variability in Switzerland from 1991 to 2008. Atmos. Chem. Phys. 2011, 11, 1813–1835. [Google Scholar] [CrossRef]
  52. Baltaci, H.; Akkoyunlu, B.O.; Arslan, H.; Yetemen, O.; Ozdemir, E.T. The Influence of Meteorological Conditions and Atmospheric Circulation Types on PM10 Levels in Western Turkey. Environ. Monit. Assess. 2019, 191, 466. [Google Scholar] [CrossRef]
  53. Saxena, P.; Sonwani, S.; Srivastava, A.; Jain, M.; Srivastava, A.; Bharti, A.; Rangra, D.; Mongia, N.; Tejan, S.; Bhardwaj, S. Impact of Crop Residue Burning in Haryana on the Air Quality of Delhi, India. Heliyon 2021, 7, e06973. [Google Scholar] [CrossRef] [PubMed]
  54. Tiwari, S.; Hopke, P.K.; Pipal, A.S.; Srivastava, A.K.; Bisht, D.S.; Tiwari, S.; Singh, A.K.; Soni, V.K.; Attri, S.D. Intra-Urban Variability of Particulate Matter (PM2.5 and PM10) and Its Relationship with Optical Properties of Aerosols over Delhi, India. Atmos. Res. 2015, 166, 223–232. [Google Scholar] [CrossRef]
  55. Zateroglu, M.T. Forecasting Particulate Matter Concentrations by Combining Statistical Models. J. King Saud Univ.-Sci. 2024, 36, 103090. [Google Scholar] [CrossRef]
  56. Sun, Y.; Aishan, T.; Halik, Ü.; Betz, F.; Rezhake, R. Assessment of Air Quality before and during the COVID-19 and Its Potential Health Impacts in an Arid Oasis City: Urumqi, China. Stoch. Environ. Res. Risk Assess. 2023, 37, 1265–1279. [Google Scholar] [CrossRef]
Figure 1. The geographical location of the study area.
Atmosphere 16 00331 g001
Figure 2. Time series of daily mean pressure (hPa), wind speed (m/s), relative humidity (%), temperature (°C), and PM10 concentrations (µg/m3) for each station during the period 2010–2022.
Atmosphere 16 00331 g002aAtmosphere 16 00331 g002b
Figure 3. Annual and seasonal wind rose diagrams for the period 2010–2022.
Atmosphere 16 00331 g003
Figure 4. Monthly average PM10 concentrations, temperature, relative humidity, pressure, and wind speed distributions in the period 2010–2022.
Atmosphere 16 00331 g004
Figure 5. Heatmap plot of Spearman’s rank correlation coefficients between annual and seasonal PM10 concentrations and meteorological factors.
Atmosphere 16 00331 g005
Figure 6. WTC plots between the meteorological parameters and PM10 levels from 2010 to 2022. In the graphs, the x-axis indicates time (days) and the y-axis indicates period (days).
Atmosphere 16 00331 g006
Table 1. Details of the cities studied.
City/StationArea (km2)Altitude of City Center Relative to Sea Level (m)Coordinates
Longitude (°, E)Latitude (°, N)
Ardahan4934187042.7041.11
Erzurum25,006189041.3039.92
Kars10,193176843.0940.61
Table 2. Descriptive statistics on the daily average PM10 values and the meteorological factors for the period 2010–2022.
Mean ± SDMinMaxMean ± SDMinMax
Ardahan
WinterSpring
Temperature−6.91 ± 5.97−25.16.14.91 ± 5.97−17.818.6
R. humidity74.96 ± 8.0334.595.065.28 ± 10.9824.592.3
Pressure817.6 ± 5.3801.1830.2816.8 ± 3.9800.5828.1
Wind speed0.88 ± 0.55 (NNE)0.03.61.38 ± 0.49 (NW)0.43.3
PM1073.35 ± 62.443.17371.235.54 ± 6.283.83276.8
SummerAutumn
Temperature16.24 ± 2.757.923.56.90 ± 31.78−1720.5
R. humidity64.18 ± 9.1529.085.366.47 ± 11.4624.493.4
Pressure818.6 ± 2.5809.0825.1821.1 ± 3.3808.5830.6
Wind speed1.25 ± 0.38 (NE)0.53.630.98 ± 0.43 (N)0.23.7
PM1029.37 ± 19.313.21152.139.87 ± 31.782.36208.8
Erzurum
WinterSpring
Temperature−7.07 ± 6.67−28.85.75.72 ± 6.03−16.118.0
R. humidity82.96 ± 7.2952.598.568.34 ± 12.2231.297.4
Pressure823.7 ± 5.3805.8837.4822.5 ± 3.8806.9833.9
Wind speed2.19 ± 1.56 (E)0.09.63.29 ± 1.33 (WSW)0.48.3
PM1076.89 ± 57.855.63465.637.25 ± 30.374.49324.5
SummerAutumn
Temperature18.64 ± 3.239.026.17.85 ± 6.68−16.923.6
R. humidity51.66 ± 11.7725.486.962.86 ± 15.1325.996.4
Pressure822.7 ± 2.3814.5829.8826.2 ± 3.1814.7835.1
Wind speed3.61 ± 1.31 (ENE)0.47.72.76 ± 1.43 (E)0.010.9
PM1034.72 ± 20.173.53279.943.79 ± 28.351.89189.9
Kars
WinterSpring
Temperature−6.33 ± 5.42−29.95.75.70 ± 5.83−13.918.9
R. humidity75.77 ± 9.0644.397.763.11 ± 12.4930.894.9
Pressure821.9 ± 5.2805.0834.0820.9 ± 4.0804.8832.0
Wind speed1.68 ± 0.88 (S)0.37.82.49 ± 0.99 (S)0.56.9
PM1072.59 ± 37.848.28321.152.28 ± 27.297.61160.2
SummerAutumn
Temperature17.79 ± 2.999.225.68.03 ± 6.80−13.323.6
R. humidity55.58 ± 11.1020.886.361.59 ± 13.9721.095.5
Pressure822.0 ± 2.6812.9829.5824.8 ± 3.3813.0834.7
Wind speed2.36 ± 0.61 (NNE)0.94.71.86 ± 0.73 (NNE)0.78.9
PM1034.80 ± 16.708.47140.248.57 ± 27.726.25220.2
Table 3. Spearman’s rank correlation coefficients.
StationPeriodTemperatureR. HumidityPressureWind D.Wind S.
ArdahanAnnual (2010–2022)−0.310.030.110.05−0.22
Winter−0.470.190.230.09−0.36
Spring-−0.130.180.09-
Summer0.32−0.32-−0.140.23
Autumn−0.16−0.260.08-−0.12
ErzurumAnnual (2010–2022)−0.310.150.30−0.03−0.44
Winter−0.49-0.45−0.10−0.60
Spring-−0.100.24−0.10−0.23
Summer0.39−0.350.120.09-
Autumn−0.14−0.070.31-−0.45
KarsAnnual (2010–2022)−0.390.070.210.06−0.41
Winter−0.52-0.37−0.21−0.54
Spring-−0.340.190.10-
Summer0.55−0.480.130.110.09
Autumn−0.23−0.160.19-−0.41
Disclaimer/Publisher’s Note: The statements, opinions and data contained in all publications are solely those of the individual author(s) and contributor(s) and not of MDPI and/or the editor(s). MDPI and/or the editor(s) disclaim responsibility for any injury to people or property resulting from any ideas, methods, instructions or products referred to in the content.

